Sulfur isotope ratios in the Large Magellanic Cloud
Abstract
Context. Sulfur isotope ratios have emerged as a promising tool for tracing stellar nucleosynthesis, quantifying stellar populations, and investigating the chemical evolution of galaxies. While they are extensively studied in the context of the Milky Way, they still remain largely unexplored in extragalactic environments.
Aims. We focus on investigating the sulfur isotope ratios in the Large Magellanic Cloud (LMC) to gain insights into sulfur enrichment in this nearby system and to establish benchmarks for such ratios in metal-poor galaxies.
Methods. We conducted pointed observations of CS and its isotopologues toward N113, one of the most prominent star-formation regions in the LMC, utilizing the Atacama Pathfinder EXperiment 12 m telescope.
Results. We present the first robust detection of C33S in the LMC by successfully identifying two C33S transitions on a large scale of 5 pc. Our measurements result in an accurate determination of the 34S/33S isotope ratio, which is 2.00.2. Our comparative analysis indicates that the 32S/33S and 34S/33S isotope ratios are about a factor of two lower in the LMC than in the Milky Way.
Conclusions. Our findings suggest that the low 34S/33S isotope ratio in the LMC can be attributed to a combination of the age effect, low metallicity, and star formation history.
Key Words.:
ISM: clouds — radio lines: ISM — ISM: individual object (N113) — ISM: molecules1 Introduction
Isotope abundance ratios provide salient information for tracing stellar nucleosynthesis, evaluating stellar ejecta, quantifying stellar populations, constraining chemical evolution, and unraveling the history of chemical enrichment in the Universe (e.g., Wilson & Rood 1994; Zhang et al. 2018). While carbon, nitrogen, and oxygen isotopes are primarily synthesized in the CNO cycles and helium burning processes (e.g., Wilson & Rood 1994; Romano 2022), sulfur isotopes provide unique insights into the chemical enrichment by oxygen-burning, neon-burning, and s-process nucleosynthesis. Core-collapse supernovae, Type Ia supernovae, novae, and asymptotic giant branch (AGB) stars are the key astrophysical sources contributing to the production of sulfur isotopes (e.g., Wilson & Matteucci 1992; Wilson & Rood 1994; José & Hernanz 1998; Kobayashi et al. 2020). Therefore, sulfur isotopes hold immense potential to fill gaps in our understanding of stellar nucleosynthesis and the chemical evolution of galaxies.
Sulfur, with its four stable isotopes, 32S, 34S, 33S, and 36S, exhibits abundance ratios of 95.02:4.21:0.75:0.02 in the Solar System (Anders & Grevesse 1989; Lodders 2003). Carbon monosulfide (12C32S, hereafter CS) is the most abundant sulfur-bearing molecule in the interstellar medium (ISM). Extensive observations of its isotopologues C32S, C34S, C33S, and C36S have provided sulfur isotope ratios across the Milky Way (e.g., Chin et al. 1996; Yu et al. 2020; Humire et al. 2020; Yan et al. 2023). Moreover, the main isotopologue, CS, is found to be also ubiquitous in external galaxies (e.g., Henkel & Bally 1985; Paglione et al. 1995; Wang et al. 2009, 2011; Zhang et al. 2014). In contrast, its rare isotopologues are scarcely detected beyond the Milky Way. So far, extragalactic C34S has been detected in emission only in the Large Magellanic Cloud (LMC), NGC 4945, NGC 253, M82, and likely the strongly lensed galaxy, APM 08279+5255 at a redshift, , of 3.911 (Mauersberger & Henkel 1989; Wang et al. 2004; Martín et al. 2006; Wang et al. 2009; Shimonishi et al. 2020; Martín et al. 2021; Yang et al. 2023), while C33S has been identified solely in the LMC, the Small Magellanic Cloud (SMC), and NGC 253 (Shimonishi et al. 2018, 2020; Martín et al. 2021). In addition, absorption from C34S (and CS) was also detected toward the lensing galaxies of the intermediate redshift, , namely: gravitational lens systems B0218+357 and PKS 1830211 at and 0.89, respectively, whose strongly magnified continuum background sources afford sensitive measurements of both species (Muller et al. 2006; Wallström et al. 2016). Additionally, C36S remains undetected outside the Milky Way. Therefore, sulfur isotope ratios in extragalactic environments remain largely unexplored.
At a distance of 50 kpc (e.g., Pietrzyński et al. 2013), the LMC is one of the closest metal-poor galaxies with a metallicity of 0.3–0.5 (Westerlund 1997). Based on observations of the UV spectra of HII regions, it has been found that the carbon, nitrogen, oxygen, and sulfur element abundances in the LMC are a factor of about 6, 10, 3, and 2 lower than in the solar neighborhood (e.g., Dufour et al. 1982; Nishimura et al. 2016), respectively. Given these data and its proximity, the LMC is the ideal target for a first step to investigate the isotope ratios in metal-poor galaxies. Sulfur isotopic ratios have been investigated in two hot cores, ST11 and ST16, in the LMC (Shimonishi et al. 2020). However, it is important to note that these ratios were determined with a certain degree of uncertainty, which raises questions about their similarity to the Galactic values as determined by Yan et al. (2023). In addition, whether these ratios observed on the small scale of 0.1 pc can be representative of the entire LMC or not remains uncertain. Measuring these ratios on larger spatial scales in different sources can offer valuable insights to address this question.
N113 is a prominent massive star-formation region and one of the most prolific sources of molecular line emission in the LMC (Chin et al. 1997; Heikkila et al. 1998; Wang et al. 2009; Paron et al. 2014; Nishimura et al. 2016). Furthermore, N113 hosts the most intense H2O maser in the Magellanic Clouds (Ellingsen et al. 2010), one 1665 MHz OH maser (Brooks & Whiteoak 1997), both signs of ongoing star formation and several young stellar objects (e.g., Gruendl & Chu 2009; Sewiło et al. 2010; Carlson et al. 2012). Given these distinctive properties coupled with the pronounced intensities of its spectral lines, N113 presents itself as an exceptional candidate for the pursuit of rare isotopologues of molecules. Wang et al. (2009) reported a tentative detection of C33S (3-2) toward N113 on a large scale, but its velocity centroid of 238.380.53 km s-1 significantly deviates from the value of the corresponding C34S and CS lines, and km s-1, respectively (along with those of a plethora of lines from other molecules), which casts doubt on its reliability. Therefore, we performed dedicated observations of CS and its isotopologues toward N113 to shed light on sulfur isotope ratios on a linear scale of 5 pc in low-metallicity galaxies.
2 Observations and data reduction
In the months of April through June 2023 (project code: M9514C_111), pointed observations of N113 were carried out using the Atacama Pathfinder EXperiment 12 meter submillimeter telescope (APEX; Güsten et al. 2006). The nFLASH230111https://www.apex-telescope.org/ns/nflash/ and SEPIA180222https://www.apex-telescope.org/ns/instruments/sepia/sepia180/ receivers (Belitsky et al. 2018a, b) were employed to observe the and transitions of CS and its isotopologues, respectively. The nFLASH230 and SEPIA180 frequency setups offered instantaneous intermediate frequency (IF) bandwidths of 16 GHz and 8 GHz, respectively. The backend used for data processing was an evolved version of the fast Fourier transform spectrometers (FFTSs; Klein et al. 2012), which covered the above-mentioned IF bandwidth with overlapping 4 GHz wide modules with 65,536 channels each, resulting in a channel width of 61 kHz. The receivers were tuned to the frequencies of 194.5, 216.1, 242, and 250 GHz in the lower sideband to observe the target lines listed in Table 1.
The observations were performed in the position-switching mode using the APECS software (Muders et al. 2006). The telescope was pointed toward (, )= (05h13m17.s40, 69∘22′22.″0), the position of the molecular clump with the strongest HCN and HCO+ () emission in N113 identified by Seale et al. (2012, their clump 4) which is located at an offset of (12″,+13″) relative to the pointing position in Wang et al. (2009). The off position was (, )=(05h14m21.s127, 69∘23′33.″99). Calibration was carried out approximately every five minutes. System temperatures ranged from 83 to 355 K on a scale. Based on measurements of planets333http://www.apex-telescope.org/telescope/efficiency/, the main beam efficiencies of 86% and 81% were utilized for the =4–3 and =5–4 transitions, respectively. These efficiencies were used to convert the intensity scale to main beam brightness temperatures for the observed transitions. The half-power beam widths (HPBWs) for the observed transitions are listed in Table 1.
The data reduction was carried out using the GILDAS software444https://www.iram.fr/IRAMFR/GILDAS/ (Pety 2005). A linear baseline was subtracted from the spectra for subsequent analysis.
| line | Frequency | ||||||
|---|---|---|---|---|---|---|---|
| (GHz) | (″) | (km s-1) | (mK) | (km s-1) | (mK km s-1) | (cm-2) | |
| (1) | (2) | (3) | (4) | (5) | (6) | (7) | (8) |
| CS | 195.9542109(16) | 30 | 234.50.1 | 448.813.5 | 4.710.02 | 22518 | (1.40.1) |
| C34S | 192.8184566(12) | 31 | 234.30.1 | 33.43.6 | 4.680.34 | 16710 | (1.10.1) |
| C33S | 194.3365623(3) | 30 | 234.30.2 | 15.51.9 | 3.830.68 | 8511 | (5.30.8) |
| CS | 244.9355565(28) | 24 | 234.50.1 | 410.117.9 | 4.840.04 | 211313 | (1.80.3) |
| C34S | 241.0160892(7) | 25 | 234.40.1 | 27.81.2 | 4.220.21 | 1256 | (1.10.2) |
| C33S | 242.9136103(3) | 24 | 234.50.3 | 8.91.4 | 3.520.66 | 3611 | (3.01.1) |
| C36S | 237.5258421(9) | 25 | … | 5.3 | … | 26 | 2.2 |
| 13CS a𝑎aa𝑎aTentative detection | 231.2206852(35) | 26 | 234.81.0 | 9.02.6 | 5.712.97 | 5521 | (4.72.0) |
| 13C34S | 227.3005058(35) | 26 | … | 13.6 | … | 69 | 5.7 |
3 Results
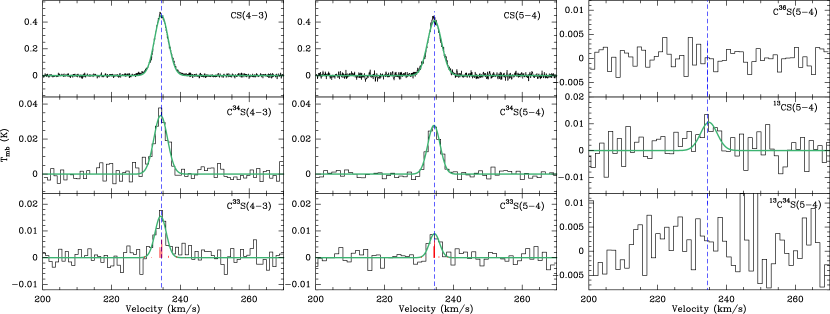
In Fig. 1, we present the spectra of CS and its isotopologues observed toward N113. Using 3 detection criteria, our APEX observations have led to the successful detection of the CS (4-3), C34S (4-3), C33S (4-3), CS (5-4), C34S (5-4), and C33S (5-4) lines. As the detected spectra exhibit approximately Gaussian profiles, we adopted a single Gaussian component for fitting the observed spectra, and the fitted values are given in Table 1. Due to the nonzero nuclear spin of 33S, C33S transitions have hyperfine structure (HFS), which is indicated by the red vertical lines in Fig. 1. Neglecting these HFS lines can potentially bias the 32S/33S and 34S/33S isotope ratios (Yan et al. 2023). To address this concern, we integrated over the velocity range of 225–245 km s-1, encompassing all HFS lines of C33S.
Our observations also led to the tentative detection of 13CS (5-4) with a signal-to-noise ratio of 2.6 in its integrated intensity. C36S (5-4) and 13C34S (5-4) were also observed, but their intensities are too weak to achieve detection by our observations. Hence, assuming similar line shapes, only 3 upper limits are presented for these two transitions in Table 1.
The measured velocity centroids and FWHM line widths of detected transitions of CS and its rare isotopologues are consistent with each other within the 3 uncertainties. The simultaneous detection of two C33S transitions at a consistent velocity secures our robust discovery of C33S in N113, which represents the first detection of C33S on a scale of 5 pc in a low-metallicity galaxy. To our knowledge, the LMC is the third extragalactic system with C33S detection, after the SMC and NGC 253 (Shimonishi et al. 2018; Martín et al. 2021).
In the optically thin regime, the excitation temperature can be estimated from the line ratio between the =4–3 and =5–4 transitions of the same molecule under the assumption of local thermodynamic equilibrium (LTE). Employing C34S and assuming a source size of 40″ (Wang et al. 2009), we derived an excitation temperature of 13.11.2 K. A similar excitation temperature of 10.32.5 K is obtained using the two C33S transitions. Because the C34S lines have higher signal-to-noise ratios, an excitation temperature of 13.11.2 K was adopted for all the CS isotopologues in this study.
We also note that the excitation temperatures of the two CS transitions could be slightly different from those of C34S and C33S transitions. To better ascertain the excitation temperature of CS transitions, we ran the non-LTE RADEX666https://var.sron.nl/radex/radex.php code (van der Tak et al. 2007), where the molecular data of CS are directly taken from the Leiden Atomic and Molecular Database (LAMDA; Schöier et al. 2005) and the ortho-to-para ratio of H2 is assumed to be 0.25 (Neufeld et al. 2006). Based on previous studies (see Table 3 in Tang et al. 2017), an H2 number density of 9 cm-3 and a kinetic temperature of 50 K are fixed for N113 in our calculations. Assuming a specific CS column density range from 1 cm-2 (km s-1)-1 to 1 cm-2 (km s-1)-1, we find that the excitation temperatures vary within 7.4-14.2 K and 8.4-11.2 K for CS (4-3) and CS (5–4), respectively. Based on the modeling results, we also found that the excitation temperatures of different CS rotational transitions vary by less than 3 K (i.e., 30%). Assuming that CS, C34S, and C33S share identical collisional rates, we estimate their excitation temperatures by adopting specific column densities 3 cm-2 (km s-1)-1, 2 cm-2 (km s-1)-1, and 1 cm-2 (km s-1)-1 (see Table 1). Their excitation temperatures are converging to 7.4 K for the =4-3 transitions and 8.4 K for the =5-4 transitions, which suggests that molecular excitation should be similar for different CS isotopologues.
Assuming a source size of 40″ (Wang et al. 2009) and an excitation temperature of 13.1 K, we obtain peak optical depths of 0.08 for both CS (4-3) and CS (5-4). If we consider a relatively low excitation temperature of 5 K, the peak optical depths become 0.73 and 0.70 for CS (4-3) and CS (5-4), respectively. On the other hand, the peak intensity ratios between C32S and C34S are 13.41.6 and 14.80.9 for the =4–3 and =5–4 transitions, respectively. Assuming a 32S/34S isotope ratio of 15 in the LMC (Wang et al. 2009), the peak intensity ratios indicate peak optical depths of 0.5 for both CS (4-3) and CS (5-4). Similarly, taking 13CS (5-4) into account and adopting a 12C/13C isotopic ratio of 50 (e.g., Chin et al. 1999; Heikkilä et al. 1999; Wang et al. 2009) leads to a peak optical depth of 0.3 for CS (5–4). These facts suggest that the two CS transitions are likely to have low peak optical depths of 0.7. Given that C34S and C33S are much less abundant than the main isotopologue by a factor of 10 (see discussions below), the C34S and C33S lines are undoubtedly optically thin.
Under the assumption that all observed transitions are optically thin, we can estimate the LTE column densities of all the CS isotopologues with Eq. (80) from Mangum & Shirley (2015). The derived column densities are shown in Table 1, where the associated errors are estimated using a Monte Carlo analysis with 10000 random samples. We also note that if the peak optical depths of the two measured CS transitions were as high as 0.7 (see discussions above), the CS column densities in Table 1 would be underestimated by about 40%.
Sulfur isotope ratios in the LMC can thus be determined from the column density ratios of pairs of CS isotopologues based on data for the same transitions. A weighted mean value of ratios derived from two transitions is then adopted. All the derived sulfur isotope ratios and lower limits are summarized in Table 2 together with values derived in a variety of other Galactic environments. Despite the uncertain optical depths of the two CS transitions, these isotope ratios are the most reliable values for the LMC achieved to date. We note that the newly refined 34S/33S isotope ratio of 2.00.3 strongly contradicts the previously reported lower limit of 6 for 34S/33S (see Table 8 in Wang et al. 2009). The ratio is consistent with the ratios observed in ST11 and ST16 on a small scale of 0.1 pc within their large uncertainties (Shimonishi et al. 2020), whereas our measurements achieve a significantly higher degree of precision. In contrast, our 32S/34S isotope ratio of 15.00.6 appears to be in line with previously estimated values.
| LMC | The Milky Way | Starburst | |||||||||
| ratio | N113 a𝑎aa𝑎aThis work; | ST11b𝑏bb𝑏bShimonishi et al. (2020); | ST16b𝑏bb𝑏bShimonishi et al. (2020); | CMZc𝑐cc𝑐cfootnotemark: | Inner diskc𝑐cc𝑐cfootnotemark: | Local ISMc𝑐cc𝑐cfootnotemark: | Outer Galaxyc𝑐cc𝑐cfootnotemark: | Solar Systemd𝑑dd𝑑dfootnotemark: | IRC+10216e𝑒ee𝑒efootnotemark: | NGC 253f𝑓ff𝑓ffootnotemark: | NGC 4945g𝑔gg𝑔gfootnotemark: |
| 32S/34S | 15.00.6 | 143 | 172 | 192 | 184 | 244 | 283 | 22.5 | 21.82.6 | 10 | 13.52.5 |
| 32S/33S | 27.53.5 | 4017 | 535 | 7016 | 8219 | 8821 | 10519 | 127 | 12115 | 5030 | … |
| 32S/36S | 81 | … | … | 884104 | 2382368 | 2752458 | 4150828 | 4748 | 2700600 | … | … |
| 34S/33S | 2.00.3 | 32 | 31 | 4.20.2 | 4.30.4 | 4.20.5 | 4.10.3 | 5.6 | 5.60.3 | 53 | … |
| 34S/36S | 1.3 | … | … | 414 | 12218 | 11116 | 16132 | 200 | 10715 | … | … |
4 Discussion
Table 2 presents a comparison of sulfur isotope ratios determined in the LMC888When, in the following, we refer to “LMC”, we mean specifically the N113 region targeted by us. and different environments in the Milky Way as well as two nearby starburst galaxies, NGC 253 and NGC 4945. This places our measured ratios of 32S to 33S and 34S for the low-metallicity galaxy into context and promises to reveal clues to their origins. The 32S/34S isotope ratio in the LMC appears to be comparable to or slightly lower than different environments in the Milky Way, but higher than those in NGC 4945 (13.52.5, Wang et al. 2004), NGC 253 (10; Martín et al. 2005, 2021), PKS 1830211 (10.50.6; Muller et al. 2006), and B0218+357 (8.1; Wallström et al. 2016). In contrast, our measurements indicate that the 32S/33S and 34S/33S isotope ratios in the LMC are lower than in the Milky Way and likely NGC 253. Even if we increase the CS column densities by 40% (see the discussions in Sect. 3), the C32S/C33S isotope ratio would only increase to 395, which suggests that the lower C32S/C33S isotope ratios in the LMC still hold. On the other side, the 32S/34S isotope ratio derived from CS lines appears to be lower than that obtained from SO lines in NGC 253 (Martín et al. 2021), which indicates that CS transitions in NGC 253 have stronger opacity effects. Considering the uncertainties due to the optical depth effects of the CS transitions, we mainly focus on the 34S/33S isotope ratio and explore various possibilities for an explanation of its origin.
Isotope ratios can be affected by chemical fractionation. In the case of sulfur, 34S can be enriched via 34S++CSS++C34S at low temperatures (Loison et al. 2019). However, N113 is found to have kinetic temperatures of 50 K (Tang et al. 2017, 2021), which indicates that chemical fractionation does not play an important role.
One potential factor influencing sulfur enrichment is the age effect. The 34S/33S isotope ratio would decrease over time, since 33S appears to be more secondary than 34S (see below). The lower 34S/33S isotope ratio of 4.2 in the local ISM compared to the solar value of 5.6 (see Table 2) is most likely a result of such an age effect, considering that the Sun was born about 4.6 Gyr ago (e.g., Bouvier & Wadhwa 2010) in the local ISM, which assembled about 7 Gyr ago (e.g., Chiappini et al. 2001; Sandage et al. 2003). At the Galactocentric distance of 12 kpc in the outer Galaxy, the stellar metallicity decreases to about 0.5 (e.g., Anders et al. 2017), comparable to that of the LMC (e.g., Westerlund 1997). The comparison between these two regions can eliminate metallicity as a primary factor influencing the observed isotopic differences (the metallicity effect will be discussed in the following). The outer Galaxy should be formed 7 Gyr ago, while the LMC was formed 10 Gyr ago (e.g., Harris & Zaritsky 2009). Therefore, our observed lower 34S/33S isotope ratio in the LMC compared to the outer Galaxy can also be interpreted as a result of the age effect because of a longer timescale of sulfur enrichment in the LMC.
The LMC’s low metallicity could provide another explanation. The observed low 14N abundances in the LMC have significant implications for the production of 18O, as 18O is primarily synthesized through 14N+4HeF and subsequent beta decay of 18F (e.g., Clayton 2007). Consequently, the low 14N abundances in the LMC are expected to result in lower stellar yields of 18O, which is in line with the lower 18O/17O ratios in the LMC than in the Milky Way (e.g., Heikkila et al. 1998; Wang et al. 2009). Similarly, the alpha capture pathway from 14N to 18O, 22Ne, 26Mg, 30Si, and, finally, to 34S could potentially cause low 34S/33S ratios. However, the efficiency of such an alpha capture sequence is questionable, as previous studies suggest that most of 34S is predominantly synthesized through oxygen-burning processes (e.g., Woosley & Weaver 1995). The observed similarity between the 18O/17O isotope ratio (1.70.2; Heikkila et al. 1998; Wang et al. 2009) and the 34S/33S isotope ratio (2.00.2; this study) appears to be coincidental, because the fusion of oxygen atoms leading to the formation of sulfur occurs in an environment largely deficient in 18O and 17O (e.g., Woosley & Weaver 1995).
Galactic chemical evolution models suggest that the 34S and 33S yields are dependent on the metallicity and predict that 34S/33S isotope ratio increases with metallicity (see Fig. 31 in Kobayashi et al. 2020). This trend can also explain the low 34S/33S isotope ratio in the LMC. On the other hand, the Milky Way exhibits decreasing metallicity with increasing Galactocentric distance (e.g., Luck & Lambert 2011), which would imply a decreasing gradient of the 34S/33S isotope ratios. However, the 34S/33S isotope ratios in the Milky Way are observed to be nearly homogeneous (Yan et al. 2023). Since the Milky Way is believed to form from the inside out (e.g., Chiappini et al. 2001; Pilkington et al. 2012); this implies an age gradient as a function of Galactocentric distance. As mentioned above, the age effect would cause a decrease of the 34S/33S isotope ratio over time. Thus, the age effect can in principle balance the metallicity dependence of the 34S/33S isotope ratio, giving rise to the nearly homogeneous 34S/33S isotope ratios observed in the Milky Way.
Another possibility might rest on the star formation history. As illustrated by previous studies (e.g., Zhang et al. 2018), the element isotope ratios can be regulated by different stellar populations. Both 33S and 34S are not purely primary isotopes because they can be produced by oxygen burning and explosive nucleosynthesis of massive stars as well as neutron capture by 32S and 33S (e.g., Clayton 2007). Their isotope ratios are thus based on their respective yields from these processes. Previous studies suggest that core-collapse supernovae of massive stars can produce 34S more efficiently than 33S (e.g., Woosley & Weaver 1995; Hughes et al. 2008; Kobayashi et al. 2020). On the other hand, novae originating from low- and intermediate-mass stars can slightly overproduce 33S because of proton captures (e.g., José & Hernanz 1998). Hence, the observed low value can in principle be caused by a larger population of low- and intermediate-mass stars or a smaller population of massive stars. We note however, that the 32S/33S ratio of 28 we determine for the LMC is much lower than the value of 121 that was derived by Mauersberger et al. (2004) for the archetypal carbon-rich AGB object IRC+10216 (also known as CW Leo; see Table 2), which (by definition) is a low-mass star. Their 32S/34S ratios are comparable: 15 (LMC) vs. 22 (IRC+10216). In the former scenario, we would anticipate relatively high nitrogen abundances in the LMC, because 14N is primarily synthesized in the CN cycle of low- and intermediate-mass stars (e.g., Wilson & Rood 1994; Clayton 2007; Romano 2022). However, this scenario contradicts the fact that the LMC exhibits a rather low nitrogen abundance (Dufour et al. 1982; Nishimura et al. 2016), which is typical for low-metallicity galaxies (Guseva et al. 2011). The latter hypothesis seems to conflict with the measured Salpeter-like or top-heavy initial mass function (IMF) in the LMC (e.g., Massey et al. 1995; Banerjee & Kroupa 2012; Schneider et al. 2018) but this contradiction is not definitive. The inconsistency could be attributed to the variable star formation rate in the LMC (e.g., Harris & Zaritsky 2009) and the fact that the measured isotope ratios reflect cumulative sulfur enrichment over time. The measured IMF likely represents massive stars formed only tens of millions of years ago (e.g., Massey et al. 1995), while sulfur enrichment could extend back to the formation of the earliest generation of stars at least several billion years ago. In other words, sulfur isotope ratios can be influenced by potential variations of the IMF as a function of the star formation history. The star formation history of the LMC indicates a quiescent epoch spanning roughly 5–12 Gyr ago when star formation rates were quite low (Harris & Zaritsky 2009). The low number of massive stars during this period resulted in lower production of 34S in the LMC and in N113 in particular. Therefore, the low 34S/33S isotope ratio may also be attributed to the star formation history.
In light of these findings, we propose that the observed low 34S/33S isotope ratio in N113 could be a consequence of the combination of the age effect, low metallicity, and star formation history. We note that our measurements solely provide constraints on the sulfur isotope ratios within N113. The metallicity does not vary much across the LMC (0.3–0.5, e.g., Westerlund 1997; Rolleston et al. 2002), indicating that the ISM is well mixed. This is further supported by the nearly constant 18O/17O isotopic ratio in different regions (Heikkila et al. 1998; Wang et al. 2009) as well as the reasonably consistent 34S/33S isotope ratios observed in N113, ST11, and ST16. Consequently, our measured 34S/33S isotope ratio could conceivably represent a typical value for the LMC. Nevertheless, the degree to which this value faithfully traces the sulfur isotopic ratios prevailing throughout the LMC remains a topic of future studies. To gain a deeper insight into the sulfur enrichment of the whole galaxy, additional measurements of the sulfur isotopic ratios toward different parts of the LMC are mandatory.
5 Summary and conclusions
In this study, we carried out pointed observations toward N113 in the Large Magellanic Cloud (LMC) using the APEX telescope. Our observations have led to the unambiguous detection of the C33S (4-3) and (5–4) lines, providing conclusive evidence of the existence of C33S on a scale of 5 pc in the LMC. Measurements of optically thin tracers allow us to determine the 34S/33S isotope ratio, yielding a value of 2.00.3. This determination represents the most reliable 34S/33S isotope ratio measurement on a cloud scale in a low-metallicity galaxy. Notably, the measured 32S/33S and 34S/33S isotope ratios in the LMC are about a factor of two lower than the corresponding values observed in the Milky Way. We postulate that this discrepancy can be attributed to a combination of the age effect, low metallicity, and star formation history.
ACKNOWLEDGMENTS
The data was collected under the Atacama Pathfinder EXperiment (APEX) project, led by the Max Planck Institute for Radio Astronomy under the umbrella of the ESO La Silla Paranal Observatory. We acknowledge the APEX staff for their assistance with our observations. C.H. acknowledges support by Chinese Academy of Sciences President’s International Fellowship Initiative under grant No. 2023VMA0031. C.-H.R. C. acknowledges support from the Deutsches Zentrum für Luft- und Raumfahrt (DLR) grant NS1 under contract no. 50 OR 2214. X.D.T. acknowledges the support of the Chinese Academy of Sciences (CAS) “Light of West China” Program under grant No. xbzg-zdsys-202212, the Tianshan Talent Program of Xinjiang Uygur Autonomous Region under grant No. 2022TSYCLJ0005, and the Natural Science Foundation of Xinjiang Uygur Autonomous Region under grant No. 2022D01E06. This research has made use of NASA’s Astrophysics Data System. We thank our referee Sergio Martin for his valuable comments that have contributed to the improvement of this paper. We also thank Takashi Shimonishi for his comments on this draft.
References
- Anders & Grevesse (1989) Anders, E. & Grevesse, N. 1989, Geochim. Cosmochim. Acta., 53, 197
- Anders et al. (2017) Anders, F., Chiappini, C., Minchev, I., et al. 2017, A&A, 600, A70
- Banerjee & Kroupa (2012) Banerjee, S. & Kroupa, P. 2012, A&A, 547, A23
- Belitsky et al. (2018a) Belitsky, V., Bylund, M., Desmaris, V., et al. 2018a, A&A, 611, A98
- Belitsky et al. (2018b) Belitsky, V., Lapkin, I., Fredrixon, M., et al. 2018b, A&A, 612, A23
- Bouvier & Wadhwa (2010) Bouvier, A. & Wadhwa, M. 2010, Nature Geoscience, 3, 637
- Brooks & Whiteoak (1997) Brooks, K. J. & Whiteoak, J. B. 1997, MNRAS, 291, 395
- Carlson et al. (2012) Carlson, L. R., Sewiło, M., Meixner, M., Romita, K. A., & Lawton, B. 2012, A&A, 542, A66
- Chiappini et al. (2001) Chiappini, C., Matteucci, F., & Romano, D. 2001, ApJ, 554, 1044
- Chin et al. (1999) Chin, Y.-n., Henkel, C., Langer, N., & Mauersberger, R. 1999, ApJ, 512, L143
- Chin et al. (1996) Chin, Y. N., Henkel, C., Whiteoak, J. B., Langer, N., & Churchwell, E. B. 1996, A&A, 305, 960
- Chin et al. (1997) Chin, Y. N., Henkel, C., Whiteoak, J. B., et al. 1997, A&A, 317, 548
- Clayton (2007) Clayton, D. 2007, Handbook of Isotopes in the Cosmos
- Dufour et al. (1982) Dufour, R. J., Shields, G. A., & Talbot, R. J., J. 1982, ApJ, 252, 461
- Ellingsen et al. (2010) Ellingsen, S. P., Breen, S. L., Caswell, J. L., Quinn, L. J., & Fuller, G. A. 2010, MNRAS, 404, 779
- Endres et al. (2016) Endres, C. P., Schlemmer, S., Schilke, P., Stutzki, J., & Müller, H. S. P. 2016, Journal of Molecular Spectroscopy, 327, 95
- Gruendl & Chu (2009) Gruendl, R. A. & Chu, Y.-H. 2009, ApJS, 184, 172
- Guseva et al. (2011) Guseva, N. G., Izotov, Y. I., Stasińska, G., et al. 2011, A&A, 529, A149
- Güsten et al. (2006) Güsten, R., Nyman, L. Å., Schilke, P., et al. 2006, A&A, 454, L13
- Harris & Zaritsky (2009) Harris, J. & Zaritsky, D. 2009, AJ, 138, 1243
- Heikkila et al. (1998) Heikkila, A., Johansson, L. E. B., & Olofsson, H. 1998, A&A, 332, 493
- Heikkilä et al. (1999) Heikkilä, A., Johansson, L. E. B., & Olofsson, H. 1999, A&A, 344, 817
- Henkel & Bally (1985) Henkel, C. & Bally, J. 1985, A&A, 150, L25
- Hughes et al. (2008) Hughes, G. L., Gibson, B. K., Carigi, L., et al. 2008, MNRAS, 390, 1710
- Humire et al. (2020) Humire, P. K., Thiel, V., Henkel, C., et al. 2020, A&A, 642, A222
- José & Hernanz (1998) José, J. & Hernanz, M. 1998, ApJ, 494, 680
- Klein et al. (2012) Klein, B., Hochgürtel, S., Krämer, I., et al. 2012, A&A, 542, L3
- Kobayashi et al. (2020) Kobayashi, C., Karakas, A. I., & Lugaro, M. 2020, ApJ, 900, 179
- Lodders (2003) Lodders, K. 2003, ApJ, 591, 1220
- Loison et al. (2019) Loison, J.-C., Wakelam, V., Gratier, P., et al. 2019, MNRAS, 485, 5777
- Luck & Lambert (2011) Luck, R. E. & Lambert, D. L. 2011, AJ, 142, 136
- Mangum & Shirley (2015) Mangum, J. G. & Shirley, Y. L. 2015, PASP, 127, 266
- Martín et al. (2021) Martín, S., Mangum, J. G., Harada, N., et al. 2021, A&A, 656, A46
- Martín et al. (2005) Martín, S., Martín-Pintado, J., Mauersberger, R., Henkel, C., & García-Burillo, S. 2005, ApJ, 620, 210
- Martín et al. (2006) Martín, S., Mauersberger, R., Martín-Pintado, J., Henkel, C., & García-Burillo, S. 2006, ApJS, 164, 450
- Massey et al. (1995) Massey, P., Lang, C. C., Degioia-Eastwood, K., & Garmany, C. D. 1995, ApJ, 438, 188
- Mauersberger & Henkel (1989) Mauersberger, R. & Henkel, C. 1989, A&A, 223, 79
- Mauersberger et al. (2004) Mauersberger, R., Ott, U., Henkel, C., Cernicharo, J., & Gallino, R. 2004, A&A, 426, 219
- Muders et al. (2006) Muders, D., Hafok, H., Wyrowski, F., et al. 2006, A&A, 454, L25
- Muller et al. (2006) Muller, S., Guélin, M., Dumke, M., Lucas, R., & Combes, F. 2006, A&A, 458, 417
- Neufeld et al. (2006) Neufeld, D. A., Melnick, G. J., Sonnentrucker, P., et al. 2006, ApJ, 649, 816
- Nishimura et al. (2016) Nishimura, Y., Shimonishi, T., Watanabe, Y., et al. 2016, ApJ, 818, 161
- Paglione et al. (1995) Paglione, T. A. D., Jackson, J. M., Ishizuki, S., & Rieu, N.-Q. 1995, AJ, 109, 1716
- Paron et al. (2014) Paron, S., Ortega, M. E., Cunningham, M., et al. 2014, A&A, 572, A56
- Pety (2005) Pety, J. 2005, in SF2A-2005: Semaine de l’Astrophysique Francaise, ed. F. Casoli, T. Contini, J. M. Hameury, & L. Pagani, 721
- Pietrzyński et al. (2013) Pietrzyński, G., Graczyk, D., Gieren, W., et al. 2013, Nature, 495, 76
- Pilkington et al. (2012) Pilkington, K., Few, C. G., Gibson, B. K., et al. 2012, A&A, 540, A56
- Rolleston et al. (2002) Rolleston, W. R. J., Trundle, C., & Dufton, P. L. 2002, A&A, 396, 53
- Romano (2022) Romano, D. 2022, A&A Rev., 30, 7
- Sandage et al. (2003) Sandage, A., Lubin, L. M., & VandenBerg, D. A. 2003, PASP, 115, 1187
- Schneider et al. (2018) Schneider, F. R. N., Sana, H., Evans, C. J., et al. 2018, Science, 359, 69
- Schöier et al. (2005) Schöier, F. L., van der Tak, F. F. S., van Dishoeck, E. F., & Black, J. H. 2005, A&A, 432, 369
- Seale et al. (2012) Seale, J. P., Looney, L. W., Wong, T., et al. 2012, ApJ, 751, 42
- Sewiło et al. (2010) Sewiło, M., Indebetouw, R., Carlson, L. R., et al. 2010, A&A, 518, L73
- Shimonishi et al. (2020) Shimonishi, T., Das, A., Sakai, N., et al. 2020, ApJ, 891, 164
- Shimonishi et al. (2018) Shimonishi, T., Watanabe, Y., Nishimura, Y., et al. 2018, ApJ, 862, 102
- Tang et al. (2017) Tang, X. D., Henkel, C., Chen, C. H. R., et al. 2017, A&A, 600, A16
- Tang et al. (2021) Tang, X. D., Henkel, C., Menten, K. M., et al. 2021, A&A, 655, A12
- van der Tak et al. (2007) van der Tak, F. F. S., Black, J. H., Schöier, F. L., Jansen, D. J., & van Dishoeck, E. F. 2007, A&A, 468, 627
- Wallström et al. (2016) Wallström, S. H. J., Muller, S., & Guélin, M. 2016, A&A, 595, A96
- Wang et al. (2011) Wang, J., Zhang, Z., & Shi, Y. 2011, MNRAS, 416, L21
- Wang et al. (2009) Wang, M., Chin, Y. N., Henkel, C., Whiteoak, J. B., & Cunningham, M. 2009, ApJ, 690, 580
- Wang et al. (2004) Wang, M., Henkel, C., Chin, Y. N., et al. 2004, A&A, 422, 883
- Westerlund (1997) Westerlund, B. E. 1997, The Magellanic Clouds
- Wilson & Matteucci (1992) Wilson, T. L. & Matteucci, F. 1992, A&A Rev., 4, 1
- Wilson & Rood (1994) Wilson, T. L. & Rood, R. 1994, ARA&A, 32, 191
- Woosley & Weaver (1995) Woosley, S. E. & Weaver, T. A. 1995, ApJS, 101, 181
- Yan et al. (2023) Yan, Y. T., Henkel, C., Kobayashi, C., et al. 2023, A&A, 670, A98
- Yang et al. (2023) Yang, C., Omont, A., Martín, S., et al. 2023, arXiv e-prints, arXiv:2308.07368
- Yu et al. (2020) Yu, H. Z., Zhang, J. S., Henkel, C., et al. 2020, ApJ, 899, 145
- Zhang et al. (2014) Zhang, Z.-Y., Gao, Y., Henkel, C., et al. 2014, ApJ, 784, L31
- Zhang et al. (2018) Zhang, Z.-Y., Romano, D., Ivison, R. J., Papadopoulos, P. P., & Matteucci, F. 2018, Nature, 558, 260