A Comprehensive Survey on Rare Event Prediction
Abstract
Rare event prediction involves identifying and forecasting events with a low probability using machine learning and data analysis. Due to the imbalanced data distributions, where the frequency of common events vastly outweighs that of rare events, it requires using specialized methods within each step of the machine learning pipeline, i.e., from data processing to algorithms to evaluation protocols. Predicting the occurrences of rare events is important for real-world applications, such as Industry 4.0, and is an active research area in statistical and machine learning. This paper comprehensively reviews the current approaches for rare event prediction along four dimensions: rare event data, data processing, algorithmic approaches, and evaluation approaches. Specifically, we consider 73 datasets from different modalities (i.e., numerical, image, text, and audio), four major categories of data processing, five major algorithmic groupings, and two broader evaluation approaches. This paper aims to identify gaps in the current literature and highlight the challenges of predicting rare events. It also suggests potential research directions, which can help guide practitioners and researchers.
Keywords event-prediction rare-events time-series anomaly detection forecasting
1 Introduction
Events are incidents that are associated with specific locations (spatial), time periods (temporal), and contexts (semantics). Rare events are a subset of events that stand out due to their infrequency. The degree of infrequency of rare events is typically influenced by the specific field of application [1, 2]. Rare event learning is considered an NP-hard problem [3], as it requires analyzing a large amount of data to identify rare events, which can be computationally intensive and time-consuming, especially in high-dimensional spaces. The size and complexity of rare event data lead to the challenge of handling this problem, resulting in complicated issues in data mining and machine learning. Imbalanced event datasets exhibit a prevalence of rare occurrences, wherein the quantity of instances associated with one class is significantly lower than the quantity of instances pertaining to the other. These datasets present challenges for learning algorithms since they may result in biased outcomes in downstream tasks such as classification, clustering, forecasting, and simulation. Algorithms necessitate tailoring to effectively address rare events, as these occurrences often give rise to challenges stemming from their uncommon nature.
In real-life, rare events can be observed ubiquitously in various domains, including medical diagnosis, fraud detection, and natural disaster prediction. In any field or area of study, rare events can be regarded as occurrences that possess valuable and meaningful information [4]. Rare events can be weighted by ‘rarity’, a measure of being rare, uncommon, or scarce. Liu and Feng [5] formulate this as the "Curse of Rarity" (CoR). The fundamental idea behind CoR is that the events of interest are exceptionally rare, resulting in limited information in the available data. CoR leads to many underlying issues, including decision-making, modeling, verification, and validation. For instance, detecting rare diseases or medical conditions is challenging but crucial for effective diagnosis and treatment.
Similarly, detecting fraud in financial transactions can help prevent financial losses and ensure the security of transactions. In the case of natural disaster prediction, identifying rare events such as earthquakes or tsunamis can help in effective disaster management and response. In manufacturing, these events lead to unplanned downtime or shutdowns, which are particularly detrimental for industries regarding equipment life and power consumption. Thus, exploring rare events in advance allows industries to implement mitigation procedures to reduce defects so that equipment downtime can be lowered, optimizing energy consumption and ensuring optimization, quality, and safety standards in manufacturing processes.
The significance of rare events resides in their capacity to yield a disproportionate influence, surpassing that of more typical events. For instance, a disease that affects a minor percentage of the population can enormously affect public health. Similarly, large-scale fraudulent activities can result in substantial financial losses for individuals and organizations. Hence, it is evident that rare occurrences require specialized attention and analysis. Therefore, developing effective methodologies and algorithms that can handle the uniqueness and mitigate the biases and limitations inherent in rare events is essential.
The problem of imbalanced datasets and rare events is not new, and researchers have developed several techniques to address this issue. These techniques range from data-level approaches, such as oversampling and undersampling, to algorithm-level approaches, such as cost-sensitive learning and ensemble methods. In recent years, deep learning methods have also been applied to address the problem of rare events.
This survey paper aims to provide a comparative review of the existing literature on rare event prediction. We have developed a taxonomy that summarizes the research on rare event prediction into four categories: rare event data, data processing, algorithmic approaches, and evaluation approaches. Then, we explore the existing literature pertaining to these four categories. The extended review involves the review of each of these four categories with levels of rarity that we introduce, established industries, types of datasets, data modalities, applications, and downstream tasks. Finally, we highlight some open research questions and future directions identified in this area
1.1 The Contributions of this paper
The main contributions of this paper include:
-
1.
Comparatively review the existing literature on rare event prediction in four approaches; rare event data, data processing, algorithmic and evaluation approaches.
-
2.
Analyze the approaches to rare event prediction by examining multiple avenues: dataset types, modalities, and downstream tasks.
-
3.
Identify gaps, challenges, and special concerns in the current research landscape while discussing potential emerging trends in the realm.
1.2 Organization
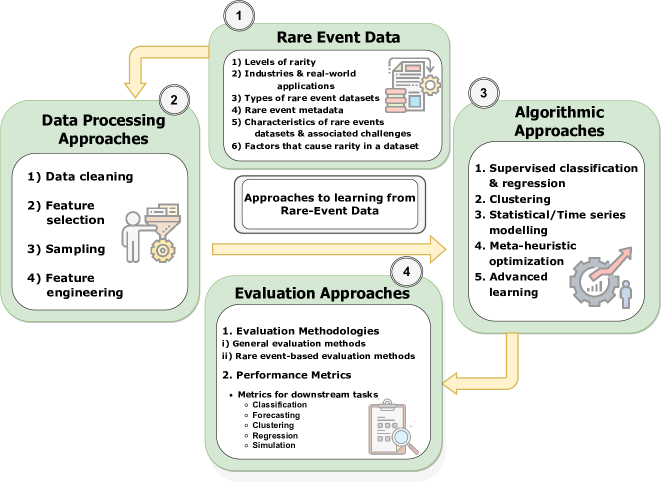
This study distinguishes a four-fold summarized categorization of approaches to learning from imbalanced event data for rare event prediction that have been successfully implemented within related work. As shown in Figure 1, the main groupings include I) Rare event data, II) Data processing approaches, III) Algorithm level techniques, and IV) Evaluation approaches.
2 Rare event data
This section analyzes datasets with rare events. Considering a wide range of datasets from multiple industries and different modalities we first categorize them by the rarity percentage. We then explore real-world applications of the data and examine data acquisition methods. Next, we present an analysis considering types of datasets, metadata, and modality. Finally, we discuss the characteristics and challenges of handling such data and the factors contributing to their rarity.
2.1 Datasets with rare events – Analysis of existing datasets with rare events
2.1.1 Levels of rarity
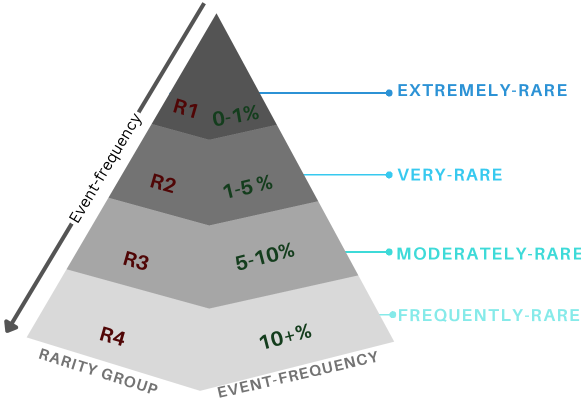
In any domain, the rarity of events is inversely correlated with the maturity of that industry. At the same time, rarity is correlated with event frequency or the probability of occurrence. For better understanding and analysis, we introduce the notion of “levels of rarity", which categorizes rarity into four levels as depicted in Figure 2. These rarity levels will be used throughout all the review sections in this paper.
We have established the boundaries for the levels based on several factors, such as the distribution of data, significant differences in rarity levels, and context. The R1 category comprises datasets with events that have a frequency of 0-1%, which are considered extremely rare. On the other hand, events with a rarity of 1-5% are classified as very rare and fall under the R2 category. The R3 category includes events with a rarity of 5-10%, which are considered moderately rare. Finally, the rest of the events with a frequency greater than 10% belong to the frequently-rare (R4) category. It is apparent that when moving up in levels, the percentage of rarity and the event frequency tend to decrease, necessitating more sophisticated approaches for identifying and analyzing. The datasets in the studies we reviewed utilized diverse data types, including numeric (N), textual (TX), image (I), and audio (A). A special property of these ‘rare event’ datasets is their adherence to the temporal nature (T) of ‘events‘ and adaptation of time-dependent features.
2.1.2 Industries and real-world applications
The different industries that have been identified in this review include eight main sectors: economy, healthcare, transportation, telecommunications, manufacturing, energy, earth science, and others. It should be noted that the primary industries include several application domains that we merged into a general main industry, as shown in Table 1. In Table 1, we have compiled a list of real-world applications of rare events categorized by industry, application domain, and rarity based on the literature. Notably, these applications have predominantly concentrated on use cases such as detection, diagnosis, prediction, and downstream tasks like classification (CF), clustering (CL), forecasting (FT), regression (RG), and simulation (SM).
| Industry | Applications Domains | Examples from literature | |||||||
| Earth Sciences |
|
|
|||||||
| Earth Sciences |
|
|
|||||||
| Manufacturing | Machinery fault diagnosis, Anomaly detection |
|
|||||||
| Telecommunication |
|
|
|||||||
| Transportation |
|
|
|||||||
| Economy | Market trend forecasting, Fraud detection |
|
|||||||
| Healthcare |
|
|
|||||||
| Energy | Energy forecasting | Prediction of when to expect a high KWh cost ([25] –R3) | |||||||
| Others |
|
|
2.1.3 Types of rare events datasets
The study identified four types of rare event datasets: naturally rare event datasets, derived datasets, simulated datasets, and synthetic datasets.
i) Naturally rare event datasets (RE): Naturally rare event datasets refer to datasets that inherently exhibit a low occurrence rate of specific events or phenomena. Table 2 summarizes naturally rare event datasets used in rare event literature. It was noticed that approximately 41% of the naturally rare datasets used fall into the extremely-rare category.
| Sector |
|
Datasets with modality | Papers | |||||
|---|---|---|---|---|---|---|---|---|
| Earth Sciences | 0-1(R1) |
|
[25, 29] | |||||
| 1-5(R2) |
|
|
||||||
| 5-10(R3) |
|
[8, 29] | ||||||
| 10+(R4) |
|
[35, 29] | ||||||
| Manufacturing | 0-1(R1) |
|
|
|||||
| 10+(R4) |
|
[45, 46, 47, 43] | ||||||
| Telecommunication | 0-1(R1) |
|
[51, 3, 52, 53] | |||||
| Transportation | 1-5(R2) |
|
[56, 57, 58] | |||||
| 5-10(R3) |
|
[19, 52, 22] | ||||||
| Economy |
|
|
[20, 21] | |||||
| Healthcare | 0-1(R1) |
|
[65, 67] | |||||
| 1-5(R2) |
|
[4, 65] | ||||||
| 5-10(R3) | Bioassay AID 1608(N) [65] | [65] | ||||||
| 10+(R4) | Wong’s dataset from Canadian(TX) [69] | [23, 69] | ||||||
| Energy | 5-10(R3) |
|
[25] | |||||
| Others | 0-1(R1) | PCD dataset(I, T) [70], | [7] | |||||
| 1-5(R2) | K1b-WebACE(N,T) [71] | [51] | ||||||
| 5-10(R3) | La12-TREC(N,T) | [51] | ||||||
| 10+(R4) |
|
[26, 73] |
∗N-Numeric, TX-Textual, I-Image, A-Audio, T-Time series
Naturally rare event datasets can be sourced from various industries and domains, such as manufacturing, healthcare, earth sciences, and economy. For instance, data on environmental disasters such as oil spills [9] and tsunamis [6] can be gathered using satellite, ariel, or drone imagery via remote sensing technologies, while machine faults and anomalies can be tracked through data collection from sensors attached to different parts of the machines in manufacturing plants [12, 41]. Similarly, sources for predicting rare economic events may include financial market data, economic indicators, government reports, transaction data, consumer behavior data, social media data, and other relevant sources specific to the economic domain [20].
Data collected from such sources can be obtained from public databases. Repositories like University of California Irvine (UCI) [74], Knowledge Extraction based on Evolutionary Learning (KEEL) [75], Kaggle [76], research-specific data storages [11, 41, 16, 77, 55, 78], industry-specific databases [15, 79, 80, 81, 82, 83, 84, 59, 60], Application Programming Interfaces (APIs) [85, 86, 87], social media platforms [63, 61], and news outlets [63, 61] would be such databases. Data extraction from them can involve manually accessing public datasets, querying databases, web scraping, or using web services.
ii) Derived datasets (DE): A derived dataset results from a transformation of an existing dataset that includes a new insight, ‘derived rarity’. For this, the original dataset should ideally possess sufficient information and features related to multiple events of interest and should initially be not rare. The availability of such data enables performing operations, calculations, or algorithms on the raw dataset to transform it into a derived dataset that captures the ‘derived rarity’ aspect [18, 88, 8]. Table 3 summarizes derived datasets used in rare event research in the studied literature. The analysis findings indicate that a substantial portion (34%) of the derived datasets we considered in this review belong to the extremely rare category.
| Sector |
|
Papers | Source Datasets with modality | ||||
|---|---|---|---|---|---|---|---|
| Earth Sciences | 0-1(R1) | [7, 89, 90] |
|
||||
| 1-5(R2) | [90] |
|
|||||
| 5-10(R3) | [28, 89] |
|
|||||
| 10+(R4) | [89, 93] |
|
|||||
| Telecommunication | 0-1(R1) | [94, 51, 95] |
|
||||
| 1-5(R2) | [94] | IEEE 39-bus power system data(N, T) [16] | |||||
| 5-10(R3) | [94] |
|
|||||
| 10+(R4) | [94] |
|
|||||
| Transportation | 0-1(R1) | [88, 18] |
|
||||
| Healthcare | 0-1(R1) | [22] | EEG Seizure Dataset(N, T) | ||||
| 1-5(R2) | [96, 22] |
|
|||||
| 5-10(R3) | [96] | COVID-19(N, T) | |||||
| Energy |
|
[99] | MAGIC Gamma Telescope(N,T) [100] | ||||
| Others | 0-1(R1) | [7] |
|
||||
| 10+(R4) | [103, 8, 7] |
|
∗N-Numeric, TX-Textual, I-Image, A-Audio, T-Time series
| Sector |
|
Papers | Data type | Technique | ||||||
| Earth Sciences | 0-1 (R1) | [10, 29, 106] | Simulated data , N, T |
|
||||||
| 1-5 (R2) | [10, 29] | Simulated data , N, T |
|
|||||||
| 5-10 (R3) |
|
Simulated data , N, T |
|
|||||||
| 10+ (R4) | [10, 29] | Simulated data , N, T |
|
|||||||
|
[108, 109, 110] | Synthetic data, N, T |
|
|||||||
| Others | 0-1 (R1) |
|
|
|
||||||
|
[113, 99] |
|
|
|||||||
| 10 + (R4) | [8] | Synthetic data , N, T | MOA [114] |
∗N-Numeric
iii) Simulated (SI) and Synthetic (SY) datasets: A simulated dataset in the context of rare events is an artificially generated dataset that mimics the characteristics and patterns of real-world rare events. They are typically created based on known models, distributions, or algorithms to replicate the statistical properties and relationships observed in the original data. Simulated datasets can be generated in cases where collecting direct data on rare events is challenging and impractical. They are beneficial for predicting rare events that have not yet occurred or for testing the accuracy of predictive models in a controlled environment [89, 28, 111, 10, 11]. In the studied literature, simulated data has been generated in controlled environments using software like MATLAB, OLGA Dynamic Multiphase Flow Simulator [107], as presented in Table 4.
A synthetic dataset refers to artificially generated data that closely resembles real data but is created without relying on existing data, often to expand the labeled data available for training purposes. In the studied literature, synthetic data has been generated using Signal Fragment Assembler (SFA), Variational Autoencoder (VAE), Data Picker (DP), and Quality Classifier (QC) [108, 109, 110], and frameworks like Massive online analysis (MOA) [114, 8] as presented in Table 4. While most studies focus on naturally rare and derived datasets, considerably less research is based on simulated and synthetic datasets.
2.1.4 Rare event metadata
Metadata refers to the descriptive information that provides additional context about a dataset. It includes information about the structure, format, quality, source, and other data characteristics. In rare event data acquisition, metadata acquisition involves extracting relevant information from the data that contributes to a better understanding of the rare events. This can include attributes such as timestamps, geographical location, variables related to the event’s occurrence, data sources, data collection methods, and any other contextual information that aids in analyzing and interpreting the rare events. The following methods were revealed as ways of acquiring metadata.
- 1.
-
2.
Expert opinions: Engaging domain experts or subject matter specialists can provide valuable metadata. Experts can contribute their knowledge about rare events, their causes-effects, associated variables of interest, equations, hypotheses, or factors that influence their occurrence [89, 88, 111, 29, 10, 11]. This knowledge can assist in identifying appropriate metadata to enhance the analysis and prediction of rare events.
-
3.
Data annotation: Adding annotations or labels to the data can serve as metadata. This requires manually categorizing data instances as rare events or non-rare events, assigning event severity or damage levels, utilizing standard metrics and indexes, and providing additional descriptive labels that capture specific attributes or characteristics of the rare events [111, 117, 20, 118, 29, 25].
-
4.
External sources: Documents, technical reports, publications, and websites offer insights, statistical data, or contextual details that contribute to the understanding and analysis of rare events. For example, clinical reports, insurance claims data, state mortality records from government websites, outpatient visit details from electronic health records, and responses to patient-reported measures like the Patient Health Questionnaire (PHQ-9) have provided valuable information in predicting rare medical incidents [67, 119].
2.1.5 Characteristics of rare event datasets and associated challenges
Rare event datasets exhibit distinct characteristics that lead to various related issues, some outlined below.
-
1.
Skewed class distribution and lack of data: A skewed class distribution is a distribution of classes that is not symmetrical or evenly distributed. Class imbalance is a specific case of skewed class distribution featuring a substantial disparity in the number of instances between classes [120, 121]. In rare events datasets, the minority class has a significantly smaller number of samples than the majority class. This skewness in class distribution makes it difficult for machine learning algorithms to learn patterns and classify the minority class accurately [9]. Lack of data can take two forms. Absolute rarity occurs where the number of samples associated with the minority class is small in the absolute sense, whereas relative rarity happens where the minority class samples are less relative to the other classes [122]. These rarity forms pose consequential challenges for classifiers in identifying patterns and regularities within these rare occurrences to learn a robust model [9, 111].
-
2.
Temporal property: An inherent characteristic of rare event datasets is the temporal aspect, which refers to the occurrence or sequencing of events over time. Temporal property is essential in analyzing and understanding rare event data, as it provides insights into the timing, duration, order, and interdependencies of rare events and normal events [123]. However, due to the imbalanced class distribution and data sparsity in a temporal context, capturing the time-dependent patterns and correlations in data can be a major challenge. Thus, handling these issues in a temporal context adds complexity to the analysis, necessitating specialized techniques for accurate prediction with temporal data.
- 3.
-
4.
Uncertainty: Uncertainty, in the context of rare event datasets, refers to the lack of precise knowledge and confidence in the observed data. This arises from the limited sample size, data sparsity, high-class imbalance, and lack of information, and it becomes a challenging issue in generalizing the findings of any downstream task [113, 20].
- 5.
-
6.
Event complexity: Rare events involve intricate relationships between multiple variables, which generate complex patterns and interactions in real-world systems [116]. This often makes modeling rare events difficult, necessitating sophisticated modeling approaches to capture the underlying complexity.
2.1.6 Factors that cause rarity in a dataset
Several factors can cause rarity in a dataset, including:
-
1.
Natural occurrences: Some events simply occur less frequently in nature than others. For example, diseases that affect a small percentage of the population will naturally result in highly imbalanced datasets. Natural hazards like landslides, tsunamis, and seismic bumps or climate catastrophes like heavy flooding that may occur once in a century are also rare occurrences [8, 35, 117, 126]. Black-swan events, unpredictable events with severe global economic consequences, are extremely rare natural events in the economic sector. Events like the 9/11 attack and the Chinese economic downturn are examples of these [20].
-
2.
Class definition: The definition of a class can also impact its rarity. If a class is defined narrowly or specifically, it may contain fewer instances than if defined broadly [124]. For instance, when estimating the likelihood of stroke based on varied input parameters like demographic data, additional illnesses, and smoking status, the definitions of "having a stroke" and "not having a stroke" may be narrowly defined. Due to these specific criteria used in classification, stroke events within the dataset may be deemed rare.
-
3.
Sampling bias: If data are collected from a biased sample, they may not precisely reflect the true distribution of the population. In particular, if a rare event dataset only contains events occurring in certain geographic regions or in certain types of people, this can cause rarity. For instance, while HIV (Human Immunodeficiency Virus) is not classified as rare due to its global prevalence [127], there are specific regions and subpopulations where HIV is relatively rare, indicating variations in its incidence and prevalence.
-
4.
Cost and measurement errors: Data collection and labeling can be expensive, and in some cases, collecting large amounts of data for a rare event may not be feasible. Evidently, the generation of simulated data and synthetic data may be costly. It may be challenging to accurately observe and measure rare events in natural and controlled environments, resulting in fewer labeled instances. Similarly, rare events that involve complex interactions among their dimensions may not always be observable and measurable accurately. For example, rare events like Wrong-Way Driving (WWD) are influenced by multiple variables like roadway geometry and configurations, traffic volume, lighting conditions, weather conditions, and driver’s age and medical conditions. However, the impact of these complex interactions is not always readily observable and measurable, giving rise to various complications [19].
-
5.
Subjective decisions: Curators can selectively include instances of a rare event based on specific criteria by selecting features and classes that impact the rarity of that class within the dataset. The decision to include only such instances can affect the rarity of the class within the dataset. This is apparent when creating new datasets by generating derived, simulated, or synthetic data based on the original rare event datasets. For example, in predicting rare events like extreme heat waves, curators have used subjective decisions by selecting temperature and humidity thresholds and time periods based on their understanding of heat wave severity [25]. These decisions can be made to categorize the data into classes and identify patterns related to moderate, severe, or extreme heat waves.
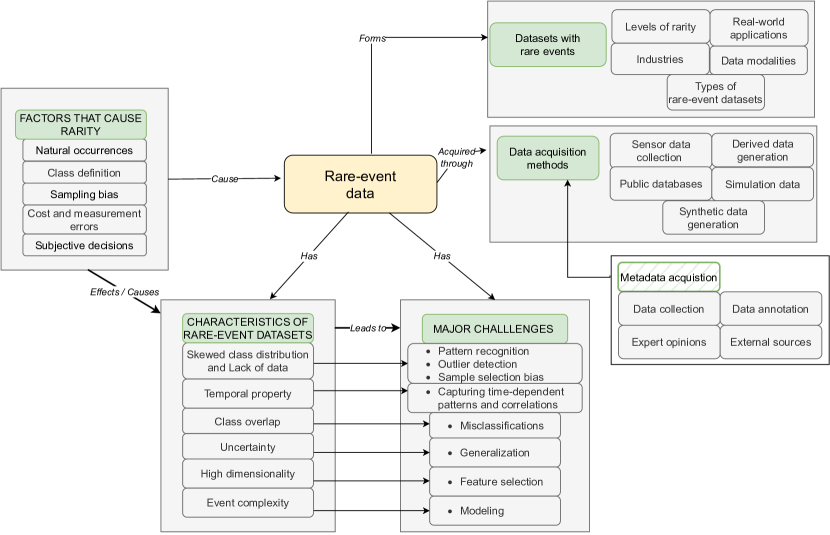
The relationship between rare event data, acquisition methods, rarity factors, characteristics, and challenges of rare event datasets is multifaceted and interconnected, as summarized in Figure 3. The factors contributing to a dataset’s rarity inherently result in rare event data and their characteristics. Rare event data constitute rare event datasets, which can be acquired through various methods. The characteristics of these data, in turn, give rise to various challenges in analyzing and predicting rare events, as discussed in the previous section.
In conclusion, this section examined four significant subsections in depth: rare event datasets, data acquisition methods, factors of rarity, characteristics, and challenges of dealing with rare event data. We devised a rarity hierarchy that provided a systematic method for summing data pertinent to rare events for the purposes of analysis. While most datasets and studies fall under the extremely-rare category in the hierarchy of rarity, many research projects are based on naturally rare and derived datasets. Textual and audio data-based research on rare events has received less attention than time series, image, and numerical data-based datasets. It is worth revealing that rare event-related problems and research are not restricted to a specific domain, industry, or sector, as we investigated research efforts across multiple sectors. Finally, the relationship between rare event data, acquisition methods, rarity factors, characteristics, and challenges of rare event datasets are drawn to summarize the overall scope of review in this section.
3 Data Processing Approaches
This section focuses on the importance of data processing methods in enhancing data quality for improved predictive model performance, especially when dealing with rare event datasets. It explores various data processing approaches used in rare event prediction research, emphasizing their specific objectives. The subsequent discussion provides a detailed examination of each objective, including an analysis of how these approaches intersect with data modality, rarity groups, and downstream tasks.
3.1 Objectives of Data Processing Approaches
In the literature, it was identified that data processing approaches aim to achieve four main objectives. Firstly, it’s responsible for data cleaning, which improves the quality, consistency, and reliability of data analysis results. Secondly, it caters to feature selection by selecting the optimal variables by limiting the input variables to the model and utilizing only relevant features. Thirdly, it aids in sampling by modifying the data samples to balance the distribution and/or eliminating undesirable samples at the data level. Finally, data processing methods are applied in feature engineering to transform raw series data into a stable format suitable for modeling.
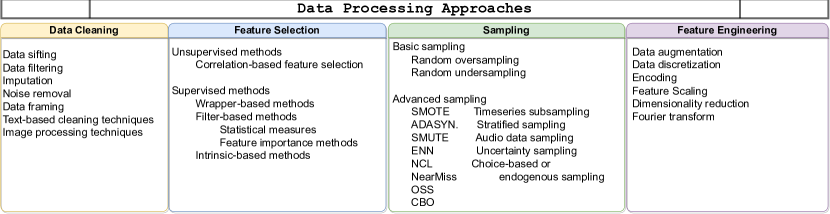
In Figure 4, we classify the data processing approaches in rare event research that adhere to the aforementioned four objectives into four main categories. The approaches to data processing in rare event studies are summarized in Table 5, along with their primary categories, rarity groups, data modalities, and subsequent tasks.
3.2 Data Cleaning (DC)
Data cleaning focuses on the important task of preparing and refining the data. This involves various techniques and processes to improve the dataset’s quality, consistency, and reliability. This subsection examines various approaches for data cleaning techniques. Then it discusses the application of these techniques to various data modalities, rarity levels, and downstream tasks.
3.2.1 Approaches to data cleaning
Various approaches address data cleaning tasks, often depending on the specific data modalities. Some common data cleaning methods used in rare event-based data mining include data sifting, filtering, imputation, noise removal, audio-based preprocessing, text-based preprocessing, and image processing techniques.
i) Data sifting: Data sifting refers to refining large volumes of data to identify the most relevant and important information. In rare event literature, sifting has been used to systematically sort through the data to identify and extract specific subsets of data. There are two types of data sifting: heuristic data sifting and statistical data sifting. Heuristic data sifting relies on expert knowledge and intuition, while statistical data sifting relies on quantitative measures and algorithms to identify relevant features [89, 52, 128, 129]. In [89], important knowledge about Ozone () concentration (i.e., time periods where is high) has been used as a heuristic, and several statistical measures were undertaken to identify relationships between different states and related components.
ii) Data filtering: Data filtration involves segregating and removing unwanted, irrelevant data or information from a large dataset. This includes techniques like removing duplicate data [130], removing records containing very small number of records per group [131, 40], removing rows containing irrelevant types [52], and removing rows that meet specific conditions [96]. For instance, in [52], only the connected calls were used, discarding the unconnected calls from VoIP traffic data in unsupervised rare event detection in spatiotemporal environments. [96] used a cut-off time to define an event of interest and excluded subjects censored before the cut-off time.
iii) Imputation: Imputation or value approximation techniques are used to estimate and represent missing and incorrect values in a dataset with reasonable approximations based on the available data. These techniques help to ensure that the dataset is complete and accurate. They are of two types.
a) Simple imputation techniques: In data science, simple imputation techniques involve methods like summary statistic substitution and interpolation techniques. In rare event data processing, various studies have used summary statistics like mean and median in simple imputation. Mean and median imputation replaces missing records with non-missing elements’ corresponding mean/median values in the corresponding attribute. Median imputation and mean imputation have been used in [96] for the SEER dataset and [58, 57, 56] for the Air Pressure System (APS) failure dataset [54, 55]. These methods can tend to be biased since they do not consider any underlying patterns or trends in the data. Interpolation involves estimating the missing values based on the observed data points around the missing values using mathematical techniques. It considers the trends and patterns in the data to create a more accurate representation of the missing values [132]. [90] has used linear interpolation techniques to reproduce missing values.
b) Advanced imputation techniques: Some studies have utilized advanced imputation techniques like Iterative imputation, Multiple imputation, Soft impute, Expectation maximization, Offset value approximation, and Singular Value Decomposition (SVD) imputation [118, 4, 58]. Iterative imputation is a technique used in handling missing values, where the missing feature values are modeled as a function of the other features [118]. Soft imputation is a state-of-the-art matrix-completion algorithm that uses iterative soft thresholding to compute the SVD of a matrix [133]. Expectation maximization is an iterative method that estimates missing values by using other variables to predict a value (Expectation) and then verifies if that value is the most probable (Maximization) [134]. SVD imputation is based on eigenvalues and uses SVD to generate orthogonal expression patterns that can be linearly combined to approximate the missing values in a dataset [135, 136]. Omar et al. [4] have achieved the imputation of missing data using the MisForest algorithm [137], which is an iterative imputation method based on the Random Forest algorithm. [89] used advanced offset value approximation techniques, where predefined offset values for input data have been generated. [58] have examined the impact of different imputation techniques: expectation maximization, mean imputation, soft impute, Multiple Imputation by Chained Equation (MICE), and Iterative SVD in APS failure prediction and revealed that MICE yielded high performance in their predictions.
iv) Noise removal: Noise pertains to random and irrelevant variations in data that do not contribute meaningful information to the underlying patterns and relationships. Noise removal aims to eliminate such data points that can have a negative impact on predictions. The Brooks-Iyengar algorithm is a fault-tolerant and distributed method used for sensor fusion, that enables accurate measurement and precision even with faulty sensor readings in a sensor network [138]. Iyer et al. [139] used Brooks-Iyengar, handling random noise and missing data using an ensemble of data cleaning trees. Sampling methods like Tomek-links (TL) and Edited Nearest Neighbors (ENN) also has been used in noise removal. TL can remove noise and boundary points in majority class samples in rare events [140, 8, 19, 9]. ENN eliminates noisy data samples and reduces the presence of boundary instances, resulting in smoother decision boundaries [19].
v) Text-based cleaning techniques: Various techniques such as textual summary generation, text conversions, stemming, and lemmatization have been employed in text-based rare event prediction. For instance, in medical advisory document analysis, text-mining procedures using R packages like ‘tm’, ‘snowball’, and ‘Rstem’ were utilized, involving operations like converting to lowercase, removing stop-words, numbers, and punctuation [69, 23]. Stemming and lemmatization were also employed to transform words into their base or root form, which has been particularly useful for dealing with variations of the same word in medical incident reports [69].
vi) Image processing techniques: In rare event prediction using images, image processing techniques have been employed to clean and normalize the images in varied ways. These techniques aim to detect suspicious regions and extract relevant features that differentiate rare regions from similar ones. For example, Kubat et al. [9] used various image processing methods to correct for radar beam incidence angle, identify dark regions, and extract specific features like the size of oil spills and average brightness. The output of the image processing is a fixed-length feature vector for each suspicious region, facilitating further analysis and prediction.
3.2.2 Analyzing data cleaning approaches with data modalities, rarity groups, and downstream tasks
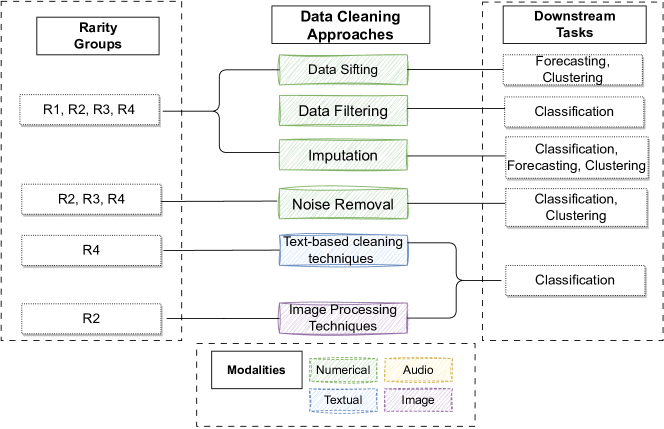
* Coloring of data cleaning approaches corresponds to the data modalities
To explore the data cleaning approaches, we referred to 116 rare event prediction-related papers. Then, we analyzed these by data cleaning approach, modality, and rarity group. We observed the interplay between these as shown in Figure 5. In terms of numerical data cleaning, techniques such as data sifting, data filtering, imputation, and noise removal have been commonly employed, with the rarity level being independent of these techniques. Notably, noise removal has not been applied to the extremely-rare group. Moreover, specific modalities are addressed, such as image processing techniques for image-based rare event prediction and text-related techniques encompassing textual summary generation, text conversions, stemming, and lemmatization for text-based predictions. These audio-based and text-based approaches were used for frequently-rare datasets. Furthermore, image processing techniques are employed to predict images within the very-rare group. While many data processing methods have supported classification tasks, some of these methods have been used in clustering and forecasting research.
3.3 Feature Selection (FS)
Feature selection aims to identify a subset of input features from a dataset to extract the most pertinent information and improve the model’s predictive capacities by reducing complexity. This subsection examines various approaches for feature selection and then discusses the application of these techniques to various data modalities, rarity levels, and downstream tasks.
3.3.1 Approaches to feature selection
The approaches taken in feature selection can be summarized into two categories: unsupervised and supervised. This summarization is based on the techniques of selecting a subset of input features.
I) Unsupervised methods:
Unsupervised feature selection methods do not use the response/target variable, and this removes redundant variables within a dataset by analyzing the relationships and patterns within the independent variables. One specific method used in rare event literature is Correlation-based feature selection, which aims to identify and remove redundant variables [8, 88, 111, 141]. Correlation-based feature selection involves the computation of correlation coefficients, such as Pearson correlation, Analysis of Variance (ANOVA), and chi-squared, to evaluate the relationship between different pairs of features. If the correlation coefficient exceeds a predetermined threshold, it may be necessary to eliminate one of the features from the dataset.
II) Supervised methods: These methods use the response/target variable in the feature selection process and eliminate irrelevant variables in making a prediction. The supervised methods can be categorized into wrapper-based, filter-based, and intrinsic-based.
1. Wrapper-based methods: These methods search for well-performing subsets of input features. Wrapper-based feature selection methods wrap or embed a machine learning algorithm within their core to perform feature selection. Recursive Feature Elimination (RFE) is an example that evaluates the importance of features by recursively training the model and eliminating the least important features in each iteration. [45] uses RFE to select the most important features from the extracted features as input to the Hidden Markov Model (HMM).
2. Filter-based methods: These methods extract new features or select subsets of features based on their relationship with the target. They can be either statistical measures or feature importance methods.
i) Statistical measures: Statistical features help in understanding the datasets by quantifying key characteristics and patterns. They encompass various statistical measures, ranging from simple calculations like mean, median, variance, skewness, kurtosis, and standard deviation to more advanced measures like spectral energy and frequency entropy derived from time and frequency domain analyses. In rare event literature, approaches like the sliding window [47], wavelet analysis [47], Discrete Wavelet Transform (DWT) [45], Gumbel copula function [117], Minimum Redundancy Maximum Relevance (mRMR) [141] have been used to extract these statistical measures from various data sources. Additionally, statistical methods have been employed to generate additional features, such as technical indicators and trend measures, particularly in financial time series datasets [20, 37]. In analyzing drug incident reports, Term Frequency-Inverse Document Frequency (TF-IDF) has been employed to extract pertinent terms and phrases, where TF-IDF serves as a numerical representation to gauge the relative importance of terms within a document concerning their occurrence across a document collection [69, 23].
ii) Feature importance methods: They aim to identify and rank the most influential input features contributing to a model’s predictive power. Gini feature importance, eXtreme Gradient Boosting (XGBoost) accuracy and cover measurement, and Mel-frequency Cepstral Coefficients (MFCC) based feature extraction are feature importance methods used in rare event-based literature.
a) Gini feature importance and XGBoost accuracy and cover measurement - The Random Forest algorithm measures Gini Importance or Mean Decrease in Impurity (MDI) to calculate the importance of each feature based on the number of splits it generates across all trees. XGBoost accuracy and cover measurement is a feature importance method that calculates the most important input features by evaluating their contribution to model accuracy and the number of data samples split across all trees in the XGBoost algorithm. Researchers have utilized Gini importance [14, 56, 4] and XGBoost accuracy and cover measurements [14] to assess variable importance and detect complex relationships in datasets, improving the performance of rare event prediction models.
b) Mel-frequency cepstral coefficients (MFCC) based feature extraction - MFCC is an approach in audio-based preprocessing that extracts relevant and discriminative features from audio signals. The process involves multiple steps, including pre-emphasis, framing, windowing, fourier transform, mel-filterbank conversion, logarithmic compression, and discrete cosine transform, resulting in feature vectors that capture essential information about the spectral content and shape of audio signals. In rare event research, MFCC has been utilized alongside additional features like spectral roll-off, centroid, contrast, bandwidth, and zero-crossing rate to enhance prediction model performance in audio-based applications [73, 142].
3. Intrinsic-based methods: Intrinsic-based feature selection comprises algorithms automatically selecting features during training. Attention-based methods, such as multi-variate and multi-scale attention, have been employed to combine different features, including spatial and temporal features, and identify important features for rare event prediction [22]. These methods provide robustness against noise and common transformations such as temporal shifts and dropped or missing variates. Additionally, decision trees have been utilized in rare event prediction research as an intrinsic method for feature selection [8, 9].
3.3.2 Analyzing feature selection approaches with data modalities, rarity groups, and downstream tasks
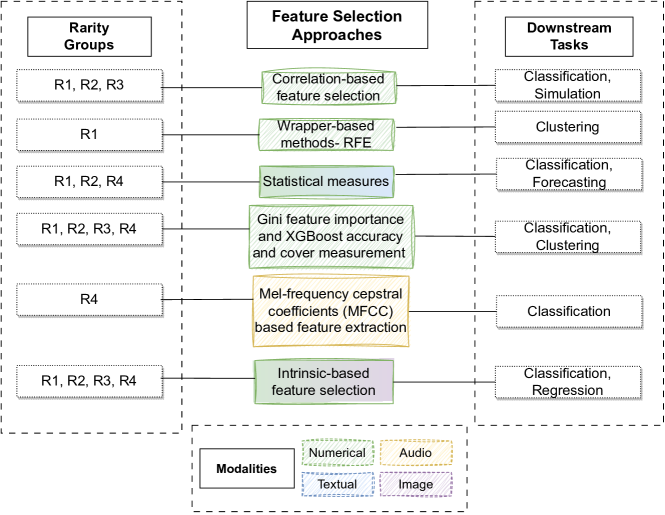
* Coloring of feature selection approaches corresponds to the data modalities
Figure 6 illustrates the intricate association between feature selection methods, modality variations, and rarity groups within the context of rare event prediction, as analyzed across the reviewed papers. Regarding numerical-based feature selection, feature importance, and intrinsic-based methods are independent of the rarity groups. Correlation-based feature selection, wrapper-based, filter-based, and intrinsic methods have been used with data belonging to extremely-rare and very-rare groups. TF-IDF and MFCC-based feature extraction has been used with frequently-rare data. Decision tree-based intrinsic methods were utilized with very-rare image datasets. Likewise, in data cleaning, most data processing methods support classification tasks; some have been used in clustering, regression, simulation, and forecasting research.
3.4 Sampling (SL)
Sampling techniques in machine learning refer to methods used to select a subset of data from a larger dataset. These techniques are commonly employed to address issues like class imbalance and large data sizes and to improve computational efficiency. In the research contributions, it can be seen that data sampling techniques have been widely applied to rare event data and are an effective method for improving performance when mining rare events. This subsection examines various approaches for sampling and then discusses their application to various data modalities, rarity levels, and downstream tasks.
3.4.1 Approaches to sampling
Sampling techniques used in rare events can be divided into two main categories: basic and advanced. The basis of this categorization is generally the complexity and sophistication of the sampling methods.
I) Basic sampling techniques: Basic sampling techniques seek to address the issue of class imbalance by eliminating instances from the majority class or increasing the minority class by duplicating minority class samples. Random minority oversampling (ROS) and random majority undersampling (RUS) are the most frequent basic sampling strategies.
Random minority oversampling (ROS) and random majority undersampling (RUS): In ROS, instances of the minority class are replicated randomly in the dataset, while in RUS, occurrences of the majority class are randomly eliminated from the dataset. In rare event-based research, many studies have used ROS and RUS methods to achieve a more balanced class distribution [103, 23, 12, 143, 51, 90]. Some researchers have combined sampling techniques with clustering models [21, 51] and ensemble learning methods [24] to improve predictive performance. Some others have applied randomly over/under-sampling in conjunction with advanced architectures, such as the Siamese CNN [7], to enhance rare event detection. Additionally, statistical sampling methods, like Hoeffding bounds, have been employed in rare event learning using associative rules and higher-order statistics [139]. Even though basic sampling has been extensively used, it has several limitations. The drawback of the oversampling method is that it leads to overfitting since the model learns from the same duplicated samples repeatedly. Undersampling eliminates lots of data that could have been utilized to train the model and improve its accuracy.
II) Advanced sampling techniques: Going beyond basic random adjustments, advanced sampling techniques utilize intelligent mechanisms that consider the distribution of data points and the nuance of learning specific examples, resulting in greater effectiveness for handling complex imbalanced datasets. Synthetic Minority Oversampling (SMOTE), Adaptive Synthetic Sampling (ADASYN), Similarity Majority Under-Sampling (SMUTE), Edited Nearest Neighbor (ENN), Neighborhood Cleaning Rule (NCL), NearMiss (NM), One-Sided Selection (OSS), Cluster-based Oversampling (CBO), Time series subsampling, Uncertainty sampling, and Choice-based or Endogenous sampling are advanced techniques utilized in rare event literature.
1) Synthetic Minority Oversampling Technique (SMOTE): SMOTE is a popular advanced sampling technique used in machine learning to address class imbalances. It generates new synthetic minority cases by extrapolating from existing minority instances, and it considers the difference between a sample and its closest neighbor to create synthetic examples. SMOTE has been adopted in various rare event-related use cases implementing different modeling techniques [23, 65, 144, 19, 57]. It has been observed that logistic regression combined with SMOTE produces good results in detecting Look-Alike-Sound-Alike (LASA) cases in textual data [23], but it can be computationally expensive. Adaptive swarm balancing algorithms [65] and dynamic churn prediction frameworks [144] have also utilized SMOTE for rare event prediction in imbalanced datasets. Additionally, Borderline-SMOTE is a variation that selectively applies SMOTE to minority instances on the border of the minority decision region, yielding effective results in mining tasks [103]. While SMOTE has been adopted in various rare event use cases, it has a significant drawback due to the arbitrary generation of synthetic data. As a result, the class boundaries between the majority class and the minority class in the synthetic data may appear significantly different from those in the original dataset, potentially deviating from the actual distribution of the minority class.
2) Adaptive Synthetic Sampling (ADASYN): Adaptive Synthetic Sampling (ADASYN) [145] is a method that solves the issue with SMOTE by following a weighted distribution for minority classes according to their level of difficulty in learning. It generates synthetic observations of the harder-to-learn minority samples compared to the easier-to-learn minority samples and adaptively shifts the decision boundary towards the harder-to-learn samples. Asraf et al. [19] have used ADASYN with the XGBoost model in rare event modeling in highrisk WWD roadway segment identification.
3) Similarity Majority Undersampling (SMUTE): Similarity Majority Undersampling (SMUTE) is an undersampling technique proposed in [8] for rare event prediction. SMUTE distinguishes between the majority and minority class samples by considering the cosine similarity between each majority class sample and its neighboring minority class samples. SMUTE works by calculating similarity scores between each majority class sample and a given number of minority class samples, then selecting a subset of majority class samples with the highest percentage of high similarity scores based on a specified undersampling rate.
4) Edited Nearest Neighbor (ENN): ENN [146] is an undersampling method that reduces noise and refines decision boundaries in imbalanced datasets. ENN eliminates samples whose class labels differ from most of their nearest neighbors, resulting in a dataset with smoother decision boundaries and reduced noise. It has been applied with SMOTE oversampling to create a balanced, noise-free training dataset for improved rare event prediction [8, 19].
5) Neighborhood Cleaning Rule (NCL): NCL is an undersampling technique that removes redundant, noisy, or ambiguous samples. NCL employs the ENN technique to remove the data samples [147]. However, compared with ENN, NCL has the additional benefit of removing redundant instances based on feature space similarity [8].
6) NearMiss (NM): NM algorithms [148] are advanced undersampling techniques that use distance measures of majority class samples to minority class samples in selecting samples. When two points from different classes are located very close to one another in a distribution, this algorithm eliminates the data point from the larger class to balance the distribution. NearMiss-2(NM2), a variation of NM, has been used in rare event prediction data processing [8, 19].
7) One-sided Selection (OSS): OSS is an undersampling technique that balances imbalanced datasets by removing redundant and noisy majority-class instances. It combines the use of Tomek Links to identify ambiguous points on the class boundary with the Condensed Nearest Neighbor (CNN) rule [149] to eliminate distant redundant examples from the majority class, resulting in a minimally consistent subset without compromising model performance. OSS has the advantage over other methods of intelligently locating and removing redundant and noisy majority class instances by utilizing Tomek Links and the CNN rule. This makes a more refined and representative subset of the majority class. OSS has been employed in various rare event studies to address the high imbalance in learning tasks [28, 9, 24, 103].
8) Cluster-based oversampling (CBO): CBO is a method that employs resampling by clustering each class’s training data separately and then performing random oversampling, cluster by cluster [143, 103]. The advantage of this method is that it considers both between-class and within-class imbalances and then oversamples the data to correct both imbalances simultaneously.
9) Time series subsampling: Time series subsampling involves selecting a subset of time points from the original to create a new, shorter, and more balanced time series [150, 151]. The difference between subsampling and time series subsampling is that subsampling is a general term that refers to selecting a random subset of data points, while time series subsampling is a specific type of subsampling used for time series data involving the selection of a subset of time points from a time series. In industrial-based research on machinery fault diagnosis [46], subsampling of time series has been performed to consider the balanced time series length of normal and different bearing fault types. Further, time series subsampling reduces the computational cost of analyzing long time series and aids in training machine learning models.
10) Stratified sampling: Stratified sampling is a general sampling technique that divides the dataset into subgroups (strata) based on the target variable’s classes and then randomly samples from each stratum to ensure representation of all classes. To sample normal and different bearing fault failure types, [46] uses stratified techniques to represent these subgroups in the final dataset properly.
11) Audio data sampling: Data framing has been used as a data sampling technique for audio data [73] that involves converting the audio data into a machine-readable format to fix the audio file sampling (frame) rate. In this method, the audio data is divided into frames, each representing a segment of the audio signal sampled at a specific rate. The total number of frames can be calculated by multiplying the sampling rate by the audio file’s duration.
12) Uncertainty sampling: Uncertainty sampling is a data sampling technique widely used in active learning, particularly relevant to rare event prediction research. It entails selecting instances from a dataset based on the uncertainty or low confidence of their predicted labels by a machine learning model. The goal is to prioritize sampling data points for which the model lacks certainty in its predictions. This approach is valuable in scenarios where labeling data is resource-intensive, such as in rare event prediction [106], as it allows researchers to actively select the most informative instances for annotation, thereby improving the model’s performance with limited labeled data.
13) Choice-based or Endogenous sampling: Endogenous sampling is a rare event prediction method that selects samples based on the dependent variable (y) rather than the independent variable (X). It aims to obtain a representative sample that accurately reflects the distribution of rare events in the dataset, addressing the imbalance issue and improving predictive performance. Choice-based or endogenous stratified sampling has been used in various applications, such as Light Detection and Ranging (LIDAR) maps, where non-landslide cells are sampled one to five times more than landslide cells to achieve better representation [35]. Variations of regression models have been experimented with in endogenous sampling approaches [53].
3.4.2 Analyzing data sampling approaches with data modalities, rarity groups, and downstream tasks
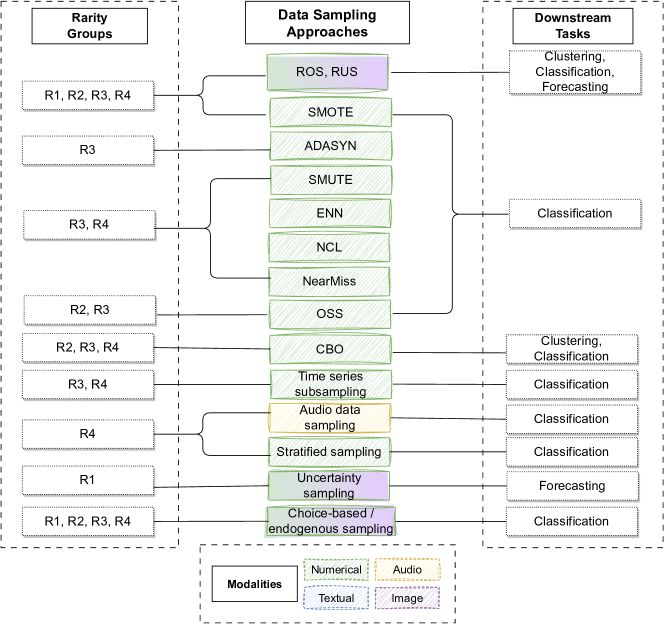
* Coloring of sampling approaches corresponds to the data modalities
Investigating sampling approaches, we analyzed 116 rare event prediction-related papers based on sampling approach, modality, and rarity group and observed their interrelationships as depicted in Figure LABEL:fig:sampling. It’s seen that basic data sampling techniques are independent of rarity groups. They are used for numeric, image, and audio data and have been utilized in studies focusing on downstream tasks such as clustering, classification, and forecasting. The advanced sampling technique, SMOTE, is independent of rarity groups and is used in classification-based studies and numerical data. Most of the advanced sampling techniques, like SMUTE, ENN, NCL, NM, OSS, CBO, and time series subsampling, have been widely used in rare event prediction research with numeric datasets of varying rarity levels and are mostly used in classification-based studies. Uncertainty sampling and choice-based or endogenous sampling methods have been employed for regression and forecasting tasks across different rarity groups.
3.5 Feature Engineering (FE)
Feature engineering involves converting raw data into a relevant feature set for modeling. It aims to extract meaningful information from the dataset and present it in a format suitable for the learning algorithm. This subsection examines various approaches to feature engineering. Then, discusses their application to various data modalities, rarity levels, and downstream tasks.
3.5.1 Approaches to Feature engineering
Investigating rare events, we will review commonly utilized techniques in feature engineering as outlined below.
I) Data augmentation: Data augmentation is a commonly used technique in machine learning to increase dataset size and diversity by creating additional samples through transformations or modifications while preserving the original labels. In rare event prediction, it has been applied in various application domains, such as machinery fault diagnosis, computer vision, and geology. An example of a manufacturing-based application is [13], where they have introduced a data augmentation approach for binary labeled multivariate time series data based on the pulp-and-paper manufacturing dataset. They have derived new features using data augmentation and Fast Fourier Transform (FFT), which are used in addition to the given features [12]. [57] used variations of Generative Adversarial Networks (GAN) - Conditional GAN (CGAN), and Wasserstein GAN (WGAN) as data augmentation techniques. [152, 7] applies image-based data augmentation in their approaches to mineral prospectivity prediction and scene change event detection, respectively. They utilized cropping geological image data to generate more training samples without affecting the spatial distributions of geological data. In the same domain and with the same problem, [153] applies window-based data augmentation to generate positive labeled geo-image samples for Mineral Prospectivity Mapping (MPM).
II) Data discretization: Data discretization involves converting continuous data into discrete data, simplifying analysis, and reducing noise’s impact on the data. In the context of rare event prediction, data discretization techniques have been applied to generate pre-processed datasets. For instance, in [4], continuous value variables were transformed into categorical values using discretization techniques. Similarly, in [103], four out of six continuous attributes in the UCI Adult dataset were discretized. Another approach, ‘Jayne’s approach’, introduced in [37], utilized optimal binning, a supervised method for discretizing variables, and selected discretized features were used in the modeling phase. Various software, such as the Waikato Environment for Knowledge Analysis (WEKA) machine learning library, can perform data discretization, and in [25], the “unsupervised.attribute.Discretize” class in WEKA has been used for this purpose.
III) Encoding: Encoding transforms categorical variables into numerical representations that algorithms can easily manipulate. One-hot encoding, a widely used technique, has been used in machinery fault diagnosis-based research [46] to match the model input and output data format. In transformer failure prediction [141], a label encoding technique has been employed to give each separate category a distinct integer value.
IV) Feature scaling: Feature scaling transforms a dataset’s feature values to a similar scale, promoting equal contributions from all features and avoiding any bias that could arise from features with larger values. In rare event research, standardization and normalization are commonly used scaling techniques, with standardization fits data to a standard normal distribution [46, 38, 40, 73] and normalization rescale values to a common scale [10].
V) Dimensionality reduction: Dimensionality reduction mechanisms have been utilized to convert feature sets in high dimensional space to low dimensional space. A popular use of this in rare event research is Principal Component Analysis (PCA) that is used to extract major components in the extracted feature set [47, 45, 20, 73, 57, 10, 4, 22, 18, 40, 73].
VI) Fourier transform: Fourier transform is a data processing technique in signal processing and image processing. It transforms a time-domain signal into its frequency-domain representation, allowing for analyzing and manipulating the signal’s frequency components. In audio-based rare event research, [73], fourier transform is applied to convert audio waveforms into the frequency domain for further analysis.
3.5.2 Analyzing feature engineering approaches with data modalities, rarity groups, and downstream tasks
Figure 8 presents a comprehensive overview of the association between feature engineering techniques, data modality, and rarity groups in the context of rare event prediction, as examined from the reviewed papers. It is observed that classification has been the primary focus of the majority of research. Standardization, normalization, and dimensionality reduction have been applied to numerical and audio data, whereas data augmentation has been used on numerical and image data. Discretization and encoding have been used with numerical data, and in addition to classification, these techniques focus on clustering tasks. It is noted that none of the feature engineering techniques are rarity-independent; hence, each of the techniques seems to perform well with specific rarity groups.
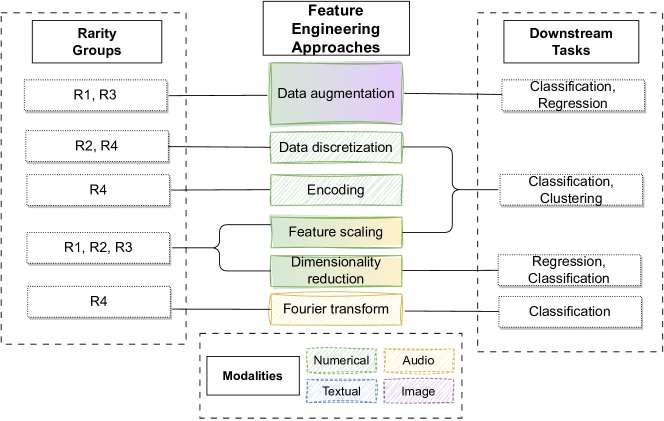
* Coloring of feature engineering approaches corresponds to the data modalities
| Data processing approach | Papers | Rarity group |
|
Modality |
|
||||
|---|---|---|---|---|---|---|---|---|---|
| 1. Data Cleaning | |||||||||
| Data sifting | [89, 52, 129, 128] | R1, R2, R3, R4 | FT, CL, CF | N | RE, DE | ||||
| Data filtering | [130, 131, 40, 52] | R1, R2, R3, R4 | CF | N | RE | ||||
| Imputation |
|
R1, R2, R3, R4 |
|
N |
|
||||
| Noise removal | [4, 8, 139, 19]] | R2, R3, R4 | CL, CF | N | RE, DE | ||||
| Textual summary generation | [69, 23] | R4 | CF | TX | RE | ||||
| Text conversions | [69] | R4 | CF | TX | RE | ||||
| Stemming and lemmatization | [69] | R4 | CF | TX | RE | ||||
| Image processing techniques | [9] | R2 | CF | I | RE | ||||
| 2. Feature Selection | |||||||||
|
[8, 88, 111] | R1, R1, R3 | CF, SM | N |
|
||||
|
[45] | R4 | CL | N | RE | ||||
|
|
R1, R2, R4 | CF, FT | N, TX | RE, SY | ||||
|
[24, 4, 14, 56, 4] | R1, R2, R3, R4 | CL, CF | N | RE | ||||
|
[73, 142] | R4 | CF | A | RE | ||||
|
|
R1, R2, R3, R4 | CF, RG | N, I | RE, DE | ||||
| 3. Sampling | |||||||||
|
|
R1, R2, R3, R4 | CF, FT, CL | N, I, TX | RE, DE | ||||
| Advanced sampling | |||||||||
| i) SMOTE | [23, 24, 69, 65, 144, 88, 103] | R1, R2, R3, R4 | CF | N, TX | RE, DE | ||||
| ii) ADASYN | [19] | R3 | CF | N | RE, DE | ||||
| iii) SMUTE | [8] | R3, R4 | CF | N |
|
||||
| iv) ENN | [146, 8, 19] | R3, R4 | CF | N |
|
||||
| v) NCL | [8, 19] | R3, R4 | CF | N |
|
||||
| vi) NearMiss | [8, 19] | R3, R4 | CF | N |
|
||||
| vii) OSS | [28, 9, 24, 103] | R2, R3 | CF | N, I | RE, DE | ||||
| viii) CBO | [143, 103] | R2, R3, R4 | CL, CF | N | DE | ||||
| ix) Time series subsampling |
|
R3, R4 | CF | N | RE | ||||
| x) Stratified sampling | [46] | R4 | CF | N | RE | ||||
| xi) Data framing | [73] | R4 | CF | A | RE | ||||
| xii) Uncertainty sampling | [106] | R1 | FT, SM | N | SI | ||||
|
[53, 35] | R1,R2,R3, R4 | CF | N, I | RE | ||||
| 4. Feature Engineering | |||||||||
| Data augmentation | [57, 19, 13, 12, 152, 7, 153] | R1, R3 |
|
N, I | RE | ||||
| Data discretization | [4, 103, 37, 25] | R2, R4 | CL, CF | N | RE, DE | ||||
| Encoding | [46] | R4 | CL, CF | N | RE | ||||
| Feature scaling |
|
R1, R2, R4 | CL, CF | N, A | RE, DE | ||||
| Dimensionality reduction |
|
R1, R2, R4 |
|
N,A | RE, DE | ||||
| Fourier transform | [73] | R4 | CL | A | RE | ||||
∗ N-Numeric, TX-Textual, I-Image, A-Audio, T-Time series, FT-Forecasting, CL-Clustering, CF-Classification, RG-Regression, RE-Naturally rare, DE-Derived, SI-Simulated, SY-Synthetic
In conclusion, the data processing approaches in rare event prediction research play a vital role in addressing the challenges associated with rare event classification, clustering, regression, and forecasting. In this section, we explored four primary techniques, data cleaning, feature selection, sampling, and feature engineering, as approaches to data processing. Data cleaning methods help to ensure data quality and remove noise, while feature selection techniques aim to identify the most relevant features for rare event prediction. Sampling approaches assist in selecting a subset of datasets and address issues with class imbalance and large dataset sizes. Feature engineering methods effectively extract meaningful information and represent the data more discriminatively. These approaches are highly dependent on the specific modality of the data and the rarity groups being considered.
4 Algorithmic Approaches
Algorithmic approaches are pivotal in any machine learning pipeline and contribute significantly in making informed and effective decisions. Algorithmic approaches provide mathematical models for varied use cases centered around downstream tasks like classification, clustering, forecasting, regression, and simulation. Firstly, this section analyzes a subset of algorithmic approaches utilized in the literature on rare events. Then, each approach would be examined concerning several algorithmic indicators. Finally, each approach would be analyzed with the data modality, rarity groups, data processing techniques, and downstream tasks.
4.1 Significance of algorithmic approaches
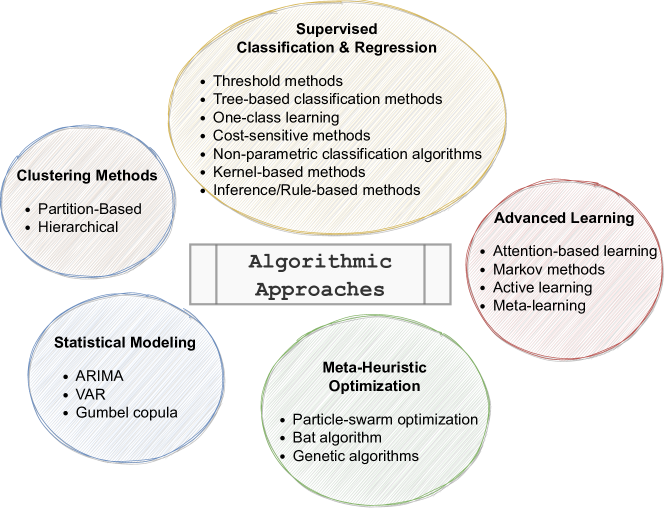
Algorithmic approaches provide tools and modeling techniques to analyze and interpret complex datasets, enabling the identification of patterns, relationships, and key factors and predicting events of significant importance. We categorize algorithmic approaches in rare event research into five major groups: Supervised classification and regression, Clustering, Statistical modeling, Meta-heuristic optimization, and Advanced learning methods as shown in Figure 9.
4.2 Supervised Classification and Regression Methods
Classification and regression are two fundamental supervised learning tasks in machine learning aimed at predicting the output of a target variable based on input features. The key difference lies in the type of target variable they handle. Classification algorithms are used to predict discrete values such as gender, binary labels (true/false), or categories like spam or not spam, while regression algorithms are employed for predicting continuous values like price, salary, or age. In rare event prediction, various techniques have been used, including threshold methods, tree-based classification, one-class learning, cost-sensitive methods, non-parametric classification algorithms, kernel-based methods, and inference/rule-based methods.
4.2.1 Threshold methods
These approaches set a specific threshold for classifying data instances into rare or non-rare classes based on a pre-defined criterion. Instances above the threshold are considered rare, while those below it are classified as non-rare. Existing research has employed probabilistic statistical methods such as Logistic Regression (LR), Naive Bayes classifiers (NB), and Neural Networks (NN) that generate a score or probability threshold. If the categorization is binary, this probability is subsequently transferred and mapped to a binary mapping, like malignant or benign, spam or not spam, normal or abnormal. In rare event prediction, certain researchers have utilized LR as a fundamental base classifier [23, 35], while others have explored various adaptations and variations of LR. Some of these modifications include incorporating regularization techniques [18, 19] and utilizing weighting methods [53]. It was observed that the conventional LR encountered convergence challenges in scenarios with limited sample sizes or rare events in the data. To address this issue, an alternative approach known as Firth’s logistic regression [155] has been employed, wherein a penalty is added to the log-likelihood function of the LR model. Several studies that include rare events [111, 19] have demonstrated improved performance using Firth’s logistic regression. LR methods are easy to implement, interpretable, and suitable for rare event prediction with small sample sizes.
Bayes classifiers and neural networks are also threshold-based models utilized in rare event prediction research. Bayes classifiers have been used in rare event prediction by [58, 8]. Studies have explored the application of neural networks, including Deep neural networks [118, 99, 8], Convolutional Neural Networks (CNN) [99, 20, 152, 153, 38], Multi-Layer Perceptron (MLP) [73], Autoencoders [19, 39, 40], CNN-based autoencoders [20, 154, 39, 40, 130], Long Short-Term Memory (LSTM) autoencoders [154, 130] in various applications such as mineral prospectivity prediction [152, 153], black-swan event prediction [20], rare sound classification in audio forensics [73] and manufacturing failure prediction [154, 130]. NB offers robustness, probabilistic inference, and flexibility compared to LR, while NN excels in representation learning and scalability. But, they both risk being affected by the insufficient sample size in rare events [111].
4.2.2 Tree-based classification methods
Tree-based classification models are supervised machine learning methods that partition the training data into subsets using a series of conditional statements. These splits create a tree-like structure, each representing a logical test on a specific feature. The final model comprises multiple such trees, enabling predictions and offering insights into the relationships within the data. Tree-based classification methods are widely used in rare event prediction due to their ability to handle complex and non-linear relationships in the data. Random Forest (RF) [67, 99, 56, 57, 14, 58, 10] and Boosted Classification Trees, such as XGBoost [14, 57, 19, 58], are popular choices in this group. In rare event prediction, researchers have applied these models to estimate the probability of rare events like suicide attempts [67], APS failures [56, 58], and manufacturing faults [57, 14]. Data augmentation techniques have been used to enhance the performance of tree-based models further, optimizing parameters to avoid overfitting [19]. Tree-based methods also benefit from handling overfitting using random subsets during model training. However, they can be challenging to interpret due to the large number of trees in the model, making it difficult to understand the combined effect of all trees. Despite this limitation, tree-based classification methods are valuable tools for capturing complex relationships and making accurate predictions in rare event prediction tasks.
4.2.3 One-class learning
One-class learning is a supervised learning strategy used for extremely skewed class distributions, with the classifier being trained exclusively on data from one class. Adaptation of one-class classification algorithms for imbalanced classification has been researched in early studies, and they have also been employed in rare event prediction. HIPPO (i.e.,a classification method based on Hippocampus functioning) [156] is a standard method where only the rare class is learned, and Repeated Incremental Pruning to Produce Error Reduction (RIPPER) [157] is a standard method where the algorithm selects the majority class as its default class and learns the rules for detecting the minority class. Hamaguchi et al. [7] have proposed a variational autoencoder-based method to learn disentangled representations on only low-cost negative samples of image data. As a result, rare events were detected as outliers. Some autoencoder models we presented under threshold methods also do intersect with this group, such as [154], which was trained only on normal samples, and [19] where samples of rare events were used for training. It should be noted that the advantages of one-class classifiers come at the cost of ignoring all available information about one class. Consequently, this solution should be cautiously approached, as it may not be suitable for all circumstances.
4.2.4 Cost-sensitive learning
Cost-sensitive learning methods consider the costs associated with prediction errors and other potential costs during the training of a machine learning model. Instead of maximizing accuracy, the focus shifts to minimizing overall misclassification costs, where each class or instance is assigned a specific misclassification cost. False negatives (misses) are assigned higher costs than false positives (false alarms). Two main approaches to cost-sensitive learning are decision trees and weighting. Decision trees use a parameter threshold to adjust the decision boundary of the classifier, and they have been used as cost-sensitive learning methods in several rare event studies [23, 8, 9, 21]. On the other hand, weighting assigns higher weights to the minority class to penalize misclassifications of the rare class [94, 24]. Researchers have explored cost-sensitive learning methods with various classifiers such as Logistic Regression, Random Forest, and Support Vector Machines. Weighted Random Forest and AdaClassWeight are examples of algorithms that adaptively adjust the weights of the rare class to address the imbalanced data problem [94, 24]. Overall, it’s observed that cost-sensitive learning methods offer effective solutions for handling imbalanced datasets and predicting rare events in various real-world applications.
4.2.5 Non-parametric classification algorithms
They are machine learning algorithms that do not make explicit assumptions about the data’s underlying probability distribution or functional form. Unlike parametric classification algorithms, which assume a specific functional form (linear or polynomial) and estimate parameters, non-parametric algorithms learn directly from the data without assuming any specific model structure. K-nearest neighbors (k-NN) is an instance adopted by [58] in APS failure prediction. They are often more flexible and can capture complex relationships in the data, which becomes more advantageous in rare event prediction [38, 58].
4.2.6 Kernal-Based Methods
Kernel-based methods are machine learning algorithms that transform data into a higher-dimensional space using kernel functions, enabling them to capture non-linear relationships and solve downstream tasks like classification and regression. Support Vector Machines (SVMs) are a well-known kernel technique that outperforms neural networks in some rare event research, particularly for small to medium datasets demanding explainable outcomes. SVM-based kernels can disambiguate hard-to-classify rare event datasets using soft-margins [139, 90, 58]. One-class SVM has been used in evaluating large sample sizes in unsupervised learning environments [18, 139]. In imbalanced healthcare data, L.SVM (Support Vector Machine with Linear kernel) and R.SVM (Support Vector Machine with Radial kernel) have been used as base classifiers for incident detection [23]. SVMs have also been applied in importance sampling for rare event detection to identify multiple failure regions and estimate the structural failure probability of rare events [112]. Granular SVM (GSVM) is a variation of SVM that combines statistical learning theory and granular computing theory [158]. In [31], GSVM has been used with under-sampling techniques to improve efficacy by locally reducing redundant data through parallel processing. Rare event weighted kernel logistic regression (RE-WKLR) [32] is an algorithmic SVM enhancement optimized for unbalanced and rare event data. It offers the advantages of weighing, bias correction, and the strength of kernel approaches, especially when datasets are imbalanced or not linearly separable.
4.2.7 Inference/Rule-Based Methods
Inference or rule-based methods are a class of algorithms that focus on deriving knowledge and insights from data through explicit if-then rules. These methods involve expert domain knowledge to create human-readable rules explaining the decision-making process and providing interpretable outputs. In rare event literature, these methods can be Bayesian methods, Inductive algorithms, Two-phase rule induction, Knowledge-based and human interaction-based approaches, and Association rule mining.
i) Bayesian methods: Bayesian methods are statistical techniques that use prior information on a certain population, and they rely on Bayes’ theorem to update the probability of a hypothesis based on new evidence. Bayesian methods offer multiple benefits, including handling incomplete and noisy data, understanding causal relationships between variables, and integrating domain expertise and data through Bayesian networks. Utilizing Bayesian methods, as demonstrated in [89], along with Bayesian networks, results in superior performance in forecasting daily ozone states by incorporating expert knowledge and historical data. Bayesian networks also prove useful for extreme rare event identification, as shown in [37], where the Jaynes inferential approach is used for feature engineering and optimal binning, leading to reduced features and improved identification of relevant diagnostic features.
ii) Inductive Algorithms: In rare event prediction, some researchers have proposed various inductive bias methods such as Maximum Specificity Bias (MSB) and Instance-Based Learning (IBL). MSB aims to discover specific rules for individual training examples, enhancing the performance of small disjuncts but leading to worse overall performance. IBL, also known as lazy learning, is a machine learning approach that focuses on the local generalization of instances based on similarity measures. 1-NN (1-Nearest Neighbor) algorithm is a type of IBL used in [9] along with one-sided selection in detecting oil spills. This study shows promising results for improving accuracy in small disjuncts, but even this method has not been able to provide conclusive evidence.
iii) Two-phase rule induction: Two-phase rule induction is a machine learning technique that involves a two-step process for inducing rules from data and is commonly used in data mining and knowledge discovery. The PNrule algorithm [159] is a two-phase rule induction approach that involves the discovery of positive rules (P-rules) to predict the presence of a class and negative rules (N-rules) to predict its absence. P-rules are learned in the first phase to capture the most positive cases while maintaining a respectable false positive rate. N-rules are discovered in the second phase to reduce false positives introduced by the union of P-rules while maintaining an acceptable detection rate. The study by [95] uses the PNRule method to address the challenge of maximizing recall and precision in rare event prediction. By creating rules with great accuracy, the initial phase concentrates on recall. The second phase concentrates on precision by utilizing rules that eliminate false positives from the records covered by the first phase.
iv) Knowledge-based and human interaction-based approaches: Knowledge and human interactions have been researched and explored in predicting rare events like international conflicts, wars, coups, revolutions, massive economic depressions, and economic crises [160]. Knowledge-driven models are particularly useful in areas with limited exploration data or that have not been extensively studied. They rely on the expertise of professionals to make decisions, but they can be subjected to limitations due to their subjective nature. Some instances of using knowledge include modeling knowledge from geological experts in mineral prospectivity prediction [152, 153] and using expert knowledge like chemical equations and hypotheses in solar flare forecasting [89]. Nevertheless, while these approaches may demonstrate efficacy when applied to small and straightforward systems, their effectiveness might be low when dealing with more complex and diverse systems [88].
v) Association rule mining: Association rule mining utilizes basic If/Then statements to reveal relationships between independent relational or other data repositories. [161] adopts an association rule mining approach to identify frequently occurring patterns preceding target rare events, which are subsequently integrated into a rule-based predictive model. ‘PREVENT’ is a general purpose inter-transaction association rules mining algorithm that uses inter-transactional patterns to predict rare events in transactional databases [25]. FP-Growth, a state-of-the-art algorithm for classical association rule mining, is utilized there. The algorithm’s computational cost is minimal as it involves limited scans of the database, making it well-suited for the requirements of rare event prediction.
4.3 Clustering Methods
Clustering is a type of unsupervised learning where samples are categorized based on their resemblance to neighboring data points. Several clustering-based methods have been employed in the literature on rare events. Distance-based unsupervised methods such as Random Forest (RF) clustering, Partition Around Medoids (PAM), K-means, and hierarchical clustering are commonly used [162, 40]. For instance, hierarchical clustering has been used to detect abnormal production behaviors in the paper manufacturing industry [40]. K-means clustering has been utilized to identify rare change events based on the distance between common features [7]. Additionally, clustering-based undersampling techniques, like Clustering Large Applications (CLARA) [21] and Classification using lOcal clusterinG (COG) algorithms [51], have aimed to generate balanced sub-classes for classification. In some cases, ensembles of clustering methods, such as RF Clustering and PAM, are been combined to optimize the clustering process [4]. Moreover, the combination of nearest neighbor and Balanced Iterative Reducing and Clustering using Hierarchies (BIRCH) clustering with dynamic markov chains has shown promise in detecting rare events in spatiotemporal environments using sensor and traffic data [52].
4.4 Statistical Modeling
Statistical models are algorithms that apply statistics and mathematics concepts to generate a representation of data, which is then analyzed to determine any relationships or discover insights. Statistical approaches like Autoregressive Integrated Moving Average (ARIMA) modeling and Vector Autoregression (VAR) have been used in rare event prediction [18, 130]. ARIMA is an autoregressive statistical model that predicts future values based on past values. Alestra et al. have utilized ARIMA modeling separately for each aircraft to predict the degradation behavior over time [18]. Vector Autoregression follows a stochastic process model that captures linear interdependencies among multiple time series using a linear function of past values of each variable. [130] explored VAR in evaluating the LSTM-Autoencoder model developed.
The Gumbel copula function is a statistical modeling technique in copula-based algorithms utilized in rare event research. Copulas are mathematical functions used to model the dependence structure between random variables. They describe the joint distribution of variables by connecting their marginal distributions. The Gumbel copula function, specifically, is a type of copula that is based on the Gumbel distribution. It is commonly used to model extreme-value dependence, making it suitable for applications involving rare events or extremes. It captures the tail dependence between variables, which is vital in scenarios where the behavior of variables in the extreme tails is of interest [117].
4.5 Meta-Heuristic Optimization
Meta-heuristic algorithms are optimization techniques for solving complex problems by iteratively exploring and exploiting the search space to find near-optimal solutions [163]. These algorithms, such as particle swarm optimization and the bat algorithm, have been applied to improve efficiency and scalability on large imbalanced healthcare data, [65], and genetic algorithms have been utilized for learning to predict rare events in categorical time series data [3]. Additionally, evolutionary ensemble algorithms have shown promise in enhancing the identification rate of minority classes in rare event-based imbalanced datasets [164].
4.6 Advanced Learning Methods
Recently, advanced learning methods like Attention-based mechanisms, Markov methods, Active learning, and Meta-learning have emerged to tackle the challenges posed by rare event datasets. These approaches strive to enhance predictive capability by leveraging temporal dependencies, probabilistic modeling, and selective data labeling.
4.6.1 Attention-based mechanisms
Attention mechanisms enable the model to selectively concentrate on important input elements for accurate predictions while disregarding less relevant parts. This has gained attention in rare event research as well. For instance, Liu et al. proposed a fault diagnosis approach using one-dimensional CNN, Gated Recurrent Unit (GRU), and attention mechanisms, combined with knowledge graphs, to achieve more precise predictions in bearing fault detection [46]. Additionally, Xu et al. have utilized attention-based-LSTM and Extra-Tree models for fault mode and severity prediction based on bearing datasets, while Ravindranath et al. introduced the M2NN architecture with an attention mechanism for post-traumatic seizure detection, demonstrating its effectiveness in finding unusual seizures in EEG data [47, 22]. Kulkarni and team utilized soft-attention CNN for rare marker event detection and localization in well-logs [165]. These attention-based methods have proven useful in handling rare event detection tasks, such as anomaly detection in manufacturing, rare disease diagnosis, and identifying specific rare occurrences in multiple domains.
4.6.2 Markov methods
Markov models represent the Markov property, which asserts that the prediction of an outcome depends only on information about the current state and is independent of the previous sequence of events. Extensible Markov Models (EMM) and Monte Carlo methods are among the markov methods adopted in rare event literature.
I) Extensible Markov Models (EMM): Extensible Markov Models (EMM) are a dynamic variation of traditional static Markov models. They excel in modeling spatiotemporal data and have proven to help predict spatiotemporal events, including rare occurrences, by capturing spatial, temporal, and unusual event transitions [166]. Meng et al. [52] introduced an approach that combines clustering and EMM for rare event detection in spatiotemporal data, particularly sensor and traffic data. Their contribution lies in modeling the transitions between rare and typical events using EMM, effectively detecting rare occurrences.
II) Monte Carlo methods: Monte Carlo methods, also called Monte Carlo simulations, are probabilistic mathematical techniques that estimate the possible outcomes of uncertain events. In rare event estimation, Monte Carlo methods have been applied to estimate model uncertainty, such as using Monte Carlo Dropout to create multiple predictions and measuring the standard deviation of detection depths as a proxy for uncertainty [165]. Additionally, they have been used to predict rare events using trajectory data and unscheduled aircraft maintenance actions [167, 168, 111, 99, 112, 169, 170, 88].
4.6.3 Active learning
Active learning is a learning strategy that iteratively chooses the most instructive or uncertain instances from a pool of unlabeled data and asks an oracle (such as a human expert or a pre-existing labeled dataset) to annotate their labels [171]. Recent research efforts have been to predict rare events using active learning, exemplified by studies like [113, 106]. Dhulipala et al. [113] proposed a methodology for rare event simulation by combining active learning and multi-fidelity modeling, which leverages multiple levels of models’ fidelity (accuracy or complexity) to predict outcomes efficiently. Deep Neural Operators (DNOs), like DeepONet [172], are nonlinear operators created to handle systems with infinite dimensions, making them highly effective surrogate models for precisely representing extreme events. Pickering et al. [106] introduced a Bayesian-inspired framework based on active learning for DNOs, specifically designed for discovering and quantifying extreme events, focusing on uncertainty quantification.
4.6.4 Meta learning
Meta-learning, or "learning to learn", is a machine learning approach focusing on training models to effectively adapt and generalize to new tasks or domains with minimal data. It can be applied to rare event prediction by training a model on various rare event scenarios. With limited data, it can rapidly adapt and accurately predict new and infrequent events. The advantage of meta-learning over other advanced learning approaches lies in its ability to dynamically adapt and integrate different predictive techniques, a faster and cheaper training process, thus enhancing the model’s generalization capability and performance across varied scenarios. Several studies [128, 129, 142] have looked at how meta-learning techniques can be used to improve failure prediction in different areas, such as large-scale computing systems and acoustic event detection, by dynamically combining base methods and improving accuracy in situations with few labeled data. While this existing research primarily focuses on failure prediction, it is worth noting that no prior studies have specifically addressed the prediction of rare events using meta-learning techniques.
4.7 Comparison of algorithmic approaches
Table 6 offers a comparative analysis of the diverse approaches discussed in the preceding section, considering a range of algorithmic indicators. We use 12 algorithmic indicators based on four major factors: computational efficiency, model analysis and understanding, data availability, and model performance. Explanations of the considered algorithmic indicators are as follows, which we derived from the comprehensive analysis of the papers reviewed in this study.
| Major Factor | Algorithmic Indicator |
|
Clustering |
|
|
|
||||||||
|
|
✓* | ✓ | ✓ | ✓ | ✓* | ||||||||
|
✓* | ✓ | ✓ | ✓ | ✓* | |||||||||
|
✓* | ✓ | ✓ | ✓ | ✓* | |||||||||
|
✓* | ✓* | ✓* | ✓* | ✓* | |||||||||
|
|
✓ | - | ✓ | - | ✓ | ||||||||
|
✓ | - | ✓ | - | ✓ | |||||||||
| Interpretability | ✓ | - | - | - | ✓ | |||||||||
|
|
✓ | - | ✓ | ✓ | ✓ | ||||||||
|
- | ✓ | - | - | ✓ | |||||||||
|
|
✓ | - | ✓ | ✓* | ✓ | ||||||||
|
✓ | - | ✓ | ✓* | ✓ | |||||||||
| Generalization | ✓ | ✓ | ✓ | ✓ | ✓ |
∗includes variability- depends on specific factors such as the problem domain, dataset, or implementation
-
1.
Training time: Indicates the time required to train the model.
-
2.
Memory usage: Reflects the memory required for training and storing the model.
-
3.
Model size: Represents the model’s size in terms of parameters.
-
4.
Feature importance: Refers to the ability of the algorithm to provide insights into the importance of different features.
-
5.
Model explainability: Indicates the ease of understanding the model’s outcomes.
-
6.
Generalization: Reflects the model’s ability to perform well on unseen or test data.
-
7.
Model complexity: Describes the complexity of the model in terms of its structure or mathematical formulation.
-
8.
Labeled data: Indicates that the algorithms require labeled data for training, which is typical for supervised learning tasks.
-
9.
Unlabeled data: Leverage unlabeled data in unsupervised learning scenarios.
-
10.
Performance on large data: Suggests that the algorithms perform well on large datasets.
-
11.
Ability to handle noise: Can handle noise effectively, making them robust to noisy data.
-
12.
Interpretability: Enabling a better understanding of the model’s decision process.
Table 7 analyses algorithmic approaches, rarity groups, downstream tasks, modalities, dataset types, and data processing tasks based on our reviewed papers. Predominantly, research has centered on classifying numeric rarity within real datasets, showcasing a blend of various data processing methodologies. Limited research is dedicated to alternative downstream tasks such as clustering, forecasting, simulation, and diverse modalities encompassing text, images, and audio.
| Algo. Group |
|
|
Papers |
|
|
Modality |
|
|
|||||||||||||||||||
|
|
|
|
R4, R1 | CF, FT | I,TX, N | RE, DE, SI | SL, FE, DC, FS | |||||||||||||||||||
|
|
R1,R2,R3,R4 | CF | N, A, I | SI, RE, SY | SL, FE, DC, FS | |||||||||||||||||||||
| Autoencoders |
|
R1 | CF | N | RE | SL, FE, DC, FS | |||||||||||||||||||||
|
Random Forest |
|
R1, R2 | CF | N | RE | FE, DC, FS | ||||||||||||||||||||
|
|
R1, R2, R3 | CF | N | RE | SL, FE, DC, FS | |||||||||||||||||||||
|
[7] | R1 | CF | I | RE, DE | FE | |||||||||||||||||||||
|
|
[23, 8, 94, 24] | R1,R2,R3,R4 | CF | N, TX | RE, SY, DE | SL, DC, FS | ||||||||||||||||||||
|
|
[58] | R1, R2 | CF | N | RE | FE, DC | ||||||||||||||||||||
|
SVM |
|
R1, R4, R2, R3 |
|
N, TX | RE, SI | SL, DC, FS | ||||||||||||||||||||
|
|
|
R1, R2, R3 |
|
N, I | RE, DE | SL, DC, FE | ||||||||||||||||||||
|
|
|
R1, R2, R3, R4 | CL | N, I | RE, DE | SL, FE, DC, FS | ||||||||||||||||||||
|
|
[117] | R1 | CF | N | RE | FE, DC, FS | ||||||||||||||||||||
|
[18] | R1 |
|
N | DE | FE, DC, FS | |||||||||||||||||||||
|
[130] | R1, R2, R3, R4 | CF | N | RE | FE, DC, FS | |||||||||||||||||||||
|
|
[65, 3, 164] | R1, R2, R3, R4 | CF | N | RE , DE | SL | ||||||||||||||||||||
|
|
[46, 47, 22, 165] | R1, R2, R3, R4 | CF | N | RE | SL, FE, DC, FS | ||||||||||||||||||||
|
|
|
R1, R2, R3, R4 | CF, FT, RG | N |
|
SL, FE, DC, FS | ||||||||||||||||||||
|
|
R1 | FT, SM, CF | N, I | SI, RE | SL, FE, DC, FS | |||||||||||||||||||||
∗N-Numeric, TX-Textual, I-Image, A-Audio, T-Time series, FT-Forecasting, CL-Clustering, CF-Classification, RG-Regression, RE-Naturally rare, DE-Derived, SI-Simulated, SY-Synthetic, SL-Sampling, FE-Feature engineering, DC-Data cleaning, FS-Feature selection
This section extensively examined different algorithmic approaches applied in rare event prediction. This comprehensive assessment yielded valuable insights into the capabilities and constraints of these algorithms when dealing with imbalanced rare event datasets. The findings contribute to a better understanding of the diverse strategies employed in rare event prediction research and highlight the importance of selecting appropriate algorithms based on specific downstream tasks and modality requirements.
5 Evaluation Approaches
As machine learning models are developed, measuring the performance of every model is critical. Multiple evaluation metrics are employed in machine learning depending on the model and the results produced. This section focuses on the varied evaluation aspects used in rare event prediction. Firstly, we will highlight the significance of evaluation concerning rare event studies, followed by the evaluation methodologies and performance metrics used in related studies.
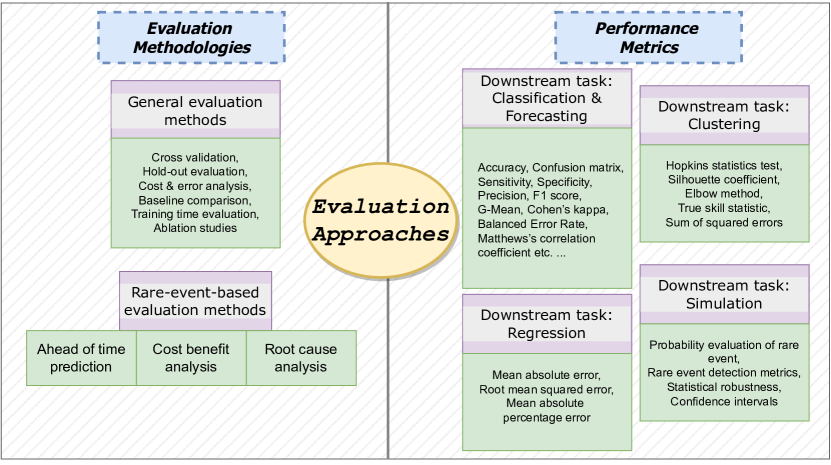
5.1 Significance of evaluation
Evaluation in rare event prediction research plays an integral role as it allows the assessment of the model’s performance in accurately identifying and predicting rare events. Due to the imbalanced nature of rare events, traditional evaluation metrics might not provide a comprehensive assessment, making it vital to employ specialized evaluation techniques that focus on both overall performance and the ability to detect rare occurrences. Figure 10 depicts the evaluation approaches we identified in rare event literature grouped into their evaluation categories.
5.2 Evaluation Methodologies
Evaluation methodologies in rare event prediction research involve general and rare event-specific approaches. General methods find widespread application in diverse machine learning tasks, while rare event-specific metrics are tailored to address the unique challenges and requirements of predicting rare events.
5.2.1 General evaluation methods
In rare event prediction research, various general evaluation methods are employed to assess the performance of algorithmic approaches, as presented in Table 8. Cross-validation techniques, such as K-Fold, Stratified K-Fold, and Leave-One-Out are commonly used for performance estimation [90, 13, 24, 67, 57, 56, 144, 9, 23, 14, 38]. Furthermore, holdout evaluation through random splitting [67, 14, 46, 12] and time-based splitting [89, 67, 88] is utilized to create distinct train-test datasets, facilitating the process of model training and evaluation. Analysis with standard baselines, cost and error analysis, training time evaluation [20, 20], and ablation studies [7] for understanding individual components’ contributions are among the general evaluation approaches employed in this field.
| Evaluation methodology | Sub methods | Papers | Rarity group | Algorithmic approach | Modality |
|
||||||||
|---|---|---|---|---|---|---|---|---|---|---|---|---|---|---|
| Cross validation methods | K-Fold Cross-Validation |
|
R1, R2 |
|
N, I, TX | DE, RE | ||||||||
| LOOCV , Stratified K-Fold |
|
R1, R2, R4 |
|
I, N, TX | RE | |||||||||
|
Random Split |
|
R1, R4 |
|
N | RE | ||||||||
| Time-Based Split |
|
R1,R3,R4 |
|
N | DE, RE | |||||||||
|
[73, 20, 89, 88] | R1, R2, R3, R4 |
|
|
|
|||||||||
| Training time evaluation | [20, 38] | R1 |
|
N | RE | |||||||||
| Ablation studies | [7] | R1, R4 | K-means, One-class learning | I, N | DE |
∗N-Numeric, TX-Textual, I-Image, A-Audio, T-Time series, RE-Naturally rare, DE-Derived, SI-Simulated, SY-Synthetic
5.2.2 Rare event-specific evaluation methods
Evaluation methods that are specific to rare events emphasize early detection, proactive decision-making, and economic feasibility in the prediction task. We identified several methods below as specific to rare events as presented in Table 9.
I) Ahead-of-time prediction evaluation: Ahead-of-time prediction evaluation assesses a model’s predictive capability for events or outcomes occurring multiple time steps into the future. This approach contrasts with the usual prediction evaluation, which focuses on predicting the immediate next event or outcome. Evaluating models "ahead of time" is particularly important in scenarios where early detection and proactive decision-making are critical. In the studies by [20, 154, 88], the performance of the proposed models has been evaluated over various lead times, ranging from one to many units of time. It was observed that while the accuracy of the models might decrease as the lead time increases, their performance has remained stable, demonstrating their potential utility in providing valuable insights well before the occurrence of rare events, such as black-swan or equipment failures.
II) Cost-benefit analysis: Cost-benefit analysis has been used to assess rare event prediction’s economic feasibility and potential advantages. Methods like assessing potential financial loss reduction, optimizing resource allocation, and evaluating the potential mitigation of losses or damages are utilized to quantify and compare the costs and benefits linked to early prediction of rare events, as explored in [38] and [37].
III) Root cause analysis: This could be viewed as a problem-solving approach focused on discerning the fundamental elements contributing to rare occurrences. It involves investigating and tracing the chain of events to determine the fundamental causes [38].
| Evaluation methodology | Papers | Rarity group | Algorithmic approach | Modality |
|
|||||
|---|---|---|---|---|---|---|---|---|---|---|
|
|
R1, R3 |
|
N | RE, DE | |||||
| Cost-benefit analysis | [38, 37] | R1 |
|
N | RE | |||||
| Root cause analysis | [38] | R2 |
|
N | RE |
∗N-Numeric, TX-Textual, I-Image, A-Audio, T-Time series, RE-Naturally rare, DE-Derived, SI-Simulated, SY-Synthetic
5.3 Performance metrics
Performance metrics aid in monitoring and measuring the performance of algorithmic approaches, facilitating comparison of algorithms, determining optimal thresholds, optimizing models, supporting data-driven decision-making, and conducting risk assessments. We categorize these performance metrics, which differ based on the downstream tasks involved. The detailed analysis of performance metrics and rarity groups, algorithmic approaches, modality, and dataset types is included in Table 11.
I) Downstream tasks: Classification and Forecasting
i) Accuracy: Evaluating machine learning model accuracy is essential, particularly in imbalanced scenarios, where relying solely on accuracy can be deceptive. Since accuracy only assigns overall class weights rather than weights for unusual classes or minorities. Zhao et al., in their research [23], state that most standard classifiers, like LR and SVM, implicitly assume the equal occurrence of both classes. These methods maximize the classification accuracy and favor the majority class, resulting in poor sensitivity toward the minority class. Alestra et al. [18], take the accuracy of the forecast of failure events at a given point in time, so they have a prediction of failure at each instant. Some researchers modify the accuracy metric and propose variants in the evaluations. [10] formulates two measures: Faulty-normal accuracy (FNACC) and Real faulty-normal accuracy (RFNACC). FNACC measures the accuracy of correctly classifying normal samples preceding a faulty instance, while RFNACC measures the accuracy of correctly classifying normal samples preceding a real faulty instance.
ii) Confusion matrix, Sensitivity (Recall), Specificity/True Negative Rate (TNR), False Positive Rate (FPR), False Negative Rate (FNR), Precision, F1 score: Most researchers have used the Confusion matrix, Sensitivity (Recall), Specificity/TNR, FPR, FNR, Precision, F1 score [23, 13, 37, 47, 46, 7, 24, 25, 73, 23, 25, 96, 88, 88, 23, 13, 37, 47, 22, 165, 69] metrics in evaluation. In highly imbalanced datasets, metrics such as specificity and sensitivity are considered more appropriate than accuracy [25, 8]. Apart from the primary evaluation matrices, precision, recall, and f1-score, Kulkarni et al. have employed derived metrics, ML detection depth, for each marker type and the error between the ML marker and the manual markers in geological layers [165].
iii) Geometric Mean (G-Mean): Geometric Mean (G-Mean) is a relative error metric, a combined metric of sensitivity and specificity that measures the balance between classification performances in the majority and minority classes. A low G-Mean indicates poor performance in classifying positive instances, even if negative cases are accurately categorized. G-mean has been used in imbalanced datasets to predict rare events [24, 27, 31, 88].
iv) Cohen’s kappa index: Cohen’s kappa index is a metric that has been used in earth science and healthcare-based rare event prediction evaluation for use cases like landslide prediction[35], hazardous seismic bumps in coal mines, detecting changes in geospatial trajectories [139], [8], mineral prospectivity prediction [152] and thoracic events prediction [65]. [8] has selected Kappa as the primary evaluation metric since it indicates the generalizability of the classifier’s predictive ability on the supplementary datasets. However, some research attempts have proven that the Kappa metric produces unreliable results due to its high sensitivity to the distribution of the marginal totals [174].
v) Balanced Error Rate (BER): Balanced Error Rate (BER) measures the average of the errors for each class in a classification problem, which has utilized citeli2017rare, iyer2015statistical in rare event evaluation.
vi) Matthews’s correlation coefficient (MCC): Matthews’s correlation coefficient (MCC) is a more accurate statistical rate that produces a high score when the prediction achieves excellent results for True positives (TP), False negatives (FN), True negatives (TN), and False positives (FP), proportional to the size of both positive and negative elements in the dataset [174, 8]. Basically, it computes correlation coefficients for the true and predicted labels, where the higher the coefficients, the better the prediction.
v) AUC, AUPRC, PR curve, and ROC: AUC summarizes the trade-off between TPR and FPR. AUPRC evaluates the area under the Precision-Recall (PR) curve and summarizes the trade-off between TPR and true predictive rate. [35] used metrics like ROC, AUC, and AUPRC (Area Under Precision-Recall Curve) in evaluation. He et al. [94] demonstrated that their proposed algorithms achieved larger AUC values compared to several baseline algorithms, while Xiu et al. [96] utilized AUC and ROC as threshold-free evaluation metrics and also considered the PR curve for rare event prediction evaluation. Some studies claim that the ROC curve is insensitive and is not applicable in rare event evaluations [18, 175, 115, 118]. ROC is suspected of bringing false alarms in an unrealistically optimistic and misleading manner, with the number of nonevent states labeled as equivalent to events. Using experiments [175, 118] proves AUPRC to be a more precise and less hypeable evaluation of the accuracy of rare event classifiers.
vi) Cost matrix: A cost matrix specifies the relative importance of accuracy for different classification predictions by assigning costs or weights to various classification predictions. In a cost matrix, positive numbers (costs) influence negative outcomes, whereas negative numbers (benefits) influence positive outcomes. An instance is [57], which tries to minimize the cost matrix for binary misclassification using threshold and tree-based classification models.
vii) Top-decile lift (TDL): Top-decile lift (TDL) is a metric used in the economic domain that compares the incidence in the top ten percent of samples with the highest model predictions to the incidence of the entire sample [176]. [144] used TDL and assumed it returned the customers predicted to be most likely to churn rather than a random selection.
viii) Reconstruction error: Reconstruction error measures the discrepancy between the original input data and its reconstructed version generated by a model by quantifying how well the model can reproduce the input data. In models like autoencoders, the model is trained to reconstruct its input data from a compressed latent representation [130].
ix) Moran index: Moran Index is a metric used in spatial analysis and statistics that measures a variable’s spatial autocorrelation or clustering within a geographic space. It calculates the degree of similarity or dissimilarity between neighboring locations based on the values of the analyzed variable. It provides a measure of spatial dependence, indicating whether similar values tend to cluster together (positive spatial autocorrelation) or are dispersed (negative spatial autocorrelation) [117].
II) Downstream task: Clustering
i) Hopkins statistics test: Unsupervised learning algorithms utilize diverse evaluation metrics, including the Hopkins statistics test, to assess the clustering tendency of datasets. In Omar et al.’s study [4] on exploring clusters of rare events using unsupervised random forests, the proximity plot suggested promising cluster tendency, as evidenced by a better Hopkins statistics test value for the optimal number of clusters identified.
ii) Silhouette coefficient: The silhouette coefficient is another metric used for internal cluster validation. A small silhouette coefficient width suggests that many data objects have been positioned within the boundary of other clusters [4].
iii) Elbow method: The elbow method is employed to identify the optimal number of clusters, as demonstrated in a clustering-based undersampling approach for handling class imbalance [21]. This study concentrates on detecting minority or positive classes, evaluating performance using sensitivity and specificity, and generating ROC curves with different sensitivity and specificity cutoffs.
iv) True Skill Statistic (TSS): True Skill Statistic (TSS) is a metric used to evaluate the performance of machine learning-based species distribution modeling by combining sensitivity and specificity in a confusion matrix into a singular measure that assesses the accuracy of both positive and negative predictions [177]. TSS is reportedly more robust in prediction tasks, and it has been used to evaluate the SVM models in solar flare forecasting [90].
v) Sum of Squared Errors (SSE): SSE represents the sum of the squared differences between each observation and the group mean. It measures variation within a cluster [45].
II) Downstream task: Regression
i) Mean Absolute Error (MAE) and Root Mean Squared Error (RMSE), Mean Absolute Percentage Error (MAPE): MAE or Mean Absolute Deviation (MAD), RMSE, and MAPE or Mean Absolute Percentage Deviation (MAPD) are popular scale-dependent metrics used in evaluation. RMSE is calculated by multiplying the square root of the mean of the squared differences between the model’s predictions and the actual data. MAE is derived by averaging the absolute differences between the actual values and the model’s predictions. Through MAPE, a forecast system’s accuracy or forecast error is measured. It calculates the average absolute percent inaccuracy for each time period, excluding actual values, and divides by actual values to compute this accuracy as a percentage. To evaluate the quantitative performances of the proposed model, the MAE and RMSE have been selected as the regression loss functions by Xu et al. [47]. RMSE, MAE, and MAPE have been used in rare event inference through multivariate multiscale attention research [22].
III) Downstream task: Simulation
i) Probability evaluation of rare event: This metric directly measures the likelihood of the rare event occurring. It provides a quantitative assessment in a simulation of the occurrence of the event of interest [99, 113, 111].
ii) Rare event detection metrics: The standard metrics that evaluate the performance of algorithms designed to predict rare events like precision, recall, F1 score, and Area Under the Receiver Operating Characteristic Curve (AUC-ROC), RMSE, have also been utilized in simulation evaluations [99, 111].
iii) Statistical robustness: Statistical robustness refers to the ability of a statistical model to produce reliable and consistent results under different conditions, like varying sample sizes, distributional assumptions, or data perturbations [99].
iv) Confidence intervals: This metric provides a range of values within which the actual value of a performance metric is expected to fall and quantifies the uncertainty associated with the estimated performance metric [111].
| Downstream task | Performance metric | Papers | Rarity group | Algorithmic approach | Modality |
|
|||||||||||||||
|---|---|---|---|---|---|---|---|---|---|---|---|---|---|---|---|---|---|---|---|---|---|
|
Accuracy |
|
R4, R1,R2 |
|
A, N, TX | RE, DE | |||||||||||||||
|
|
R1, R3,R4, R2 |
|
A, N, TX | RE, DE | ||||||||||||||||
| Geometric Mean (G-Mean) |
|
R1, R3,R4, R2 |
|
N | DE, RE | ||||||||||||||||
| Cohen’s Kappa Index |
|
R1, R2, R3 |
|
N, I | Real | ||||||||||||||||
| Balanced Error Rate | [139] | SVM | N | ||||||||||||||||||
| Matthews’s correlation coefficient | [8] | R3 |
|
N | RE | ||||||||||||||||
| PR curve, ROC, AUC and AUPRC |
|
R1, R4, R2 |
|
A, N, TX | DE, RE | ||||||||||||||||
| Cost matrix | [57] | R2 | RF, LR, XGB | N | RE | ||||||||||||||||
| Top-decile lift | [144] | Hybrid | N | RE | |||||||||||||||||
| Reconstruction error | [130, 40] | R1 |
|
N | RE | ||||||||||||||||
| Moran index | [117] | R1 | Statistical Modeling | N | RE | ||||||||||||||||
|
Hopkins statistics test | [4] | R2 |
|
N | RE | |||||||||||||||
| Silhouette coefficient | [4] | R3 |
|
N | RE | ||||||||||||||||
| Elbow method | [21] | R1, R2 | K-Medoids clustering | N | RE | ||||||||||||||||
| True Skill Statistic | [90] | R1, R2 | Kernel-based methods - SVM | N | DE | ||||||||||||||||
| Sum of Squared Errors | [45] | R4 | K-nearest neighbur | N | RE | ||||||||||||||||
|
|
[47, 22] | R1, R3, R4 |
|
N | RE | |||||||||||||||
|
Probability evaluation of rare events |
|
R1,R2,R3,R4 |
|
N | SI | |||||||||||||||
| Rare event detection metrics | [99, 111] | R1,R2,R3,R4 |
|
N | SI | ||||||||||||||||
| Statistical Robustness | [99] | R1,R2,R3,R4 |
|
N | SI | ||||||||||||||||
| Confidence intervals | [111] | R1,R2,R3,R4 | LR, Monte carlo | N | SI |
∗N-Numeric, TX-Textual, I-Image, A-Audio, T-Time series, RE-Naturally rare, DE-Derived, SI-Simulated, SY-Synthetic
5.3.1 Analyzing evaluation approaches vs. rarity groups, modality, type of data and algorithmic approaches
Based on our literature review, the analysis of general evaluation methods, rare event-specific evaluation methods, and performance metrics, along with their respective components, is summarized in Tables 8, 9 and 11. The analysis highlighted that standard techniques like cross-validation have predominantly been employed in datasets encompassing numerical, textual, and image data, particularly in extremely-rare and very-rare categories. Only limited research has been dedicated to rare event-specific evaluation methods applied to numerical data. In classification and forecasting, widely used performance metrics such as accuracy, precision, recall, AUC, and ROC have been employed for evaluation, regardless of the data modalities. However, evaluation has predominantly been conducted on numerical data for other downstream tasks like clustering, regression, and simulation. Moreover, our analysis reveals the limited availability of rare event-specific evaluation techniques and highlights the need for conceptualized evaluation methodologies explicitly designed for rare event prediction. Such tailored approaches would be essential to address the unique challenges of rare events.
In conclusion, we presented a comprehensive analysis of various evaluation approaches used in rare event prediction. Through this examination, we gained valuable insights into the suitability and limitations of different evaluation methodologies and performance metrics for handling rare events. The findings underscore the significance of choosing appropriate metrics tailored to specific downstream tasks and modalities. It emphasizes the need for rare event-specific evaluation methods to address the challenges of rare events, aiming for accurate and reliable assessments for effective rare event prediction.
6 Research Findings and Discussion
This section provides an overview of the research findings, emphasizing identified gaps, and open challenges in the field. It also explores emerging research trends and novel approaches, aiming to address the complexities of rare event prediction and drive advancements in the field. We have also formulated a forward-looking vision to assist researchers in navigating future initiatives within this field.
6.1 The gaps in current literature
-
1.
Lack of standardized benchmark datasets: The absence of widely accepted benchmark datasets for rare event prediction makes it challenging to compare the performance of different algorithms and approaches consistently.
-
2.
Imbalanced data handling techniques: While many studies explore imbalanced event data handling methods, there is a need for more in-depth investigation and comparison of various techniques, especially for handling extreme rarity.
-
3.
Scalability issues: Some algorithms and methods may face scalability challenges when dealing with large-scale rare event datasets, necessitating more research on efficient and scalable approaches.
-
4.
Limited focus on uncertainty quantification: Understanding model uncertainty is crucial for rare event prediction, yet there is a lack of comprehensive studies on uncertainty quantification techniques for these scenarios.
-
5.
Real-world applicability: More research is needed to assess the practical usability and robustness of rare event prediction models in real-world scenarios, such as in domains with critical applications like healthcare, finance, or disaster prediction.
-
6.
Limited focus on rare event-specific evaluation techniques: Many studies still rely on general evaluation metrics designed for balanced datasets, which may not adequately capture the performance of models in rare event scenarios.
-
7.
Limited ways to measure data quality: How to measure data quality in data sampling and augmentation in rare event data processing is a problem.
6.2 Open challenges of rare event prediction
Based on our study, below are some open issues and challenges in the field of rare event prediction that we identified:
-
1.
Lack of annotated data: An inherent obstacle in rare event prediction resides in the scarcity of annotated data. Collecting and annotating data about rare events proves complex and time-intensive, posing a hurdle in developing proficient prediction models.
-
2.
Bias in data: Biases present in data can substantially influence the efficacy of prediction models, potentially resulting in inaccurate forecasts. For instance, biased sampling or labeling of rare events can give rise to erroneous predictions.
-
3.
Generalization: Rare event prediction models must be able to generalize to new and unseen data. When dealing with rare events, achieving generalizability can be challenging, as the data distribution may differ significantly from the training data.
-
4.
Interpretability: The complexity and interpretational challenges posed by rare event prediction models can be particularly problematic in domains like healthcare or finance, where interpretability holds significance.
-
5.
Scalability: Numerous rare event prediction models entail substantial computational demands and struggle with scalability when applied to sizable datasets, making advancements in scalability an essential avenue of research within this domain.
6.3 Research trends in rare event prediction
Research in rare event prediction has surged in recent years due to the increasing importance of rare events in many fields. Some of the research trends in this area include:
-
1.
Incorporation of domain knowledge: Researchers are exploring ways to incorporate domain knowledge, expert opinions, and human insights into rare event prediction. These can involve developing frameworks that combine data-driven and algorithmic approaches with qualitative knowledge, knowledge graphs, expert systems, or rule-based models to improve the robustness and reliability of predictions.
-
2.
Explainability: The growing emphasis on transparency and comprehension in model predictions has led to the rise of explainability as a prospective future trend in rare event prediction research. This development aims to enhance decision-making processes and foster trust in the accuracy of models.
-
3.
Ensemble methods: Ensemble methods involve combining multiple classifiers to improve prediction performance. These methods are particularly effective in handling imbalanced datasets.
-
4.
Meta-learning, few-shot learning, and transfer learning: Meta-learning and few-shot learning can enhance rare event prediction by enabling model learning from related events and generalization to new and infrequent events with limited labeled data, thus improving adaptability and accuracy. Transfer learning is a meta-learning technique that involves using knowledge from one domain to improve learning in another. This approach is promising in rare event prediction, where data from different domains can be leveraged to improve predictive performance.
-
5.
Rare event learning through multi-modal data: Integrating information from multiple data sources and modalities would improve rare event predictive power, generalization, and robustness while uncovering hidden patterns. However, it also presents challenges related to data integration, feature engineering, and model complexity.
-
6.
Uncertainty quantification with rarity: Uncertainty Quantification (UQ) is gaining prominence as a future trend in rare event prediction. It involves quantifying and characterizing uncertainties associated with predictions, offering insights into the reliability and confidence of estimates. By incorporating UQ techniques, decision-makers can make more informed choices, assess risk, optimize resource allocation, and enhance the robustness of strategies to mitigate the impacts of rare events. These can incorporate advancements using probabilistic modeling, Bayesian inference, and Monte Carlo simulations.
7 Vision Forward
As the methods, data, and applications for predicting rare events continue to advance, we can see how it will affect tasks beyond prediction. We envision that it will have a significant impact on three specific areas: improving our understanding of causality, using process knowledge workflows to predict rare events, and implementing automated planning strategies to mitigate them effectively. This is illustrated in Figure 11.
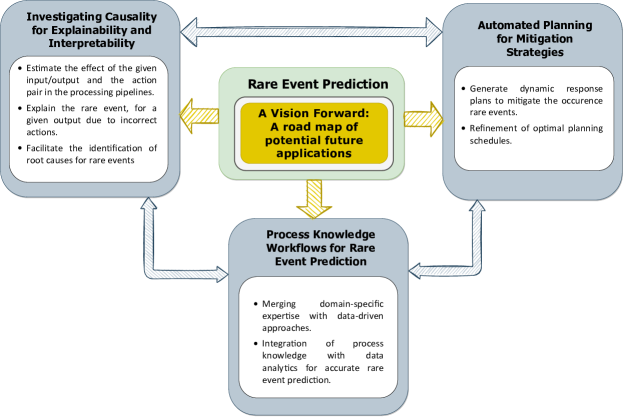
-
1.
Investigating causality for explainability and interpretability
An integral component of our strategy entails delving deeper into causality, which will aid us in delivering more lucid explanations. This requires us to gauge the influence of individual input-output associations and actions. In doing so, we can deduce the causes of infrequent occurrences and determine which actions by sub-systems, robots, or simulators triggered them. By comprehending causality in this manner, we can uncover the underlying reasons behind rare events and plan mitigation procedures accordingly.
-
2.
Process knowledge workflows for rare event prediction
Another direction for rare-event prediction entails the integration of process knowledge workflows into the prediction of rare events. This methodology enhances rare event prediction by integrating domain-specific procedural knowledge with data-driven approaches. This integration has the potential to reveal nuanced abnormalities and disparities that may not be readily apparent, hence leading to more accurate and efficient rare-event prediction.
-
3.
Automated planning for mitigation strategies
Lastly, the road map toward advanced rare-event prediction applications envisions the integration of automated planning techniques. Once rare events are detected and understood, the next step involves devising effective mitigation strategies. Automated planning aims to generate dynamic response plans that can mitigate the impact of rare events. These strategies can encompass various scenarios, offering a comprehensive and adaptable framework for handling unexpected, uncertain occurrences.
In essence, a forward-thinking approach to predicting rare events relies on three crucial components: exploring causes, following knowledge workflows, and implementing automated planning. These components are intricately connected, with each one capable of informing and enhancing the others. For instance, investigating causes can help detect abnormal occurrences and irregularities in knowledge workflows, while insights gained from knowledge workflows can improve automated planning techniques aimed at preventing rare events. By identifying the causes of rare events through exploration, mitigation strategies can be developed in automated planning, and optimized strategies can be used to manipulate variables and gain a better understanding of the causal relationships between factors and rare events. Ultimately, this collaborative approach generates a more comprehensive and holistic framework for predicting rare events across various domains, as information and insights are exchanged between the three elements.
8 Conclusion
This paper presents a detailed analysis of rare event prediction, encompassing rare event data, data processing, algorithmic and evaluation approaches. Through our examination of the current literature, we identified several gaps and challenges in the field, highlighting the need for specialized evaluation techniques and their integration. As rare events continue to play a vital role in diverse domains, such as manufacturing, healthcare, finance, and earth sciences, addressing these challenges will foster the development of more robust and accurate prediction models. By embracing emerging research trends and leveraging advanced learning methods, we can unlock new opportunities to enhance the prediction and management of rare events, ultimately contributing to safer and more efficient decision-making processes. As the field evolves, interdisciplinary collaboration and innovative solutions will pave the way for transformative advancements in rare event prediction.
9 Acronyms
10 Acknowledgments
This work is supported in part by NSF grants #2133842, "EAGER: Advancing Neuro-symbolic AI with Deep Knowledge Infused Learning", and #2119654, "RII Track 2 FEC: Enabling Factory to Factory (F2F) Networking for Future Manufacturing". Any opinions, findings, conclusions, or recommendations expressed in this material are those of the authors and do not necessarily reflect the views of the NSF.
References
- [1] David C Harrison, Winston KG Seah, and Ramesh Rayudu. Rare event detection and propagation in wireless sensor networks. ACM Computing Surveys (CSUR), 48(4):1–22, 2016.
- [2] Paul Glasserman, Philip Heidelberger, Perwez Shahabuddin, and Tim Zajic. Multilevel splitting for estimating rare event probabilities. Operations Research, 47(4):585–600, 1999.
- [3] Gary M Weiss and Haym Hirsh. Learning to predict rare events in categorical time-series data. In International Conference on Machine Learning, pages 83–90, 1998.
- [4] ZA Omar, SN Chin, SRM Hashim, and N Hamzah. Exploring clusters of rare events using unsupervised random forests. In Journal of Physics: Conference Series, volume 2314, page 012019. IOP Publishing, 2022.
- [5] Henry X Liu and Shuo Feng. "curse of rarity" for autonomous vehicles. arXiv preprint arXiv:2207.02749, 2022.
- [6] Aito Fujita, Ken Sakurada, Tomoyuki Imaizumi, Riho Ito, Shuhei Hikosaka, and Ryosuke Nakamura. Damage detection from aerial images via convolutional neural networks. In 2017 Fifteenth IAPR international conference on machine vision applications (MVA), pages 5–8. IEEE, 2017.
- [7] Ryuhei Hamaguchi, Ken Sakurada, and Ryosuke Nakamura. Rare event detection using disentangled representation learning. In Proceedings of the IEEE/CVF Conference on Computer Vision and Pattern Recognition, pages 9327–9335, 2019.
- [8] Jinyan Li, Simon Fong, Shimin Hu, Victor W Chu, Raymond K Wong, Sabah Mohammed, and Nilanjan Dey. Rare event prediction using similarity majority under-sampling technique. In Soft Computing in Data Science: Third International Conference, SCDS 2017, Yogyakarta, Indonesia, November 27–28, 2017, Proceedings 3, pages 23–39. Springer, 2017.
- [9] Miroslav Kubat, Robert C Holte, and Stan Matwin. Machine learning for the detection of oil spills in satellite radar images. Machine learning, 30:195–215, 1998.
- [10] Matheus A Marins, Bettina D Barros, Ismael H Santos, Daniel C Barrionuevo, Ricardo EV Vargas, Thiago de M Prego, Amaro A de Lima, Marcello LR de Campos, Eduardo AB da Silva, and Sergio L Netto. Fault detection and classification in oil wells and production/service lines using random forest. Journal of Petroleum Science and Engineering, 197:107879, 2021.
- [11] GitHub - petrobras/3W: This is the first repository published by Petrobras on GitHub. It supports the 3W project and promotes experimentation of Machine Learning-based approaches and algorithms for specific problems related to undesirable events that occur in offshore oil wells. — github.com. https://github.com/petrobras/3W, 2022. [Accessed 09-May-2023].
- [12] Chitta Ranjan, Mahendranath Reddy, Markku Mustonen, Kamran Paynabar, and Karim Pourak. Dataset: rare event classification in multivariate time series. arXiv preprint arXiv:1809.10717, 2018.
- [13] Chitta Ranjan, Mahendranath Reddy, Markku Mustonen, Kamran Paynabar, and Karim Pourak. Data challenge: Data augmentation for rare events in multivariate time series. 2019.
- [14] Jeff Hebert. Predicting rare failure events using classification trees on large scale manufacturing data with complex interactions. In 2016 IEEE international conference on big data (big data), pages 2024–2028. IEEE, 2016.
- [15] Roadway Data Home - TDA, MnDOT — dot.state.mn.us. https://www.dot.state.mn.us/roadway/data/, 2023.
- [16] IEEE 39-Bus System — electricgrids.engr.tamu.edu. https://electricgrids.engr.tamu.edu/electric-grid-test-cases/ieee-39-bus-system/, 2016.
- [17] UCI Machine Learning Repository: Spambase Data Set — archive.ics.uci.edu. https://archive.ics.uci.edu/ml/datasets/spambase, 1999.
- [18] S Alestra, C Bordry, C Brand, E Burnaev, P Erofeev, A Papanov, and C Silveira-Freixo. Rare event anticipation and degradation trending for aircraft predictive maintenance. In 11th World Congress on Computational Mechanics, WCCM, volume 5, page 6571, 2014.
- [19] Md Tanvir Ashraf, Kakan Dey, and Sabyasachee Mishra. Identification of high-risk roadway segments for wrong-way driving crash using rare event modeling and data augmentation techniques. Accident Analysis & Prevention, 181:106933, 2023.
- [20] Samit Bhanja and Abhishek Das. A black swan event-based hybrid model for indian stock markets’ trends prediction. Innovations in Systems and Software Engineering, pages 1–15, 2022.
- [21] Wahyu Nugraha, Muhammad Sony Maulana, and Agung Sasongko. Clustering based undersampling for handling class imbalance in c4. 5 classification algorithm. In Journal of Physics: Conference Series, volume 1641, page 012014. IOP Publishing, 2020.
- [22] Manjusha Ravindranath, K Selçuk Candan, and Maria Luisa Sapino. M2nn: Rare event inference through multi-variate multi-scale attention. In 2020 IEEE International Conference on Smart Data Services (SMDS), pages 53–62. IEEE, 2020.
- [23] Yang Zhao, Zoie Shui-Yee Wong, and Kwok Leung Tsui. A framework of rebalancing imbalanced healthcare data for rare events’ classification: a case of look-alike sound-alike mix-up incident detection. Journal of healthcare engineering, 2018, 2018.
- [24] Chao Chen, Andy Liaw, Leo Breiman, et al. Using random forest to learn imbalanced data. University of California, Berkeley, 110(1-12):24, 2004.
- [25] Christos Berberidis and Ioannis Vlahavas. Detection and prediction of rare events in transaction databases. International Journal on Artificial Intelligence Tools, 16(05):829–848, 2007.
- [26] Kaizhu Huang, Haiqin Yang, Irwin King, and Michael R Lyu. Learning classifiers from imbalanced data based on biased minimax probability machine. In Proceedings of the 2004 IEEE Computer Society Conference on Computer Vision and Pattern Recognition, 2004. CVPR 2004., volume 2, pages II–II. IEEE, 2004.
- [27] Senzhang Wang, Zhoujun Li, Wenhan Chao, and Qinghua Cao. Applying adaptive over-sampling technique based on data density and cost-sensitive svm to imbalanced learning. In The 2012 international joint conference on neural networks (IJCNN), pages 1–8. IEEE, 2012.
- [28] Miroslav Kubat, Stan Matwin, et al. Addressing the curse of imbalanced training sets: one-sided selection. In Icml, volume 97, page 179. Nashville, USA, 1997.
- [29] Ricardo Emanuel Vaz Vargas, Celso José Munaro, Patrick Marques Ciarelli, André Gonçalves Medeiros, Bruno Guberfain do Amaral, Daniel Centurion Barrionuevo, Jean Carlos Dias de Araújo, Jorge Lins Ribeiro, and Lucas Pierezan Magalhães. A realistic and public dataset with rare undesirable real events in oil wells. Journal of Petroleum Science and Engineering, 181:106223, 2019.
- [30] V Lakshmanan, G Stumpf, and A Witt. A neural network for detecting and diagnosing tornadic circulations using the mesocyclone detection and near storm environment algorithms. In 21st International Conference on Information Processing Systems, San Diego, CA, Amer. Meteor. Soc, 2005.
- [31] Yuchun Tang, Yan-Qing Zhang, Nitesh V Chawla, and Sven Krasser. Svms modeling for highly imbalanced classification. IEEE Transactions on Systems, Man, and Cybernetics, Part B (Cybernetics), 39(1):281–288, 2008.
- [32] Maher Maalouf and Theodore B Trafalis. Robust weighted kernel logistic regression in imbalanced and rare events data. Computational Statistics & Data Analysis, 55(1):168–183, 2011.
- [33] UCI Machine Learning Repository: Data Set — archive.ics.uci.edu. http://archive.ics.uci.edu/ml/datasets/seismic-bumps., 2013. [Accessed 07-May-2023].
- [34] Miet Van Den Eeckhaut, P Reichenbach, F Guzzetti, M Rossi, and Jean Poesen. Combined landslide inventory and susceptibility assessment based on different mapping units: an example from the flemish ardennes, belgium. Natural Hazards and Earth System Sciences, 9(2):507–521, 2009.
- [35] Miet Van Den Eeckhaut, Tom Vanwalleghem, Jean Poesen, Gerard Govers, Gert Verstraeten, and Liesbeth Vandekerckhove. Prediction of landslide susceptibility using rare events logistic regression: a case-study in the flemish ardennes (belgium). Geomorphology, 76(3-4):392–410, 2006.
- [36] Bosch. Bosch Production Line Performance - kaggle.com. https://www.kaggle.com/c/bosch-production-line-performance, 2016. [Accessed 19-Apr-2023].
- [37] Yair Neuman, Yochai Cohen, and Eden Erez. Extreme rare events identification through jaynes inferential approach. Big Data, 9(6):417–426, 2021.
- [38] Wonjae Lee and Kangwon Seo. Early failure detection of paper manufacturing machinery using nearest neighbor-based feature extraction. Engineering Reports, 3(2):e12291, 2021.
- [39] Rafael H Martello, Lucas Ranzan, Marcelo Farenzena, and Jorge O Trierweiler. Improving autoencoder training with novel goal functions based on multivariable control concepts. IFAC-PapersOnLine, 54(3):73–78, 2021.
- [40] Dongting Xu, Zhisheng Zhang, and Jinfei Shi. Training data selection by categorical variables for better rare event prediction in multiple products production line. Electronics, 11(7):1056, 2022.
- [41] Bearing data center: Case school of engineering: Case western reserve university, Aug 2021.
- [42] Hai Qiu, Jay Lee, Jing Lin, and Gang Yu. Wavelet filter-based weak signature detection method and its application on rolling element bearing prognostics. Journal of sound and vibration, 289(4-5):1066–1090, 2006.
- [43] Biao Wang, Yaguo Lei, Naipeng Li, and Ningbo Li. A hybrid prognostics approach for estimating remaining useful life of rolling element bearings. IEEE Transactions on Reliability, 69(1):401–412, 2018.
- [44] Patrick Nectoux, Rafael Gouriveau, Kamal Medjaher, Emmanuel Ramasso, Brigitte Chebel-Morello, Noureddine Zerhouni, and Christophe Varnier. Pronostia: An experimental platform for bearings accelerated degradation tests. In IEEE International Conference on Prognostics and Health Management, PHM’12., pages 1–8. IEEE Catalog Number: CPF12PHM-CDR, 2012.
- [45] Akthem Rehab, Islam Ali, Walid Gomaa, and M Nashat Fors. Bearings fault detection using hidden markov models and principal component analysis enhanced features. arXiv preprint arXiv:2104.10519, 2021.
- [46] Haiying Liu, Ruizhe Ma, Daiyi Li, Li Yan, and Zongmin Ma. Machinery fault diagnosis based on deep learning for time series analysis and knowledge graphs. Journal of Signal Processing Systems, 93(12):1433–1455, 2021.
- [47] Hongling Xu, Ruizhe Ma, Li Yan, and Zongmin Ma. Two-stage prediction of machinery fault trend based on deep learning for time series analysis. Digital Signal Processing, 117:103150, 2021.
- [48] KDD Cup 1999 Data — kdd.ics.uci.edu. http://kdd.ics.uci.edu/databases/kddcup99/kddcup99.html, 1999. [Accessed 14-May-2023].
- [49] UCI Machine Learning Repository: KDD Cup 1999 Data Data Set — archive.ics.uci.edu. https://archive.ics.uci.edu/ml/datasets/kdd+cup+1999+data, 1998. [Accessed 14-May-2023].
- [50] KDD Cup 1999 Data — kaggle.com. https://www.kaggle.com/datasets/galaxyh/kdd-cup-1999-data, 2018. [Accessed 19-Apr-2023].
- [51] Junjie Wu, Hui Xiong, Peng Wu, and Jian Chen. Local decomposition for rare class analysis. In Proceedings of the 13th ACM SIGKDD international conference on Knowledge discovery and data mining, pages 814–823, 2007.
- [52] Yu Meng, Margaret H Dunham, F Marco Marchetti, and Jie Huang. Rare event detection in a spatiotemporal environment. In 2006 IEEE International Conference on Granular Computing, pages 629–634. IEEE, 2006.
- [53] Maher Maalouf, Dirar Homouz, and Theodore B Trafalis. Logistic regression in large rare events and imbalanced data: A performance comparison of prior correction and weighting methods. Computational Intelligence, 34(1):161–174, 2018.
- [54] UCI Machine Learning Repository: APS Failure at Scania Trucks Data Set — archive.ics.uci.edu. https://archive.ics.uci.edu/ml/datasets/APS+Failure+at+Scania+Trucks, 2017. [Accessed 14-May-2023].
- [55] GitHub - subhande/APS-Failure-at-Scania-Trucks-Data-Set — github.com. https://github.com/subhande/APS-Failure-at-Scania-Trucks-Data-Set, 2019. [Accessed 05-08-2023].
- [56] Christopher Gondek, Daniel Hafner, and Oliver R Sampson. Prediction of failures in the air pressure system of scania trucks using a random forest and feature engineering. In Advances in Intelligent Data Analysis XV: 15th International Symposium, IDA 2016, Stockholm, Sweden, October 13-15, 2016, Proceedings 15, pages 398–402. Springer, 2016.
- [57] Yasmin Fathy, Mona Jaber, and Alexandra Brintrup. Learning with imbalanced data in smart manufacturing: a comparative analysis. IEEE Access, 9:2734–2757, 2020.
- [58] Siam Rafsunjani, Rifat Sultana Safa, Abdullah Al Imran, Md Shamsur Rahim, and Dip Nandi. An empirical comparison of missing value imputation techniques on aps failure prediction. International Journal of Information Technology and Computer Science, 2:21–29, 2019.
- [59] Cerberus Web Client — ftp.fdot.gov. https://ftp.fdot.gov/file/d/FTP/FDOT/co/planning/transtat/gis/shs_maps/shsmap.pdf, 2022. [Accessed 17-May-2023].
- [60] Cerberus Web Client — ftp.fdot.gov. https://ftp.fdot.gov/file/d/FTP/FDOT/co/planning/transtat/gis/TRANSTAT_metadata/rdaccess.shp.xml., 2022. [Accessed 17-May-2023].
- [61] NSE India. Nse - national stock exchange of india ltd, 2023.
- [62] 5 year bse sensex dataset-kaggle.com. https://www.kaggle.com/datasets/ravisane1/5-year-bse-sensex-dataset, 2020. [Accessed 07-May-2023].
- [63] S and p bse sensex dataset-bseindia.com. https://www.bseindia.com/, 2023. [Accessed 07-May-2023].
- [64] NIFTY-50 Stock Market Data (2000 - 2021) — kaggle.com. https://www.kaggle.com/datasets/rohanrao/nifty50-stock-market-data, 2021. [Accessed 07-May-2023].
- [65] Jinyan Li, Lian-sheng Liu, Simon Fong, Raymond K Wong, Sabah Mohammed, Jinan Fiaidhi, Yunsick Sung, and Kelvin KL Wong. Adaptive swarm balancing algorithms for rare-event prediction in imbalanced healthcare data. PloS one, 12(7):e0180830, 2017.
- [66] GitHub - MHResearchNetwork/Diagnosis-Codes: Information on diagnosis code lists used in MHRN, including formats and datasets — github.com. https://github.com/MHResearchNetwork/Diagnosis-Codes, 2018. [Accessed 07-May-2023].
- [67] R Yates Coley, Qinqing Liao, Noah Simon, and Susan M Shortreed. Empirical evaluation of internal validation methods for prediction in large-scale clinical data with rare-event outcomes: a case study in suicide risk prediction. BMC medical research methodology, 23(1):33, 2023.
- [68] Stroke Prediction Dataset — kaggle.com. https://www.kaggle.com/datasets/fedesoriano/stroke-prediction-dataset, 2020.
- [69] Zoie Shui Yee Wong. Statistical classification of drug incidents due to look-alike sound-alike mix-ups. Health informatics journal, 22(2):276–292, 2016.
- [70] CREST JST. Change detection from a street image pair using cnn features and superpixel segmentation. 2015.
- [71] Eui-Hong Han, Daniel Boley, Maria Gini, Robert Gross, Kyle Hastings, George Karypis, Vipin Kumar, Bamshad Mobasher, and Jerome Moore. Webace: A web agent for document categorization and exploration. In Proceedings of the second international conference on Autonomous agents, pages 408–415, 1998.
- [72] Audio-Anomaly-Dataset - kaggle.com. https://www.kaggle.com/datasets/ahmedabbasi/audioanomalydataset, 2022. [Accessed 09-May-2023].
- [73] Ahmed Abbasi, Abdul Rehman Rehman Javed, Amanullah Yasin, Zunera Jalil, Natalia Kryvinska, and Usman Tariq. A large-scale benchmark dataset for anomaly detection and rare event classification for audio forensics. IEEE Access, 10:38885–38894, 2022.
- [74] UCI Machine Learning Repository: Data Sets — archive.ics.uci.edu. https://archive.ics.uci.edu, 1987. [Accessed 13-May-2023].
- [75] KEEL: A software tool to assess evolutionary algorithms for Data Mining problems (regression, classification, clustering, pattern mining and so on) — sci2s.ugr.es. https://sci2s.ugr.es/keel/datasets.php, 2004. [Accessed 13-May-2023].
- [76] Find Open Datasets and Machine Learning Projects | Kaggle — kaggle.com. https://www.kaggle.com/datasets, 2010. [Accessed 13-May-2023].
- [77] Manolis Georgoulis. SWAN-SF — dataverse.harvard.edu. https://dataverse.harvard.edu/dataset.xhtml?persistentId=doi:10.7910/DVN/EBCFKM. [Accessed 11-May-2023].
- [78] PHM Society — phmsociety.org. https://phmsociety.org/, 2009. [Accessed 05-08-2023].
- [79] Aircraft Condition Monitoring System (ACMS) | SKYbrary Aviation Safety - skybrary.aero. https://www.skybrary.aero/articles/aircraft-condition-monitoring-system-acms, 2008. [Accessed 07-May-2023].
- [80] Access to forecasts - ecmwf.int. https://www.ecmwf.int/en/forecasts/accessing-forecasts, 1975. [Accessed 14-May-2023].
- [81] Storm Prediction Center Storm Reports — spc.noaa.gov. https://www.spc.noaa.gov/climo/, 2023. [Accessed 14-May-2023].
- [82] National Climatic Data Center (NCDC). Storm Data Publication | IPS | National Climatic Data Center (NCDC) — ncdc.noaa.gov. https://www.ncdc.noaa.gov/IPS/sd/sd.html, 2023. [Accessed 15-May-2023].
- [83] NCEI. Storm Events Database | National Centers for Environmental Information — ncdc.noaa.gov. https://www.ncdc.noaa.gov/stormevents/, 2023. [Accessed 15-May-2023].
- [84] Intelligent Systems Division — nasa.gov. https://www.nasa.gov/intelligent-systems-division, 2022. [Accessed 15-May-2023].
- [85] Google Maps Platform | Google Developers — developers.google.com. https://developers.google.com/maps, 2005. [Accessed 13-May-2023].
- [86] National Centers for Environmental Information (NCEI). Web Services API (version 2) Documentation | Climate Data Online (CDO) | National Climatic Data Center (NCDC) — ncdc.noaa.gov. https://www.ncdc.noaa.gov/cdo-web/webservices/v2. [Accessed 13-May-2023].
- [87] NASA Open APIs — api.nasa.gov. https://api.nasa.gov/, 2022. [Accessed 13-May-2023].
- [88] Maren David Dangut, Ian K Jennions, Steve King, and Zakwan Skaf. Application of deep reinforcement learning for extremely rare failure prediction in aircraft maintenance. Mechanical Systems and Signal Processing, 171:108873, 2022.
- [89] Seong-Pyo Cheon, Sungshin Kim, So-Young Lee, and Chong-Bum Lee. Bayesian networks based rare event prediction with sensor data. Knowledge-Based Systems, 22(5):336–343, 2009.
- [90] Azim Ahmadzadeh, Berkay Aydin, Dustin J Kempton, Maxwell Hostetter, Rafal A Angryk, Manolis K Georgoulis, and Sushant S Mahajan. Rare-event time series prediction: a case study of solar flare forecasting. In 2019 18th IEEE international conference on machine learning and applications (ICMLA), pages 1814–1820. IEEE, 2019.
- [91] GitHub - gistairc/ABCDdataset — github.com. https://github.com/gistairc/ABCDdataset, 2017. [Accessed 14-May-2023].
- [92] ABCD dataset - datasets.abci.ai. https://datasets.abci.ai/dataset/abcd/, 2017. [Accessed 14-May-2023].
- [93] Garimella Rama Murthy and Vasanth Iyer. Distributed wireless sensor network architecture: Fuzzy logic based sensor fusion. In EUSFLAT Conf.(2), pages 71–78. Citeseer, 2007.
- [94] Jia He and Maggie X Cheng. Weighting methods for rare event identification from imbalanced datasets. Frontiers in big Data, 4:715320, 2021.
- [95] Mahesh V Joshi, Ramesh C Agarwal, and Vipin Kumar. Mining needle in a haystack: classifying rare classes via two-phase rule induction. In Proceedings of the 2001 ACM SIGMOD international conference on Management of data, pages 91–102, 2001.
- [96] Zidi Xiu, Chenyang Tao, Michael Gao, Connor Davis, Benjamin A Goldstein, and Ricardo Henao. Variational disentanglement for rare event modeling. In Proceedings of the AAAI Conference on Artificial Intelligence, volume 35, pages 10469–10477, 2021.
- [97] Cara O’Brien, Benjamin A Goldstein, Yueqi Shen, Matthew Phelan, Curtis Lambert, Armando D Bedoya, and Rebecca C Steorts. Development, implementation, and evaluation of an in-hospital optimized early warning score for patient deterioration. MDM policy & practice, 5(1), 2020.
- [98] LA Gloeckler Ries, JL Young, GE Keel, MP Eisner, YD Lin, MJ Horner, et al. Seer survival monograph: cancer survival among adults: Us seer program, 1988-2001, patient and tumor characteristics. National Cancer Institute, SEER Program, NIH Pub, 7(6215):193–202, 2007.
- [99] Yuanlu Bai, Zhiyuan Huang, Henry Lam, and Ding Zhao. Rare-event simulation for neural network and random forest predictors. ACM Transactions on Modeling and Computer Simulation (TOMACS), 32(3):1–33, 2022.
- [100] UCI Machine Learning Repository — archive.ics.uci.edu. https://archive.ics.uci.edu/dataset/159/magic+gamma+telescope, 2007. [Accessed 13-Jun-2023].
- [101] Google. Mnist variations. https://sites.google.com/a/lisa.iro.umontreal.ca/public_static_twiki/variations-on-the-mnist-digits, 2017.
- [102] Ryuhei Hamaguchi, Ken Sakurada, and Ryosuke Nakamura. Supplementary material for cvpr submission# 4406. 2019.
- [103] Chris Seiffert, Taghi M Khoshgoftaar, Jason Van Hulse, and Amri Napolitano. Mining data with rare events: a case study. In 19th IEEE International Conference on Tools with Artificial Intelligence (ICTAI 2007), volume 2, pages 132–139. IEEE, 2007.
- [104] Adult dataset, 1996.
- [105] Google. Audioset dataset, 2017.
- [106] Ethan Pickering, Stephen Guth, George Em Karniadakis, and Themistoklis P Sapsis. Discovering and forecasting extreme events via active learning in neural operators. Nature Computational Science, 2(12):823–833, 2022.
- [107] OLGA Dynamic Multiphase Flow Simulator — software.slb.com. https://www.software.slb.com/products/olga, 2023. [Accessed 15-May-2023].
- [108] Thasorn Chalongvorachai and Kuntpong Woraratpanya. A data generation framework for extremely rare case signals. Heliyon, 7(8), 2021.
- [109] Thasorn Chalongvorachai and Kuntpong Woraratpanya. 3dvae-ersg: 3d variational autoencoder for extremely rare signal generation. In 2021 13th International Conference on Information Technology and Electrical Engineering (ICITEE), pages 177–182. IEEE, 2021.
- [110] Thongchai Kaewkiriya and Kuntpong Woraratpanya. 3dvae-lstm for extremely rare anomaly signal generation. In 2022 14th International Conference on Information Technology and Electrical Engineering (ICITEE), pages 229–234. IEEE, 2022.
- [111] Hülya Olmuş, Ezgi Nazman, and Semra Erbaş. Comparison of penalized logistic regression models for rare event case. Communications in Statistics-Simulation and Computation, 51(4):1578–1590, 2022.
- [112] Chunyan Ling and Zhenzhou Lu. Support vector machine-based importance sampling for rare event estimation. Structural and Multidisciplinary Optimization, 63(4):1609–1631, 2021.
- [113] Somayajulu LN Dhulipala, Michael D Shields, Benjamin W Spencer, Chandrakanth Bolisetti, Andrew E Slaughter, Vincent M Labouré, and Promit Chakroborty. Active learning with multifidelity modeling for efficient rare event simulation. Journal of Computational Physics, 468:111506, 2022.
- [114] Albert Bifet, Geoff Holmes, Bernhard Pfahringer, Philipp Kranen, Hardy Kremer, Timm Jansen, and Thomas Seidl. Moa: Massive online analysis, a framework for stream classification and clustering. In Proceedings of the first workshop on applications of pattern analysis, pages 44–50. PMLR, 2010.
- [115] Zied Ben Bouallègue and David S Richardson. On the roc area of ensemble forecasts for rare events. Weather and Forecasting, 37(5):787–796, 2022.
- [116] Lukas Kaupp, Heiko Webert, Kawa Nazemi, Bernhard Humm, and Stephan Simons. Context: An industry 4.0 dataset of contextual faults in a smart factory. Procedia Computer Science, 180:492–501, 2021.
- [117] Peng-Hui Yang, Yao Yu, Feng Gu, Meng-Jie Qu, and Jia-Ming Zhu. Prediction and risk assessment of extreme weather events based on gumbel copula function. Journal of Function Spaces, 2022:1–13, 2022.
- [118] Syed M Adil, Cyrus Elahi, Dev N Patel, Andreas Seas, Pranav I Warman, Anthony T Fuller, Michael M Haglund, and Timothy W Dunn. Deep learning to predict traumatic brain injury outcomes in the low-resource setting. World Neurosurgery, 164:e8–e16, 2022.
- [119] Gregory E Simon, Eric Johnson, Jean M Lawrence, Rebecca C Rossom, Brian Ahmedani, Frances L Lynch, Arne Beck, Beth Waitzfelder, Rebecca Ziebell, Robert B Penfold, et al. Predicting suicide attempts and suicide deaths following outpatient visits using electronic health records. American Journal of Psychiatry, 175(10):951–960, 2018.
- [120] Shuo Wang, Leandro L Minku, and Xin Yao. A systematic study of online class imbalance learning with concept drift. IEEE transactions on neural networks and learning systems, 29(10):4802–4821, 2018.
- [121] Maria Carolina Monard and GEAPA Batista. Learning with skewed class distributions. Advances in Logic, Artificial Intelligence and Robotics, 85:173–180, 2002.
- [122] Gary M Weiss. Mining with rarity: a unifying framework. ACM Sigkdd Explorations Newsletter, 6(1):7–19, 2004.
- [123] Ander Carreño, Iñaki Inza, and Jose A Lozano. Analyzing rare event, anomaly, novelty and outlier detection terms under the supervised classification framework. Artificial Intelligence Review, 53:3575–3594, 2020.
- [124] Krystyna Napierala and Jerzy Stefanowski. Types of minority class examples and their influence on learning classifiers from imbalanced data. Journal of Intelligent Information Systems, 46:563–597, 2016.
- [125] Jerzy Stefanowski. Overlapping, rare examples and class decomposition in learning classifiers from imbalanced data. Emerging paradigms in machine learning, pages 277–306, 2013.
- [126] Liang Zhao. Event prediction in the big data era: A systematic survey. ACM Computing Surveys (CSUR), 54(5):1–37, 2021.
- [127] World Health Organization, 2022.
- [128] Zhiling Lan, Jiexing Gu, Ziming Zheng, Rajeev Thakur, and Susan Coghlan. A study of dynamic meta-learning for failure prediction in large-scale systems. Journal of parallel and distributed computing, 70(6):630–643, 2010.
- [129] Prashasta Gujrati, Yawei Li, Zhiling Lan, Rajeev Thakur, and John White. A meta-learning failure predictor for blue gene/l systems. In 2007 International Conference on Parallel Processing (ICPP 2007), pages 40–40. IEEE, 2007.
- [130] Ruei-Jie Hsieh, Jerry Chou, and Chih-Hsiang Ho. Unsupervised online anomaly detection on multivariate sensing time series data for smart manufacturing. In 2019 IEEE 12th conference on service-oriented computing and applications (SOCA), pages 90–97. IEEE, 2019.
- [131] Dongting Xu, Zhisheng Zhang, and Jinfei Shi. A new multi-sensor stream data augmentation method for imbalanced learning in complex manufacturing process. Sensors, 22(11):4042, 2022.
- [132] Noor Fadhilah Ahmad Radi, Roslinazairimah Zakaria, and Muhammad Az-zuhri Azman. Estimation of missing rainfall data using spatial interpolation and imputation methods. In AIP conference proceedings, volume 1643, pages 42–48. American Institute of Physics, 2015.
- [133] Quanming Yao and James T Kwok. Accelerated and inexact soft-impute for large-scale matrix and tensor completion. IEEE Transactions on Knowledge and Data Engineering, 31(9):1665–1679, 2018.
- [134] Chuong B Do and Serafim Batzoglou. What is the expectation maximization algorithm? Nature biotechnology, 26(8):897–899, 2008.
- [135] Runmin Wei, Jingye Wang, Mingming Su, Erik Jia, Shaoqiu Chen, Tianlu Chen, and Yan Ni. Missing value imputation approach for mass spectrometry-based metabolomics data. Scientific reports, 8(1):663, 2018.
- [136] Olga Troyanskaya, Michael Cantor, Gavin Sherlock, Pat Brown, Trevor Hastie, Robert Tibshirani, David Botstein, and Russ B Altman. Missing value estimation methods for dna microarrays. Bioinformatics, 17(6):520–525, 2001.
- [137] Daniel J Stekhoven and Peter Bühlmann. Missforest—non-parametric missing value imputation for mixed-type data. Bioinformatics, 28(1):112–118, 2012.
- [138] Richard R Brooks and S Sitharama Iyengar. Robust distributed computing and sensing algorithm. Computer, 29(6):53–60, 1996.
- [139] V Iyer, S Shetty, and SS Iyengar. Statistical methods in ai: Rare event learning using associative rules and higher-order statistics. 2015.
- [140] Sotiris Kotsiantis, Dimitris Kanellopoulos, Panayiotis Pintelas, et al. Handling imbalanced datasets: A review. GESTS international transactions on computer science and engineering, 30(1):25–36, 2006.
- [141] Aman Samson Mogos, Xiaodong Liang, and Chi Yung Chung. Distribution transformer failure prediction for predictive maintenance using hybrid one-class deep svdd classification and lightning strike failures data. IEEE Transactions on Power Delivery, 2023.
- [142] Bowen Shi, Ming Sun, Krishna C Puvvada, Chieh-Chi Kao, Spyros Matsoukas, and Chao Wang. Few-shot acoustic event detection via meta learning. In ICASSP 2020-2020 IEEE International Conference on Acoustics, Speech and Signal Processing (ICASSP), pages 76–80. IEEE, 2020.
- [143] Taeho Jo and Nathalie Japkowicz. Class imbalances versus small disjuncts. ACM Sigkdd Explorations Newsletter, 6(1):40–49, 2004.
- [144] Özden Gür Ali and Umut Arıtürk. Dynamic churn prediction framework with more effective use of rare event data: The case of private banking. Expert Systems with Applications, 41(17):7889–7903, 2014.
- [145] Haibo He, Yang Bai, Edwardo A Garcia, and Shutao Li. Adasyn: Adaptive synthetic sampling approach for imbalanced learning. In 2008 IEEE international joint conference on neural networks (IEEE world congress on computational intelligence), pages 1322–1328. IEEE, 2008.
- [146] Ivan Tomek. An experiment with the edited nearest-nieghbor rule. 1976.
- [147] Mohamed Bekkar and Taklit Akrouf Alitouche. Imbalanced data learning approaches review. International Journal of Data Mining & Knowledge Management Process, 3(4):15, 2013.
- [148] Inderjeet Mani and I Zhang. knn approach to unbalanced data distributions: a case study involving information extraction. In Proceedings of workshop on learning from imbalanced datasets, volume 126, pages 1–7. ICML, 2003.
- [149] Peter Hart. The condensed nearest neighbor rule (corresp.). IEEE transactions on information theory, 14(3):515–516, 1968.
- [150] Jun-Ichiro Fukuchi. Subsampling and model selection in time series analysis. Biometrika, 86(3):591–604, 1999.
- [151] Florian Combes, Ricardo Fraiman, and Badih Ghattas. Time series sampling. Engineering Proceedings, 18(1):32, 2022.
- [152] Na Yang, Zhenkai Zhang, Jianhua Yang, and Zenglin Hong. Applications of data augmentation in mineral prospectivity prediction based on convolutional neural networks. Computers & geosciences, 161:105075, 2022.
- [153] Mohammad Parsa, Emmanuel John M Carranza, and Bahman Ahmadi. Deep gmdh neural networks for predictive mapping of mineral prospectivity in terrains hosting few but large mineral deposits. Natural Resources Research, pages 1–14, 2021.
- [154] Chitta Ranjan. Understanding deep learning: Application in rare event prediction. Connaissance Publishing Atlanta, GA, USA, 2020.
- [155] Rainer Puhr, Georg Heinze, Mariana Nold, Lara Lusa, and Angelika Geroldinger. Firth’s logistic regression with rare events: accurate effect estimates and predictions? Statistics in medicine, 36(14):2302–2317, 2017.
- [156] Nathalie Japkowicz, Catherine Myers, Mark Gluck, et al. A novelty detection approach to classification. In IJCAI, volume 1, pages 518–523. Citeseer, 1995.
- [157] William W Cohen. Fast effective rule induction. In Machine learning proceedings 1995, pages 115–123. Elsevier, 1995.
- [158] Yuchun Tang, Bo Jin, Yi Sun, and Yan-Qing Zhang. Granular support vector machines for medical binary classification problems. In 2004 Symposium on Computational Intelligence in Bioinformatics and Computational Biology, pages 73–78. IEEE, 2004.
- [159] Ramesh Agarwal and Mahesh V Joshi. Pnrule: a new framework for learning classifier models in data mining (a case-study in network intrusion detection). In Proceedings of the 2001 SIAM International Conference on Data Mining, pages 1–17. SIAM, 2001.
- [160] Gary King and Langche Zeng. Explaining rare events in international relations. International Organization, 55(3):693–715, 2001.
- [161] Ricardo Vilalta and Sheng Ma. Predicting rare events in temporal domains. In 2002 IEEE International Conference on Data Mining, 2002. Proceedings., pages 474–481. IEEE, 2002.
- [162] A Lazarevic, Jaideep Srivastava, and Vipin Kumar. Data mining for analysis of rare events: A case study in security, financial and medical applications. In Pacific-asia conference on knowledge discovery and data mining, 2004.
- [163] Mohamed Abdel-Basset, Laila Abdel-Fatah, and Arun Kumar Sangaiah. Metaheuristic algorithms: A comprehensive review. Computational intelligence for multimedia big data on the cloud with engineering applications, pages 185–231, 2018.
- [164] Bartosz Krawczyk, Michał Woźniak, and Gerald Schaefer. Cost-sensitive decision tree ensembles for effective imbalanced classification. Applied Soft Computing, 14:554–562, 2014.
- [165] Mandar Kulkarni and Aria Abubakar. Soft attention convolutional neural networks for rare event detection in sequences. arXiv preprint arXiv:2011.02338, 2020.
- [166] Margaret H Dunham, Yu Meng, and Jie Huang. Extensible markov model. In Fourth IEEE International Conference on Data Mining (ICDM’04), pages 371–374. IEEE, 2004.
- [167] Chao Dang, Pengfei Wei, Matthias GR Faes, Marcos A Valdebenito, and Michael Beer. Parallel adaptive bayesian quadrature for rare event estimation. Reliability Engineering & System Safety, 225:108621, 2022.
- [168] GitHub - Chao-Dang/Rare-Event-Estimation-by-Parallel-Adaptive-Bayesian-Quadrature — github.com. https://github.com/Chao-Dang/Rare-Event-Estimation-by-Parallel-Adaptive-Bayesian-Quadrature, 2022. [Accessed 15-May-2023].
- [169] Junfeng Wen, Bo Dai, Lihong Li, and Dale Schuurmans. Batch stationary distribution estimation. arXiv preprint arXiv:2003.00722, 2020.
- [170] John Strahan, Spencer C Guo, Chatipat Lorpaiboon, Aaron R Dinner, and Jonathan Weare. Inexact iterative numerical linear algebra for neural network-based spectral estimation and rare-event prediction. arXiv preprint arXiv:2303.12534, 2023.
- [171] Burr Settles. Active learning literature survey. 2009.
- [172] Lu Lu, Pengzhan Jin, Guofei Pang, Zhongqiang Zhang, and George Em Karniadakis. Learning nonlinear operators via deeponet based on the universal approximation theorem of operators. Nature machine intelligence, 3(3):218–229, 2021.
- [173] Maher Maalouf and Theodore B Trafalis. Rare events and imbalanced datasets: an overview. International Journal of Data Mining, Modelling and Management, 3(4):375–388, 2011.
- [174] Davide Chicco and Giuseppe Jurman. The advantages of the matthews correlation coefficient (mcc) over f1 score and accuracy in binary classification evaluation. BMC genomics, 21:1–13, 2020.
- [175] Edieal Pinker. Reporting accuracy of rare event classifiers. NPJ digital medicine, 1(1):56, 2018.
- [176] Michael JA Berry and Gordon S Linoff. Data mining techniques: for marketing, sales, and customer relationship management. John Wiley & Sons, 2004.
- [177] Sunhee Yoon and Wang-Hee Lee. Application of true skill statistics as a practical method for quantitatively assessing climex performance. Ecological Indicators, 146:109830, 2023.
Appendices
Appendix A ACRONYMS: Table 12
| Acronym | Description | Acronym | Description |
|---|---|---|---|
| N | Numeric data | LIDAR | Light detection and ranging |
| TX | Textual data | LASA | Look-alike-sound-alike |
| I | Image data | FFT | Fast fourier transform |
| A | Audio data | GAN | Generative adversarial networks |
| T | Time series | CGAN | Conditional generative adversarial networks |
| CF | Classification | WGAN | Wasserstein agenerative adversarial networks |
| CL | Clustering | MPM | Mineral prospectivity mapping |
| FT | Forecasting | PCA | Principal component analysis |
| RG | Regression | LR | Logistic regression |
| SM | Simulation | NB | Naive bayes |
| RE | Naturally rare event datasets | NN | Neural networks |
| DE | Derived datasets | CNN | Convolutional neural networks |
| SI | Simulated datasets | MLP | Multi-layer perceptron |
| SY | Synthetic datasets | LSTM | Long short-term memory |
| UCI | University of California Irvine | RF | Random forest |
| KEEL | Knowledge extraction based on evolutionary learning | k-NN | K-nearest neighbors |
| API | Application programming interface | RIPPER | Repeated incremental pruning to produce error reduction |
| DC | Data cleaning | SVM | Support vector machines |
| FS | Feature selection | L.SVM | Support vector machine with linear kernel |
| SL | Sampling | R.SVM | Support vector machine with radial kernel |
| FE | Feature engineering | GSVM | Granular support vector machines |
| ML | Machine learning | RE-WKLR | Rare event weighted kernel logistic regression |
| R1 | Extremely-rare category | MSB | Maximum specificity bias |
| R2 | Very-rare category | IBL | Instance-based learning |
| R3 | Moderately-rare category | 1-NN | 1-Nearest neighbor |
| R4 | Frequently-rare category | PAM | Partition around medoids |
| CoR | Curse of rarity | CLARA | Clustering large applications |
| SFA | Signal fragment assembler | COG | Classification using lOcal clusterinG |
| VAE | Variational autoencoder | BIRCH | Balanced iterative reducing and clustering |
| DP | Data picker | using hierarchies | |
| QC | Quality classifier | ARIMA | Autoregressive integrated moving average |
| MOA | Massive online analysis | VAR | Vector autoregression |
| WEKA | Waikato environment for knowledge analysis | GRU | Gated recurrent unit |
| PHQ | Patient health questionnaire | EMM | Extensible markov models |
| HIV | Human immunodeficiency virus | DNO | Deep neural operators |
| WWD | Wrong-way driving | FNACC | Faulty-normal accuracy |
| APS | Air pressure system | RFNACC | Real faulty-normal accuracy |
| SVD | Singular value decomposition | TP | True positives |
| MICE | Multiple imputation by chained equation | FN | False negatives |
| ANOVA | Analysis of variance | TN | True negatives |
| TL | Tomek links | FP | False positives |
| ENN | Edited nearest neighbors | TNR | True negative rate |
| RFE | Recursive feature elimination | FPR | False positive rate |
| HMM | Hidden markov model | FNR | False negative rate |
| DWT | Discrete wavelet transform | G-Mean | Geometric Mean |
| mRMR | Minimum redundancy maximum relevance | BER | Balanced error rate |
| TF-IDF | Term frequency-inverse document frequency | MCC | Matthews’s correlation coefficient |
| XGBoost | eXtreme Gradient Boosting | PR | Precision-Recall |
| MFCC | Mel-frequency cepstral coefficients | AUPRC | Area under precision-recall curve |
| MDI | Mean decrease in impurity | TDL | Top-decile lift |
| ROS | Random minority oversampling | TSS | True skill statistic |
| RUS | Random majority undersampling | SSE | Sum of squared errors |
| SMOTE | Synthetic minority oversampling technique | MAE | Mean absolute error |
| ADASYN | Adaptive synthetic sampling technique | RMSE | Root mean squared error |
| SMUTE | Similarity majority under-sampling technique | MAPE | Mean absolute percentage error |
| NCL | Neighborhood cleaning rule | MAD | Mean absolute deviation |
| NM | NearMiss | MAPD | Mean absolute percentage deviation |
| NM2 | NearMiss-2 | AUC-ROC | Area under the receiver operating |
| OSS | One-sided selection | characteristic curve | |
| CBO | Cluster-based oversampling | UQ | Uncertainty quantification |
| F2F | Factory to Factory | ||