How Do Data Analysts Respond to AI Assistance? A Wizard-of-Oz Study
Abstract.
Data analysis is challenging as analysts must navigate nuanced decisions that may yield divergent conclusions. AI assistants have the potential to support analysts in planning their analyses, enabling more robust decision-making. Though AI-based assistants that target code execution (e.g., Github Copilot) have received significant attention, limited research addresses assistance for both analysis execution and planning. In this work, we characterize helpful planning suggestions and their impacts on analysts’ workflows. We first review the analysis planning literature and crowd-sourced analysis studies to categorize suggestion content. We then conduct a Wizard-of-Oz study (n=13) to observe analysts’ preferences and reactions to planning assistance in a realistic scenario. Our findings highlight subtleties in contextual factors that impact suggestion helpfulness, emphasizing design implications for supporting different abstractions of assistance, forms of initiative, increased engagement, and alignment of goals between analysts and assistants.
Teaser Diagram
1. Introduction
Data analysis requires analysts to make numerous decisions regarding varied tasks, such as data collection, data wrangling, statistical modeling, and inference (Liu et al., 2019). Each choice involves analysis planning, wherein analysts reason through the effects of potential decisions by synthesizing their results, prior experiences, and domain and statistical knowledge. Decisions made, their focus shifts to enacting these choices using the correct code with appropriate software tools, which we refer to as analysis execution.
Inadequate analysis planning can complicate this flow and can cause analysts to risk making arbitrary and ill-founded decisions (Simonsohn et al., 2015; Steegen et al., 2016) for a host of reasons. Analysts often struggle to identify and address relevant decision points (Liu et al., 2019, 2020a). They may overfocus on low-level details, such as tuning hyperparameters, or missing high-level considerations like alternative statistical or mental models (Liu et al., 2020a). They often center execution decisions tied to familiar workflows when approaches using other tools may be more applicable (Liu et al., 2020a; Jun et al., 2021). Further, the unconsidered flexibility in decision-making (and the biases inherent therein) contributes to the scientific reproducibility crisis (Baker, 2016; Cockburn et al., 2020; Aarts et al., 2015). For instance, given the same analysis task and dataset, analysts often derive divergent conclusions (Silberzahn et al., 2018; Breznau et al., 2022; Schweinsberg et al., 2021; Dutilh et al., 2018; Botvinik-Nezer et al., 2019; Bastiaansen et al., 2019; Menkveld et al., 2021).
Data analysis assistants seek to bridge these gaps by helping analysts execute and plan their analyses.
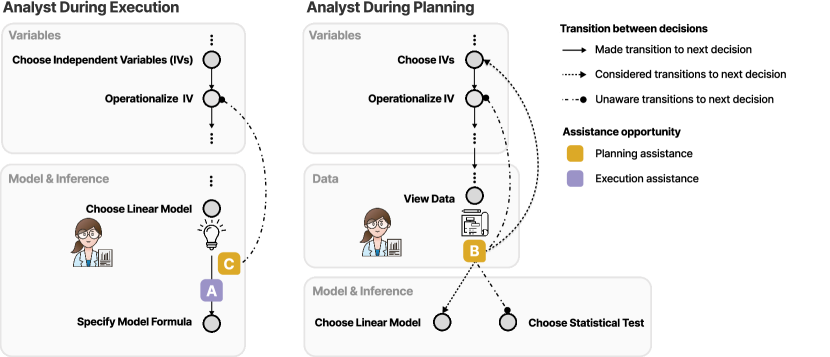
AI-based execution assistants (such as Copilot (GitHub, 2022)) help analysts implement decisions (Fig. 1A) by suggesting code or tools.
In contrast, planning assistance may help them reason about their decisions (Fig. 1B and C),
articulate hypotheses and mental models, and identify overlooked alternative decisions or rationales (Fig. 1 ![]() ).
Systematically considering alternatives can deepen analysts’ understanding of the outcome variations latent to decision-making in data analysis (Liu et al., 2020b; Simonsohn et al., 2015; Steegen et al., 2016).
Therefore, planning assistance can be a transformative step towards more principled, reliable, and robust analyses.
).
Systematically considering alternatives can deepen analysts’ understanding of the outcome variations latent to decision-making in data analysis (Liu et al., 2020b; Simonsohn et al., 2015; Steegen et al., 2016).
Therefore, planning assistance can be a transformative step towards more principled, reliable, and robust analyses.
Planning Assistance is not well supported and under-explored
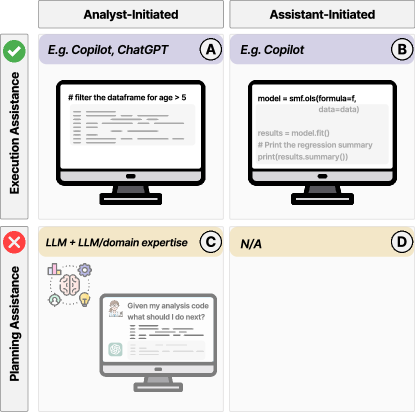
The improved capabilities of large language models (LLMs) for coding, language, and visualization generation (Brown et al., 2020; Bubeck et al., 2023; Chen et al., 2021; Chowdhery et al., 2022; Dibia, 2023) offer an opportunity to make such planning and execution data analysis assistants a reality. Prior LLM-based assistants have explored practical approaches to execution assistance (Jiang et al., 2021; Vaithilingam et al., 2022; Barke et al., 2022; McNutt et al., 2023; Ziegler et al., 2022), however planning remains unexplored (Fig. 2 bottom row).
Effective planning suggestions can not be achieved by simply feeding the current analysis context into an LLM as it requires selective context, higher-level scaffolding, targeted prompts, and sensitive triggers. The iterative nature of data analysis demands the nuanced interpretation of prior results, statistics, and domain knowledge to inform the subsequent decisions (Grolemund and Wickham, 2014; Box, 1976; Jun et al., 2021; Tukey and Wilk, 1966), which is typically unaccounted for in execution-only assistants (Fig. 2A and B). Synthesis of such decisions may require backtracking to a prior choice and deviating from the current approach (Fig. 1). Authoring effective prompts can be difficult (Zamfirescu-Pereira et al., 2023; Mishra and Nouri, 2022), and the right context to provide to not cause hallucinatory analyses (McNutt et al., 2020) may be hard to identify. Finally, data analysis is a non-linear activity that involves iterated and inter-woven actions of typing, reading, and reflecting—making the optimal timing of suggestions less clear than in software engineering.
Yet, essential questions about the design of planning assistants remain unanswered. In this work, we explore the design of such AI-based assistants. To this end, we consider the following research questions:
- RQ 1 - Scope::
-
What types of specific planning assistance content could an assistant provide?
- RQ 2 - Helpfulness::
-
What data analysis suggestions do analysts find helpful and under what circumstances?
- RQ 3 - Impact::
-
How do suggestions impact analysts’ workflows? To what extent do analysts prioritize their own ideas or adopt suggestions and explore alternative approaches?
To characterize assistant suggestion content (RQ 1), we conducted a literature review and critically assessed data from a crowd-sourced analysis study (Silberzahn et al., 2018), wherein 29 analyst teams separately analyzed the same dataset to answer the same research question (Sec. 3). We used these findings to develop categories of assistance content across points in the end-to-end analysis process (Table 1).
To observe analysts’ preferences for (RQ2) and effects of (RQ3) different suggestions, we conducted a Wizard of Oz study, with 13 practicing data analysts (Sec. 4)—our first contribution. We designed the study around the scenario considered in the crowd-sourced study (Silberzahn et al., 2018) that we looked at in our previous step. Our participants worked through the same dataset and task while receiving suggestions from a behind-the-scenes experimenter acting as a wizard. To facilitate our study, we developed a JupyterLab extension that allowed the wizard to surface suggestions to the participant as they used the notebook in a familiar manner111To support future notebook assistant interfaces, we release the code for this interface at https://anonymous.4open.science/r/jupyterlab-assistant-517F/. . This allowed the wizard (aided by LLMs) to synthesize suggestions and manipulate the selection, quality, and timing of recommendations (Fig. 3).
We synthesize the findings of our study (Sec. 5) into a set of design guidelines (Sec. 6) to align analysis intent and goals, support varying levels of suggestion assistance, and increase analyst understanding and engagement with the assistant’s suggestions—our second contribution. We observed that the data analysis process can benefit from diverse forms of planning assistance, but only with careful consideration of assistance context. Additional factors—such as the timing of suggestions or variations in analysts’ statistical and domain backgrounds—played a critical role in a suggestion’s perceived helpfulness. Finally, we found differences in goals between the analyst (i.e., speed and execution) and planning assistance (i.e., methodical and robust planning).
By characterizing the usability of planning-equipped analysis assistants, we seek to make data analysis more robust and reliable by enabling richer and more useful assistants.
2. Background and Related Work
2.1. Planning in Data Analysis
Analysts often engage in planning activities (Alspaugh et al., 2019). Such activities are closely related to cognitive theories of sensemaking, whereby analysts seek and integrate new observations to build mental models (Pirolli, 2007; Russell et al., 1993; Klein et al., 2007) that inform their decisions for collecting and analyzing data to elicit findings; these findings, in turn, inform their mental models in an iterative back-and-forth. Thus, data analysis planning can be highly iterative and often requires revisiting decisions at various points in the analysis (Jun et al., 2021; Box, 1976; Tukey and Wilk, 1966). Moreover, these processes are integral to reduce human biases in decision-making and help form robust conclusions (Grolemund and Wickham, 2014). In this work, we study how sensemaking activities in analysis planning can be improved with an AI assistant.
Similarly, analysis planning relates closely to multiverse analysis (Steegen et al., 2016; Simonsohn et al., 2015), a statistical analysis paradigm whereby analysts consider, specify, and report all reasonable decisions and combinations of decisions. Through assessing hundreds or even thousands of analyses based on these choices, a multiverse approach highlights how different analysis decisions can influence final outcomes. However, despite the importance of well-practiced analysis planning, empirical studies observed analysts struggle to reason about their analysis decisions (Liu et al., 2019, 2020a). Often, they are unaware of potential alternative decisions in the end-to-end data analysis process (i.e., the phases of data collection, data wrangling, statistical modeling, and evaluation). Our work aims to guide analysts in recognizing, understanding, and reflecting on these overlooked but important decisions.
Prior work developed systems to simplify the planning of statistical models and statistical tests (Jun et al., 2022, 2019). Additionally, data-driven systems, such as Lodestar (Raghunandan et al., 2022a), EDAssistant (Li et al., 2021), and ATENA (El et al., 2020), add structure to analyses and offer recommendations for data science steps and exploratory data analysis (EDA) workflows. However, these systems focused on specific parts of the analysis process (i.e., statistical modeling or EDA) and/or based their recommendations on predicting the next steps in an analysis. In contrast, we emphasize analysis planning for the entire end-to-end analysis and as a highly iterative process.
Specifically, we aim to support analysts in considering alternative decisions and revisiting prior decisions as new insights emerge. We view LLM-supported data analysis assistants as a promising solution. Furthermore, these assistants could be seamlessly integrated with existing multiverse analysis systems (Liu et al., 2020b; Sarma et al., 2021; Gu et al., 2022) to help analysts conduct multiverse analyses. Thus, as planning assistants help analysts consider and structure alternative decisions, multiverse tools help them author, execute, and evaluate these decisions within a “multiverse” of alternative analyses.
For these benefits to be realized, we must learn what specific feedback analysts need and under what circumstances assistance would be most useful to them. To begin exploring factors that influence favorable suggestions, we first categorize suggestion content (Sec. 3). Using this categorization, we develop a prototype interface and conduct a Wizard of Oz study (Sec. 4) to investigate the helpfulness and impact of such suggestions.
2.2. LLM-based Assistants and Limitations for Planning Assistance
LLMs trained on large-scale code corpora (Chen et al., 2021; Chowdhery et al., 2022; Fried et al., 2022; Nijkamp et al., 2022; Li et al., 2022) have shown proficiency in learning programming concepts, solving programming challenges (Chen et al., 2021), and covering various domains like web development (Zhang et al., 2023) and data science problems (Lai et al., 2022; Chandel et al., 2022). While these LLMs excel at precise code implementation tasks (e.g., Consider a (6,7,8) shape array, what is the index (x,y,z) of the 100th element? (Lai et al., 2022)), this work focuses on situations where the problem statement and methods to apply are less clear, unspecified by the user, or at a higher level of abstraction.
LLMs are trained to predict the next token in a code/text sequence and thus form the back-end of many popular code assistants that offer execution assistance (Murali et al., 2023; GitHub, 2022; Google, 2022; Amazon Web Services, 2022). Note that we distinguish between an LLM and an assistant; the latter is a complete system that acts as the interface between the user and the LLM. Existing code assistants typically pass the programmer’s context (e.g., code, comments, etc.) to the LLM to then recommend entire statements or blocks of code. In this interaction, programmers can either initiate execution assistance with explicit comments and triggers (Fig. 2A) or passively let the assistant auto-complete their code (Fig. 2B). However, as discussed earlier (Sec. 1), assistants offering data planning assistance cannot naively pass the current context to an LLM given the iterative and non-linear nature of analysis planning. This work explores the design of an LLM-supported complete system for planning assistance.
More recently, general-purpose LLMs, such as InstructGPT (Ouyang et al., 2022) and GPT-4 (OpenAI, 2023), have reached a level of performance that is now deployable in various contexts and domains (Bubeck et al., 2023). The assistant ChatGPT (OpenAI, 2022), supported by LLMs, has exploded in popularity (Buchholz, 2023). In the context of data analysis, ChatGPT can offer basic planning assistance, integrating broader domain expertise, software libraries, and statistical knowledge with code when given precise instructions (e.g., Show me the correlation between Height and Weight in a scatter plot) (Cheng et al., 2023).
However, ChatGPT requires users to actively prompt it for information (Fig. 2C). Prior work found that non-AI experts often struggle to write effective prompts (Zamfirescu-Pereira et al., 2023) and experience significant cognitive load (Jiang et al., 2022). Data analysis planning can further exacerbate this issue since analysts must synthesize information from various points in the analysis to pass to the assistant. Thus, the burden is on the analyst to decide what they want, where to find relevant context in a likely messy analysis (Head et al., 2019; Kery et al., 2018; Rule et al., 2018), and craft a prompt or series of prompts. In addition, since analysts are often unaware of the entire space of analytical decisions, they may also need planning assistance they do not directly ask for. However, current assistants like ChatGPT do not naturally support assistant-initiated planning assistance (Fig. 2D). Further, since analysts may be alternating between planning and execution, the optimal timing of planning assistance is unclear.
Our work aims to understand the design of data analysis assistants that involve all forms of assistance and initiation. Since planning assistance presents new and largely unexplored challenges, we focus our efforts here. Notably, we monitor analysts’ reactions to an assistant that offers new planning information that possibly differs from their current analysis context (i.e., analysis code and notes). In accomplishing this, we also explore an assistant that raises suggestions without direct invocation from the analyst.
2.3. Design Guidelines for Human-AI Interaction
In general, designing AI-based user-facing systems is challenging since designs must face issues that include explainability (Liao et al., 2020; Kim et al., 2022), trust (Kunkel et al., 2019; Liao and Sundar, 2022; Toreini et al., 2019), user control (Shneiderman, 2020; Horvitz, 1999), and user expectations (Luger and Sellen, 2016; Kocielnik et al., 2019). As a result, there is a rich history of literature on design guidelines for Human-AI interaction to address these challenges (Horvitz, 1999; Amershi et al., 2019). Similar practitioner-facing guidelines have also been released in large companies (Google, 2019; Apple, 2019; IBM, 2019).
Though these resources address common challenges in Human-AI interaction design, designing a system still requires support for domain-specific examples and proper problem formulation (Yildirim et al., 2023). In other words, these resources do not address the specific Human-AI interaction challenges surrounding the design of data analysis assistants (e.g., the timing of assistant-initiated planning assistance). Our work focuses exclusively on identifying specific goals and problems for designing analysis assistants. Based on findings from a Wizard of Oz study, we propose design guidelines specifically for developing these assistants (Table 3).
With respect to designing analysis assistants, McNutt et al. (McNutt et al., 2023) studied computational notebooks as a medium to provide AI-based execution assistance for data scientists. They conducted an interview study and presented participants with slide-based prototypes of interfaces. In contrast, our work concentrates on the open challenges in understanding the scope of (Sec. 3) and developing for (Sec. 6) planning assistance. Instead of focusing on the medium where the assistant resides, we focus on identifying factors that make assistance helpful.
3. Categorizing Suggestion Content
| Suggestion Dimension | Example | |
|---|---|---|
| Domain Background | Similar Analyses Done in the Past The question of whether skin tone influences the way referees make decisions in soccer games has been a topic of research for some time. One of the most well-known studies in this area is ”Racial Bias in the Allocation of Fouls in Soccer” by Price and Wolfers (2010)… | |
| Data Wrangling Assistance | Reminder - Check for Missing Data Always check for missing data values in your DataFrame before performing any data analysis or machine learning tasks. Missing data can cause unexpected errors and affect the accuracy of your results. # Use boolean indexing to filter the DataFrame and show only the rows with missing values rows_with_na = df[df.isna().any(axis=1)] rows_with_na.head() … | |
| Conceptual Model Formulation | Other Variables that Might Influence Red Cards: Age Variable Rationale Beyond just skin tone, we can consider other variables that might affect the analysis. As birthday is in the dataframe, we might want to control for age, which is a common practice in research studies, since age can affect various aspects of behavior and cognition. One reason to control for age is to account for the tendency of impulsivity, which may be associated with receiving red cards, which decreases with age… | |
| Operationalizing Constructs | Skin Tone Operationalization Right now, skin tone rating is represented by rater1 and rater2. The rater1 and rater2 variables could also be averaged and rounded to the most central value. In addition, we could also create a binary variable based on a rating threshold. This way, we could work with only one variable for player skin tone. Ultimately, it is up to you to decide which decision to make to ensure the validity and reliability of your results. The code below shows a basic template for the above ways of representing skin tone… | |
| Choosing the Statistical Model | Using a Poisson Model In this scenario, we want to investigate the relationship between a player’s skin tone and the number of red cards they receive from referees. Since the outcome variable, i.e., the number of red cards received by a player is a count variable (i.e., it is a non-negative integer), it might make sense to consider a Poisson model to analyze this relationship… | |
| Model Results Interpretation | Results Interpretation The regression model suggests that skin tone and the number of goals are both significant predictors of receiving red cards. The R-squared value of 0.005 indicates that the model explains only a small proportion of the variance in the redCards variable… | |
| High-Level Planning | Consider Including Covariates Covariates are additional variables that can affect the relationship between the predictor variable and the outcome variable in an analysis. To accurately understand the relationship between the predictor and outcome variable, it is important to consider the effects of these covariates. Including covariates in an analysis can help to control for potential confounding variables… | |
| Execution Assistance | Answering: Is the number of red cards associated with some unique referee ID? How does this vary among different skin ratings? Here is some code to answer this question. # Group the data by unique referee IDs referee_groups = df.groupby(’refNum’) … |
To identify the circumstances in which planning suggestions are helpful (RQ 2), we first establish categories of relevant suggestion content (RQ 1). In our subsequent Wizard of Oz study (Sec. 4), we use this categorization to derive suggestions and observe analysts’ reactions and preferences.
We conducted a literature review to identify existing challenges data analysts face. We then examined real-world results from a crowd-sourced analysis study, where multiple independent analysts made decisions given the same data and research question. This helped us understand variations in analysis decision-making, determine points where alternative approaches would be plausible, and observe what these approaches might look like.
3.1. Literature Review
We began by identifying works that study the data analysis process and present opportunities for assistance. We searched Google Scholar with the keywords ”sensemaking data analysis” from which we iteratively snowball sampled (Wohlin, 2014). We sought papers that discussed the end-to-end data analysis process and challenges suitable for a text-based assistant. Therefore, we did not focus on problems with specific systems (Shrinivasan and van Wijk, 2008; ah Kang and Stasko, 2012) or address common analysis challenges related to software and debugging (Kandel et al., 2012; Chattopadhyay et al., 2020; Gu et al., 2022), communication (Zheng et al., 2022; Wang et al., 2021), and data provenance (Kery et al., 2018; McNutt et al., 2023; Xu et al., 2015).
Our review resulted in 15 publications that addressed data analysis in various domains (e.g., food delivery, education, medical imaging, etc.), analysis tasks, and groups of data workers (e.g., enterprise workers, researchers, college students, etc.). From these works, we identified broad categories of assistance. These included: domain expertise information (Jun et al., 2021; Liu et al., 2020a; Wongsuphasawat et al., 2019; Boukhelifa et al., 2017; Wild and Pfannkuch, 1999), additional statistical knowledge (Jun et al., 2021; Liu et al., 2019, 2020a), guidance for statistical modeling (Jun et al., 2021; Huber, 2011; Wild and Pfannkuch, 1999; Bissell and Chatfield, 1988; Grolemund and Wickham, 2014), guidance for analysts’ hypothesis derivation (Jolaoso et al., 2015; Battle and Heer, 2019; ah Kang and Stasko, 2011; Alspaugh et al., 2019), alternative decisions (Liu et al., 2019, 2020a; Kale et al., 2019), and data analysis specific execution assistance (Raghunandan et al., 2022b; Liu et al., 2020a; Wongsuphasawat et al., 2019; Jun et al., 2021; Alspaugh et al., 2019).
We then refined these categories by examining and comparing independent analyses from a crowd-sourced analysis study, described next.
3.2. Behavior-driven Analysis of a Crowd-Sourced Data Analysis Study
In crowd-sourced data analysis studies (Silberzahn et al., 2018; Breznau et al., 2022; Schweinsberg et al., 2021; Dutilh et al., 2018; Botvinik-Nezer et al., 2019; Bastiaansen et al., 2019; Menkveld et al., 2021), numerous independent teams of analysts conduct analyses answering the same research question with the same dataset. Though originally intended by authors to study variations in analytical choices and how they impact analysis conclusions, these studies also offer high-fidelity data about code and rationales behind analysts’ decisions.
In this work, we chose a crowd-sourced study (Silberzahn et al., 2018) that addresses the research question: Are soccer players with a dark skin tone more likely than those with a light skin tone to receive red cards from referees? The study provides a real-world dataset for answering the research question and includes analyses from 29 teams of analysts. The question and dataset are of moderate practical difficulty and complexity, encouraging different but reasonable analytical approaches. Furthermore, the domain of the study, soccer, is approachable to general audiences, reducing the likelihood of substantial differences in analysts’ domain expertise.
We analyzed the soccer dataset for alternative approaches to an analysis decision at any point in the analysis process (e.g., data wrangling, statistical modeling, inference, etc.). To do so, we looked for decisions with high variance between analysis teams (e.g., choosing specific covariates). From these decisions, we observed approaches (e.g., choosing player position as a covariate) that could help introduce other analysts to alternative approaches and mental models. These decisions informed categories of suggestions that aid in the various stages of the end-to-end analysis process.
These categories both corroborate and make more specific those outlined in the literature review. For instance, guidance for statistical modeling from the literature review includes two aspects we uncovered in the crowd-sourced study: conceptual model formulation and operationalizing constructs. Likewise, alternative decisions captures both high-level planning (which helps analysts consider broader analysis decisions) and more specific planning decisions better summarized by the other categories. We discuss different abstractions of planning assistance in Section 6.1. From studying independent analyses of the crowd-sourced data, new categories, such as data wrangling and model results interpretation, also became apparent.
3.3. Results
A summary of our suggestion categorizations is shown in Table 1, which includes examples we later developed for our Wizard of Oz study (Sec. 4). Full examples of suggestions in each category are also in the appendix. The literature review spanned domains and tasks, covering broad categories of assistance (e.g., guidance for statistical modeling). Examination of the crowd-sourced study then helped facilitate more specific and new categories of help aimed at critical steps in the end-to-end analysis process (e.g., choosing the statistical model). All categories except execution assistance are intended as planning assistance, helping the analyst reason about and consider alternative analysis decisions. Likewise, while the categories may not cover every possible helpful suggestion, based on our research, we expect high coverage.
Overall, these categories encapsulate the collective approaches and rationale of expert-written analyses. Thus, they are likely to be helpful for analysts working on a variety of research problems. However, it is unclear to what degree suggestions from these categories would be helpful and what factors influence this judgment. To answer this, we conducted a Wizard of Oz study.
Wizard of Oz Study Setup
4. Wizard of Oz Study
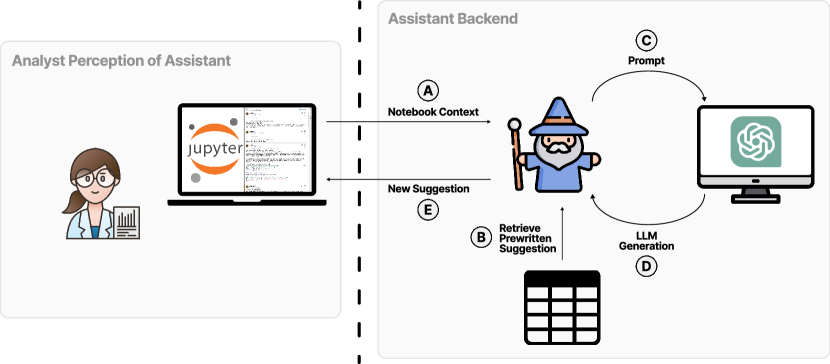
We conducted an exploratory lab study using a Wizard of Oz protocol (Maulsby et al., 1993; Dahlbäck et al., 1993) to understand the types of suggestions analysts prefer and how these suggestions might affect their workflow. In our study, participants interacted with a data analysis assistant housed in a customized JupyterLab interface which, unbeknownst to them, was controlled by a human “wizard”. Our wizard (Fig. 3) simulated an LLM-based data analysis assistant. The wizard managed the LLM interaction manually, drawing from a predefined list of answers to make planning and execution suggestions while participants carried out a data analysis task.
Participants. We recruited participants who were already familiar with statistical analysis and programming experience. We contacted potential participants through analysis-related mailing lists at our institution. From a pool of 60 volunteers, we selected the 13 (Table 2) with the highest self-reported language and statistics proficiency and familiarity with writing analyses in computational notebooks. We chose not to consider novices, as they would be too limited by execution challenges (Liu et al., 2020a; Kandel et al., 2012) to be able to fully benefit from analysis planning in its current form. Since even trained analysts face difficulties in analysis planning (Kale et al., 2019), supporting those with expertise is a crucial step in supporting everyone. Participants received a $50 gift card as compensation. We denote participants by anonymous identifiers, like AX, and quote them, “like so”.
Procedure. We conducted our study in a lab on a MacBook Pro on a 27-inch monitor. One author, in the lab with participants, served as the coordinator. Another author, the wizard, participated from a physically separate room over Zoom (which was also used to record the session with consent) under a pseudonym. Participants were unaware of the wizard and that the wizard was able to hear and see their screen.
The study lasted roughly 2 hours and consisted of three phases, consisting of a tutorial (15 minutes), the primary task detailed below (75 minutes), and a semi-structured interview (30 minutes). In the last of these phases, the coordinator asked participants to review each suggestion they saw, give a positive, neutral, or negative reaction to whether the suggestion was helpful, and explain why. We then asked about the impact the assistant’s recommendations had on the participant’s process, what participants valued from the assistant, and what sorts of actions or information they would have liked the assistant to provide. At the end of the study, we revealed how the assistant actually worked.
Prior to the study, participants were asked about their preferred programming language and the analysis libraries. We created a notebook for each participant with their preferred language and tools. We wanted to ensure that the lab environment was as familiar as possible.
The study coordinator took notes throughout the analysis phase and the semi-structured interview. One author viewed the recordings and transcribed all episodes of interest. To define common themes that emerged, two of the authors conducted iteratively open coding the recordings.
Task. The bulk of the study consisted of a data analysis task—namely the task conducted in the crowd-sourced study222In the interest of time, we made some minor adjustments to the dataset. We sampled a subset of the data to simplify computational manipulation while maintaining the overall distribution of the dependent variable (red cards) across levels of the main independent variable (skin tone). Additionally, we focused on the ten most frequently used variables across analyst teams in the original crowd-sourced study. considered in Sec. 3—in the context of a JupyterLab notebook customized to have a planning equipped assistant (Fig. 4). Participants were asked to imagine they were leading a research team that had collected the dataset, following a similar methdology from Jun et al. (Jun et al., 2021). To prime participants, we told them that their analysis results would impact a major policy decision—namely whether the soccer league invests money in bias training. We stressed the importance of having reasonable rationales for their analysis decisions and that their decisions must be robust against alternative assumptions. Likewise, to encourage comfort with the lab environment, we mentioned that we were not interested in the completion of the analysis but in their analysis process.
Once participants were familiar with the task, the coordinator toggled on the assistant and introduced how its suggestions were raised. We described what the system can do (e.g., make suggestions based on the notebook context), being careful not to anthropomorphize the assistant to facilitate accurate evaluations (Khadpe et al., 2020). We encouraged participants to think aloud or document their process in a notebook. They were free to use any external resources.
| ID | Gender | Occupation/Background | Programming Lang. | Lang. Proficiency | Statistics Proficiency |
|---|---|---|---|---|---|
| A01 | Male | Professor in Public Policy | R | 4 | 4 |
| A02 | Male | PhD Student in Public Policy | R | 5 | 4 |
| A03 | Male | PhD Student in Civil Engineering | Python | 5 | 4 |
| A04 | Male | Research Scientist in Public Policy | R | 5 | 4 |
| A05 | Female | Masters Student in Data Science | Python | 4 | 4 |
| A06 | Female | Masters Student in Data Science | Python | 4 | 4 |
| A07 | Male | Masters Student in Data Science | Python | 4 | 5 |
| A08 | Female | PhD Student in Atmospheric Sciences | Python | 5 | 5 |
| A09 | Female | PhD Student in Political Science | R | 4 | 4 |
| A10 | Male | Data Scientist | Python | 5 | 5 |
| A11 | Female | Masters Student in Data Science | Python | 4 | 4 |
| A12 | Male | PostDoc in Materials Science | R | 4 | 4 |
| A13 | Female | PhD Student in Computational Finance | Python | 4 | 4 |
Interface
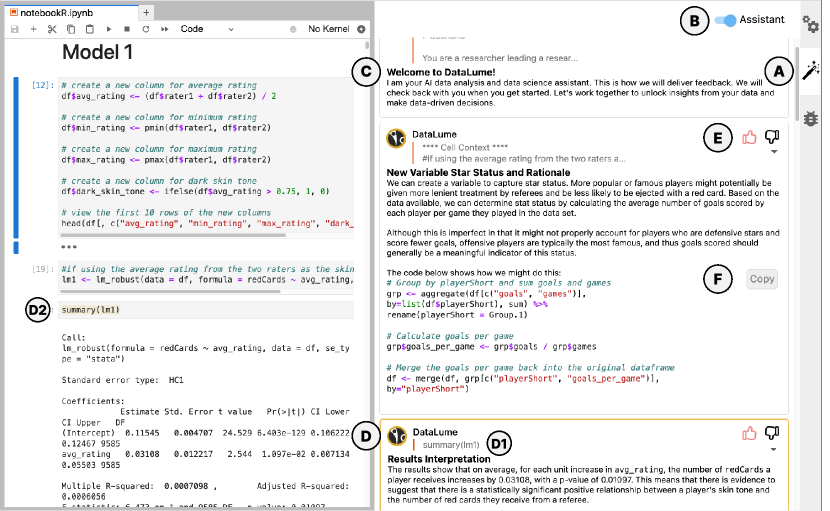
Assistant Design. The design of our assistant closely followed recent explorations for assistants in notebooks (McNutt et al., 2023) and is shown in Fig. 4. We focused on notebooks because they are an extremely common medium for data analysis (Shen, 2014; Rule et al., 2018). We place our assistant within a side panel which affords an apparently global perspective across the notebook. This scope helpfully implies that the suggestions integrate information from across the notebook. By keeping the suggestions separate from the participant’s working notebook, we minimize any interference with their code, notes, and overall process. As in other triggerless systems (Jayagopal et al., 2022), participants received suggestions from the system without needing to take specific action. Given this design, there is no direct UI element for controlling the generated topics or to refine suggestions (similarly to Copilot’s tab view). Also like Copilot, participants could influence the assistant by writing specific comments in their notebook. This comment writing behavior was not described in our introduction but emerged naturally across multiple participants. As suggestions from the wizard began to reference participant comments as the relevant notebook context, some participants took notice and began to write additional comments, expecting assistant help.
Raising and Creating Suggestions. When and what suggestions the wizard raised were guided by several principles. The wizard raised suggestions when they were relevant to the text, with priority given to the most recent additions (Amershi et al., 2019). When possible, the wizard offered planning suggestions, but execution assistance was provided when it was deemed required. Examples include when participants were stuck debugging outputs or wrote notebook comments asking for specific help (Sec. 5.5). The wizard attempted to strike a balance between a rich diversity of suggestions and not overwhelming the participant with excessive feedback. Finally, we simulated an assistant that could learn over time what suggestions the analyst found helpful–following common Human-AI guidelines (Amershi et al., 2019). To wit, the categories of suggestions we raised depended on whether the suggestions already given were considered or taken. If the participant disregarded many suggestions that addressed alternative variables, we raised these suggestions less often.
Creating suggestions followed the analysis conducted in the previous section (Sec. 3). For categories such as domain background and operationalizing constructs (Table 1), the same or very similar suggestions could be given to different participants. To speed up the assistant’s response time, we prepared a spreadsheet of suggestions (based on Table 1) in these categories before the study for the wizard to draw from (Fig. 3B). We created 32 suggestions across these categories. We deliberately crafted all suggestions with pertinent explanations and relevant domain and statistical knowledge. For most suggestions, we also included example execution assistance code to help participants grasp and implement the given recommendation. Though these planning suggestions featured execution assistance elements, their primary intent was to aid in analysis planning.
For categories execution assistance or model results interpretation (Table 1), suggestions were closely tied to the context of the working analysis which precluded previously created suggestions. For these categories, we leveraged ChatGPT (OpenAI, 2022) and constructed prompts to build suggestions. Prior to the study, we created a general prompt introducing the task and dataset. In addition to this general prompt, the wizard, who prepared the spreadsheet of suggestions and is experienced in using LLMs, crafted prompts in real-time using the notebook context (Fig. 3A) or parts of pre-written suggestions (Fig. 3B). The wizard then passed the prompt to ChatGPT to generate the suggestion of interest (Fig. 3C). ChatGPT was further used to refine some generated code—for example, to convert code between programming languages or shorten the length of a prior generation (Fig. 3C-D loop). The wizard sometimes manually adapted and corrected the output of a ChatGPT generation (e.g., changed the wording or variable names in code) to ensure high-quality suggestions.
Limitations. While able to elicit a variety of realistic user reactions to a new form of assistant this design has some limitations. While a complete implementation of full system would be useful, our goals in this work are to better understand the design of such assistants rather than their implementation. Similarly, through this approach we are not limited by the capabilities of current LLMs (Sec. 2.2) or participants non-expert prompt engineering abilities (Zamfirescu-Pereira et al., 2023; Mishra and Nouri, 2022). Having a wizard create and deliver suggestions also raises a potential downside of being slower to respond than an automated system. However, we chose to conduct our study with a single analysis task and dataset so we could prepare high-quality suggestions in advance. This helped us both ensure a high quality and rich diversity of suggestion content and timing while being only slightly slower than a fully automated approach.
5. Results
Suggestion Reactions
Our Wizard of Oz study explored two main questions: what characterizes helpful suggestions (RQ2), and how these suggestions impact analysts’ workflows (RQ3).
With respect to RQ2, we found that analysts preferred suggestions that matched their analysis plan and their statistical and domain background (Sec. 5.1). They preferred both execution and planning assistance, though planning required more cognitive effort (Sec. 5.2.1). As a result, explanations provided in natural language, supplemented by code comments, and the code itself greatly assisted analysts in understanding the intent and rationale of suggestions (Sec. 5.2.2). Moreover, due to the extra effort to consider planning assistance, analysts highly valued suggestions when they were well-timed to their current workflows (Sec. 5.3).
For RQ3, we found well-timed and well-reasoned planning assistance often helped analysts consider and make alternative decisions (Sec. 5.2 and 5.3). In contrast, analysts were reluctant to incorporate suggestions when it was mismatched to their backgrounds or current workflows. Likewise, we observed potential drawbacks of AI-assistance: some analysts became distracted or overly reliant on the assistant’s suggestions, often without taking the time to critically assess their relevance or correctness (Sec. 5.4). Nevertheless, these impacts were not uniform across all scenarios and varied depending on the individual analyst (Sec. 5.1), the type of assistance (Sec. 5.2), and when the suggestion was made (Sec. 5.3).
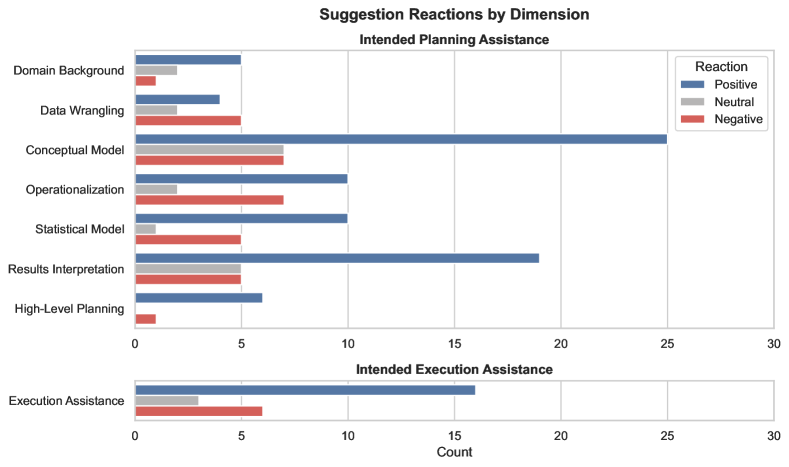
Overall, analysts’ reactions to raised suggestions show that suggestions from all categories were helpful, with slight variation among categories (Fig. 5). However, analysts found the assistance to be unhelpful in certain situations (Sec. 5.1 and Sec. 5.3). Triangulating their ratings with interview data revealed subtleties in analyst-assistant interaction dynamics (Fig. 6). Below, we describe the helpfulness of suggestions, the suggestions’ impact on analysts, and analysts’ overall experience using a ”who, what, when, why, and how” framework to organize our findings. In particular, we describe observations that relate to the analyst’s background (Who, Sec. 5.1; Fig. 6G), the suggestion content (What, Sec. 5.2; Fig. 6E), the timing of suggestions (When, Sec. 5.3; Fig. 6E), reasons to use a data analysis assistant (Why, Sec. 5.4), and analyst vs. assistant initiative (How, Sec. 5.5; Fig. 6A). Though analysts expressed preferences for ”where” the assistant should be placed on the UI, these preferences did not impact their overall workflow; we include our observations for the assistant’s location in the appendix.
5.1. Who – Analyst Background
Our study revealed many aspects of an analyst’s background that influenced their perception of suggestions and overall experience. In this section, we discuss their analysis plan (Sec. 5.1.1), statistical and domain backgrounds (Sec. 5.1.2), and prior experiences with and curiosity about AI-based assistants (Sec. 5.1.3).
5.1.1. Analysis Plan
Different analysts exhibited different levels of analysis planning and rigidity in their analysis plans. While all analysts had a rough plan, some took extra time to explicitly detail their analysis steps [A3, A5, A9, A10, A11]. For example, A9 spent the first 20 minutes planning on scratch paper before writing a single line of code. In other instances, analysts considered approaches that were familiar. For example, A4, who was familiar with Species Distribution Modeling (Franklin and Miller, 2010) (i.e., a statistical approach that predicts species’ geographic distribution based on environmental variables), mentioned that approach as an initial idea for planning.
Likewise, analysts often liked suggestions from the assistant when they matched their own ideas for their analysis plan (8/13 analysts). They appreciated that the included code offered additional execution assistance to implement their plan. For example, when talking about a suggestion recommending Age as a variable, A12 noted “I really liked this one. I wanted to do this. I think it actually somehow knew that I was going to do this, and then it suggested a very efficient way to do so.” Furthermore, for A5, such suggestions reaffirmed their decisions: “The assistant actually gave the same conclusion that I had typed, so that was helpful.”
Overall, analysts frequently favored suggestions that matched their analysis plan. Given variations in how they plan, they also wanted ways to specify the level of assistance they received (Sec. 5.5).
5.1.2. Statistical and Domain Knowledge Expertise
We observed disparities in individual levels of statistical and domain expertise across analysts and throughout the course of the analysis. This affected how analysts reacted to the assistant’s suggestions.
In general, analysts had no trouble understanding the feedback for most suggestions (11/13 analysts). Likewise, 10/13 analysts found suggestions helpful when they were well-matched with their expertise and helped them consider new approaches.
Occasionally, due to variations in statistical expertise, some analysts found suggestions helpful while others found them overly basic and unnecessary [A1 A3, A5, A7, A8]. This was most evident with the results interpretation suggestions created using ChatGPT. Some analysts liked these suggestions [A5, A6, A7, A10, A11, A12], while others adopted a more neutral stance [A8, A4]. A1, a statistics professor with extensive expertise in computational social science, regarded the suggestions as unhelpful: “It was giving me comments on my results. It was not telling me whether it was good or bad which I knew already.”
Suggestions were occasionally unfamiliar since some analysts lacked an adequate statistical background [A3, A5, A6, A8, A9, A13]. This led to varying behaviors: A3, A5, and A13 chose to ignore unfamiliar suggestions completely; A6 and A8 spent time trying to understand the suggestion but were left confused; and A9 considered referencing external sources to interpret the suggestions: “My first idea is to try and copy and search on the internet to see how this kind of generalized linear model could help me.”
Suggestion that were mismatched with the analyst’s statistical background were unhelpful or required significant additional effort to understand. This compounds the already intense concentration and effort needed to consider planning assistance (Sec. 5.2.1).
5.1.3. Prior Experience with and Curiosity about AI-based Assistants
We found that analysts’ own views about AI led to behaviors and reactions that diverged from the immediate analysis task.
Analysts had mixed prior experiences working with AI-based code assistants (i.e., Github Copilot, ChatGPT). Over half of them had no experience [A1, A2, A3, A6, A9, A12, A13]. Other analysts had varying degrees of experience, ranging from a few times in total [A4, A7, A8] to regularly using such assistants [A5, A10, A11].
Without knowing many details about how the system worked, some analysts were curious about the assistant [A1, A4, A8, A12]. A4, for example, was open to what the assistant suggests: “We can try a basic linear model, which should not be very good, but I’m curious to see what (the assistant) tells me after that.” A8, on the other hand, became more distracted by their curiosity: “It made me want to understand how this (worked). I was getting distracted. What is it learning from? Is it from the data and knows all the variables or from what I am asking for? I feel like I was experimenting a lot with putting little notes and seeing what would happen.”
Analysts were occasionally skeptical about the correctness of the suggestion [A4, A5, A8, A13]. A8 and A13 questioned the resources that informed it. Referring to a suggestion that referenced external studies, A8 mentioned, “I have less trust of something that is a more generated summary of stuff that exists outside of the notebook, that I didn’t know where the information came from.” Additionally, A4 was surprised by the suggestions the assistant provided given prior experience using ChatGPT: “I am very surprised because when you ask ChatGPT about something really obscure, it might give you good information or something bullshit, and this seemed tightly reasoned. It’s a little spooky.”
Our observations are consistent with existing work (Liao and Sundar, 2022) that models trustworthy AI, where a user’s attitude towards an AI system (and therefore subsequent reactions to the system) depends on individual, environmental, and cultural contexts in addition to the system’s trustworthy cues.
5.2. What – Suggestion Content
Though we found that the exact category of planning content (i.e., the categories in Table 1) was less important for depicting the helpfulness of a suggestion (Fig. 5), the type (planning and execution) and specificity of assistance were preferred in different situations (Sec. 5.2.1). Moreover, we found well-reasoned explanations to be important to analysts (Sec. 5.2.2).
5.2.1. Execution vs. Planning Assistance
All analysts in our study appreciated execution assistance, occasionally rating it negatively only when it came too late or differed from what they had intended. In our study, execution assistance ocurred in two ways: (1) on its own when analysts were struggling with executing their plan, or (2) as part of intended planning suggestions. Analysts appreciated that execution assistance helped save time and prevented them from having to do internet searching (8/13 analysts). For example, A3 liked that a suggestion to consider a BMI variable included the code to calculate it: “I don’t know how to calculate BMI off the top of my head, and it was like ‘Hey, here’s how you calculate it’. Perfect, saves me a Google.” These preferences support prior observations that productivity and reduced online searching are major perceived benefits of AI-based code assistants (Vaithilingam et al., 2022; Ziegler et al., 2022).
Some analysts would have preferred even more execution assistance [A2, A3, A4, A5, A13]. For example, A5 and A13 expected more help when faced with errors. Likewise, A3 wanted the assistant to execute the code for them, such as for visualizations. Similarly, A2 wanted high-level help with “understanding the differences between libraries.”
With respect to planning assistance, most analysts found it to be helpful. Helpfulness depended less on the category of suggestion than on the timing with respect to analysts’ own paths (Sec. 5.3 ). Planning suggestion content often presented an idea to analysts that they had not previously considered (12/13 analysts). For instance, A10 contrasted our assistant’s planning merits with other assistants: “Auto-complete code (assistants) are very good, but they are looking at what you are doing right now and maybe the last cell. This agent could take a more overall approach and help you think about the overall approach.” In other situations, the suggestions also helped analysts realize key steps they would have otherwise missed. A2 found this assistance quite constructive: “Interesting, this is helpful. I didn’t realize that skin tone rating was a combination of rater one and rater two.”
However, while most suggestions the assistant presented were tied to specific moments in the analysis process, some analysts wanted broader analysis planning help [A2, A3, A6, A7, A8]. A3, for example, mentioned how at the beginning of the analysis, “recommendations for how to think about the problem would (have been) good.” Similarly, A2 wanted suggestions that could provide a whole analysis plan: “Given the dependent variables and the data structures, what are some of the analyses I could run? If I need to run different analyses, how would I need to transform the data, with suggestions or sample code of how I can do that?” In these situations, analysts might benefit from workflow scaffolding recommendations similar to those in Lodestar (Raghunandan et al., 2022a) or litvis (Wood et al., 2019).
5.2.2. Suggestion Explanations
Several analysts liked the explanations included in the suggestions [A2, A5, A6, A7, A8, A9]. For A5 and A9, both the included code and comments acted as explanations that helped them understand what the assistant was trying to do. For A9 in particular, explanations helped bridge a lack of trust in the assistant about a new calls-per-game variable suggestion: “I’m not trust(ing) with the calls-per-game, so I checked with every line of the code if they actually write what I’m thinking about.” Meanwhile, explanations for why a planning suggestion should be considered were also preferred. A2 was especially enthusiastic: “I love the justification of why you would want to use age.” Similarly, A7 valued the pros and cons offered by the explanation, which they felt gave them control of the final decision. A8’s opinion on the other hand, was more nuanced and tied to their statistical expertise (Sec. 5.1.2); they liked the suggestion overall and the explanation seemed to be logically sound, but they were not sure whether it was the right path to follow: “I haven’t thought about this kind of statistics since I was a sophomore 13 years ago… The description here seemed like this would be better… I don’t know if I was being led astray by the assistant but I found this very convincing. But I don’t have the fresh statistical knowledge to actually know if it was a good statistical approach or not.”
However, the explanations were also seen as detrimental at times [A2, A6, A8, A13], depending on the analyst’s expertise (Sec. 5.1.2) and focus on their own analysis plan (Sec. 5.3). A13 ignored suggestions when “there is too much explanation”. Similarly, A2, who appreciated the explanation for the inclusion of age, thought that some suggestions contained too much text.
Moreover, for A6, the explanation was insufficient and so confused them: “Because I didn’t understand why it was trying to include goals per game, I was kind of confused”. This sentiment is similar to those expressed by programmers working with AI-based code assistants; they struggled to understand the suggested code which hindered their ability to solve tasks (Vaithilingam et al., 2022).
5.3. When – Timing of Suggestion
A common factor that influenced analysts’ perception of suggestions’ helpfulness was when the suggestion was raised relative to their current progression in the end-to-end analysis process. For A5, suggestions often seemed unresponsive to their current workflow: “(With) this assistant, very often the suggestions aren’t in line with what you’re currently typing. It goes in a whole different direction, and now you have to think of whether you want to take that direction or your direction.” In most situations, when analysts focused on their own plan, suggestions considered unhelpful at the moment would have been helpful if offered at a different time (9/13 analysts). For A7 and A10, suggestions that were unhelpful in the moment aided in future decision making. For example, A7 mentioned: “If I think it deviates too much, then I ignore it. There were a couple of times for the CHI-squared where I was like ‘Oh yeah that’s a good idea.’ I didn’t do it at the time, but I put a pin on it.” In other cases, analysts thought the suggestions came past the point they were needed in their analysis [A3, A6, A13]. A6 would have preferred a covariate suggestion to come earlier: “It did explain how it would be necessary, but maybe if it came before I did the covariate analysis (and) before I coded it out.”
As a result, when analysts found the suggestions out of sync with their current analysis plans, they would ignore them to continue their previous line of thinking [A5, A6, A10, A11, A12, A13]. For example, A3 wanted to focus on their current step: ““I ignored it because I was focused on the variables at the time.” For A5, poor timing also led them to ignore it: “I don’t know if this was relevant or not. I didn’t read it completely because I was trying to complete what I already started.” Timing issues also slowed down A5’s process since they had to stop and consider the merits of the suggested direction. Therefore, given the costs of considering planning assistance, appropriate or non-intrusive timing of suggestions is even more crucial.
Nevertheless, when suggestions deviated slightly from analysts’ tasks, thereby requiring less effort to consider, analysts were open to them [A2, A5, A7, A9, A12]. For instance, while working through some statistical models, A7 took into consideration a recommendation to use the existing birthday column to create an age variable: “Honestly, birthday didn’t hit me at that moment before the suggestion that popped up to calculate age. Without the suggestion, I wouldn’t have thought of it unless I ended up reading about it and then including it a lot later.”
Inherent in the observations is the tension between not disrupting the analyst and raising important considerations that might impact the analyst’s conclusions. Given the consequences of spurious analysis conclusions, the perceived helpfulness of suggestions may not be the only important outcome. We discuss this in Sec. 6.1 and 6.2.
5.4. Why – Reasons to Work with the Assistant
We now describe analysts’ overall experiences with the assistant and explore the reasons why they want to use one. These reasons are influenced by its impacts on their workflows (RQ3), which is in turn shaped by various elements of the assistant, such as the timing (Sec. 5.3) and content (Sec. 5.2) of the suggestions.
Generally, 11/13 analysts thought the assistant was helpful in their analysis process. Analysts frequently liked the code that was provided (Sec. 5.2.1), both for execution and planning assistance. For instance, A4 appreciated that the assistant saved them time by doing frequent coding tasks: “The one thing that I really liked about it is that it saves me from having to do a lot of mundane stuff like setting up a testing and training dataset for some sort of machine learning model.” Likewise, A5 especially valued the assistant-initiated execution assistance for helping them move past roadblocks: “It was fascinating, to be honest. Because very often you’re doing things, and you are stuck… and (the assistant saved) you that trouble of going somewhere else and googling things.”
Analysts also liked the planning assistance content provided by the assistant (Sec. 5.2.1). For instance, A9 found it particularly beneficial to consider alternative decisions: “The (assistant) is helpful for me to indicate some aspects to think about. Though I did not take all of them, I see this is something that I may need to take a look at.” Furthermore, A2 considered it particularly helpful to have a clear rationale for why they should incorporate a suggestion (Sec. 5.2.2): “I see a lot of potential and utility for this. As compared to when I’m typing in Gmail where it (suggests) words, this I find is much more helpful because it not only gives me the code but also gives the justification and rationale.”
However, given the quality and quantity of assistance provided by our assistant, A8 believed that it made them less engaged in critical thinking. For A8, the reason to use the assistant was to reduce their own cognitive load rather than to have an AI guide their decision making: “I feel like this ‘friend’ was great, but it also made me this clicking machine (rather) than an analytical thinker… Autopilot was a welcome path that I could choose.” This follows the findings in empirical Human AI collaboration studies in which people gravitate towards overreliance on AI support (Bansal et al., 2021; Buçinca et al., 2021; Lai and Tan, 2019; Buccinca et al., 2020).
5.5. How – Analyst or Assistant Initiative
Finally, our interviews also led to comments of whether analysts preferred the assistant or themselves to initiate suggestions. A few analysts appreciated the assistant taking the initiative [A4, A7, A9, A11]. For example, A11 liked that it “proactively goes ahead and gives you suggestions.” In addition, some analysts wanted more assistant initiative [A2, A3, A4, A9]. A2, for instance, wanted the assistant to automatically run code given their current workflow: “[I would want the assistant to get…] a sense of what my workflow is, has been, and is intended to be and pre-populate stuff for me. So if I normally run an OLS with varying degrees of variables, some included and some not included, generate a histogram for each. Do that for me.”
Analysts also liked that the assistant responded to their requests made in comments [A3, A8, A10]. During the study, analysts naturally wrote comments down in their notebooks, which the assistant occasionally used as the context for suggestions. Realizing this, some analysts continued requesting help in this way. A particularly illustrative example is when A8 typed “assistant: how do I control for leagueCountry?” into a cell. Though our design primarily assumed assistant-initiated planning assistance, since some analysts showed a preference for their own initiative during the study, we treated analysts’ comments as an initiative to elicit assistance.
Many analysts also wanted additional and different ways to directly ask the assistant for suggestions [A5, A6, A7, A8, A11, A13]. A5, A6, and A7 wanted to ask the assistant for suggestions via a prompt similar to existing LLM-based assistants (i.e., ChatGPT). For example, A5 wondered if they “could have typed something that says ‘plot discrete values scatter plot.’” Likewise, A11 wondered if the assistant could provide a list of relevant next steps via a keyboard shortcut.
Given the preference for both assistant and analyst-initiated assistance, multiple analysts suggested that this choice could be left for the analyst to control [A6, A7, A9, A13]. As a representative case, A9 proposed: “Maybe two modes: lazy mode and (control) mode. If I am in lazy mode, you should already construct things and add them (to the notebook). If I want to take over everything, please be quiet here. If I want you, I’ll call you.” This is akin to the two modes, acceleration and exploration, found in AI-assisted programming (Barke et al., 2022).
6. Discussion
In this work, we examined how to incorporate planning assistance into AI-based analysis assistants. To identify the scope of suggestion content, we initially performed a literature review and a behavioral-driven analysis of independent analyses from a crowd-sourced analysis study (Sec. 3) to define categories of relevant suggestions (Table 1). Next, we conducted (Sec. 4) a Wizard of Oz study to elicit the circumstances in which suggestions are helpful. Here, we discuss takeaways from our study findings and design guidelines for creating helpful assistants (Table 3).
| Assistants should … | ||
|---|---|---|
| Alignment | 1. Communicate with analysts to align on analysis goals. | (Sec. 6.3.1) |
| 2. Provide suggestion content suited to the analysts’ background. | (Sec. 6.3.2) | |
| 3. Match analysts’ preferred level of planning assistance abstraction. | (Sec. 6.3.3) | |
| Timing and Initiative | 4. Time suggestions based on analysts’ openness to considering alternative approaches. | (Sec. 6.3.4) |
| 5. Provide multiple ways to request content for different levels of abstraction. | (Sec. 6.3.5) | |
| Engagement and Trust | 6. Mitigate suggestion overreliance by promoting engagement and critical thinking. | (Sec. 6.3.6) |
| 7. Adopt multiple explanation methods for increased understanding and trust. | (Sec. 6.3.7) |
6.1. Analyst Perspectives on Planning Assistance
Analysts had varying perspectives on what planning assistance would be helpful. Notably, these perspectives not only differed among analysts but also evolved for the same analyst over time. In some moments, planning assistance was about assistance for specific analysis steps; during others, it was about guidance for their overall workflow (Sec. 5.2.1). A subset of analysts also found suggestions occasionally distracting, preferring to focus on their own analysis plan. Interestingly, despite a design that mainly provided suggestions to help analysts consider alternative but reasonable approaches, analysts frequently liked execution assistance (Sec. 5.4). This is consistent with the preferences found in prior works that studied code execution assistants (Vaswani et al., 2017; Liang et al., 2023; Ross et al., 2023).
Further, the perceived ”unhelpfulness” of some planning suggestions was often due to when these suggestions were presented (Sec. 5.3). When engrossed in a particular analytical task, analysts were often resistant to diverting their focus toward distracting suggestions. From a cost-benefit perspective (Vasconcelos et al., 2023), execution assistance is less intrusive, with its time-saving benefits more easily recognizable. Conversely, planning assistance demands more mental effort as analysts evaluate multiple analytical paths, underlying rationales, and the alignment with their prevailing strategies. This not only complicates the assessment of the utility of planning assistance but amplifies the drawbacks of sub-optimal suggestions.
Analyst-Assistant Interaction Dynamics
6.2. Balancing Planning and Execution Assistance
Though execution assistance offers time-saving advantages, it does not necessarily improve the robustness of analysis conclusions. Without well-reasoned planning considerations, execution assistance may focus on misguided directions resulting in wasteful efforts or misleading outcomes.
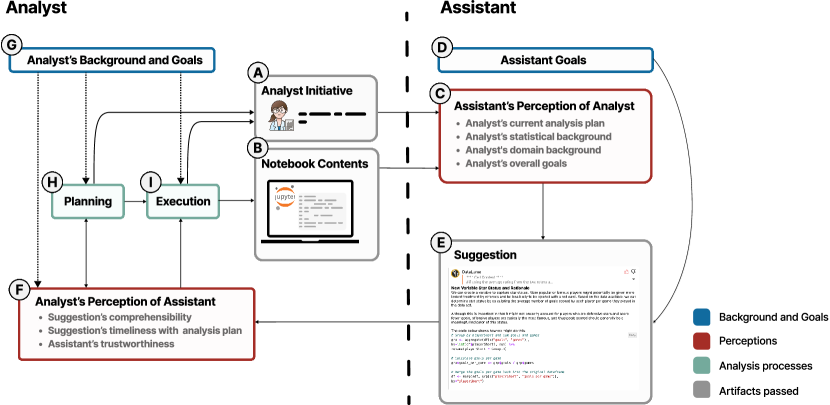
There exists an inherent tension between the intended goals of the assistant and the goals of the analyst who might predominantly favor execution assistance, leading to divergent views on what constitutes “helpfulness.” Though analysts’ goals are primary, assistants can play a crucial role in creating higher quality and more robust data analyses. Therefore, supporting analysts with only execution assistance may not lead to such outcomes. Striking a balance between understanding analysts’ perspectives of helpfulness and the assistant’s impact on the workflow is crucial for providing truly valuable suggestions. Given that planning suggestions often require deeper consideration, a mutual understanding of their appropriate timing is also imperative. An “ideal” assistant would completely understand the analyst’s background, overall goals, and current plan (Fig. 6G and H) and reconcile this with its own goals (Fig. 6D). Further, the analyst should also understand the assistant’s raison d’etre in addition to its capabilities.
To summarize, the assistant’s goals (Fig. 6C) should take into account the analyst’s goals (Fig. 6G) in the context of its own design and functionality (Fig. 6D). Likewise, the analyst’s perception of the assistant (Fig. 6F) should take into account their goals for analysis (Fig. 6G) and how the assistant can meet them (Fig. 6D). This common understanding is the basis from which truly helpful assistance can be provided and perceived.
6.3. Design Guidelines
Based on our results and discussion, we highlight seven design guidelines that extend Human-AI Interaction guidelines (Amershi et al., 2019) for designing a data analysis assistant.
6.3.1. Assistants should communicate with the analyst to align on analysis goals
During the analysis portion of our study, the wizard was occasionally misaligned with the analyst’s goals (Sec. 5.3). Likewise, analysts spent time figuring out the assistant’s goals (Sec. 5.1.3). Therefore, the analyst and assistant should establish shared goals at the beginning of the analysis, and this understanding should evolve over time. Although prior work on conversational agents has found users prioritize their goals and needs over the assistant (Clark et al., 2019), we posit that it remains vital to consider both parties in the interest of quality and robust analytical results. In the context of data analysis, adhering only to analysts’ execution preferences may perpetuate poor analysis decisions and practices, leading to misguided inferences (Sec. 6.2).
Thus, it is necessary for an assistant to communicate clearly the goals of planning assistance to the analyst. Then, the analyst and assistant can coordinate the optimal collaboration. Understanding the best ways to establish, integrate, and uphold shared goals over time is an important area for future exploration.
6.3.2. Assistants should provide suggestion content suited to the analyst’s background
Analysts differ in their statistical, domain, and coding backgrounds. We observed that these differences affected their analysis plan and reactions to suggestions (Sec. 5.1). The same suggestion considered helpful by some participants, could be found by others to be too elementary, too distracting, too distinct from their expertise (making testing its validity was prohibitively difficult), or too different from their usual analysis or coding practices to be useful (Sec. 5.1.2). Therefore, assistants should match suggestion content to the analyst’s background.
In these scenarios when the suggestion is too difficult or different to comprehend, the assistant should provide options to explain further or offer additional resources (e.g., links to relevant documentation and tutorials). Likewise, the assistant could suggest alternative, more approachable options. These additional explanations or approaches could be visible through a show/hide toggle.
In our study, the assistant did not explicitly request any information from the analyst. A more explicit definition of the analyst’s background knowledge, such as through analyst initiative (Fig. 6A), may help establish common ground. For instance, analysts could configure their backgrounds by providing a short bio or a completed template describing their educational background, a self-rating of their coding expertise, typical workflows, and preferences for analysis methods and software packages. The assistant could then use this as relevant context to customize LLM-based assistant suggestions (Andreas, 2022; Kirk et al., 2023).
6.3.3. Assistants should match the analyst’s preferred level of planning assistance abstraction.
As discussed in Section 6.1, there are multiple perspectives of helpful planning assistance. These can range from guiding analysts in choosing hyper-parameters to providing a comprehensive plan with multiple analysis steps. Future assistants should account for analysts’ preferences regarding desired levels of planning assistance and how these preferences may change throughout the analysis process. This could be communicated explicitly by the analyst (analyst initiative) via the user interface. For instance, analysts may want to iteratively refine their intent for assistance such as in Wrex, a non-LLM-based notebook extension that generates code through programming by example (Drosos et al., 2020). The assistant could also offer dials to the analyst to provide assistance, such as an ”execution” mode that focuses on code execution, a ”think” mode for specific planning suggestions, a ”reflection” mode for connecting decisions and highlighting potential missed steps, and an ”exploration” mode for higher-level planning suggestions.
The assistant can also learn analysts’ preferences by observing their behavior across multiple analyses. At a finer scale, since analysts’ needs may differ between analyses, the assistant should also learn analysts’ goals and behavior for the current analysis. Recent work (Park et al., 2023) in the context of simulating human behavior in AI agents leverages ChatGPT to store experiences in memory and dynamically retrieve relevant background to inform agent behavior. Data analysis assistants could utilize a similar framework to store analyst background and actions and use the appropriate information to determine the appropriate level of planning assistance to provide at different moments in the analysis. Future research could explore how LLMs can support this framework and identify characteristic behaviors of analysts engaged in execution and planning.
Likewise, the level of planning abstraction also relates closely to the scope of the analysis code that the assistance affects. An analytical decision could be one parameter, line, function, code block, or even multiple chunks of code (Liu et al., 2020b). Suggestions that impact large parts of the analyst’s analysis require more willingness from the analyst to consider and adopt. Thus, future assistants should consider the scope of analysis that a suggestion influences.
6.3.4. Assistants should time suggestions based on the analyst’s openness to considering alternative approaches.
Analysts in our study expressed their appreciation of certain suggestions but felt they were not well-timed based on their current analysis focus (Sec. 5.3). When analysts are focused on executing a specific analysis decision or plan, they may prefer execution rather than planning suggestions. Conversely, when they are considering their next steps, they may be more open to guidance for analysis planning. Therefore, assistants should recognize when analysts are open to planning assistance. Analysts could explicitly communicate their timing preferences to the assistant or use a “remind me later” response to raised suggestions. Additionally, organizing and tagging suggestions could help them easily find and revisit helpful suggestions even if their timing were not ideal.
Meanwhile, the assistant could also learn appropriate timing from analysts’ behaviors. For instance, prior work used sensors to model and predict human interruptibility (Fogarty et al., 2005). The assistant could also follow a utility model for mixed-initiative AI intervention by considering the expected utility of different actions (Horvitz, 1999). We note that this may be challenging if analysts fixate on rigid analysis plans and highlight the importance of establishing shared goals between the analyst and assistant (Sec. 6.3.1). While many analysts may prefer planning assistance, others may not. Given this tension and difficulty, considerations for the timing of suggestions may also benefit from the recommendations of polite computing (Whitworth, 2005).
6.3.5. Assistants should provide multiple ways to request content at different levels of abstraction.
Though preferring assistant-initiated suggestions, analysts also wanted to exert their own initiative in requesting suggestions (Sec. 5.5). Further, they showed different preferences for the level of planning assistance (Sec. 5.2.1). Therefore, assistants should provide analysts with multiple ways to request assistance for different levels of abstraction.
In terms of design, there is flexibility in the input mechanism and initiative. For example, analysts could write comments, select text, trigger suggestions via a hotkey, request proactive suggestions in a side panel, etc. Each could carry implicit context regarding the level of feedback they desire (McNutt et al., 2023). Ambient and textual interfaces (i.e., assistant follows the cursor and can be invoked via an action) suggest localized context and help. For example, a common workflow with execution assistants such as Github Copilot has the programmer write comments that detail what the lines of code should be to complete the task (Vaithilingam et al., 2022). Meanwhile, a side-panel interface with controls outside the immediate notebook suggests global context and assistance.
While existing systems usually offer one form of invocation, LLM-based analysis assistants should allow and interleave multiple forms of invocation and context for different levels of assistance. It is also essential to clarify the context for the LLM in each form of interaction. For example, a hotkey trigger at the line level could indicate a focus on execution assistance using only the current cell. On the other hand, analysts could specify broader suggestions when requesting feedback in the side panel and choose the LLM context by selecting relevant cells.
Interactive visualizations could also be employed to show and help analysts make decisions and consider alternative choices (Liu et al., 2019, 2020b). These visualizations (e.g., Fig 1), tied to the analysis code, could help analysts review their steps and select areas where additional assistance is needed.
6.3.6. Assistants should mitigate suggestion overreliance by promoting engagement and critical thinking.
LLMs are adaptable and powerful, but they can have erroneous outputs (Amershi et al., 2019; Bender et al., 2021). In our study, analysts showed varying levels of thoroughness in validating the model’s decisions, code, and outputs (Sec. 5.1.3). For example, one engaged analyst [A4] caught an error in which a ChatGPT-generated suggestion described a p-value of as significant. In contrast, we observed A8 act on “autopilot”, overrelying on the assistant’s suggestions without critical engagement (Sec. 5.4). This example of overreliance on AI is well documented in other scenarios (Buçinca et al., 2021; Bussone et al., 2015; Vasconcelos et al., 2023; Yin et al., 2019).
As data analysis often informs high-stakes decisions and findings (Baker, 2016; Cockburn et al., 2020; Aarts et al., 2015), it is critical for analysts to be aware of the decisions and rationales that comprise their analysis even as the assistant makes seemingly sensible recommendations. Therefore, assistants should reduce overreliance by introducing mechanisms to promote engagement and critical thinking with their suggestions.
One way to increase engagement is to provide explanations that make it easier to understand and verify the assistant’s suggestions (Vasconcelos et al., 2023). By reducing the cognitive effort of engaging with suggestions, analysts may be less prone to accept the assistant’s recommendation without scrutiny. For example, the system could present a visualization mapping the overall decision paths (e.g., something similar to Fig. 1) in the analyst’s current analysis to demonstrate how the assistant’s present recommendation would influence the overall analysis. The visualization could highlight decisions that would be affected or illustrate alterations in the decision paths. Additionally, incorporating multiple explanation methods could improve comprehension among analysts, a design guideline we further elaborate on in Sec. 6.3.7.
Besides simplifying the process of understanding the assistant’s suggestions, assistants could introduce cognitive forcing functions (Buçinca et al., 2021) to increase the cost of relying on the assistant. For example, the assistant could wait until analysts have submitted a rough scaffold of their analysis plan before providing suggestions. In doing so, analysts may become more engaged with the suggestion. Other measures might include making it slightly more challenging to adopt a suggestion immediately—perhaps by omitting a direct code copy-paste option, or offering only pseudocode or a code template. Presenting multiple suggestion options could also compel analysts to make the final decision independently.
However, it is essential to strike a balance. While it is important to foster active engagement, it is also crucial to ensure that these interventions do not deter analysts from utilizing AI assistance altogether. Cultivating critical thinking remains challenging, as underscored by a wealth of pedagogical research (Aliakbari and Sadeghdaghighi, 2013; Zhang, 2022; Yuan and Stapleton, 2020; Saleh, 2019).
6.3.7. Assistants should adopt multiple explanation methods for increased understanding and trust.
Analysts highly valued suggestion explanations to help them better understand and trust the assistant’s suggestions (Sec. 5.2.2). In our study, code, code comments, and natural language suggestion rationales all contributed to explaining suggestions. Explanations provided both rationale for why an analysis decision should be considered and definitions of potentially unfamiliar concepts.
Future assistants should incorporate multiple forms of explanations, considering analysts’ backgrounds and preferences. To avoid verbosity and introducing excessive cognitive load (Vasconcelos et al., 2023), assistants could allow analysts to select their preferred forms of explanation. Moreover, there are other potential methods to present suggestion explanations. For example, visualizations or animations of the data during and after data transformations could help analysts understand the assistant’s code actions (Pu et al., 2021; Xiong et al., 2022). Further, as recent work demonstrated, LLMs like GPT-4 can assess the quality of their output, approaching human-level judgment for tasks such as summarization and visualization (Dibia, 2023; Lin et al., 2022; Liu et al., 2023). As LLMs continue to improve, assistants could also provide model-generated critiques of their own suggestions as an initial pass at explaining the strengths and limitations of an approach.
Nevertheless, determining the best practices for designing explanations remains an open field of research (Bansal et al., 2021; Buçinca et al., 2021; Eiband et al., 2019; Vasconcelos et al., 2023). Future work could explore the effects of different explanation types in the context of a data analysis task. Unlike the tasks in many prior works on Explainable AI, there are often multiple reasonable paths in data analysis (Liu et al., 2019). Without an objectively “correct” answer, other measures besides accuracy—such as alternative paths considered, analysis quality (though this is difficult to evaluate), or analysts’ perceptions and actions—could help assess different explanation designs.
6.4. Limitations
Our Wizard of Oz study approach is not without limitations. First, the study focused on people willing to participate and perform data analysis with an AI assistant. This may affect analysts’ willingness to work with an assistant and eagerness to probe the assistant’s capabilities.
Next, to facilitate a lab study of reasonable duration, we chose to conduct a same-day, in-person study of two hours. If analysts had more time with the assistant, say weeks, they may have calibrated their expectations for the behaviors of the assistant and developed a better sense of when to rely or not to rely on it. Likewise, analysts may have developed a better sense of the assistant’s timing and goals.
Additionally, the time pressure, which can be realistic in certain scenarios, may have pushed analysts towards favoring execution assistance. Likewise, although we chose a Wizard of Oz study to enable greater control over the assistant and its suggestions, the lab setting may not have the same stakes as a real-world one. Outside the lab, conclusions from analyses may impact critical decisions, and analysts may be more careful because of this. As a result, they might be both more willing to accept planning assistance and place assistant suggestions under greater scrutiny. Nevertheless, we tried to mitigate this effect by priming analysts to give increased consideration to the robustness of their analysis decisions via our task and introductory material.
Moreover, we selected analysts who self-identified as having a high proficiency in statistical analysis. Since we were motivated to understand the mechanisms surrounding planning assistance, we determined that analysts with sufficient programming and statistical knowledge would be more engaged with analysis planning and our assistant’s suggestions; we found that even they were often unaware of the decisions and rationales our assistant offered. Because this cohort can form divergent analysis conclusions and are often the ones performing analyses that influence critical real-world decisions, understanding planning assistance with this audience is paramount. Analysts with less statistical and programming expertise may have different experiences and preferences when working with an analysis assistant. Future work could explore how execution and planning assistance may be incorporated for novice data analysts.
Finally, our study concentrated on analyst preferences, leaving the evaluation of the resulting quality of analyses—when provided with planning assistance—largely unaddressed. Determining the correctness of an analysis is inherently challenging given that real-world analytical questions can yield a range of defensible analysis approaches (Silberzahn et al., 2018; Breznau et al., 2022; Schweinsberg et al., 2021; Dutilh et al., 2018; Botvinik-Nezer et al., 2019; Bastiaansen et al., 2019; Menkveld et al., 2021). Often, there is no single “correct” answer, but rather multiple defensible interpretations. However, extensive literature on multiverse analysis (Steegen et al., 2016; Simonsohn et al., 2015; Liu et al., 2020b) underscores the importance of considering alternative approaches. This helps analysts appreciate uncertainties surrounding their decisions and bolsters the robustness of their analyses. In this work, as one step toward this larger goal, we highlight how planning assistance can guide analysts toward assessing multiple analytical perspectives. Future research could examine the influence of planning assistance on analysis “correctness.”
7. Conclusion
This paper explores the potential of AI-based data analysis assistants that incorporate execution and planning assistance. To understand the space of helpful suggestion content, we perform a literature review and a behavior-driven study to establish a categorization of suggestion content. To explore the essential components of a helpful suggestion, we design and conduct a Wizard of Oz study that is inspired by but not limited by the capabilities of existing LLM-based assistants. This work contributes the first user study involving analysts working on a real dataset and task to better understand how to design and incorporate planning assistance into analysts’ workflows. In addition, we provide an open-source implementation of an assistant interface building on prior work. From our study, we find that analysts found many categories of planning assistance helpful, highlighting the potential of incorporating planning assistance. However, in order to achieve this, it is crucial to comprehend and address the contextual factors that influence analysts’ willingness to consider planning suggestions. We synthesize these findings to highlight design implications for future AI-based analysis assistants. Among these are aligning the analysis and the assistant on shared analysis goals and adding measures to reduce overreliance and promote trust in this new analyst-assistant paradigm.
References
- (1)
- Aarts et al. (2015) Alexander A. Aarts, Joanna E. Anderson, Christopher J. Anderson, Peter Raymond Attridge, Angela S. Attwood, et al. 2015. Estimating the reproducibility of psychological science. Science 349 (2015). https://api.semanticscholar.org/CorpusID:218065162
- ah Kang and Stasko (2011) Youn ah Kang and John T. Stasko. 2011. Characterizing the intelligence analysis process: Informing visual analytics design through a longitudinal field study. 2011 IEEE Conference on Visual Analytics Science and Technology (VAST) (2011), 21–30.
- ah Kang and Stasko (2012) Youn ah Kang and John T. Stasko. 2012. Examining the Use of a Visual Analytics System for Sensemaking Tasks: Case Studies with Domain Experts. IEEE Transactions on Visualization and Computer Graphics 18 (2012), 2869–2878.
- Aliakbari and Sadeghdaghighi (2013) Mohammad Aliakbari and Akram Sadeghdaghighi. 2013. Teachers’ Perception of the Barriers to Critical Thinking. Procedia - Social and Behavioral Sciences 70 (2013), 1–5. https://api.semanticscholar.org/CorpusID:145166029
- Alspaugh et al. (2019) Sara Alspaugh, Nava Zokaei, Andrea Liu, Cindy Jin, and Marti A. Hearst. 2019. Futzing and Moseying: Interviews with Professional Data Analysts on Exploration Practices. IEEE Transactions on Visualization and Computer Graphics 25 (2019), 22–31.
- Amazon Web Services (2022) Amazon Web Services. 2022. CodeWhisperer. https://aws.amazon.com/codewhisperer. Accessed on June 3, 2023.
- Amershi et al. (2019) Saleema Amershi, Daniel S. Weld, Mihaela Vorvoreanu, Adam Fourney, Besmira Nushi, et al. 2019. Guidelines for Human-AI Interaction. Proceedings of the 2019 CHI Conference on Human Factors in Computing Systems (2019).
- Andreas (2022) Jacob Andreas. 2022. Language Models as Agent Models. ArXiv abs/2212.01681 (2022).
- Apple (2019) Apple. 2019. Human Interface Guidelines: Machine Learning. https://developer.apple.com/design/human-interface-guidelines/machine-learning. Accessed on June 3, 2023.
- Baker (2016) Monya Baker. 2016. 1,500 scientists lift the lid on reproducibility. Nature 533 (2016), 452–454.
- Bansal et al. (2021) Gagan Bansal, Tongshuang Wu, Joyce Zhou, Raymond Fok, Besmira Nushi, et al. 2021. Does the whole exceed its parts? the effect of ai explanations on complementary team performance. In Proceedings of the 2021 CHI Conference on Human Factors in Computing Systems. 1–16.
- Barke et al. (2022) Shraddha Barke, Michael B. James, and Nadia Polikarpova. 2022. Grounded Copilot: How Programmers Interact with Code-Generating Models. Proceedings of the ACM on Programming Languages 7 (2022), 85 – 111.
- Bastiaansen et al. (2019) Jojanneke A. Bastiaansen, Yoram K. Kunkels, Frank Johan Blaauw, Steven M. Boker, Eva Ceulemans, et al. 2019. Time to get personal? The impact of researchers choices on the selection of treatment targets using the experience sampling methodology. Journal of psychosomatic research 137 (2019), 110211 – 110211.
- Battle and Heer (2019) Leilani Battle and Jeffrey Heer. 2019. Characterizing Exploratory Visual Analysis: A Literature Review and Evaluation of Analytic Provenance in Tableau. Computer Graphics Forum 38 (2019).
- Bender et al. (2021) Emily M Bender, Timnit Gebru, Angelina McMillan-Major, and Shmargaret Shmitchell. 2021. On the Dangers of Stochastic Parrots: Can Language Models Be Too Big?. In Proceedings of the 2021 ACM conference on fairness, accountability, and transparency. 610–623.
- Bissell and Chatfield (1988) Derek Bissell and Chris Chatfield. 1988. Problem Solving: A Statistician’s Guide. The Statistician 38 (1988), 129–129.
- Botvinik-Nezer et al. (2019) Rotem Botvinik-Nezer, Felix Holzmeister, Colin Camerer, Anna Dreber, Juergen Huber, et al. 2019. Variability in the analysis of a single neuroimaging dataset by many teams. Nature 582 (2019), 84–88.
- Boukhelifa et al. (2017) Nadia Boukhelifa, Marc-Emmanuel Perrin, Samuel Huron, and James R. Eagan. 2017. How Data Workers Cope with Uncertainty.
- Box (1976) G. E. P. Box. 1976. Science and Statistics. J. Amer. Statist. Assoc. 71 (1976), 791–799.
- Breznau et al. (2022) Nate Breznau, Eike Mark Rinke, Alexander Wuttke, Muna Adem, Jule Adriaans, et al. 2022. Observing many researchers using the same data and hypothesis reveals a hidden universe of uncertainty. Proceedings of the National Academy of Sciences of the United States of America 119 (2022).
- Brown et al. (2020) Tom B. Brown, Benjamin Mann, Nick Ryder, Melanie Subbiah, Jared Kaplan, et al. 2020. Language Models are Few-Shot Learners. ArXiv abs/2005.14165 (2020).
- Bubeck et al. (2023) Sébastien Bubeck, Varun Chandrasekaran, Ronen Eldan, John A. Gehrke, Eric Horvitz, et al. 2023. Sparks of Artificial General Intelligence: Early experiments with GPT-4. ArXiv abs/2303.12712 (2023).
- Buccinca et al. (2020) Zana Buccinca, Phoebe Lin, Krzysztof Z Gajos, and Elena L. Glassman. 2020. Proxy tasks and subjective measures can be misleading in evaluating explainable AI systems. Proceedings of the 25th International Conference on Intelligent User Interfaces (2020). https://api.semanticscholar.org/CorpusID:210837324
- Buchholz (2023) Katharina Buchholz. 2023. Time to One Million Users. https://www.statista.com/chart/29174/time-to-one-million-users/. Accessed June 5, 2023.
- Buçinca et al. (2021) Zana Buçinca, Maja Barbara Malaya, and Krzysztof Z Gajos. 2021. To trust or to think: cognitive forcing functions can reduce overreliance on AI in AI-assisted decision-making. Proceedings of the ACM on Human-Computer Interaction 5, CSCW1 (2021), 1–21.
- Bussone et al. (2015) Adrian Bussone, Simone Stumpf, and Dympna O’Sullivan. 2015. The role of explanations on trust and reliance in clinical decision support systems. In 2015 international conference on healthcare informatics. IEEE, 160–169.
- Chandel et al. (2022) Shubham Chandel, Colin B. Clement, Guillermo Serrato, and Neel Sundaresan. 2022. Training and Evaluating a Jupyter Notebook Data Science Assistant. ArXiv abs/2201.12901 (2022).
- Chattopadhyay et al. (2020) Souti Chattopadhyay, I. V. R. K. V. Prasad, Austin Z. Henley, Anita Sarma, and Titus Barik. 2020. What’s Wrong with Computational Notebooks? Pain Points, Needs, and Design Opportunities. Proceedings of the 2020 CHI Conference on Human Factors in Computing Systems (2020).
- Chen et al. (2021) Mark Chen, Jerry Tworek, Heewoo Jun, Qiming Yuan, Henrique Ponde, et al. 2021. Evaluating Large Language Models Trained on Code. ArXiv abs/2107.03374 (2021).
- Cheng et al. (2023) Liying Cheng, Xingxuan Li, and Lidong Bing. 2023. Is GPT-4 a Good Data Analyst? ArXiv abs/2305.15038 (2023).
- Chowdhery et al. (2022) Aakanksha Chowdhery, Sharan Narang, Jacob Devlin, Maarten Bosma, Gaurav Mishra, et al. 2022. PaLM: Scaling Language Modeling with Pathways. ArXiv abs/2204.02311 (2022).
- Clark et al. (2019) Leigh Clark, Nadia Pantidi, Orla Cooney, Philip Doyle, Diego Garaialde, et al. 2019. What makes a good conversation? Challenges in designing truly conversational agents. In Proceedings of the 2019 CHI conference on human factors in computing systems. 1–12.
- Cockburn et al. (2020) Andy Cockburn, Pierre Dragicevic, Lonni Besançon, and Carl Gutwin. 2020. Threats of a replication crisis in empirical computer science. Commun. ACM 63 (2020), 70 – 79. https://api.semanticscholar.org/CorpusID:220687494
- Dahlbäck et al. (1993) Nils Dahlbäck, Arne Jönsson, and Lars Ahrenberg. 1993. Wizard of Oz studies: why and how. In International Conference on Intelligent User Interfaces.
- Dibia (2023) Victor C. Dibia. 2023. LIDA: A Tool for Automatic Generation of Grammar-Agnostic Visualizations and Infographics using Large Language Models. ArXiv abs/2303.02927 (2023).
- Drosos et al. (2020) Ian Drosos, Titus Barik, Philip J. Guo, Robert DeLine, and Sumit Gulwani. 2020. Wrex: A Unified Programming-by-Example Interaction for Synthesizing Readable Code for Data Scientists. Proceedings of the 2020 CHI Conference on Human Factors in Computing Systems (2020).
- Dutilh et al. (2018) Gilles Dutilh, Jeffrey Annis, Scott D. Brown, Peter Cassey, Nathan J. Evans, et al. 2018. The Quality of Response Time Data Inference: A Blinded, Collaborative Assessment of the Validity of Cognitive Models. Psychonomic Bulletin & Review 26 (2018), 1051 – 1069.
- Eiband et al. (2019) Malin Eiband, Daniel Buschek, Alexander Kremer, and Heinrich Hussmann. 2019. The impact of placebic explanations on trust in intelligent systems. In Extended Abstracts of the 2019 CHI Conference on Human Factors in Computing Systems. 1–6.
- El et al. (2020) Ori Bar El, Tova Milo, and Amit Somech. 2020. Automatically Generating Data Exploration Sessions Using Deep Reinforcement Learning. Proceedings of the 2020 ACM SIGMOD International Conference on Management of Data (2020). https://api.semanticscholar.org/CorpusID:218981884
- Fogarty et al. (2005) James Fogarty, Scott E. Hudson, Christopher G. Atkeson, Daniel Avrahami, Jodi Forlizzi, et al. 2005. Predicting human interruptibility with sensors. ACM Trans. Comput. Hum. Interact. 12 (2005), 119–146.
- Franklin and Miller (2010) Janet Franklin and Jennifer A. Miller. 2010. Mapping Species Distributions: Spatial Inference and Prediction.
- Fraser and Gilbert (1991) Norman M. Fraser and Nigel Gilbert. 1991. Simulating speech systems. Computer Speech & Language 5 (1991), 81–99.
- Fried et al. (2022) Daniel Fried, Armen Aghajanyan, Jessy Lin, Sida I. Wang, Eric Wallace, et al. 2022. InCoder: A Generative Model for Code Infilling and Synthesis. ArXiv abs/2204.05999 (2022).
- GitHub (2022) GitHub. 2022. GitHub Copilot. .https://github.com/features/copilot. Accessed: June 1, 2023.
- Google (2019) Google. 2019. People + AI Guidebook. https://pair.withgoogle.com/guidebook. Accessed on June 3, 2023.
- Google (2022) Google. 2022. ML-Enhanced Code Completion Improves Developer Productivity. Google AI Blog. {https://ai.googleblog.com/2022/07/ml-enhanced-code-completion-improves.html} Accessed: June 3, 2023.
- Grolemund and Wickham (2014) Garrett Grolemund and Hadley Wickham. 2014. A Cognitive Interpretation of Data Analysis. International Statistical Review 82 (2014).
- Gu et al. (2022) Ken Gu, Eunice Jun, and Tim Althoff. 2022. Understanding and Supporting Debugging Workflows in Multiverse Analysis. Proceedings of the 2023 CHI Conference on Human Factors in Computing Systems (2022).
- Head et al. (2019) Andrew Head, Fred Hohman, Titus Barik, Steven Mark Drucker, and Robert DeLine. 2019. Managing Messes in Computational Notebooks. Proceedings of the 2019 CHI Conference on Human Factors in Computing Systems (2019).
- Horvitz (1999) Eric Horvitz. 1999. Principles of mixed-initiative user interfaces. In International Conference on Human Factors in Computing Systems.
- Huber (2011) Peter J. Huber. 2011. Data Analysis: What Can Be Learned From the Past 50 Years.
- IBM (2019) IBM. 2019. IBM Design for AI. https://www.ibm.com/design/ai/. Accessed on June 3, 2023..
- Jayagopal et al. (2022) Dhanya Jayagopal, Justin Lubin, and Sarah E Chasins. 2022. Exploring the learnability of program synthesizers by novice programmers. In Proceedings of the 35th Annual ACM Symposium on User Interface Software and Technology. 1–15.
- Jiang et al. (2022) Ellen Jiang, Kristen Olson, Edwin Toh, Alejandra Molina, Aaron Donsbach, et al. 2022. PromptMaker: Prompt-based Prototyping with Large Language Models. CHI Conference on Human Factors in Computing Systems Extended Abstracts (2022).
- Jiang et al. (2021) Ellen Jiang, Edwin Toh, Alejandra Molina, Aaron Donsbach, Carrie J. Cai, et al. 2021. GenLine and GenForm: Two Tools for Interacting with Generative Language Models in a Code Editor. Adjunct Proceedings of the 34th Annual ACM Symposium on User Interface Software and Technology (2021).
- Jolaoso et al. (2015) Sheriff Jolaoso, Russ Burtner, and Alex Endert. 2015. Toward a Deeper Understanding of Data Analysis, Sensemaking, and Signature Discovery. In IFIP TC13 International Conference on Human-Computer Interaction.
- Jun et al. (2021) Eunice Jun, M. Keith Birchfield, Nicole de Moura, Jeffrey Heer, and René Just. 2021. Hypothesis Formalization: Empirical Findings, Software Limitations, and Design Implications. ACM Trans. Comput. Hum. Interact. 29 (2021), 6:1–6:28.
- Jun et al. (2019) Eunice Jun, Maureen Daum, Jared Roesch, Sarah E. Chasins, E. Berger, et al. 2019. Tea: A High-level Language and Runtime System for Automating Statistical Analysis. Proceedings of the 32nd Annual ACM Symposium on User Interface Software and Technology (2019).
- Jun et al. (2022) Eunice Jun, Audrey Seo, Jeffrey Heer, and René Just. 2022. Tisane: Authoring Statistical Models via Formal Reasoning from Conceptual and Data Relationships. Proceedings of the 2022 CHI Conference on Human Factors in Computing Systems (2022).
- JupyterCalPoly (2021) JupyterCalPoly. 2021. jupytercalpoly/jupyterlab-comments. https://github.com/jupytercalpoly/jupyterlab-comments.
- Kale et al. (2019) Alex Kale, Matthew Kay, and Jessica R. Hullman. 2019. Decision-Making Under Uncertainty in Research Synthesis: Designing for the Garden of Forking Paths. Proceedings of the 2019 CHI Conference on Human Factors in Computing Systems (2019).
- Kandel et al. (2012) Sean Kandel, Andreas Paepcke, Joseph M. Hellerstein, and Jeffrey Heer. 2012. Enterprise Data Analysis and Visualization: An Interview Study. IEEE Transactions on Visualization and Computer Graphics 18 (2012), 2917–2926.
- Kery et al. (2018) Mary Beth Kery, Marissa Radensky, Mahima Arya, Bonnie E. John, and Brad A. Myers. 2018. The Story in the Notebook: Exploratory Data Science using a Literate Programming Tool. Proceedings of the 2018 CHI Conference on Human Factors in Computing Systems (2018).
- Khadpe et al. (2020) Pranav Khadpe, Ranjay Krishna, Fei-Fei Li, Jeffrey T. Hancock, and Michael S. Bernstein. 2020. Conceptual Metaphors Impact Perceptions of Human-AI Collaboration. Proceedings of the ACM on Human-Computer Interaction 4 (2020), 1 – 26.
- Kim et al. (2022) Sunnie S. Y. Kim, Elizabeth Anne Watkins, Olga Russakovsky, Ruth C. Fong, and A. Monroy-Hernández. 2022. ”Help Me Help the AI”: Understanding How Explainability Can Support Human-AI Interaction. Proceedings of the 2023 CHI Conference on Human Factors in Computing Systems (2022).
- Kirk et al. (2023) Hannah Rose Kirk, Bertie Vidgen, Paul Röttger, and Scott A. Hale. 2023. Personalisation within bounds: A risk taxonomy and policy framework for the alignment of large language models with personalised feedback. ArXiv abs/2303.05453 (2023).
- Klein et al. (2007) Gary Klein, Jennifer K. Phillips, Erica Rall, and Deborah A. Peluso. 2007. A Data–Frame Theory of Sensemaking.
- Kocielnik et al. (2019) Rafal Kocielnik, Saleema Amershi, and Paul N. Bennett. 2019. Will You Accept an Imperfect AI?: Exploring Designs for Adjusting End-user Expectations of AI Systems. Proceedings of the 2019 CHI Conference on Human Factors in Computing Systems (2019).
- Kunkel et al. (2019) Johannes Kunkel, Tim Donkers, Lisa Michael, Catalin-Mihai Barbu, and Jürgen Ziegler. 2019. Let Me Explain: Impact of Personal and Impersonal Explanations on Trust in Recommender Systems. Proceedings of the 2019 CHI Conference on Human Factors in Computing Systems (2019).
- Lai and Tan (2019) Vivian Lai and Chenhao Tan. 2019. On human predictions with explanations and predictions of machine learning models: A case study on deception detection. In Proceedings of the conference on fairness, accountability, and transparency. 29–38.
- Lai et al. (2022) Yuhang Lai, Chengxi Li, Yiming Wang, Tianyi Zhang, Ruiqi Zhong, et al. 2022. DS-1000: A Natural and Reliable Benchmark for Data Science Code Generation. ArXiv abs/2211.11501 (2022).
- Li et al. (2021) Xingjun Li, Yizhi Zhang, Justin Leung, Chengnian Sun, and Jian Zhao. 2021. EDAssistant: Supporting Exploratory Data Analysis in Computational Notebooks with In Situ Code Search and Recommendation. ACM Transactions on Interactive Intelligent Systems 13 (2021), 1 – 27. https://api.semanticscholar.org/CorpusID:245144651
- Li et al. (2022) Yujia Li, David H. Choi, Junyoung Chung, Nate Kushman, Julian Schrittwieser, et al. 2022. Competition-level code generation with AlphaCode. Science 378 (2022), 1092 – 1097.
- Liang et al. (2023) Jenny Liang, Chenyang Yang, and Brad A. Myers. 2023. Understanding the Usability of AI Programming Assistants. ArXiv abs/2303.17125 (2023).
- Liao et al. (2020) Qingzi Vera Liao, Dan Gruen, and Sarah Miller. 2020. Questioning the AI: Informing Design Practices for Explainable AI User Experiences. Proceedings of the 2020 CHI Conference on Human Factors in Computing Systems (2020).
- Liao and Sundar (2022) Qingzi Vera Liao and S. Shyam Sundar. 2022. Designing for Responsible Trust in AI Systems: A Communication Perspective. 2022 ACM Conference on Fairness, Accountability, and Transparency (2022).
- Lin et al. (2022) Stephanie C. Lin, Jacob Hilton, and Owain Evans. 2022. Teaching Models to Express Their Uncertainty in Words. Trans. Mach. Learn. Res. 2022 (2022). https://api.semanticscholar.org/CorpusID:249191391
- Liu et al. (2020a) Jiali Liu, Nadia Boukhelifa, and James R. Eagan. 2020a. Understanding the Role of Alternatives in Data Analysis Practices. IEEE Transactions on Visualization and Computer Graphics 26 (2020), 66–76.
- Liu et al. (2019) Yang Liu, Tim Althoff, and Jeffrey Heer. 2019. Paths Explored, Paths Omitted, Paths Obscured: Decision Points & Selective Reporting in End-to-End Data Analysis. Proceedings of the 2020 CHI Conference on Human Factors in Computing Systems (2019).
- Liu et al. (2023) Yang Liu, Dan Iter, Yichong Xu, Shuo Wang, Ruochen Xu, et al. 2023. G-Eval: NLG Evaluation using GPT-4 with Better Human Alignment. ArXiv abs/2303.16634 (2023). https://api.semanticscholar.org/CorpusID:257804696
- Liu et al. (2020b) Yang Liu, Alex Kale, Tim Althoff, and Jeffrey Heer. 2020b. Boba: Authoring and Visualizing Multiverse Analyses. IEEE Transactions on Visualization and Computer Graphics 27 (2020), 1753–1763.
- Luger and Sellen (2016) Ewa Luger and Abigail Sellen. 2016. ”Like Having a Really Bad PA”: The Gulf between User Expectation and Experience of Conversational Agents. Proceedings of the 2016 CHI Conference on Human Factors in Computing Systems (2016).
- Maulsby et al. (1993) David Maulsby, Saul Greenberg, and Richard Mander. 1993. Prototyping an intelligent agent through Wizard of Oz. Proceedings of the INTERACT ’93 and CHI ’93 Conference on Human Factors in Computing Systems (1993).
- McNutt et al. (2020) Andrew McNutt, Gordon Kindlmann, and Michael Correll. 2020. Surfacing visualization mirages. In Proceedings of the 2020 CHI Conference on human factors in computing systems. 1–16.
- McNutt et al. (2023) Andrew M. McNutt, Chenglong Wang, Robert DeLine, and Steven Mark Drucker. 2023. On the Design of AI-powered Code Assistants for Notebooks. Proceedings of the 2023 CHI Conference on Human Factors in Computing Systems (2023).
- Menkveld et al. (2021) Albert J. Menkveld, Anna Dreber, Felix Holzmeister, Juergen Huber, Magnus Johanneson, et al. 2021. Non-Standard Errors. SSRN Electronic Journal (2021).
- Mishra and Nouri (2022) Swaroop Mishra and Elnaz Nouri. 2022. HELP ME THINK: A Simple Prompting Strategy for Non-experts to Create Customized Content with Models. ArXiv abs/2208.08232 (2022).
- Murali et al. (2023) Vijayaraghavan Murali, Chandra Shekhar Maddila, Imad Ahmad, Michael Bolin, Daniel Cheng, et al. 2023. CodeCompose: A Large-Scale Industrial Deployment of AI-assisted Code Authoring. ArXiv abs/2305.12050 (2023).
- Nijkamp et al. (2022) Erik Nijkamp, Bo Pang, Hiroaki Hayashi, Lifu Tu, Haiquan Wang, et al. 2022. A Conversational Paradigm for Program Synthesis. ArXiv abs/2203.13474 (2022).
- OpenAI (2022) OpenAI. 2022. ChatGPT: Conversational AI Language Model. https://chat.openai.com. Accessed on June 1, 2023.
- OpenAI (2023) OpenAI. 2023. GPT-4 Technical Report. arXiv:2303.08774 [cs.CL]
- Ouyang et al. (2022) Long Ouyang, Jeff Wu, Xu Jiang, Diogo Almeida, Carroll L. Wainwright, et al. 2022. Training language models to follow instructions with human feedback. ArXiv abs/2203.02155 (2022).
- Park et al. (2023) Joon Sung Park, Joseph C. O’Brien, Carrie J. Cai, Meredith Ringel Morris, Percy Liang, et al. 2023. Generative Agents: Interactive Simulacra of Human Behavior. ArXiv abs/2304.03442 (2023).
- Pérez and Granger (2007) Fernando Pérez and Brian E. Granger. 2007. IPython: A System for Interactive Scientific Computing. Computing in Science & Engineering 9 (2007).
- Pirolli (2007) Peter Pirolli. 2007. The Sensemaking Process and Leverage Points for Analyst Technology as Identified Through Cognitive Task Analysis.
- Pu et al. (2021) Xiaoying Pu, Sean Kross, Jake M. Hofman, and Daniel G. Goldstein. 2021. Datamations: Animated Explanations of Data Analysis Pipelines. Proceedings of the 2021 CHI Conference on Human Factors in Computing Systems (2021).
- Raghunandan et al. (2022a) Deepthi Raghunandan, Zhe Cui, Kartik Krishnan Sivaramakrishnan, Segen Tirfe, Shenzhi Shi, et al. 2022a. Lodestar: Supporting Independent Learning and Rapid Experimentation Through Data-Driven Analysis Recommendations. ArXiv abs/2204.07876 (2022). https://api.semanticscholar.org/CorpusID:236985291
- Raghunandan et al. (2022b) Deepthi Raghunandan, Aayushi Roy, Shenzhi Shi, Niklas Elmqvist, and Leilani Battle. 2022b. Code Code Evolution: Understanding How People Change Data Science Notebooks Over Time. Proceedings of the 2023 CHI Conference on Human Factors in Computing Systems (2022).
- Riek (2012) Laurel D. Riek. 2012. Wizard of Oz studies in HRI. Journal of Human-Robot Interaction 1 (2012), 119 – 136.
- Ross et al. (2023) Steven I. Ross, Fernando Martinez, Stephanie Houde, Michael J. Muller, and Justin D. Weisz. 2023. The Programmer’s Assistant: Conversational Interaction with a Large Language Model for Software Development. Proceedings of the 28th International Conference on Intelligent User Interfaces (2023).
- Rule et al. (2018) Adam Rule, Aurélien Tabard, and James D. Hollan. 2018. Exploration and Explanation in Computational Notebooks. Proceedings of the 2018 CHI Conference on Human Factors in Computing Systems (2018).
- Russell et al. (1993) Daniel M. Russell, Mark Stefik, Peter Pirolli, and Stuart K. Card. 1993. The cost structure of sensemaking. Proceedings of the INTERACT ’93 and CHI ’93 Conference on Human Factors in Computing Systems (1993).
- Saleh (2019) Salama Embark Saleh. 2019. CRITICAL THINKING AS A 21st CENTURY SKILL: CONCEPTIONS, IMPLEMENTATION AND CHALLENGES IN THE EFL CLASSROOM. https://api.semanticscholar.org/CorpusID:151151373
- Sarma et al. (2021) Abhraneel Sarma, Alex Kale, Michael Moon, Nathan Taback, Fanny Chevalier, et al. 2021. multiverse: Multiplexing Alternative Data Analyses in R Notebooks. Proceedings of the 2023 CHI Conference on Human Factors in Computing Systems (2021). https://api.semanticscholar.org/CorpusID:238541538
- Schweinsberg et al. (2021) Martin Schweinsberg, Michael Feldman, Nicola Staub, Olmo van den Akker, Robbie C. M. Aert, et al. 2021. Same data, different conclusions: Radical dispersion in empirical results when independent analysts operationalize and test the same hypothesis. Organizational Behavior and Human Decision Processes (2021).
- Shen (2014) Helen Shen. 2014. Interactive notebooks: Sharing the code. Nature 515 (2014), 151–152.
- Shneiderman (2020) Ben Shneiderman. 2020. Human-Centered Artificial Intelligence: Reliable, Safe & Trustworthy. International Journal of Human–Computer Interaction 36 (2020), 495 – 504.
- Shrinivasan and van Wijk (2008) Yedendra Babu Shrinivasan and Jarke J. van Wijk. 2008. Supporting the analytical reasoning process in information visualization. Proceedings of the SIGCHI Conference on Human Factors in Computing Systems (2008).
- Silberzahn et al. (2018) Raphael Silberzahn, Eric Luis Uhlmann, Daniel P. Martin, Pasquale Anselmi, Frederik Aust, et al. 2018. Many Analysts, One Data Set: Making Transparent How Variations in Analytic Choices Affect Results. Advances in Methods and Practices in Psychological Science 1 (2018), 337 – 356.
- Simonsohn et al. (2015) Uri Simonsohn, Joseph P. Simmons, and Leif D. Nelson. 2015. Specification Curve: Descriptive and Inferential Statistics on All Reasonable Specifications. MKTG: Methodological Issues in Consumer Research (Topic) (2015).
- Steegen et al. (2016) Sara Steegen, Francis Tuerlinckx, Andrew Gelman, and Wolf Vanpaemel. 2016. Increasing Transparency Through a Multiverse Analysis. Perspectives on Psychological Science 11 (2016), 702 – 712.
- Toreini et al. (2019) Ehsan Toreini, Mhairi Aitken, Kovila P. L. Coopamootoo, Karen Elliott, Carlos Vladimiro Gonzalez Zelaya, et al. 2019. The relationship between trust in AI and trustworthy machine learning technologies. Proceedings of the 2020 Conference on Fairness, Accountability, and Transparency (2019).
- Tukey and Wilk (1966) John W. Tukey and M. B. Wilk. 1966. Data analysis and statistics: an expository overview. In AFIPS ’66 (Fall).
- Vaithilingam et al. (2022) Priyan Vaithilingam, Tianyi Zhang, and Elena L. Glassman. 2022. Expectation vs. Experience: Evaluating the Usability of Code Generation Tools Powered by Large Language Models. CHI Conference on Human Factors in Computing Systems Extended Abstracts (2022).
- Vasconcelos et al. (2023) Helena Vasconcelos, Matthew Jörke, Madeleine Grunde-McLaughlin, Tobias Gerstenberg, Michael S Bernstein, et al. 2023. Explanations can reduce overreliance on ai systems during decision-making. Proceedings of the ACM on Human-Computer Interaction 7, CSCW1 (2023), 1–38.
- Vaswani et al. (2017) Ashish Vaswani, Noam M. Shazeer, Niki Parmar, Jakob Uszkoreit, Llion Jones, et al. 2017. Attention is All you Need. In NIPS.
- Wang et al. (2021) April Yi Wang, Dakuo Wang, Jaimie Drozdal, Michael J. Muller, Soya Park, et al. 2021. Documentation Matters: Human-Centered AI System to Assist Data Science Code Documentation in Computational Notebooks. ACM Transactions on Computer-Human Interaction 29 (2021), 1 – 33.
- Whitworth (2005) Brian Whitworth. 2005. Polite computing. Behaviour & Information Technology 24 (2005), 353 – 363. https://api.semanticscholar.org/CorpusID:5647335
- Wild and Pfannkuch (1999) Chris J. Wild and Maxine Pfannkuch. 1999. Statistical Thinking in Empirical Enquiry. International Statistical Review 67 (1999).
- Wohlin (2014) Claes Wohlin. 2014. Guidelines for snowballing in systematic literature studies and a replication in software engineering. In International Conference on Evaluation & Assessment in Software Engineering.
- Wongsuphasawat et al. (2019) Kanit Wongsuphasawat, Yang Liu, and Jeffrey Heer. 2019. Goals, Process, and Challenges of Exploratory Data Analysis: An Interview Study. ArXiv abs/1911.00568 (2019).
- Wood et al. (2019) Jo Wood, Alexander Kachkaev, and Jason Dykes. 2019. Design Exposition with Literate Visualization. IEEE Transactions on Visualization and Computer Graphics 25 (2019), 759–768. https://api.semanticscholar.org/CorpusID:52056429
- Xiong et al. (2022) Kai Xiong, Siwei Fu, Guoming Ding, Zhongsu Luo, Rong Yu, et al. 2022. Visualizing the Scripts of Data Wrangling with SOMNUS. IEEE Transactions on Visualization and Computer Graphics PP (2022), 1–1.
- Xu et al. (2015) Kai Xu, Simon Attfield, T. J. Jankun-Kelly, Ashley Wheat, Phong H. Nguyen, et al. 2015. Analytic Provenance for Sensemaking: A Research Agenda. IEEE Computer Graphics and Applications 35 (2015), 56–64.
- YData (2023) YData. 2023. ydata-profiling. https://github.com/ydataai/ydata-profiling.
- Yildirim et al. (2023) Nur Yildirim, Mahima Pushkarna, Nitesh Goyal, Martin Wattenberg, and Fernanda Vi’egas. 2023. Investigating How Practitioners Use Human-AI Guidelines: A Case Study on the People + AI Guidebook. Proceedings of the 2023 CHI Conference on Human Factors in Computing Systems (2023).
- Yin et al. (2019) Ming Yin, Jennifer Wortman Vaughan, and Hanna Wallach. 2019. Understanding the effect of accuracy on trust in machine learning models. In Proceedings of the 2019 chi conference on human factors in computing systems. 1–12.
- Yuan and Stapleton (2020) Rui (Eric) Yuan and Paul Stapleton. 2020. Student teachers’ perceptions of critical thinking and its teaching. Elt Journal 74 (2020), 40–48. https://api.semanticscholar.org/CorpusID:214375390
- Zamfirescu-Pereira et al. (2023) J.D. Zamfirescu-Pereira, Richmond Y. Wong, Bjoern Hartmann, and Qiang Yang. 2023. Why Johnny Can’t Prompt: How Non-AI Experts Try (and Fail) to Design LLM Prompts. Proceedings of the 2023 CHI Conference on Human Factors in Computing Systems (2023).
- Zhang et al. (2023) Beiqi Zhang, Peng Liang, Xiyu (Thomas) Zhou, Aakash Ahmad, and Muhammad Waseem. 2023. Practices and Challenges of Using GitHub Copilot: An Empirical Study. ArXiv abs/2303.08733 (2023).
- Zhang (2022) Yameng Zhang. 2022. The Research on Critical Thinking Teaching Strategies in College English Classroom. Creative Education (2022). https://api.semanticscholar.org/CorpusID:248443484
- Zheng et al. (2022) Chengbo Zheng, Dakuo Wang, April Yi Wang, and Xiaojuan Ma. 2022. Telling Stories from Computational Notebooks: AI-Assisted Presentation Slides Creation for Presenting Data Science Work. Proceedings of the 2022 CHI Conference on Human Factors in Computing Systems (2022).
- Ziegler et al. (2022) Albert Ziegler, Eirini Kalliamvakou, Shawn Simister, Ganesh Sittampalam, X. Alice Li, et al. 2022. Productivity assessment of neural code completion. Proceedings of the 6th ACM SIGPLAN International Symposium on Machine Programming (2022).
Appendix A Examples of Suggestion Categories
We give a brief description of each category in Table 1 and illustrate full examples of suggestions for each of the suggestion categories.
A.1. Domain Background
While domain background content could be part of suggestions in other categories, this category is for when the main focus of the suggestion is to provide analysts with background on the problem domain. An example could be giving analysts suggestions about similar analyses done in the past:
-
•
Similar Analyses Done in the Past.
The question of whether skin tone influences the way referees make decisions in soccer games has been a topic of research for a while. One of the most well-known studies in this area is ”Racial Bias in the Allocation of Fouls in Soccer” by Price and Wolfers (2010). They analyzed data from the 2004-2005 English Premier League season and found that black players were more likely to receive red and yellow cards than white players, even after controlling for a variety of factors such as position, nationality, and the competitiveness of the game.
Another study that investigated the issue is ”Skin color and red card decisions in football: a preliminary study” by Diaz et al. (2016). They analyzed data from the Spanish league and found that darker-skinned players were more likely to receive red cards than lighter-skinned players, after controlling for various factors such as age, nationality, position, and the competitiveness of the game.
Both studies used regression analysis to examine the relationship between race and the likelihood of receiving red cards. Price and Wolfers included a wide range of control variables, while Diaz et al. included fewer variables but also examined the moderating effect of the referee’s country of origin.
Overall, the analyses focused on controlling for various factors that could influence the relationship between race and red cards, and both studies found evidence of racial bias in the allocation of fouls.
A.2. Data Wrangling
Offer assistance related to understanding, transforming, clearing, and preparing the data.
Example suggestions:
-
•
Reminder - Check for Missing Data.
Always check for missing data in your DataFrame before performing any data analysis or machine learning tasks. NaN values can cause unexpected errors and affect the accuracy of your results.
# Use boolean indexing to filter the DataFrame and show the rows with missing datarows_with_na = df[df.isna().any(axis=1)]rows_with_na.head()# Show how many NaN values there are in each columnnan_counts = df.isna().sum(axis=0) -
•
Understanding Differences Between Raters.
To help us understand the differences between raters better we can use the following code:
# Compute the difference between the two raters’ ratings}data[’rating_diff’] = data[’rater1’] - data[’rater2’]# Create a distribution plot of the rating differences using seabornsns.histplot(data=data, x=’rating_diff’, kde=True) -
•
Data Transformation - ZTransform Predictors.
In this dataset, we may want to z-transform predictors as it can improve the interpretability of regression coefficients by putting all predictors on the same scale. Standardization can also reduce the impact of outliers and extreme values that can skew the results of statistical analyses. Finally, standardization can make it easier to compare the relative importance of predictors in a model that has different units and scales.
A code template to z-transform a variable is shown:
df$z_var <- scale(x=df$var ,center=TRUE,scale=TRUE)
A.3. Conceptual Model Formulation
Inspired by Jun et al. (Jun et al., 2021), this category corresponds to assistance that helps analysts identify or think about factors that might influence an outcome and how these factors might interact to give rise to the outcome.
Example suggestions:
-
•
Age Variable Rationale.
Beyond just skin tone we might want to consider other variables that might affect the analysis. As birthday is in the dataframe, we might want to control for age which is a common practice in research studies, as age can affect various aspects of behavior and cognition. One reason to control for age is to account for the tendency of impulsivity, which may be associated with receiving red cards, to decrease with age. Research has shown that sensation seeking and impulsivity tend to decrease with age, as indicated by both self-report and behavior measures. Therefore, controlling for age can help reduce this variable’s impact on the study results. Additionally, age is a common demographic variable, and controlling for it can help to ensure that any observed effects are not simply due to age differences among participants.
We can create a new column age based on the birthday column, we first need to convert the birthday column to a date format using the as.Date function. We can then calculate the age using the difftime function, which calculates the time difference between two dates in years.
# convert birthday column to date formatdf$birthday <- as.Date(df$birthday, format = "%d.%m.%Y")# calculate age as of Jan 1, 2013df$age <- floor(as.numeric(difftime(as.Date("2013-01-01"), df$birthday, units = "days")) / 365.25) -
•
New Variable Star Status and Rationale.
We can create a variable to capture star status. More popular or famous players might potentially be given more lenient treatment by referees and be less likely to be ejected with a red card. Based on the data available, we can determine stat status by calculating the average number of goals scored by each player per game they played in the data set.
Although this is imperfect in that it might not properly account for players who are defensive stars and score fewer goals, offensive players are typically the most famous, and thus goals scored should generally be a meaningful indicator of this status.
The code below shows how we might do this:
# Group by playerShort and sum goals and gamesgrp <- aggregate(df[c("goals", "games")],by=list(df$playerShort), sum) %>%rename(playerShort = Group.1)# Calculate goals per gamegrp$goals_per_game <- grp$goals / grp$games# Merge the goals per game back into the original dataframedf <- merge(df, grp[c("playerShort", "goals_per_game")],by="playerShort") -
•
Other Variables that Might Influence Red Cards: Physical Stature and Rationale.
As we are looking at height and weight, we may want to consider physical stature as one variable. More physically imposing players could be more likely to be perceived as committing a violent act and thus earn more red cards. Because all players are elite professional athletes, we can use BMI as it is likely to reflect athletes having a larger and more muscular frame rather than being more overweight as in the general population.
To create a new column bmi based on the height and weight columns, we can use the formula for calculating BMI, which is the weight (kg) divided by height (m) squared.
# convert height from cm to mdf[’height_m’] = df[’height’] / 100# calculate bmidf[’bmi’] = df[’weight’] / (df[’height_m’] ** 2) \end{lstlisting}\end{itemize}\subsection{Operationalizing Constructs}Help analysts with operationalizing variables involved in the analysis. This may involve data transformations but if the primary goal is to create new columns that can be worked with in the analysis, then the suggestion is about \textit{operationalizing constructs}.Example suggestions:\begin{itemize}\item \xhdr{Skin Tone Operationalization}As you are exploring skin tone ratings, several other methods could be used. The code below shows a basic template to do the above ways of representing skin tone.\begin{lstlisting}[caption={}, label={lst:pythoncode}]# create a new column for average ratingdf[’avg_rating’] = (df[’rater1’] + df[’rater2’]) / 2# create a new column for minimum ratingdf[’min_rating’] = df[[’rater1’, ’rater2’]].min(axis=1)# create a new column for maximum ratingdf[’max_rating’] = df[[’rater1’, ’rater2’]].max(axis=1)# create a new column for dark skin tone as a cutoffdf[’dark_skin_tone’] = (df[’avg_rating’] > 0.75).astype(int)# view the first 10 rows of the new columnsdf[[’avg_rating’, ’min_rating’, ’max_rating’, ’dark_skin_tone’]].head(10) -
•
Collapsing the Data by Player.
Based on the dataset description, each player-referee dyad has multiple games in which the player and referee appeared. As we explore rating distributions, it may be reasonable to collapse the data across playerShort, keeping the ratings for the player. We can also create a variable sumGames that are aggregated across the variable games that provide the summed number of games played by the player across all player-referee dyads. For the outcome variable, we can create sumRedCards that represents the number of red cards a player received from all referees encountered.
The code below does this transformation:
# Define the columns to take the first value ofcolumns_first = [’rater1’, ’rater2’, ’position’, ’avg_rating’, ’height’, ’weight’,’birthday’, ’leagueCountry’, ’refCountry’]# Define the columns to sum and rename themcolumns_sum = [’games’, ’redCards’, ’victories’, ’goals’]columns_sum_renamed = [f’sum{x.capitalize()}’ for x in columns_sum]# Group the data by player and get the first value of specified columns# and the sum of specified columnsfirst_cols = df.groupby(’playerShort’)[columns_first].first()sum_cols = df.groupby(’playerShort’)[columns_sum].sum()# Add a column ’dyads’ with the number of dyads each player belongs tosum_cols[’dyads’] = df.groupby(’playerShort’).size()# Concatenate the two data frames and reset the indexplayer_df = pd.concat([first_cols, sum_cols], axis=1).reset_index()# Rename the columnscolumn_names = ([’playerShort’] + columns_first+ columns_sum_renamed + [’dyads’])player_df.columns = column_namesplayer_df.head()
A.4. Choosing the Statistical Model
Analysis assistance which aids analysts in choosing or directly points analysts to a relevant statistical model.
Example suggestions:
-
•
Understanding Differences Between Raters.
We can start with a simple OLS model that includes the player’s skin tone and the number of red cards as the dependent variable.
Here is an example of how we can create this model in R:
# Create an OLS modelmodel <- lm(redCards ~ avg_rating, data = df)# Summarize the modelsummary(model) -
•
Modeling Strategy: Generalized Linear Models.
Beyond just using linear models, we may want to account for the random variance of the effects across players, referees, and referees’ country of origin. We could use generalized linear mixed models (function glmer in R package lme4).
To start, you could fit three models of increasing complexity to explore the effects of skin tone on the likelihood of receiving a red card. An example template of this code is shown below:
gm1 <- glmer(redCards ~ 1 + avg_rating + (1 | playerShort) + (1 | refNum), family = binomial, data = df)gm2 <- glmer(redCards ~ 1 + avg_rating + (1 | playerShort) + (1 + avg_rating | refNum), family = binomial, data = df)gm3 <- glmer(redCards ~ 1 + avg_rating + (1 | playerShort) + (1 | refNum) + (1 + avg_rating | refCountry), family = binomial, data = df, nAGQ = 0)gm1 assumes that the effect skin tone has on the likelihood of receiving a red card is constant across all referees and players, but that the baseline rate of red cards varies across referees and players. gm2 allows the effect skin tone to vary across different referees, and gm3 further allows for systematic differences in the way that referees from different countries make biased decisions based on skin tone.
All models assume that observations are independent and identically distributed (i.i.d.), the response variable follows a binomial distribution, and the random effects follow a normal distribution. They also assume that the random intercepts and slopes are uncorrelated with each other and with the fixed effects.
Further adjustments can be made as appropriate, such as changing the family type or adding other fixed effects.
-
•
Logistic Regression with Statsmodels.
As the red cards are converted to a binary variable we can run a logistic regression using the statsmodels library. Here’s some sample code to run:
import statsmodels.api as smX = sm.add_constant(X) # Add an intercept term to the modelmodel = sm.Logit(y, X).fit()print(model.summary())The resulting output will give you information about the coefficients for each variable in the model and whether they are statistically significant predictors of receiving a red card, while controlling for other variables in the model. You can also use the output to calculate odds ratios to quantify the association between skin tone and receiving red cards.
A.5. Model Results Interpretation
This category involves any suggestion that helps interpret the outputs of running a statistical model into a more readable and potentially actionable summary. These suggestions are primarily written by ChatGPT
Example suggestions:
-
•
OLS Results Interpretation.
The R-squared value is 0.018, indicating that the independent variables explain only 1.8% of the variation in the dependent variable. The adjusted R-squared value is 0.008, which takes into account the number of independent variables in the model and penalizes the R-squared value for using too many variables.
The F-statistic tests whether there is a relationship between the independent variables and the dependent variable. The p-value for the F-statistic is 4.94e-06, indicating that there is a statistically significant relationship between the independent variables and the dependent variable.
The coefficients for the individual clubs indicate the effect that each club has on the number of red cards. A positive coefficient means that players from that club receive more red cards, while a negative coefficient means that players from that club receive fewer red cards, compared to the average. However, many of the coefficients have p-values greater than 0.05, indicating that they are not statistically significant. Therefore, we cannot conclude that these clubs have a significant effect on the number of red cards received by players.
-
•
ANOVA Results Interpretation.
The output shows the results of a one-way ANOVA test that examines the relationship between rater1 and redCards. The redCards variable is grouped by the levels of rater1, and an ANOVA test is performed to determine whether there is a statistically significant difference in the mean redCards scores between these groups.
The F-statistic of 2.35 indicates the ratio of the variance between the groups to the variance within the groups. The p-value of 0.0523 indicates the probability of observing such an F-statistic value or higher under the null hypothesis that there is no significant difference in the mean redCards scores between the groups.
Based on the p-value of 0.0523, we can conclude that there is a borderline statistically significant difference in the mean redCards scores between the groups defined by the rater1 variable. Specifically, we can reject the null hypothesis at a significance level of 0.05, but not at a significance level of 0.01. Therefore, there is some evidence to suggest that the rater1 variable is related to the redCards variable, but the evidence is not very strong.
-
•
Comparing and Interpreting OLS Results.
Looking at the three OLS regression results, we can see that the models have low R-squared values, indicating that the predictor variables explain very little of the variance in the dependent variable, redCards. Additionally, the F-statistic for each model is relatively low, indicating that the models may not be a good fit for the data.
Model 1 has two predictor variables, skinTone and goals, with goals having a higher coefficient than skinTone.
Model 2 has three predictor variables, skinTone, age, and Intercept, with Intercept having the highest coefficient, followed by age and skinTone.
Model 3 only has two predictor variables, skinTone and Intercept, with Intercept having a higher coefficient than skinTone.
Given that the models have low R-squared values, it may be worth trying a different model or adding additional predictor variables to better explain the variance in the dependent variable. Additionally, it would be helpful to investigate the relationship between the predictor variables and the dependent variable further to better understand their impact on the model.
A.6. High-Level Planning
These are suggestions that point analysts to a general analysis decision, have a high level of abstraction, and are not specific or easily actionable enough to fit into the other planning categories discussed before.
Example suggestions:
-
•
Consider Including Covariates.
Covariates are additional variables that can affect the relationship between the predictor variable and the outcome variable in an analysis. In order to accurately understand the relationship between the predictor and outcome variable, it is important to consider the effects of these covariates.
Including covariates in an analysis can help to control for potential confounding variables, which are variables that can affect both the predictor and outcome variables. By controlling for these confounding variables, the true relationship between the predictor and outcome variable can be more accurately estimated.
Additionally, including covariates can help to increase the precision of the estimated effect of the predictor variable on the outcome variable. This can lead to more accurate predictions and better decision-making based on the analysis results.
In summary, considering covariates in an analysis is important because it helps to control for potential confounding variables and increase the precision of the estimated effects of predictor variables on outcome variables.
-
•
Visualization Suggestions.
Based on the dataframe provided, here are some visualizations that can be considered to understand the relationship between variables:
1. Histogram: A histogram of the redCards variable can be created to see the distribution of the number of red cards given by referees. This can help identify if there are any extreme values or outliers in the dataset.
2. Scatter plot: A scatter plot of redCards against Dark_Skin_Yards can be created to visually see if there is any relationship between the two variables. This can help identify if there is any correlation between a player’s skin tone and the number of red cards they receive.
3. Box plot: A box plot of redCards grouped by Dark_Skin_Yards can be created to see if there is any difference in the distribution of red cards received by players with different skin tones.
4. Bar chart: A bar chart of the total number of red cards given by each referee can be created to see if there are any referees who give out a disproportionately large number of red cards.
A.7. Execution Assistance
This is a broad category to cover any suggestion that helps analysts carry out an analysis decision. This can involve providing code, aiding analysts in debugging errors, or helping implement analysts’ intent. These suggestions are also primarily created using ChatGPT.
Example suggestions:
-
•
Correlation Calculation.
You can calculate the correlation coefficient between the two variables to see the correlation between skin tone and red card. Here’s how you can do it in Python using the pearsonr function from the scipy.stats module:
from scipy.stats import pearsonr# Calculate Pearson correlation coefficients and p-values for ratercorr_rater, pval_rater = pearsonr(X[’rater’], X[’redCards’])print(f"Correlation coefficient (rater): {corr_rater:.2f}")print(f"p-value (rater): {pval_rater:.2f}") -
•
Visually Inspect the Dataframe.
We can plot the percentages dataframe to see the differences better.
import matplotlib.pyplot as pltimport numpy as np# Get the skin ratings and values from the DataFrameskin_ratings = percentages.index.valuesvalues = percentages.values# Set the width of the barsbar_width = 0.2# Set the x positions of the barsr1_pos = np.arange(len(skin_ratings))r2_pos = r1_pos + bar_widthr3_pos = r2_pos + bar_widthr4_pos = r3_pos + bar_width# Create the bars for each valueplt.bar(r1_pos, values[:, 0], width=bar_width, label=’Red Cards 1’)plt.bar(r2_pos, values[:, 1], width=bar_width, label=’Rater 1’)plt.bar(r3_pos, values[:, 2], width=bar_width, label=’Red Cards 2’)plt.bar(r4_pos, values[:, 3], width=bar_width, label=’Rater 2’)# Set the title and axis labelsplt.title(’Values by Skin Rating’)plt.xlabel(’Skin Rating’)plt.ylabel(’Value’)# Set the x-axis tick labels to the skin ratingsplt.xticks(r2_pos + bar_width / 2, skin_ratings)# Set the legendplt.legend()# Show the plotplt.show() -
•
Controlling for LeagueCountry.
To control for the leagueCountry variable in the OLS model, you can include it as a categorical variable in the model. In Python, you can create dummy variables for the leagueCountry variable using the get_dummies() function from pandas. Here’s an example code to add leagueCountry as a categorical variable:
import pandas as pdimport statsmodels.formula.api as smf# Create dummy variables for leagueCountrydf = pd.get_dummies(df, columns=[’leagueCountry’], drop_first=True)# Fit a linear modelmodel = smf.ols("redCards ~ dark_skin_tone + age + leagueCountry_England + leagueCountry_Germany + leagueCountry_Spain", data=df).fit()# Print the model summaryprint(model.summary())In this example, leagueCountry is added as three separate dummy variables for England, Germany, and Germany, with Germany being the reference category. The drop_first=True argument removes one of the dummy variables to avoid multicollinearity.
Appendix B Assistant Interface Implementation
We implemented the wizard and user interface for the Jupyter environment (Pérez and Granger, 2007) as a JupyterLab extension. We extended the JupyterLab Commenting and Annotation extension (JupyterCalPoly, 2021) and incorporated two modes: wizard mode and analyst mode. Both modes work with the same underlying notebook file and share a similar side panel interface. In wizard mode, the wizard can highlight code or cells and add corresponding suggestions to the side panel. All suggestions were stored on disk as an underlying suggestion file. The extension, when in analyst mode, polled this file for changes and updated the side panel when new suggestions were added to the file.
In the study, both the analyst and wizard worked with the same notebook in the same file system. We hosted the notebook on the wizard’s machine. Accordingly, we connected the analyst’s machine remotely to the wizard’s machine using SSH. To ensure the wizard did not update actual notebook contents, we gave wizard mode no edit permissions.
Appendix C Notebook Details for Lab Study
The notebook included a description of the task, the dataset columns, and associated descriptive statistics. In addition, the notebook had a profile report of the dataset which we created using the ydata-profiling library (YData, 2023). This report included univariate analysis (i.e., descriptive statistics and distribution histograms) and multivariate analysis (i.e., correlations, missing data, duplicate rows) of the dataset columns. We wanted to help analysts quickly familiarize themselves with the dataset and direct their focus toward reasoning about their analysis approach.
Appendix D Study Observations for “Where” – Location of Assistant and Suggestions
While we did not explicitly ask analysts their preferences for the location of the assistant in the user interface, 7/13 analysts did express what they preferred. Most of these analysts mentioned that they liked the assistant being to the side of the notebook [A4, A6, A8, A11, A12]. For instance, A11 liked that the side panel allowed them to focus on the notebook: “It’s pretty useful that it is on the side and it doesn’t (interfere) with what you are thinking what you are typing.” On the other hand, A3 and A10 preferred the suggestion closer to the cell.
With respect to the location of the actual suggestions, analysts sometimes found it to be too cluttered [A5, A7, A9, A13]. This partially led to some analysts missing suggestions [A5, A10]. For A5, this became more difficult as it was “very hard to view when you have a lot of things.” Thus, analysts suggested better ways of organizing the suggestions. For example, A13 wanted to tag variables with a categorization: “It would be great to have a category of suggestions so I can quickly see if it’s about processing variables or debugging or explanation.” A5 expressed similar views but would have liked “some kind of color coding like how in Stack Overflow you have questions and answers in different colors.”
The lack of consensus on assistant location supports prior findings (McNutt et al., 2023), in that it depends on the needs and preferences of the analyst.