Extended defects-enhanced oxygen diffusion in ThO2
Abstract
Oxygen self-diffusion is key to understanding stoichiometry and defect structures in oxide nuclear fuels. Experimentally, low activation-barrier oxygen migration was found in ThO2, a candidate nuclear fuel, possibly due to short-circuit diffusion mechanisms. Here, we perform extensive molecular dynamics simulations to show that various types of extended defects can enhance oxygen self-diffusion with a much-reduced activation barrier in ThO2. In this work, we consider extended defects including 1D (dislocation), 2D (grain boundary), and 3D (void) defects. Due to the distinct characteristics of each type of extended defect, the modulation of oxygen diffusion varies. These results provide a quantitative description of oxygen transport, which is significantly enhanced within a close distance (nanometer scale) from the extended defects. Among all these defects, grain boundary, particularly the twin boundary with a low formation energy, exhibits the strongest effect on increasing oxygen transport.
keywords:
Oxygen diffusion , dislocation , grain boundary , void , ThO2[inst1]Department of Nuclear Engineering, The Pennsylvania State University, University Park, 16802 PA, USA \affiliation[inst2]Department of Mechanical and Aerospace Engineering, The Ohio State University, 201 W 19th Ave, Columbus, OH 43210, USA \affiliation[inst3]Department of Engineering Physics, University of Wisconsin-Madison, 1500 Engineering Dr, Madison, WI 53706, USA \affiliation[inst4]Idaho National Laboratory, 2525 Fremont Ave, Idaho Falls, ID 83402, USA
1 Introduction
Oxygen transport in oxide nuclear fuels is of significance to understanding the local stoichiometry, phase stability, and oxidation behavior. Due to the high oxygen diffusivity compared to the cations, the ionic conductivity is dominated by oxygen atoms. Under radiation environments, a variety of defects are formed and evolving in nuclear fuels, which affects oxygen transport. There have been significant efforts in quantifying the mass transport properties of fuel cation, oxygen, and fission products in nuclear fuels, particularly in UO2 (see [1, 2] and references within), given its practical importance in nuclear reactors. In comparison, ThO2 as a candidate nuclear fuel has received much less attention on oxygen diffusion behavior, particularly how oxygen diffusion is affected by extended defects. The most recent computational results are based on the bulk crystal [3], investigating how the pressure factors into the diffusion coefficients. Taking into account the effect of grain boundaries and dislocations, oxygen diffusion in pure UO2 has been evaluated with molecular dynamics (MD) [2, 4, 5, 6], where stronger oxygen diffusion at these extended defects was identified than that in the bulk region. It is not clear whether the conclusions from UO2 defective systems would be transferable to ThO2.
In ThO2, oxygen self-diffusion coefficients in the bulk have been experimentally measured in previous studies, and a broad range of Arrhenius energies was reported. Edward et al. [7, 8] proposed 2.85 eV with data from 800-1600 , based on the interpretation of intrinsic diffusion mechanisms (involving the formation of an oxygen Frenkel pair), while later experiments suggested 1.80-1.92 eV [9, 10]. In more recent results by Ando et al. [7], intrinsic oxygen diffusion with an activation energy of 2.16 eV was used to account for the high-temperature regime, and extrinsic diffusion, presumably due to dislocation-enhanced diffusion with activation energy 0.76 eV was used to explain the low-temperature regime. From the theoretical perspective, the self-diffusion activation energy needs to incorporate both oxygen Frenkel pair formation and migration. Later, Colbourn and Mackrodt [8] reassessed the reported diffusion data based on electrical conductivity and argued that i) these values ( 2 eV) are too small to account for the intrinsic diffusion of oxygen, as the formation energy of oxygen Frenkel is relatively high (5.89-9.8 eV from computational studies [8, 11, 12]) and ii) the diffusing oxygen species is not determined. In the same work [8], it was suggested that the low Arrhenius energy by Ando et al. [7] involves the creation of oxygen interstitials () and holes in the valence band, while the value by Edward et al. [7, 8] involves a different oxygen vacancy formation mechanism. These understandings of the bulk behavior could shed light on the oxygen transport near extended defects.
Short-circuit diffusion via extended defects has long been recognized in crystalline systems. Due to the specific features in defects such as dislocations and interfaces, short-circuit diffusion mechanisms can arise, and contribute significantly to low-temperature mass transport. For example, in oxides such as urania [4], magnesia [13], and alumina [14], dislocations are known as fast diffusion paths due to the low coordination. Such pipe diffusion can contribute significantly to the ionic conductivity at low temperatures. It should be noted that dislocation pipe-diffusion may not always occur, e.g., in doped CeO2, dislocations were found to slow down oxygen diffusion due to charge effects upon elemental segregation [15]. With polycrystalline samples, at GB regions, due to differences in crystallographic orientations and atomic arrangements between adjacent grains, GBs can act as fast diffusion paths as reported in UO2 [2, 5, 6], and the impact was shown to depend on the specific character of GB. Finally, the free surfaces, due to reduced bonding, would enable efficient atom jumps, and this applicability may also extend to curved surfaces such as voids and bubbles, which tend to form in oxide fuels during fabrication and normal operation stages [16].
In this work, these generally recognized fast diffusion pathways are systematically examined in ThO2 to gain an understanding of their impact on oxygen diffusion under 3000 K, where the superionic transition is yet to occur [17]. Here, we quantify the impact of individual extended defects including 1D dislocation, 2D grain boundary, and 3D voids. The oxygen diffusion is found to be enhanced in all the considered cases, but the boosting factor differs due to the unique characteristics of each defect. As irradiated fuels are expected to have a high concentration of multi-dimensional defects, particularly in the high-burnup structure where grain refinement can occur, such quantification provides a basis for evaluating the effective oxygen diffusion in ThO2.
2 Methods
Classical molecular dynamics (MD) approach as implemented in LAMMPS [18] is utilized. Atom interactions are described by an embedded-atom potential developed by Cooper et al. [11] for ThO2. In this potential, both Th (+2.2208) and O (-1.1104) atoms are modeled with fixed non-formal charges, and this potential can well reproduce thermophysical and defect properties [11, 19, 20]. The simulation cells for each type of defect are adapted to the specific structure to be detailed below. In all structures constructed, the whole cell is charge neutral to avoid numerical problems from periodic boundary conditions. The range of temperature in simulations is from 2000 K to 3000 K where sufficient atomic displacements occur within the MD timescale to yield confident statistics. Here we limit the considered temperature range below 3000 K as it was found that nonlinearity in the oxygen diffusion coefficient () appears in the “superionic” regime at a temperature close to but below the melting point due to dynamic disorder in the oxygen sublattice. In ThO2, MD simulations show that the superionic transition occurred at 3000 K [17]. After the structure is constructed, the corresponding cell is first fully relaxed at zero pressure at a specific temperature (NPT), and then atomic snapshots are taken from a canonical ensemble (NVT) run for 200-500 ps to compute the mean squared displacement (MSD). The time step is set to 1.0 fs. For the statistical quality of results, eight independent simulations are run for each type of structure at each temperature. Finally, the diffusion coefficients are computed based on Einstein diffusion analysis, i.e.,
| (1) |
where stands for the direction (, , and ), and are the oxygen positions at time and 0, respectively. Practically, linear regression between MSD and is performed to reduce uncertainty in . By distinguishing each direction, we can identify any low-dimensional oxygen diffusion pattern pertinent to the defect structure. To obtain spatial dependence of , the atoms are assigned to “slabs”/“shells” at , and Eq. 1 is applied to analyze each slab/shell of oxygen atoms. This method has also been used in previous studies of oxygen diffusion in UO2 under the influence of dislocations and GBs [2, 4].
Dislocation
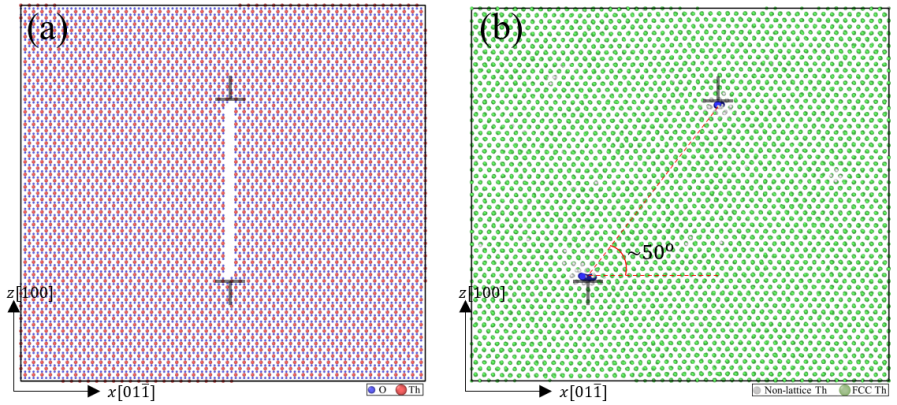
Edge dislocation of Burgers vector is considered, which is commonly seen in face-centered cubic (FCC) structures. To construct the dislocation, we first generate a perfect supercell containing 103,680 atoms ( nm3) with the axes orientation as , , and (Figure 1a). Then a slit is cut in the center along the -axis, and the ratio of removed O to Th atoms is 2 to ensure charge neutrality. To heal the structure, the system is relaxed at 2,500 K for 200 ps NPT and 1 ns NVT, leading to stable relative dislocation positions. Based on theoretical analysis, since the two dislocations’ motion is limited to the slide plane, they should achieve equilibrium positions at 45o [21]. However, this degree is not strictly obeyed here due to limited cell size with periodic boundary conditions. In this case, we note that the high-temperature dynamics simulation leads to a relative position at (Figure 1b). This equilibration step is critical in the following MSD evaluation as moving dislocation poses a problem in quantifying the real MSD of atoms due to pipe diffusion, which has been noted in the previous study of UO2 [4]. To obtain spatial dependence of , a cylindrical constant shell thickness of 3.0 Å is used, with the origin at the dislocation core.
Grain boundary
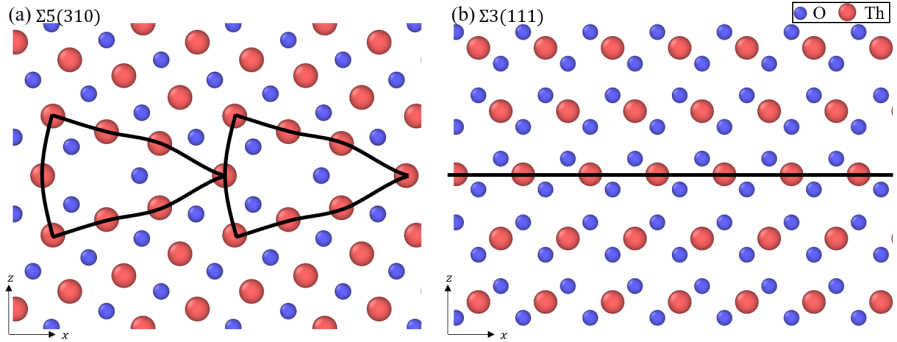
In this study, we consider two representative types of symmetrically tilt grain boundaries, and . The energy-minimized structures are shown in Figure 2, which are consistent with previous GB study in UO2 [2]. The former has a large open space in GB, where strong pipe diffusion may occur, while the latter represents the most compact interface, which may differ from open-structured GBs in oxygen transport. The comparison between them can assist in interpreting the diffusion behaviors for general types of GBs. Bi-crystal simulation cells are constructed. For , the simulation cell contains 57,600 atoms in nm3, and for , it contains 92,160 atoms in nm3 (the volumes change slightly at different temperatures). Note the distance between two GBs in the bi-crystal is intentionally made large to minimize GB-GB interaction. For the spatial dependence of , an increasing slab thickness from 3.0 Å is used, with the origin at the GB.
Void
Here, the curved surface is considered in the context of voids. The sources of curved surfaces in nuclear fuels could be from i) irradiation-induced voids, which are generally small in the nanometer range [22], ii) the fabrication process, where porosity is commonly achieved with pore size on the -scale [23], and iii) fission gas bubbles [24]. In the current study, two void sizes (radius of 0.5 nm and 1.5 nm) are considered to reveal the difference in oxygen self-diffusion due to local curvature. A perfect system containing 96,000 atoms ( nm3) is first created; then for Å, a total of 36 atoms (12 Th and 24 O atoms) are removed, and for Å, 975 atoms (325 Th and 650 O atoms) are removed to form a void in the center. For spatial dependence of , a spherical constant shell thickness of 1.5 Å is used, with the origin at the void center.
3 Results and Discussion
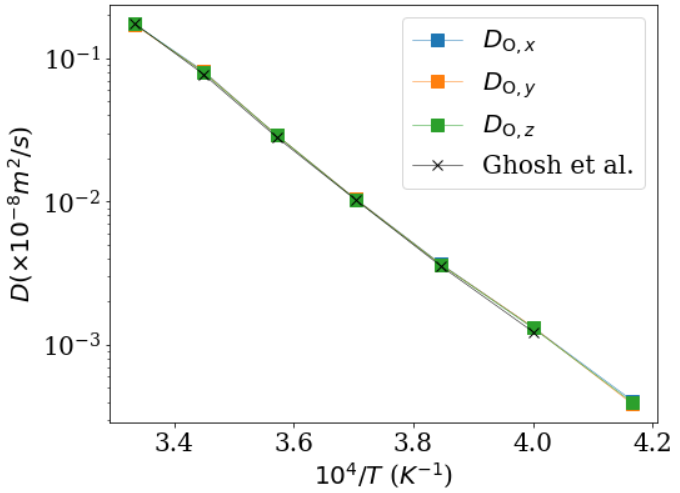
As a validation of the simulation settings, we first calculate the oxygen self-diffusion in a perfect lattice and compare it with literature values. Using a supercell containing 101010 unit cells, the calculation is performed within the range of 2400 K to 3000 K with increments of 100 K. Then Eq. 1 is applied to extract . As shown in Figure 3, the self-diffusion along each axis overlaps well with the previous bulk calculation using the same potential [17]. By fitting the data points to the Arrhenius equation, the activation energy for oxygen self-diffusion is 6.33 eV. Another indirect method to calculate the activation energy is based on , where is the formation energy of the oxygen Frenkel pair and is the migration energy of oxygen vacancy [1, 6]. In ThO2 with the current potential, it was calculated that eV [11] and eV (lowest barrier along [001] direction [17]), leading to 3.725 eV. This value is much lower than the direct method, suggesting that within this temperature range, oxygen diffusion may take high energy paths due to strong anharmonicity, e.g., the oxygen vacancy migration barrier along [110] direction is calculated to be 4.77 eV [17]. It should be noted that, the oxygen self-diffusion activation energy in ThO2 deduced from experiments is around 2 eV (see Introduction part); this could be ascribed to the intrinsic defects that already exist in the samples for the measurements.
3.1 Dislocation
With the setup of a dislocation pair, we calculate the oxygen diffusion coefficients as a function of the distance from the dislocation core (). It is worth noting that dislocation migration is mostly avoided in our simulations, as the dislocation pair is at a relatively stable position from the equilibration stage (see Methods). To ensure that dislocation migration is avoided during the evaluation of MSD, dislocation behavior is monitored throughout the simulations, and only the non-moving dislocation instances are used for MSD statistics. The reason is that as the dislocation migrates, the oxygen displacements are found to populate across the crossed slide plane.
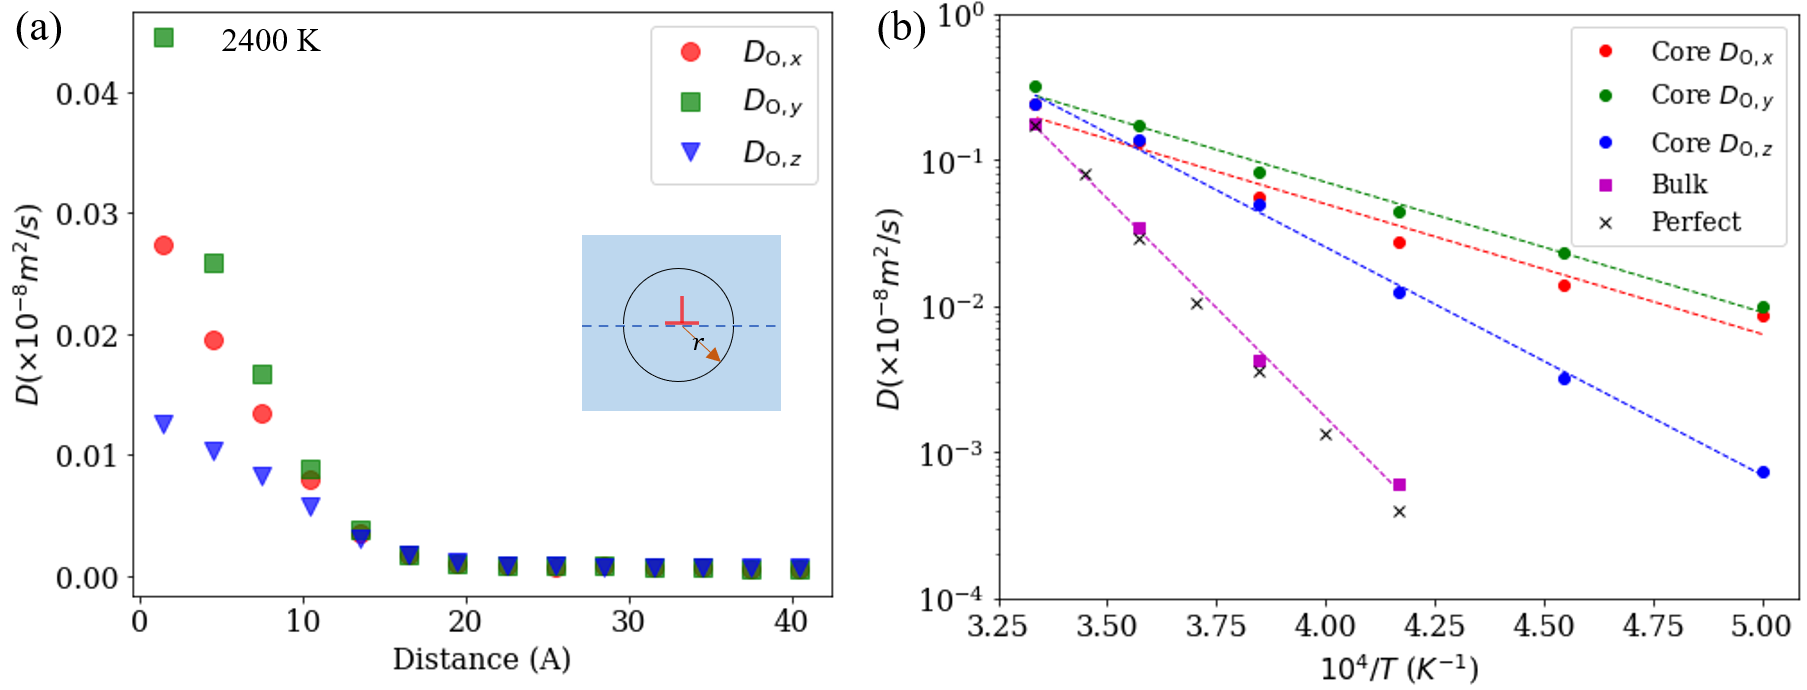
Figure 4a displays as a function of at 2400 K (similar profiles are found for other temperatures). Oxygen diffusion is found significantly enhanced in the core region, especially along the dislocation line (), which is attributed to pipe diffusion. Along on the dislocation half-plane, oxygen diffusivity () is least enhanced. Figure 4b plots versus temperature, comparing the values at the dislocation core and the bulk (regions nm away from the dislocation core). of oxygen atoms close to the dislocation core is significantly enhanced along all axes, compared to the bulk values, and it also shows higher values on the - slide plane than in the perpendicular direction () at the low-temperature end. By fitting to the Arrhenius curve, the activation energies are obtained, 1.77 eV, 1.77 eV, and 3.09 eV along the -, -, and -axis, respectively; it suggests that the higher than is due to the pre-factor instead of activation energy.
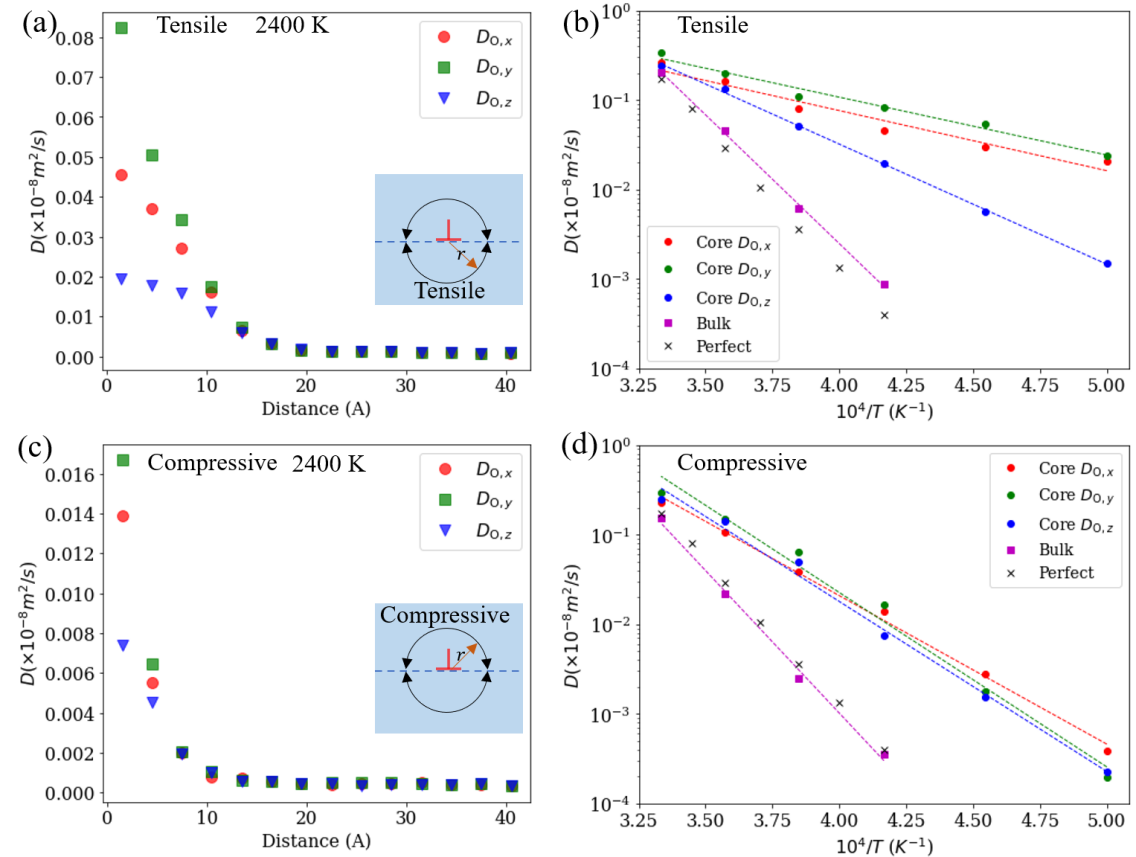
The local strain field is expected to cause anisotropy in oxygen diffusivity near the dislocation. In the study of UO2 by Murphy et al. [4], it was suggested that oxygen diffusion increases in the tensile region but is reduced in the compressive region, leading to a general increase in oxygen diffusivity. In another study of strained CeO2, the enhancement of oxygen diffusivity in the bulk under tension surpasses the decrease in diffusivity when an equivalent amount of train is imposed [25]. To reveal the effect in ThO2, we divide the space into tensile and compressive regions, and separately calculate the oxygen diffusivity as a function of and . FIGs. 5a and 5c show the spatially varying , indicating that in the compressive region is much lower than in the tensile region. As the self-diffusion activation energy includes defect formation energy, the phenomenon could be attributed to a higher oxygen defect formation energy in the compressive region than that in the tensile region. Furthermore, the decay of is faster in the compressive region, suggesting that the impact zone of the compressive elastic strain field is more localized than the tensile field. Furthermore, we compare the temperate dependent at the dislocation core and bulk part for the tensile and compressive regions (FIGs. 5c and 5d). In the tensile field, the following sequence is found in a broad temperature range, , while in the compressive field, with an average activation energy of 3.8 eV. Note that both the compressive and tensile regions close to the dislocation core have enhanced oxygen diffusion, which could be attributed to the strong interaction between oxygen point defects and the dislocation core. Finally, by comparing the bulk values (show convergence in , e.g., FIGs. 5a and 5c) with those based on the perfect lattice, there is a slight deviation due to the long-range elastic strain field: the compressive strain causes lower oxygen diffusivity, while the tensile strain causes higher oxygen diffusivity, consistent with the conclusion in CeO2 [25].
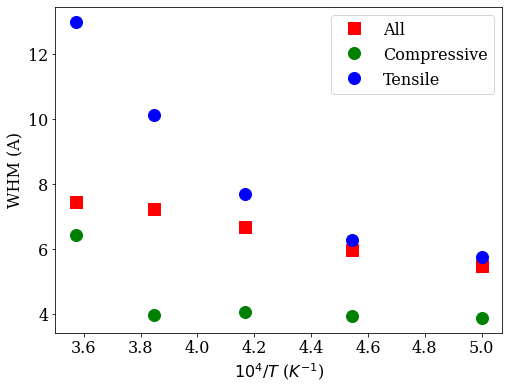
To quantify the impact zone of the dislocation for localized oxygen transport, we define a variable as the zone radius (origin at dislocation core) at half maximum of at the dislocation core. Figure 6 shows three sets of analyses for the tensile, compressive, and combined regions as a function of the reciprocal of temperature. It can be seen that the impact zone noticeably increases with temperature in the tensile region, while it remains almost constant for the compressive region. Quantitatively, the dislocation-affected oxygen diffusion region is in the nanometer range from the core.
3.2 GB
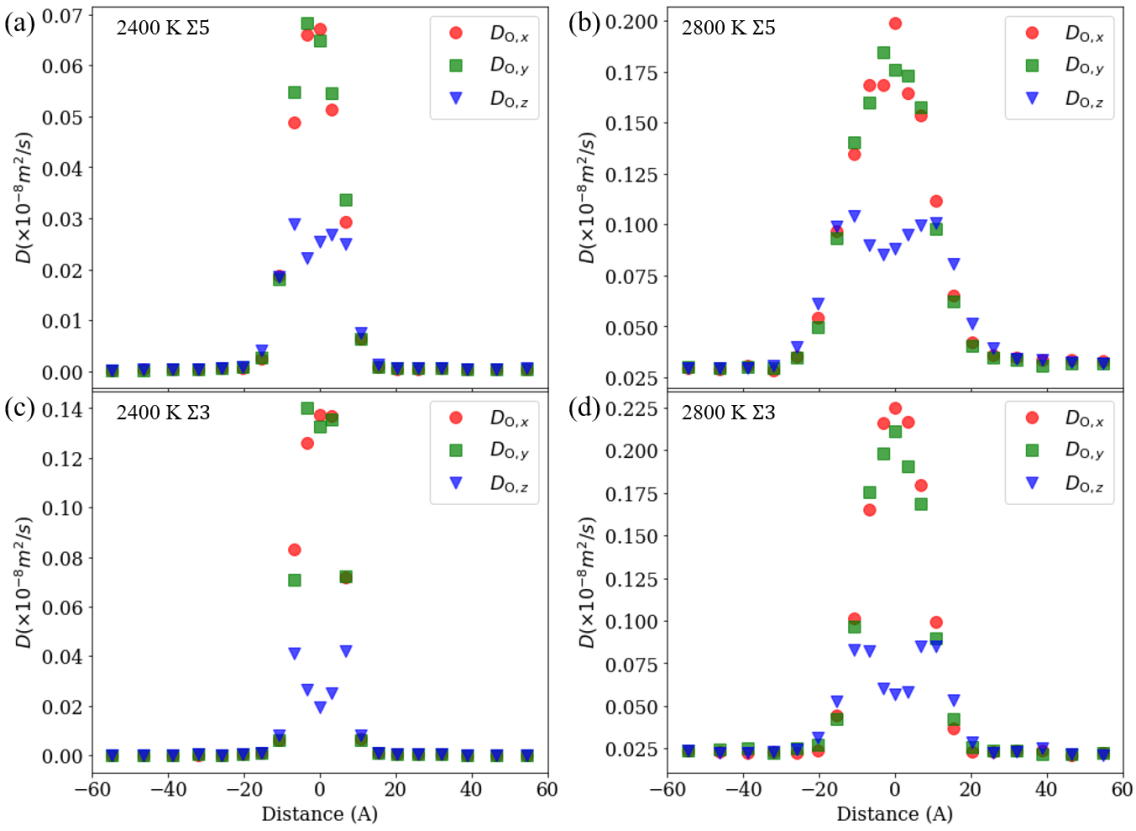
As the considered GBs are symmetric tilt, the diffusion profile should be symmetric with respect to the GB plane, as evidenced in Figure 7, which displays the profiles of across the GBs at 2400 K and 2800 K. For both GB types, oxygen diffusion is highest at the GB regions. By distinguishing the GB plane and the normal directions, it can be seen that diffusion is approximately isotropic on the GB plane ( and ), but relatively low along the normal direction of the GB plane . It should be noted that in , there is a slight dip in the GB core region. This observation is due to the diffusion of nearby oxygen atoms to GB and subsequent confined oxygen migration within the GB plane; hence, MSD along -direction is relatively lower for the oxygen atoms initially within the GB region than that in the neighboring regions.
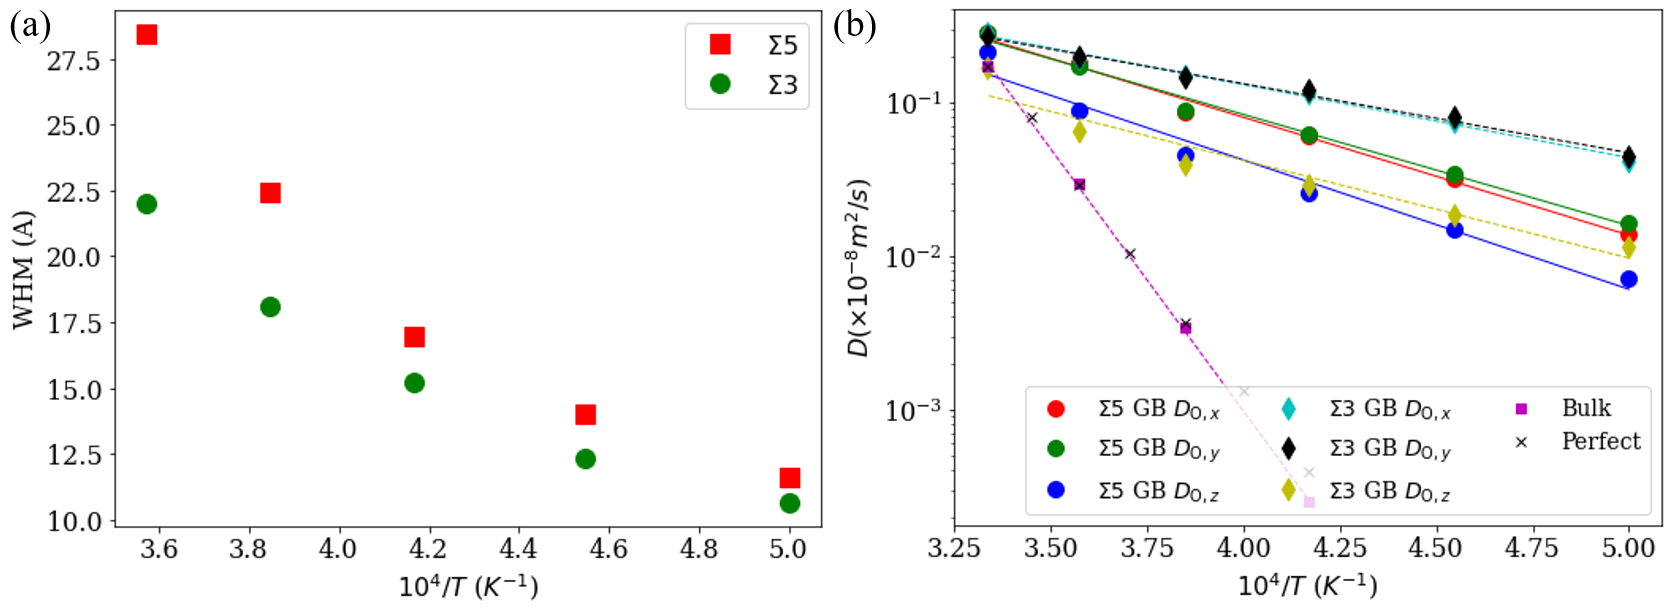
Figure 7 also signifies the fact that the enhanced oxygen diffusivity is localized near the GB region, and the diffusivity quickly decays with distance. Here, the impact zone is quantified similarly by the defined by the zone width at half maximum of evaluated at GBs. Figure 8a summarizes the results for the two GBs as a function of temperature. With increasing temperature, the impact zone increases for both GBs. The major impact range is around several nanometers, while has slightly higher widths than at all temperatures considered.
With varying temperatures, we compute oxygen diffusivity at GB regions along each axis. Note that the axes correspond to different crystalline directions for both GBs and the perfect lattice, however, comparing the bulk values which evaluated 6 nm away from GB, with the perfect lattice values (Figure 8b), it can be concluded that oxygen diffusion is isotropic. Furthermore, it can be seen that diffusivity is consistently higher on GB plane than that along the plane normal. Furthermore, and nearly overlap for both GBs, yielding 1.48 eV for and 0.92 eV for for the activation energies based on Arrhenius fitting. Apparently, oxygen diffusivity at GB is dependent on the structure of GB, and GB plane possesses a high oxygen diffusivity than . In , the open space in GB can equivalently be perceived as a high concentration of vacancies; if the vacancy-mediated diffusion mechanism is assumed dominant, the activation energy should be close to the oxygen migration energy. However, previous calculations of oxygen vacancy migration energy in the bulk give 0.78 eV [8] and 0.64 eV [26], much lower than the fitted value 1.48 eV for here. This discrepancy is presumably due to the contribution from the formation energy of the oxygen Frenkel pair in GB with weakened bonds at high temperatures.
It appears counter-intuitive that GB exhibits a higher diffusivity than , as has a large open space while is compact (Figure 2). Note that, in UO2, GB was also found to exhibit strong oxygen diffusion [2]. For comparison of GB properties, we calculate the GB energy by (, where is system potential energy with GB, is the perfect lattice potential energy with the same number of atoms, and is - cross-section area, which leads to and . It means that GB is more energy favorable. In GB, there are no inherent vacancies and interstitials in the ground state (Figure 2b). The high oxygen diffusivity and low activation energy suggest that both the oxygen Frenkel pair formation energy and the oxygen defect migration energy in GB are low. Given that i) oxygen interstitials have a higher migration barrier than vacancies (0.78 eV [8] and 0.64 eV [26]) in ThO2 [26, 8], and ii) GB exhibits 0.92 eV activation energy, lower than with 1.48 eV, it is possible that other low-barrier oxygen diffusion mechanisms beyond the regular oxygen interstitial or vacancy mechanisms are activated within the GB structure.
3.3 Void
It is known that the surface curvature can modify the diffusion-reaction energy barriers. For example, previous studies on the diffusion of adatom on the carbon nanotube surface indicate that positive curvature of the surface increases the diffusion barrier [27].
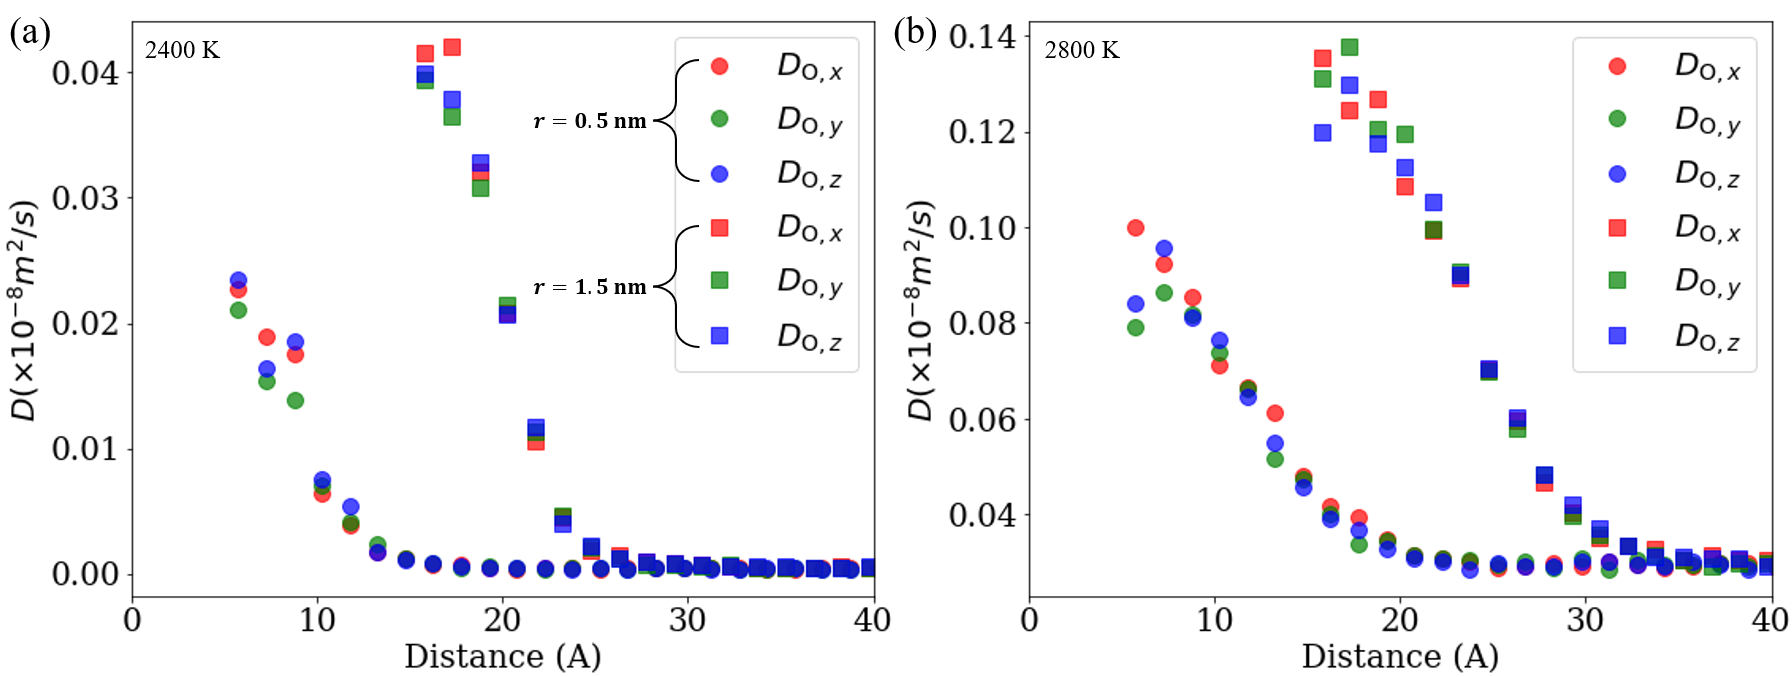
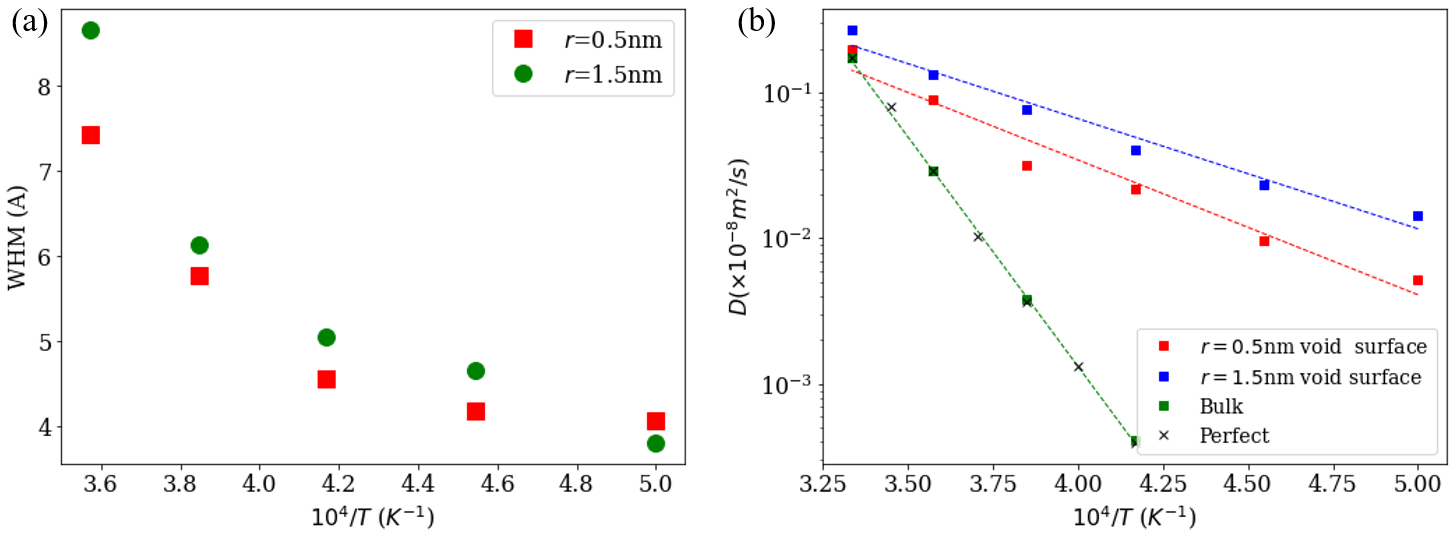
Figure 9 compares for two void sizes at 2400 K and 2800 K, where the distance at 0 Å denotes the center of the void. It can be seen that is significantly enhanced at the void surface. Since the void is not faceted upon construction and remains spherical during the simulation process, there is no directional dependence in . Therefore, to extract the diffusion activation energy, the three components are averaged to increase the statistical quality of the fitting. Figure 9 plots ln vs. for atoms at the interface, the values obtained in regions far from the void (i.e., bulk) are also provided for comparison, which reproduces the values based on the perfect lattice. Arrhenius fitting of the data points within 3 Å from the void surface yields the activation energies of oxygen diffusion at the void surface: and .
Further, small void sizes exhibit lower on the void surface compared to large sizes. Theoretically, we can expect that the diffusion activation energy is modified by surface pressure resultant from the curvature, where is the surface energy and is the void radius, i.e., [28], where is the activation volume. In principle, there can be a nontrivial relationship between and temperature [29, 30]; for simplicity, it is approximated to be the oxygen atomic volume at 2000 K, i.e., [29]. By assuming constant surface energy, we can deduce the oxygen surface diffusion activation energy and based on two void sizes, i.e.,
which yields and . This surface energy should be perceived as an average quantity, as the void is spherical rather than faceted. In ThO2, surface energies of low-index planes including (100), (110), and (111) planes have been quantified by atomistic methods based on empirical potentials [31, 32] and quantum mechanical treatment [33], where the latter leads to , , and . The current fitted value is in the range of previous studies. Similarly, the surface diffusion activation energy is not limited to a specific plane, and should be treated as an average over general surfaces.
Finally, we compute the impact zone of a void on oxygen diffusion via a variable defined as the surface width at half the maximum of evaluated at the void surface. Figure 10a summarizes as a function of , indicating that the impact zone strongly depends on the temperature but appears less sensitive to the void size. The entire width of the impact zone is around 12 nm, which is generally smaller than the case of dislocation and GBs.
4 Summary
| Edge dislocation | GB | GB | Void nm | Void nm | Perfect lattice | |
|---|---|---|---|---|---|---|
| 1.77 | 1.48 | 0.92 | ||||
| 1.77 | 1.48 | 0.92 | 1.84 | 1.50 | 6.33 | |
| 3.08 | N/A | N/A |
By quantifying oxygen diffusion and the activation energy, it can be concluded that in pure ThO2, various extended defects can enhance oxygen diffusion, although the boosting factors vary depending on the defect characteristics. TABLE 1 summarizes the activation energy. For the 1D edge dislocation, pipe diffusion is obvious; the strain field, particularly near the core, significantly enhances oxygen diffusion, even in the compressive field, because of the strong interaction between oxygen defects with the dislocation core. Nevertheless, in the long-range elastic field, compressive strain leads to reduced oxygen diffusion than stress-free lattice, while tensile strain causes increased diffusion. For 2D defect GBs, the activation energy depends on the GB character, as also seen in UO2 studies [6, 5, 2]. However, it is not yet clear why exhibits stronger oxygen diffusion than , where the latter has a large open space compared to . It is suspected that in GB, there are other oxygen diffusion mechanisms involved, which warrants further investigation. For 3D voids, oxygen diffusion is affected by local curvature/pressure, and smaller curvature leads to faster diffusion. It suggests that in ThO2 at certain porosity (95%), oxygen may diffuse significantly along the void surfaces. It remains to be confirmed whether this conclusion applies to pressurized bubbles in irradiated fuels.
In the current treatment, we assign the atoms into slabs/shells at the initial time step. Close to the defect sinks, strong oxygen diffusion is identified, and an impact zone width of these defects is computed. Notably, this zone width may also be perceived as a metric for defect capture radius to quantify the defect sink strength for oxygen defects. Atomistically, there could be two bi-directional processes to explain the impact zone with enhanced oxygen transport: i) oxygen defects at the defect sink migrate toward the bulk, increasing local oxygen diffusivity, and ii) oxygen defects are generated near the defect sink and migrate toward the sink where oxygen diffusion is high. Therefore, such zone width should depend on temperature and defect characteristics, as confirmed by the results.
These results indicate that extended defects-assisted diffusion can play a significant role in oxygen transport, especially at low temperatures. It should be noted that when comparing the data among those multidimensional defects, GB, particularly shows the strongest impact to mediate the overall oxygen transport. Since is also a low-energy GB type, its contribution to total oxygen diffusivity could be significant in polycrystalline ThO2.
References
- [1] G. Murch, C. R. A. Catlow, Oxygen diffusion in UO2, ThO2 and PuO2. a review, Journal of the Chemical Society, Faraday Transactions 2: Molecular and Chemical Physics 83 (7) (1987) 1157–1169.
- [2] N. R. Williams, M. Molinari, S. C. Parker, M. T. Storr, Atomistic investigation of the structure and transport properties of tilt grain boundaries of UO2, Journal of Nuclear Materials 458 (2015) 45–55.
- [3] M. W. D. Cooper, R. Grimes, M. E. Fitzpatrick, A. Chroneos, Modeling oxygen self-diffusion in UO2 under pressure, Solid State Ionics 282 (2015) 26–30.
- [4] S. T. Murphy, E. E. Jay, R. W. Grimes, Pipe diffusion at dislocations in UO2, Journal of Nuclear Materials 447 (1-3) (2014) 143–149.
- [5] E. Vincent-Aublant, J. Delaye, L. Van Brutzel, Self-diffusion near symmetrical tilt grain boundaries in UO2 matrix: A molecular dynamics simulation study, Journal of Nuclear Materials 392 (1) (2009) 114–120.
- [6] T. Arima, K. Yoshida, K. Idemitsu, Y. Inagaki, I. Sato, Molecular dynamics analysis of diffusion of uranium and oxygen ions in uranium dioxide, in: IOP Conference Series: Materials Science and Engineering, Vol. 9, IOP Publishing, 2010, p. 012003.
- [7] K. Ando, Y. Oishi, Oxygen self-diffusion and conduction mechanisms of thoria, Solid State Ionics 3 (1981) 473–476.
- [8] E. Colbourn, W. Mackrodt, The calculated defect structure of thoria, Journal of Nuclear Materials 118 (1) (1983) 50–59.
- [9] H. Lee, Electrical conductivity of UO2-ThO2 solid solutions, Journal of Nuclear Materials 48 (2) (1973) 107–117.
- [10] N. Choudhury, J. Patterson, Transition from ionic to electronic conduction in pure ThO2 under reducing conditions, Journal of the American Ceramic Society 57 (2) (1974) 90–94.
- [11] M. Cooper, M. Rushton, R. Grimes, A many-body potential approach to modelling the thermomechanical properties of actinide oxides, Journal of Physics: Condensed Matter 26 (10) (2014) 105401.
- [12] Y. Yun, P. M. Oppeneer, H. Kim, K. Park, Defect energetics and xe diffusion in UO2 and ThO2, Acta Materialia 57 (5) (2009) 1655–1659.
- [13] F. Zhang, A. M. Walker, K. Wright, J. D. Gale, Defects and dislocations in MgO: atomic scale models of impurity segregation and fast pipe diffusion, Journal of Materials Chemistry 20 (46) (2010) 10445–10451.
- [14] X. Tang, K. P. D. Lagerlöf, A. H. Heuer, Determination of pipe diffusion coefficients in undoped and magnesia-doped sapphire (-Al2O3): A study based on annihilation of dislocation dipoles, Journal of the American Ceramic Society 86 (4) (2003) 560–65.
- [15] L. Sun, D. Marrocchelli, B. Yildiz, Edge dislocation slows down oxide ion diffusion in doped CeO2 by segregation of charged defects, Nature Communications 6 (1) (2015) 6294.
- [16] A. Whapham, Electron microscope observation of the fission-gas bubble distribution in UO2, Nuclear Applications 2 (2) (1966) 123–130.
- [17] P. Ghosh, A. Arya, G. Dey, N. Kuganathan, R. Grimes, A computational study on the superionic behaviour of ThO2, Physical Chemistry Chemical Physics 18 (46) (2016) 31494–31504.
- [18] S. Plimpton, P. Crozier, A. Thompson, LAMMPS-large-scale atomic/molecular massively parallel simulator, Journal of Computational Physics 18 (2007).
- [19] M. Cooper, S. Middleburgh, R. Grimes, Modelling the thermal conductivity of (UxTh1-x)O2 and (UxPu1-x)O2, Journal of Nuclear Materials 466 (2015) 29–35.
- [20] M. Cooper, S. Murphy, M. Rushton, R. Grimes, Thermophysical properties and oxygen transport in the (UxPu1-x)O2 lattice, Journal of Nuclear Materials 461 (2015) 206–214.
- [21] D. Hull, D. J. Bacon, Introduction to dislocations, Butterworth-Heinemann, 2001.
- [22] C. Sabathier, G. Martin, A. Michel, G. Carlot, S. Maillard, C. Bachelet, F. Fortuna, O. Kaitasov, E. Oliviero, P. Garcia, In-situ tem observation of nano-void formation in UO2 under irradiation, Nuclear Instruments and Methods in Physics Research Section B: Beam Interactions with Materials and Atoms 326 (2014) 247–250.
- [23] T. Wangle, M. Beliš, V. Tyrpekl, J. Pakarinen, T. Cardinaels, T. Delloye, J. Vleugels, M. Verwerft, Morphology dependent sintering path of nanocrystalline ThO2, Journal of Nuclear Materials 533 (2020) 152081.
- [24] J. Turnbull, The distribution of intragranular fission gas bubbles in UO2 during irradiation, Journal of Nuclear Materials 38 (2) (1971) 203–212.
- [25] M. Rushton, A. Chroneos, S. Skinner, J. Kilner, R. Grimes, Effect of strain on the oxygen diffusion in yttria and gadolinia co-doped ceria, Solid State Ionics 230 (2013) 37–42.
- [26] L. He, T. Yao, K. Bawane, M. Jin, C. Jiang, X. Liu, W.-Y. Chen, J. M. Mann, D. H. Hurley, J. Gan, et al., Dislocation loop evolution in Kr-irradiated ThO2, Journal of the American Ceramic Society 105 (8) (2022) 5419–5435.
- [27] D. Shu, X. Gong, Curvature effect on surface diffusion: The nanotube, The Journal of Chemical Physics 114 (24) (2001) 10922–10926.
- [28] D. B. Butrymowicz, J. R. Manning, M. E. Read, Diffusion in copper and copper alloys. part i. volume and surface self-diffusion in copper, Journal of Physical and Chemical Reference Data 2 (3) (1973) 643–656.
- [29] A. Chroneos, R. Vovk, Modeling self-diffusion in UO2 and ThO2 by connecting point defect parameters with bulk properties, Solid State Ionics 274 (2015) 1–3.
- [30] N. Sarlis, E. Skordas, Pressure and temperature dependence of the oxygen self-diffusion activation volume in UO2 by a thermodynamical model, Solid State Ionics 290 (2016) 121–123.
- [31] R. K. Behera, C. S. Deo, Atomistic models to investigate thorium dioxide (ThO2), Journal of Physics: Condensed Matter 24 (21) (2012) 215405.
- [32] G. Benson, P. Freeman, E. Dempsey, Calculation of cohesive and surface energies of thorium and uranium dioxides, Journal of the American Ceramic Society 46 (1) (1963) 43–47.
- [33] F. Skomurski, L. Shuller, R. Ewing, U. Becker, Corrosion of UO2 and ThO2: A quantum-mechanical investigation, Journal of Nuclear Materials 375 (3) (2008) 290–310.