[orcid=0000-0002-1438-8443]
[orcid=0000-0002-7591-0127] \cormark[1]
[orcid=0000-0002-0106-655X]
[orcid=0000-0002-2337-2857] \cormark[1]
inst1]organization=College of Computer and Information Science, Southwest university,postcode=400037, state=Chognqing, country=China
inst2]organization=Department of Artificial Intelligence, Faculty of Information and Communication Technology, Wrocław University of Science and Technology,postcode=50-370, country=Poland
[cor1]Corresponding author
A performance characteristic curve for model evaluation: the application in information diffusion prediction
Abstract
The information diffusion prediction on social networks aims to predict future recipients of a message, with practical applications in marketing and social media. While different prediction models all claim to perform well, general frameworks for performance evaluation remain limited. Here, we aim to identify a performance characteristic curve for a model, which captures its performance on tasks of different complexity. We propose a metric based on information entropy to quantify the randomness in diffusion data, then identify a scaling pattern between the randomness and the prediction accuracy of the model. Data points in the patterns by different sequence lengths, system sizes, and randomness all collapse into a single curve, capturing a model’s inherent capability of making correct predictions against increased uncertainty. Given that this curve has such important properties that it can be used to evaluate the model, we define it as the performance characteristic curve of the model. The validity of the curve is tested by three prediction models in the same family, reaching conclusions in line with existing studies. Also, the curve is successfully applied to evaluate two distinct models from the literature. Our work reveals a pattern underlying the data randomness and prediction accuracy. The performance characteristic curve provides a new way to systematically evaluate models’ performance, and sheds light on future studies on other frameworks for model evaluation.
keywords:
model evaluation \sepprediction performance \sepinformation diffusion prediction \sepinformation entropyAn information-entropy-based metric is designed to quantify the randomness in the data.
Model’s performance under different task complexity is comprehensively illustrated by the designed curve.
A new framework is proposed to evaluate the performance of information diffusion prediction models.
1 Introduction
In machine learning, a model can be regarded as a collection of the algorithm, the parameters and other things that can recognize a certain pattern in the data and utilize the pattern to forecast something unknown (Schelter et al.,, 2018). For a given task, there are usually multiple models, which naturally gives rise to a question on how to effectively evaluate them (Raschka,, 2018). Indeed, all models are claimed to outperform the existing baselines when proposed. However, systematic comparisons are limited and a general framework for the performance evaluation remains to be explored. It is usually unclear if a model’s reported advances only hold in a parameter region delicately selected or one model absolutely outperforms other baseline models in all cases.
In traditional engineering fields, the properties of instruments are usually evaluated in a more comprehensive way. For example, the performance of an engine can be evaluated by the performance characteristic curve which illustrates how the output power and torque vary with the engine’s rotation speed. In this way, the parameter region that is optimal for an engine can be identified. Two engines can be properly compared and selected for different tasks. This motivates us to seek the performance characteristic curve for a machine learning model, which tells how the performance of the model changes with different complexity of the task. Nevertheless, plotting such a performance curve is not trivial. The selection of physical quantity to gauge the complexity is not straightforward. As will be shown later, when simply plotting the model’s output with some kind of complexity measure of the data, the data points will be scattered and a consistent relationship is hardly guaranteed.
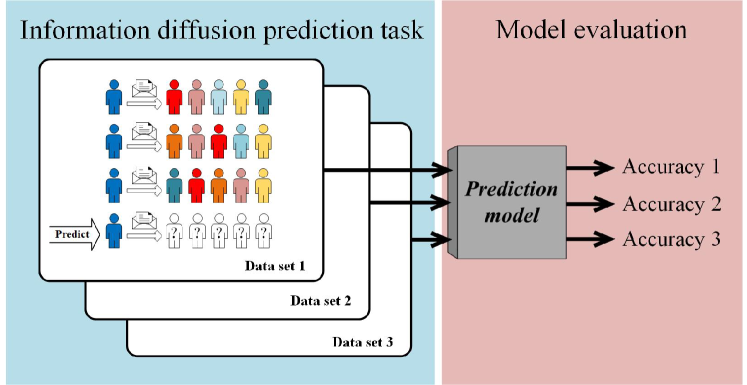
In this paper, we take the task of information diffusion prediction as a particular case. We focus on information diffusion prediction partially because this task in general lacks common data sets (Hofman et al.,, 2017; Martin et al.,, 2016). Researchers usually collect data on their own and simply evaluate prediction models on these isolated data sets by their prediction accuracy, as shown in Fig. 1. Hence, even for data collected from the same social platform, they could differ due to different collection time, topics, the set of users covered, relationships extracted, and collection methods applied. Although there are certain public data sets widely used in the field, the different filtering criteria and data pre-processing would still make the information eventually applied in one study different from the other. All these uncontrollable variables bring ambiguities to performance comparison among different prediction models. In this paper, we show that the performance characteristic curve of a model can be reached by leveraging the scaling pattern between the inherent randomness in the data and the accuracy of the prediction.
Analogous to the common task in machine learning, the flow of this paper can be roughly divided into “training, validation and testing” parts. In the “training” part, we propose an information entropy based metric to gauge the inherent randomness in the spreading sequence, which effectively reflects the level of complexity for the prediction. We apply the content diffusion kernel (CDK) model (Bourigault et al.,, 2014) to both synthetic and empirical data and measure the quality of the prediction. By re-scaling the precision metric, we identify a scaling pattern between the randomness of the data and the prediction precision. Despite the clear difference in the prediction outcomes that are obtained from data with diverse qualities, all the values eventually collapse on a single curve. As the curve statistically captures a model’s capability to make accurate predictions against the increasing disorder in the data, it can be further utilized in model evaluation. This idea is validated through a comparison among CDK model and two of its variants with known performance differences. Finally, we test our proposed approach in two independent prediction models. Our results show that one model statistically outperforms the other when the prediction task is relatively hard. But their performance can be indistinguishable when the data is more regular and the prediction is relatively easier. Taken together, we reveal a new set of regularities underlying the information diffusion prediction task, allowing us to reach a model’s performance characteristic curve for a new framework to evaluate the performance of different models.
2 Related studies
2.1 Information diffusion prediction on social media
Social media (such as Facebook, Twitter, TikTok, etc.) has become one of the major pathways to share and exchange information and ideas, which profoundly shapes the contemporary social, economic and political environment (Auxier and Anderson,, 2021; Zhang et al.,, 2022). Consequently, there is an urgent need to understand patterns underlying information diffusion in social media, which helps forecast a message’s future impact and control the potential hazard that comes after (Stieglitz and Dang-Xuan,, 2013; Li et al.,, 2022). Intensive research has been carried out from different aspects by researchers in diverse fields such as computer science, physics, mathematics and social science. To simulate the spreading process, different theoretical models are proposed, from the susceptible-infectious-recovered (SIR) model in epidemics (Hethcote,, 1989), to independent cascade (IC) model frequently used in computer science (Kempe et al.,, 2003), and to linear threshold (LT) model (Watts,, 2002) that takes social reinforcement effects into consideration. In the interdisciplinary field of network science, researchers are interested in identifying central nodes or topological features that could maximize the influence (Kempe et al.,, 2003; Cheng et al.,, 2013; Dupuis et al.,, 2020; Kumar et al.,, 2022), building connections between information spreading and statistical physics process in order to control or promote the spreading (Solomon et al.,, 2000; Xie et al.,, 2021; Michalski et al.,, 2022).
Information diffusion prediction is a topic that draws great attention. The task covers a wide range of problems, which range from predicting the ultimate popularity of a message (Shen et al.,, 2014; Feng et al.,, 2020; Wang et al.,, 2022; Sun et al.,, 2023), to its growth trend (Cheng et al.,, 2014; Krishnan et al.,, 2016; Zhou et al.,, 2021) and temporal order in the spreading sequence (Monclar et al.,, 2009; Wu et al.,, 2017; Tu et al.,, 2022). With the tools in deep learning and network embedding, a variety of prediction models are proposed, which significantly advance the front line of this research field. But as mentioned, while all proposed models claim to be better than other baselines, systematic comparisons remain limited.
In this work, we focus on predicting the set of nodes (users) that are reached by the information, given the nodes that initiate the spreading (Hofman et al.,, 2021; Zhou et al.,, 2021). A lot of external features can be applied in this prediction task, such as the topology of the network that serves as the backbone of the spreading, the information content, and the precious time that the message is accepted (Wang et al.,, 2017; Li et al.,, 2018, 2017). To avoid the interference caused by multiple features, we consider the most simple approach that only uses the current ordered sequence of recipients to predict future recipients. This kind of model learns from the full spreading sequence in the training set. Based on patterns learned, the model predicts the successive nodes once an initiating node is given (Bourigault et al.,, 2014; Liu et al.,, 2016; Wang et al.,, 2017; Zhao et al.,, 2020). In the following text, these models will serve as application objects for our model evaluation framework.
2.2 Data randomness and model performance
Some researchers have addressed the issue of quantifying the randomness of the data and associating it with the performance of different models. Song et al., (2010); Lu et al., (2013) use information entropy to quantify the “predictability” of human mobility, the upper bound that a person’s next location can be predicted. Sinatra and Szell, (2014); Chen et al., (2016) apply a similar approach to investigate the “predictability” of users’ online activities. Lü et al., (2015); Yin et al., (2017); Sun et al., (2020) analyze the topological properties of the network and quantify the “predictability” toward the link prediction task. These works quantify the overall difficulties of the prediction. But the “predictability” is related to the theoretical bound that any method could ever achieve, which is not directly related to the performance of a particular prediction model. Zhu et al., (2021); Zhan and Jia, (2022) use entropy-related measures to explain the performance of particular models, proving that the data quality sampled by the model is highly related to the model performance in tasks like node classification and link prediction. Yijun et al., (2022) studies the link prediction upper bound based on a particular topological feature and shows the relationship between the prediction accuracy and the topological characteristics of a network. Barzel and Barabási, (2013) also demonstrates how the noise and uncertainty of data affect the performance of link prediction algorithm. But due to these works only applying a limited number of measurements, one could not draw a consistent conclusion on how the performance varies with changing complexity of the data. In this work, we identify a performance characteristic curve that illustrates a model’s performance under different task complexity, mining the underlying pattern between data randomness and model performance comprehensively.
3 Problem definition and experimental data
3.1 Problem definition
In our paper, the model evaluation task is researched in the field of information diffusion prediction. Here the information diffusion prediction problem is described as follows. A social network is a graph in which each user in the network is the node and each relation between users is the edge . When a user posts a message, other users in the network can forward it and these users compose an information diffusion sequence in which users are ordered by the forwarding time. The diffusion sequence which is also named a cascade is noted as in which is the diffusion source. Then the information diffusion prediction problem is defined as given a cascade set consisting of cascades, to predict the new cascade when the new diffusion source of the cascade is known.
The traditional model evaluation metrics are based on the similarity between each ground-truth cascade and the model’s prediction for that cascade . Detailed explanations are provided in Section 4. In contrast, we assess the randomness of different cascade sets and investigate the accuracy of the model under varying levels of prediction complexity. Then we scale these accuracy points to a single characteristic curve, which can provide a comprehensive and intuitive description of the model’s prediction ability.
3.2 Experimental data
We make use of both synthetic and empirical data. For synthetic data, we generate the Erdős-Rényi (ER) network (Erdős and Rényi,, 1960) and the Barabási-Albert (BA) scale-free network by static model (Barabási and Albert,, 1999) with a given average degree (ranges from 3 to 10) and size (ranges from 100 to 1000 nodes). We run independent cascade (IC) mode (Kempe et al.,, 2003), linear threshold (LT) model (Watts,, 2002) and susceptible-infectious (SI) model (Hethcote,, 2000) on these networks to generate synthetic spreading sequences. For SI and LT models, the simulation is carried out by the Gillespie algorithm which guarantees an accurate generation of the random process (Fennell et al.,, 2016; Ran et al.,, 2020). Based on the observation of empirical data, we limit the sequence length to 1/10 of the number of network nodes. For example, for a network consisting of 500 nodes, the sequence length we generated ranges from 10 to 50.
For empirical data, we use spreading sequence on Twitter(Hodas and Lerman,, 2014), Digg(Hogg and Lerman,, 2012), and Douban, which records multiple lists of users sharing the same message ordered by time. The data set of Twitter contains 137,093 nodes (users in the social network), 3,589,811 edges (user links according to their following relationships), and 569 cascades. The data set of Digg contains 279,632 nodes, 2,617,993 edges and 3,553 cascades. The data set of Douban is collected by us, with the focus on the network centered on the “Top 100 users”, which contains the 100 most popular users and their followers. The Douban data set contains 13,777 nodes, 567,250 edges, and 21,756 cascades.
To generate the spreading sequence with diverse complexity from empirical data, we select a fixed number of nodes from the original diffusion sequences while keeping the relative positions of selected nodes unchanged. Because the original sequence length in Twitter and Douban is barely more than 50, the length of the generated sequence in these two data sets ranges from 10 to 40. In Digg, the sequence length ranges from 10 to 100.
4 Metric for prediction performance
Precision, recall, and F1-score are commonly used to evaluate the effectiveness of an information retrieval system. However, these metrics cannot directly evaluate the similarity between the ranked documents. Instead, Rank Biased Precision (RBP)(Moffat et al.,, 2007) and Mean Average Precision (MAP)(Robertson,, 2008) are more suitable for sequence comparisons. In this work, we choose MAP for its frequent usage in information diffusion prediction studies (Bourigault et al.,, 2014; Liu et al.,, 2016; Wang et al.,, 2017; Feng and Wang,, 2013; Xie et al.,, 2022; Bourigault et al.,, 2016; Zhao et al.,, 2020).
To calculate MAP, we need to first quantify the prediction accuracy of a single sequence. For a cascade sequence in the testing set (ground truth) and a predicted sequence , the prediction accuracy is calculated as
| (1) |
where stands for the rank of node in the predicted cascade , stands for the top- sub-sequence of . This sub-sequence is compared with and the overlap is then averaged to reach the final value of . The orders of nodes in the predicted and actual sequence are partially taken into consideration. If and contain the same set of nodes, and nodes’ order do not play a role. However, if nodes in and are not the same, the match on the top part of the sequence is given a bigger weight.
The MAP is the average value of , calculated as
| (2) |
where is the set of predicted cascade sequences.
5 Metric for data disorder
The extent of randomness in the data is usually quantified by information entropy (Shannon,, 1948). Block entropy (or n-gram entropy) is one of the most commonly used metrics to measure the extent of disorder in sequences (Schürmann and Grassberger,, 1996; Jiménez-Montaño et al.,, 2002). Assume a sequence . A window of length can be used to extract a sub-sequence (or block) like from the original sequence, denoted by . The appearance frequency of this sub-sequence is counted in the data with a sliding window, giving rise to . The block entropy is then calculated as
| (3) |
Block entropy in Eq.(3) is applicable when the number of distinct elements is relatively small, such as the DNA sequence composed of only 4 types of bases (Schmitt and Herzel,, 1997), and the song of humpback whales with a few dozens of acoustic signals (Suzuki et al.,, 2006). However, block entropy is not applicable for measuring the disorder of the spreading sequence. First, the spreading sequence is composed of distinct nodes, giving rise to a large number of block combinations. Furthermore, block entropy can not capture the non-continuous structure information. For example, the sequences “ABD” and “ACD” contain the property that “A” is always ahead of “D”. But such information can not be captured by block entropy. Finally, an appropriate choice of block length is hard to be guaranteed.
For these reasons, we need to find a new metric to gauge the randomness of data. In information spreading, the order that a message reaches different nodes is an important feature, reflecting properties such as the closeness to the source, the infection rates of individuals, the driven mechanism of the spreading, and more (Lee et al.,, 2010; Riquelme and González-Cantergiani,, 2016). The consistency of the two nodes’ relative positions reflects an extent of regularity in the data. Therefore, we turn to analyze the pairwise comparison of nodes’ positions, leading to a probability matrix (Sanchez and Soyer,, 1998; Joe,, 1988), where is the probability that node ranks ahead of . Note that for all and is undefined.
The probability can be further applied to the formula of entropy, giving rise to a pairwise comparison entropy (PCE) as
| (4) |
when the relative position of and is fixed in all sequences, indicating a high degree of regularity. On the contrary, reaches the maximum when the relative position of node and are purely random.
By averaging the PCE of all node pairs, we obtain the average pairwise comparison entropy (APCE) associated with the overall extent of disorder
| (5) |
where is the number of times that node and simultaneously appear in the data, and is the total number of all node pairs. As an example, for two cascade sequence
the APCE is calculated as
| (6) |
6 Scaling pattern
With the metric to quantify the randomness of the data and the prediction performance of a model, we can investigate their relationship in a particular prediction model. We start with the content diffusion kernel (CDK) model, which uses a kernel motivated by heat diffusion to learn the latent representation of nodes (Bourigault et al.,, 2014). CDK model is one of the earliest works that apply network embedding in information diffusion prediction. It relies on the temporal order of the spreading sequence, and does not require additional features such as the network structure or the user profile, which fits the scope of the problem studied here. Moreover, CDK model has other variants with very similar designs, which can be used to validate the performance comparison. To better identify potential patterns, we start with synthetic data that are less noisy.
Experiments are firstly conducted on data sets generated by IC model on ER networks. When plotting the APCE of the data and the MAP by the CDK model, however, we could not see a clear pattern (Fig. 2a). While MAP in general decreases with APCE as expected, data points are scattered. For data with a similar extent of the disorder, the prediction accuracy can fluctuate significantly. Hence, the direct relationship between APCE and MAP can not be the performance curve for the model.
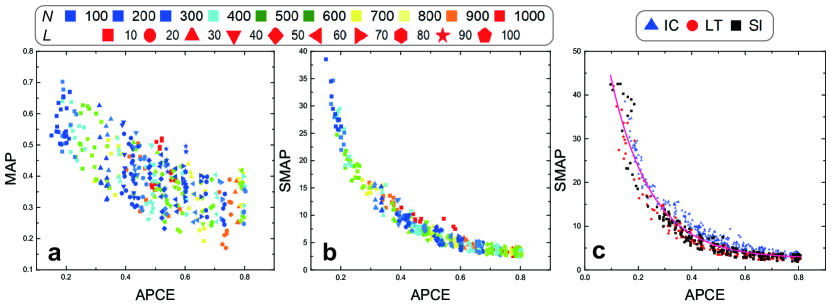
But we notice that MAP is affected by the size of the system () and the length of the predicted sequence (). A large value tends to lower the prediction accuracy as there are more candidates to choose from. On the contrary, a large value is associated with improved accuracy as the hit rate grows when the target is larger. The impact of and is related to the prediction task itself, not to the quality of the training data. Therefore, we should take them into account by resealing the original MAP, giving rise to the scaled MAP (SMAP) as
| (7) |
When the accuracy metric is replaced by SMAP, we find that the originally scattered data points start to collapse on a single curve, demonstrating a clear scaling pattern (Fig. 2b). The same pattern also holds in synthetic data generated by LT and SI models (Fig. A1 in Appendix). More importantly, when the data points from different spreading mechanisms are put together, they almost overlap each other, implying that the internal driven mechanism of the spreading has little impact on the scaling law (Fig. 2c). Instead, the network topology may be a more important factor. By changing the network topology from ER random network to BA scale-free network, we obtain the patterns that exhibit the same descending and scaling trend as those described in ER data, but the specific scaling curve may differ for a certain model (Fig. A2a in Appendix).Overall, the scaling curve can be well fitted by an exponential decay function as (Fig. 2c), capturing a model’s inherent capability of making correct predictions against increased uncertainty.
7 Validation and application of model evaluation
7.1 Validation
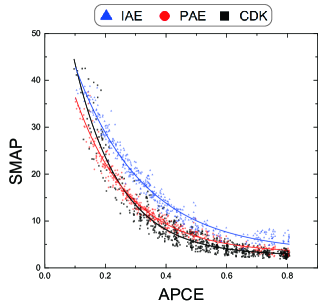
The scaling pattern observed between SMAP and APCE provides a performance characteristic curve reflecting how a model behaves in prediction tasks with different levels of difficulties. This motivates us to further utilize it for model performance evaluation. We consider two variants of CDK model which follow the general framework of CDK model with slight modification the choice embedding space. Instead of embedding all nodes in one latent space as CDK does, the position-aware asymmetric embedding (PAE) (Liu et al.,, 2016) adopts an asymmetric embedding strategy to separately embed nodes into one influence space and one susceptibility space. The independent asymmetric embedding (IAE) (Xie et al.,, 2022) embeds the source nodes into an influence space and embeds the infected nodes into susceptibility spaces, in order to avoid the mutual interference of embedding positions among the infected nodes of different cascades when they are in the same susceptibility latent space. The three models use the same heat diffusion kernel to learn the distance between nodes. Their only difference is in the number of latent space(s) used to represent a node. As the number of latent spaces increases, it is naturally expected, and also empirically tested that IAE would outperform PAE, and PAE would outperform CDK (Xie et al.,, 2022).
We draw the SMAP-APCE plots of the three models obtained from synthetic data and fit them by the exponential decay function (Fig. 3). Fig. 3 indicates that the scaling pattern holds in the other two models and the exponential decay function provides a good fit to the data points. The fact that the scaling curves of each model are different from one to another confirms the use of performance curve to statistically quantify a model’s performance. Fig. A2b illustrates the similar scaling patterns of these three models on the BA data, which further proves the stability of the performance characteristic curve used for model evaluation, regardless of how the network topology changes.
Indeed, in Fig. 3, when the data is quite disordered (APCE is high), the curve of IAE is above the curve of PAE, and the curve of CDK is at the bottom. This confirms previous comparisons of performance among the three models (Liu et al.,, 2016; Xie et al.,, 2022). However, it is also interesting to note that when APCE is low, CDK’S performance curve surpasses the other two. This suggests that when the data is less random and the prediction is consequently less challenging, using too many latent spaces can be overkill.
We also investigate the SMAP-APCE plots in empirical data sets (Fig. A3 in Appendix) and find similar behaviors. This similar comparison conclusion emerges in both synthetic and empirical data, showing the robustness of our evaluation method. Note that as a diffusion cascade set only involves a small proportion of the whole network nodes in empirical data, the network size used for scaling is set as the size of the propagation subgraph.
7.2 Application
The results of our experiments have validated the feasibility of utilizing our proposed framework based on the performance characteristics curve for model evaluation. Moreover, it is important to investigate whether our evaluation framework can offer advantages over the traditional method when it comes to comparing models that cannot be effectively compared using the traditional single-point metric. To investigate this further, we apply the proposed method to evaluate two distinct information diffusion prediction models. These two models exhibit similar performances when evaluated using traditional metric MAP, resulting in confusing comparison results.
Embedded-IC (Bourigault et al.,, 2016) embeds users into a latent space based on an assumption that the underlying spreading mechanism follows the IC model. The relative position in the latent space is then used to compute the diffusion probabilities between users.
Topo-LSTM (Wang et al.,, 2017) explores the diffusion topology of cascades using a directed acyclic graph. The graph is put into an LSTM-based model to generate topology-aware embeddings for users which are utilized for predicting nodes in a spreading.
The performance comparison between the two models based on isolated data sets is reported in Tab. 1, in which MAP@k means the MAP values for different predicted cascades with length . With the change in the data set and other parameters, the rank of their performance also changes. Hence, model evaluation by the traditional approach can not provide the full performance information of a model. It is not possible to draw a firm conclusion regarding which model is better than the other based on this evaluation method. Indeed, by filtering the data or choosing the right hyper-parameters, one can claim that Topo-LSTM outperforms Embedded-IC, or the opposite.
| Data set | Method | MAP@k(%) | ||||
| @100 | @300 | @500 | @700 | @900 | ||
| Embedded-IC | 0.751 | 4.740 | 12.568 | 24.985 | 43.347 | |
| Topo-LSTM | 0.665 | 5.084 | 13.681 | 26.083 | 42.050 | |
| Digg | Embedded-IC | 2.084 | 9.073 | 23.314 | 47.249 | 78.066 |
| Topo-LSTM | 2.444 | 17.535 | 25.812 | 42.779 | 69.534 | |
| Douban | Embedded-IC | 1.210 | 3.251 | 8.962 | 17.734 | 37.568 |
| Topo-LSTM | 0.935 | 5.147 | 10.035 | 15.239 | 35.327 | |
-
*
The MAP values of two models on Twitter and Digg data are reported by Zhao et al., (2020) and MAP values on Douban data are collected by us.
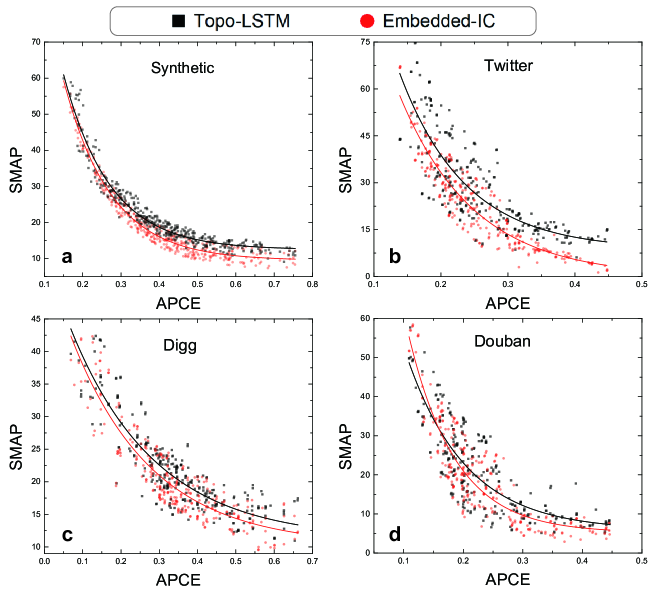
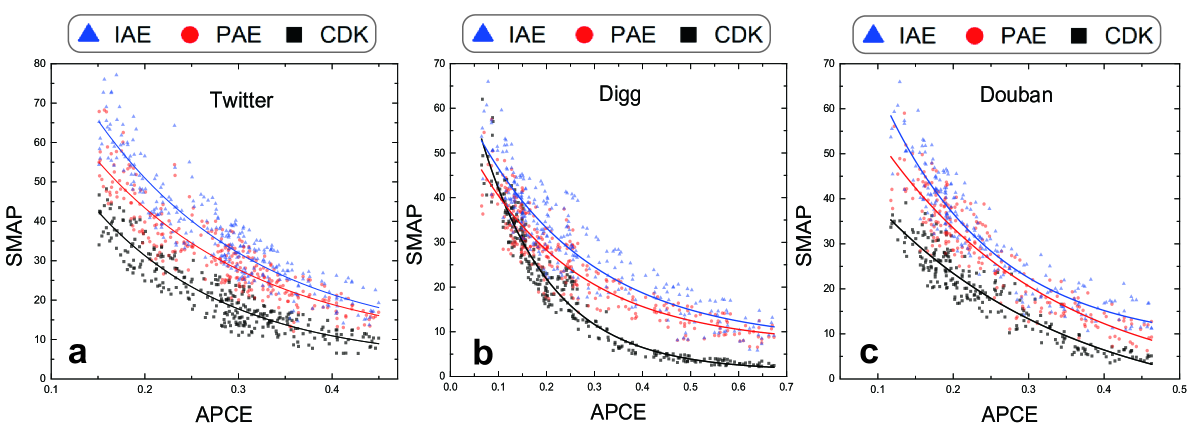
The model performance characteristic curve overcomes the limitation of using isolated data sets. The performance curve based on synthetic data is shown in Fig. 4a. The scaling pattern holds for distinct types of prediction models, suggesting a universality of this pattern. The fitted curves of the two models suggest that Topo-LSTM is better than Embedded-IC in most instances, but the two models’ performances can be indistinguishable when the data is less random. The model evaluation on empirical data also gives the same conclusion (Fig. 4b-d). When the prediction task is less challenging, Embedded-IC can make predictions as well as, or even better than what Topo-LSTM yields.
Obviously, compared to the previous method of evaluating model performance using the mean average precision (MAP) metric on discrete data sets, the framework proposed in this paper provides a more comprehensive view of model performance across various levels of difficulty, as well as a more detailed understanding of the trade-offs involved in model selection. By taking into account the data randomness, the performance characteristic curve captures the complete performance profile of the model, thereby providing a more systematic and scientifically informed basis for model selection and evaluation.
8 Conclusion
In this work, we aim to identify a performance characteristic curve for model evaluation and comparison. We take the information diffusion prediction as a particular case in this paper. An average pairwise comparison entropy is defined to quantify the randomness of diffusion sequences, which also reflects the complexity of the prediction task. We identify a scaling pattern between the prediction accuracy and the data complexity. The scaling curve captures a model’s inherent capability of making correct predictions, which can serve as the performance curve of the model. We validate and test the application of the performance curve using different prediction models and obtain more comprehensive performance comparisons among models. We hope our work can offer new perspectives for machine learning model evaluation.
9 Implications and future work
9.1 Theoretical and practical implications
As machine learning applications continue to expand, there is an increasing need for the evaluation of model performance across different fields. In this work, we address this issue in the context of information diffusion prediction tasks. By introducing the performance characteristic curve, we provide a new framework for evaluating the prediction model performances. This framework takes into account not only the accuracy of the model but also the inherent disorder in diffusion data. It allows researchers to gain insights into the interplay between data randomness and model accuracy, which can lead to a better understanding of the limitations and strengths of different models. The proposed performance characteristic curve offers a more holistic evaluation of the model, going beyond traditional single-point metrics. It provides a visual representation of the trade-off between data complexity and model accuracy, allowing users to make informed decisions when selecting and fine-tuning models for information diffusion prediction tasks.
As for practical implications, understanding the performance characteristics of models in information diffusion prediction can help in various domains such as social network analysis, marketing campaigns, and epidemic modeling. Furthermore, the proposed holistic approach to model evaluation holds applicability across various domains and can serve as a valuable reference for researchers and practitioners in other machine learning application fields, aiding them in designing more accurate and reliable models and selecting models that are better suited for specific scenarios.
9.2 Limitations and future work
We acknowledge that this work only serves as an early step towards a more systematic and comprehensive evaluation of machine learning models. We choose a simple prediction task that relies only on the order of users in the spreading sequences, which allows us to exclude other confounding factors that can be utilized for prediction. In this way, the complexity of the prediction is equivalent to the randomness of the data, which is easier to measure and tune in sequence data. But in other prediction tasks, such as those in computer vision and natural language processing, the complexity of the prediction is hard to measure and adjust. The measure of the performance curve is an intriguing and challenging problem. The performance curve measured in this work also shows a network dependence. The network topology affects a model’s performance curve. It can be interesting to investigate the way to include the topological feature and reach a more “universal” performance curve that holds in different networks. Finally, we note that the scaling pattern only holds for certain parameter regions that are mostly considered in prediction tasks. In extreme cases, the prediction accuracy and data randomness may follow different relationships. Identifying the boundaries in which the proposed framework works can be an interesting problem for both theoretical and empirical studies.
Declaration of competing interest
The authors declare that they have no known competing financial interests or personal relationships that could have appeared to influence the work reported in this paper.
Data availability
Data will be made available on request.
Acknowledgments
This work is supported by the Chongqing Graduate Research and Innovation Project (No.CYB22128), the National Natural Science Foundation of China (NSFC) (No.62006198), the Industry-University-Research Innovation Fund for Chinese Universities (No.2021ALA03016), and the National Science Center, Poland (Grant No. 2021/41/B/HS6/02798).
Appendix A Supplementary experimental results
To enhance conciseness in the main text, we demonstrate certain experimental result figures in the appendix. We provide a detailed explanation of these results herein.
Fig. A1 shows the APCE-MAP and APCE-SMAP patterns of CDK model on the cascade sets generated by linear threshold model (LT) and susceptible-infectious model (SI). Compared to those on data sets generated by independent cascade model (IC) (Fig. 2ab in the main text), the experimental results are highly similar, indicating the scaling pattern proposed in this work is almost unaffected by the internal driven mechanism of the information spreading.
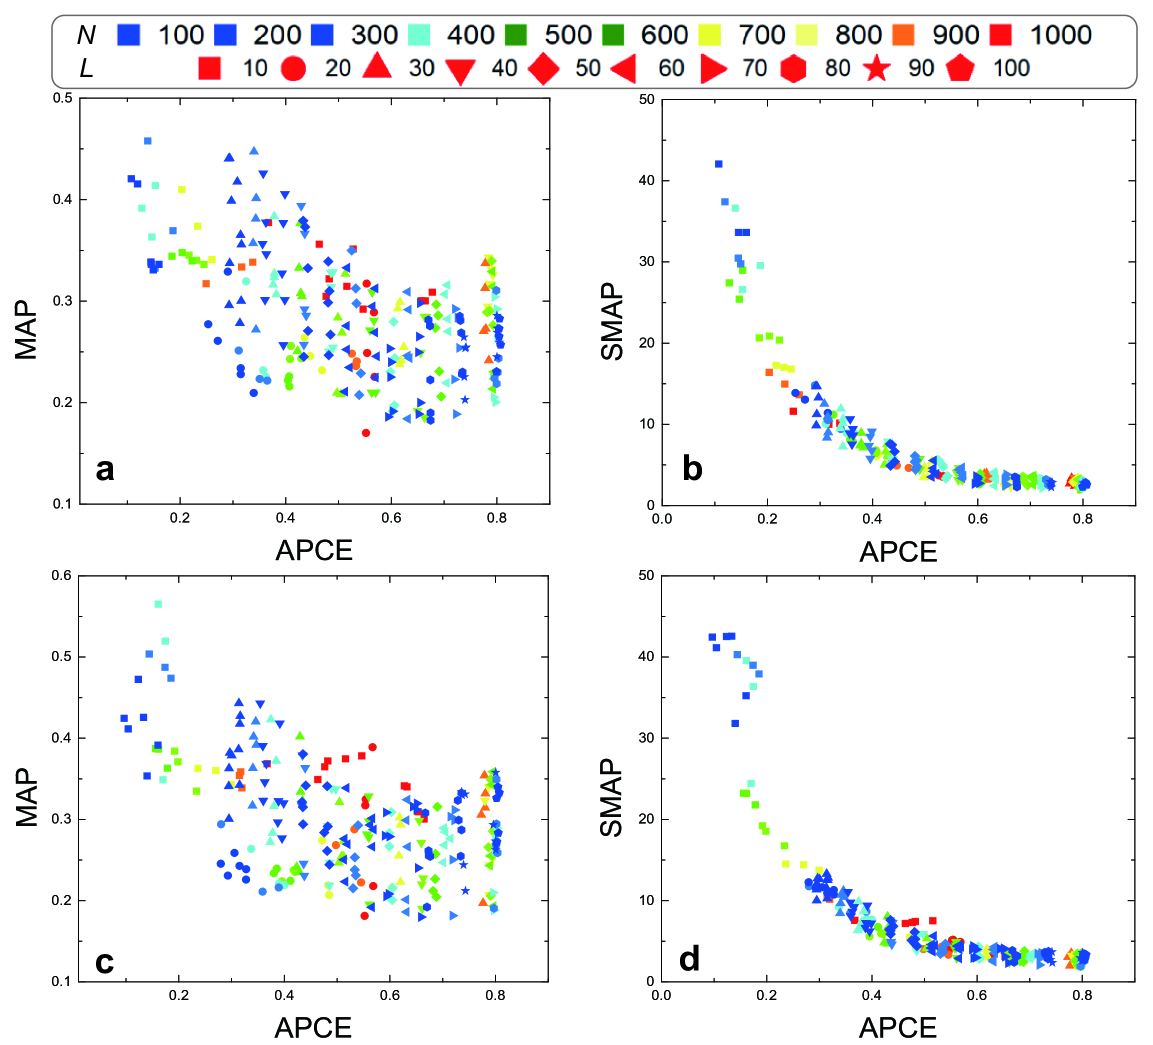
Fig. A2 shows the scaling patterns on BA scale-free network data set. The performance characteristic curves on these patterns exhibit a similar trend to the curves on the patterns on ER random network data set. However, different from changing the spreading mechanism, changing network topology could lead to a change in the model’s performance characteristic curve, which is still an exponential decay curve but with different parameters. It demonstrates the network topology could have a relatively greater impact on our model evaluation framework than the spreading mechanism.
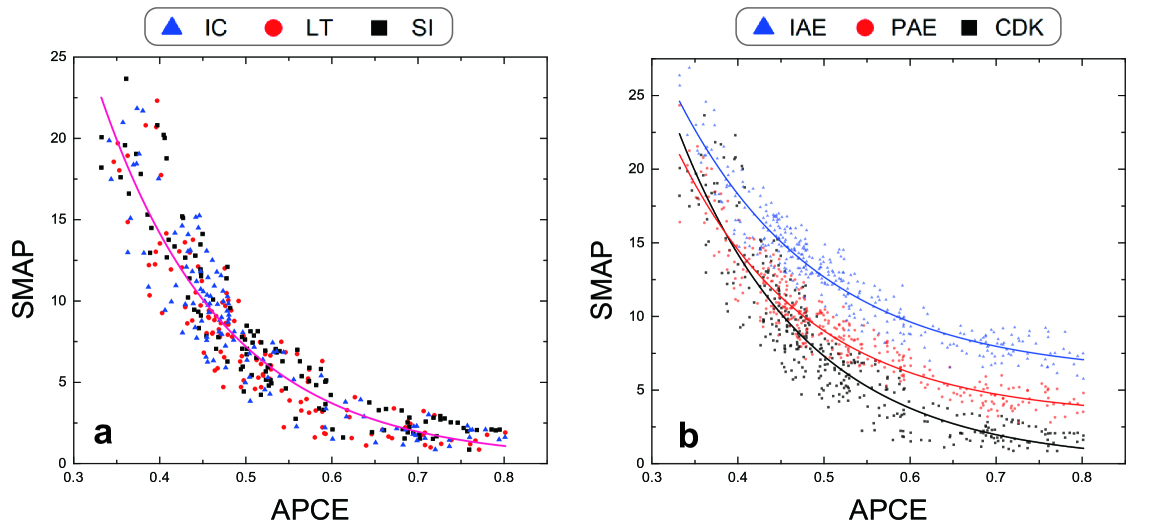
Fig. A3 shows the model evaluation results of CDK, PAE and IAE models on empirical data using the performance characteristic curves. In comparison to the results obtained on synthetic data, the results on empirical data exhibit greater randomness. Furthermore, due to the inherent characteristics of the three social media platforms in the empirical data, the prediction accuracy of the three models also varies across different data sets. However, overall, the comparative results of the models are consistent. In the majority of cases, the IAE model, which utilizes more embedding latent spaces, demonstrates the best prediction performance, aligning with the theoretical design principles of network-embedding-based prediction models. This validates the feasibility of the model evaluation approach based on the performance characteristic curve.
References
- Auxier and Anderson, (2021) Auxier, B. and Anderson, M. (2021). Social media use in 2021. Pew Research Center, 1:1–4.
- Barabási and Albert, (1999) Barabási, A.-L. and Albert, R. (1999). Emergence of scaling in random networks. science, 286(5439):509–512.
- Barzel and Barabási, (2013) Barzel, B. and Barabási, A.-L. (2013). Network link prediction by global silencing of indirect correlations. Nature biotechnology, 31(8):720–725.
- Bourigault et al., (2014) Bourigault, S., Lagnier, C., Lamprier, S., Denoyer, L., and Gallinari, P. (2014). Learning social network embeddings for predicting information diffusion. In Proceedings of the 7th ACM international conference on Web search and data mining, pages 393–402. ACM.
- Bourigault et al., (2016) Bourigault, S., Lamprier, S., and Gallinari, P. (2016). Representation learning for information diffusion through social networks: an embedded cascade model. In Proceedings of the 9th ACM international conference on Web Search and Data Mining, pages 573–582. ACM.
- Chen et al., (2016) Chen, W., Gao, Q., and Xiong, H. (2016). Temporal predictability of online behavior in foursquare. Entropy, 18(8):296.
- Cheng et al., (2014) Cheng, J., Adamic, L., Dow, P. A., Kleinberg, J. M., and Leskovec, J. (2014). Can cascades be predicted? In Proceedings of the 23rd international conference on World Wide Web, pages 925–936.
- Cheng et al., (2013) Cheng, S., Shen, H., Huang, J., Zhang, G., and Cheng, X. (2013). Staticgreedy: solving the scalability-accuracy dilemma in influence maximization. In Proceedings of the 22nd ACM international conference on Information & Knowledge Management, pages 509–518. ACM.
- Dupuis et al., (2020) Dupuis, D., du Mouza, C., Travers, N., and Chareyron, G. (2020). Real-time influence maximization in a rtb setting. Data Science and Engineering, pages 1–16.
- Erdős and Rényi, (1960) Erdős, P. and Rényi, A. (1960). On the evolution of random graphs. Publ. Math. Inst. Hung. Acad. Sci, 5(1):17–60.
- Feng and Wang, (2013) Feng, W. and Wang, J. (2013). Retweet or not? personalized tweet re-ranking. In Proceedings of the 6th ACM international conference on Web search and data mining, pages 577–586.
- Feng et al., (2020) Feng, X., Zhao, Q., Ma, J., and Jiang, G. (2020). On modeling and predicting popularity dynamics via integrating generative model and rich features. Knowledge-Based Systems, page 105786.
- Fennell et al., (2016) Fennell, P. G., Melnik, S., and Gleeson, J. P. (2016). Limitations of discrete-time approaches to continuous-time contagion dynamics. Physical Review E, 94(5):052125.
- Hethcote, (1989) Hethcote, H. W. (1989). Three basic epidemiological models. In Proceedings of Applied mathematical ecology, pages 119–144. Springer.
- Hethcote, (2000) Hethcote, H. W. (2000). The mathematics of infectious diseases. SIAM review, 42(4):599–653.
- Hodas and Lerman, (2014) Hodas, N. O. and Lerman, K. (2014). The simple rules of social contagion. Scientific reports, 4:4343.
- Hofman et al., (2017) Hofman, J. M., Sharma, A., and Watts, D. J. (2017). Prediction and explanation in social systems. Science, 355(6324):486–488.
- Hofman et al., (2021) Hofman, J. M., Watts, D. J., Athey, S., Garip, F., Griffiths, T. L., Kleinberg, J., Margetts, H., Mullainathan, S., Salganik, M. J., Vazire, S., et al. (2021). Integrating explanation and prediction in computational social science. Nature, 595(7866):181–188.
- Hogg and Lerman, (2012) Hogg, T. and Lerman, K. (2012). Social dynamics of digg. EPJ Data Science, 1(1):5.
- Jiménez-Montaño et al., (2002) Jiménez-Montaño, M. A., Ebeling, W., Pohl, T., and Rapp, P. E. (2002). Entropy and complexity of finite sequences as fluctuating quantities. Biosystems, 64(1-3):23–32.
- Joe, (1988) Joe, H. (1988). Majorization, entropy and paired comparisons. The Annals of Statistics, pages 915–925.
- Kempe et al., (2003) Kempe, D., Kleinberg, J., and Tardos, É. (2003). Maximizing the spread of influence through a social network. In Proceedings of the 9th ACM SIGKDD international conference on Knowledge discovery and data mining, pages 137–146. ACM.
- Krishnan et al., (2016) Krishnan, S., Butler, P., Tandon, R., Leskovec, J., and Ramakrishnan, N. (2016). Seeing the forest for the trees: new approaches to forecasting cascades. In Proceedings of the 8th ACM Conference on Web Science, pages 249–258.
- Kumar et al., (2022) Kumar, S., Mallik, A., Khetarpal, A., and Panda, B. (2022). Influence maximization in social networks using graph embedding and graph neural network. Information Sciences, 607:1617–1636.
- Lee et al., (2010) Lee, C., Kwak, H., Park, H., and Moon, S. (2010). Finding influentials based on the temporal order of information adoption in twitter. In Proceedings of the 19th international conference on World Wide Web, pages 1137–1138.
- Li et al., (2018) Li, C., Guo, X., and Mei, Q. (2018). Joint modeling of text and networks for cascade prediction. In Proceedings of the 12th International Conference on Web and Social Media, pages 640–643.
- Li et al., (2017) Li, D., Zhang, S., Sun, X., Zhou, H., Li, S., and Li, X. (2017). Modeling information diffusion over social networks for temporal dynamic prediction. IEEE Transactions on Knowledge and Data Engineering, 29(9):1985–1997.
- Li et al., (2022) Li, Z., Du, X., Zhao, Y., Tu, Y., Lev, B., and Gan, L. (2022). Lifecycle research of social media rumor refutation effectiveness based on machine learning and visualization technology. Information Processing & Management, 59(6):103077.
- Liu et al., (2016) Liu, W., Shen, H., Ouyang, W., Fu, G., Zha, L., and Cheng, X. (2016). Learning cost-effective social embedding for cascade prediction. In Proceedings of the Chinese National Conference on Social Media Processing, pages 1–13. Springer.
- Lu et al., (2013) Lu, X., Wetter, E., Bharti, N., Tatem, A. J., and Bengtsson, L. (2013). Approaching the limit of predictability in human mobility. Scientific Reports, 3(1):2923–2923.
- Lü et al., (2015) Lü, L., Pan, L., Zhou, T., Zhang, Y.-C., and Stanley, H. E. (2015). Toward link predictability of complex networks. Proceedings of the National Academy of Sciences of the United States of America, 112(8):2325–2330.
- Martin et al., (2016) Martin, T., Hofman, J. M., Sharma, A., Anderson, A., and Watts, D. J. (2016). Exploring limits to prediction in complex social systems. In Proceedings of the 25th international conference on World Wide Web, pages 683–694.
- Michalski et al., (2022) Michalski, R., Serwata, D., Nurek, M., Szymanski, B. K., Kazienko, P., and Jia, T. (2022). Temporal network epistemology: On reaching consensus in a real-world setting. Chaos: An Interdisciplinary Journal of Nonlinear Science, 32(6):063135.
- Moffat et al., (2007) Moffat, A., Webber, W., and Zobel, J. (2007). Strategic system comparisons via targeted relevance judgments. In Proceedings of the 30th annual international ACM SIGIR conference on Research and development in information retrieval, pages 375–382.
- Monclar et al., (2009) Monclar, R., Tecla, A., Oliveira, J., and de Souza, J. M. (2009). Mek: Using spatial–temporal information to improve social networks and knowledge dissemination. Information Sciences, 179(15):2524–2537.
- Ran et al., (2020) Ran, Y., Deng, X., Wang, X., and Jia, T. (2020). A generalized linear threshold model for an improved description of the spreading dynamics. Chaos: An Interdisciplinary Journal of Nonlinear Science, 30(8):083127.
- Raschka, (2018) Raschka, S. (2018). Model evaluation, model selection, and algorithm selection in machine learning. arXiv preprint arXiv:1811.12808.
- Riquelme and González-Cantergiani, (2016) Riquelme, F. and González-Cantergiani, P. (2016). Measuring user influence on twitter: A survey. Information processing & management, 52(5):949–975.
- Robertson, (2008) Robertson, S. (2008). A new interpretation of average precision. In Proceedings of the 31st annual international ACM SIGIR conference on Research and development in information retrieval, pages 689–690.
- Sanchez and Soyer, (1998) Sanchez, P. P. and Soyer, R. (1998). Information concepts and pairwise comparison matrices. Information processing letters, 68(4):185–188.
- Schelter et al., (2018) Schelter, S., Biessmann, F., Januschowski, T., Salinas, D., Seufert, S., and Szarvas, G. (2018). On challenges in machine learning model management. IEEE Data Engineering Bulletin, 41(4):5–15.
- Schmitt and Herzel, (1997) Schmitt, A. O. and Herzel, H. (1997). Estimating the entropy of dna sequences. Journal of theoretical biology, 188(3):369–377.
- Schürmann and Grassberger, (1996) Schürmann, T. and Grassberger, P. (1996). Entropy estimation of symbol sequences. Chaos: An Interdisciplinary Journal of Nonlinear Science, 6(3):414–427.
- Shannon, (1948) Shannon, C. E. (1948). A mathematical theory of communication. Bell system technical journal, 27(3):379–423.
- Shen et al., (2014) Shen, H., Wang, D., Song, C., and Barabási, A.-L. (2014). Modeling and predicting popularity dynamics via reinforced poisson processes. In Proceedings of the AAAI Conference on Artificial Intelligence, volume 28(1), pages 291–297.
- Sinatra and Szell, (2014) Sinatra, R. and Szell, M. (2014). Entropy and the predictability of online life. Entropy, 16(1):543–556.
- Solomon et al., (2000) Solomon, S., Weisbuch, G., de Arcangelis, L., Jan, N., and Stauffer, D. (2000). Social percolation models. Physica A: Statistical Mechanics and its Applications, 277(1-2):239–247.
- Song et al., (2010) Song, C., Qu, Z., Blumm, N., and Barabási, A. L. (2010). Limits of predictability in human mobility. Science, 327(5968):1018–1021.
- Stieglitz and Dang-Xuan, (2013) Stieglitz, S. and Dang-Xuan, L. (2013). Emotions and information diffusion in social media—sentiment of microblogs and sharing behavior. Journal of management information systems, 29(4):217–248.
- Sun et al., (2020) Sun, J., Feng, L., Xie, J., Ma, X., Wang, D., and Hu, Y. (2020). Revealing the predictability of intrinsic structure in complex networks. Nature communications, 11(1):1–10.
- Sun et al., (2023) Sun, X., Zhou, J., Liu, L., and Wei, W. (2023). Explicit time embedding based cascade attention network for information popularity prediction. Information Processing & Management, 60(3):103278.
- Suzuki et al., (2006) Suzuki, R., Buck, J. R., and Tyack, P. L. (2006). Information entropy of humpback whale songs. The Journal of the Acoustical Society of America, 119(3):1849–1866.
- Tu et al., (2022) Tu, H. T., Phan, T. T., and Nguyen, K. P. (2022). Modeling information diffusion in social networks with ordinary linear differential equations. Information Sciences, 593:614–636.
- Wang et al., (2017) Wang, J., Zheng, V. W., Liu, Z., and Chang, K. C.-C. (2017). Topological recurrent neural network for diffusion prediction. In Proceedings of the International Conference on Data Mining, pages 475–484. IEEE.
- Wang et al., (2022) Wang, Y., Wang, X., Ran, Y., Michalski, R., and Jia, T. (2022). Casseqgcn: Combining network structure and temporal sequence to predict information cascades. Expert Systems with Applications, page 117693.
- Watts, (2002) Watts, D. J. (2002). A simple model of global cascades on random networks. Proceedings of the National Academy of Sciences, 99(9):5766–5771.
- Wu et al., (2017) Wu, B., Cheng, W.-H., Zhang, Y., Huang, Q., Li, J., and Mei, T. (2017). Sequential prediction of social media popularity with deep temporal context networks. In Proceedings of the 26th International Joint Conference on Artificial Intelligence, pages 3062–3068.
- Xie et al., (2021) Xie, J., Meng, F., Sun, J., Ma, X., Yan, G., and Hu, Y. (2021). Detecting and modelling real percolation and phase transitions of information on social media. Nature Human Behaviour, 5(9):1161–1168.
- Xie et al., (2022) Xie, W., Wang, X., and Jia, T. (2022). Independent asymmetric embedding for information diffusion prediction on social networks. In Proceedings of the 25th International Conference on Computer Supported Cooperative Work in Design, pages 190–195. IEEE.
- Yijun et al., (2022) Yijun, R., Xiao-Ke, X., and Tao, J. (2022). The maximum capability of a topological feature in link prediction. arXiv preprint arXiv:2206.15101.
- Yin et al., (2017) Yin, L., Zheng, H., Bian, T., and Deng, Y. (2017). An evidential link prediction method and link predictability based on shannon entropy. Physica A-statistical Mechanics and Its Applications, 482:699–712.
- Zhan and Jia, (2022) Zhan, L. and Jia, T. (2022). Coarsas2hvec: Heterogeneous information network embedding with balanced network sampling. Entropy, 24(2):276.
- Zhang et al., (2022) Zhang, Y., Guo, B., Ding, Y., Liu, J., Qiu, C., Liu, S., and Yu, Z. (2022). Investigation of the determinants for misinformation correction effectiveness on social media during covid-19 pandemic. Information Processing & Management, 59(3):102935.
- Zhao et al., (2020) Zhao, Y., Yang, N., Lin, T., and Philip, S. Y. (2020). Deep collaborative embedding for information cascade prediction. Knowledge-Based Systems, 193:105502.
- Zhou et al., (2021) Zhou, F., Xu, X., Trajcevski, G., and Zhang, K. (2021). A survey of information cascade analysis: Models, predictions, and recent advances. ACM Computing Surveys (CSUR), 54(2):1–36.
- Zhu et al., (2021) Zhu, D., Dai, X.-Y., Chen, J., and Yin, J. (2021). Sampling informative context nodes for network embedding. Science China Information Sciences, 64(11):1–11.