Charting the Realms of Mesoscale Cloud Organisation using Unsupervised Learning
Abstract
Quantifying the driving mechanisms and effect on Earth’s energy budget, of mesoscale shallow cloud organisation, remains difficult. Partly because quantifying the atmosphere’s organisational state through objective means remains challenging. We present the first map of the full continuum of convective organisation states by extracting the manifold within an unsupervised neural networks’s internal representation. On the manifold distinct organisational regimes, defined in prior work, sit as waymarkers in this continuum. Composition of reanalysis and observations onto the manifold, shows wind-speed and water vapour concentration as key environmental characteristics varying with organisation. We show, for the first time, that mesoscale shallow cloud organisation produces variations in albedo in addition to variations from cloud-fraction changes alone111In the final stages of preparing this manuscript we became aware of independent, related work by Alinaghi \BOthers. (\APACyear2023). We further demonstrate how the manifold’s continuum representation captures the temporal evolution of organisation. By enabling study of states and transitions in organisation (in simulations and observations) the presented technique paves the way for better representation of shallow clouds in simulations of Earth’s future climate.
date06092012
Danish Meteorological Institute, Copenhagen, DK University of Leeds, UK
Leif Denbylcd@dmi.dk, l.c.denby@leeds.ac.uk
The internal representation of an unsupervised neural network forms a map of all possible states of trade wind shallow cloud organisation
Mesoscale organisation does affect shortwave albedo even when correcting for changes in cloud-fraction
The temporal evolution of organisation is captured through the continuum representation of the cloud organisation map
1 Introduction
From satellite imagery of Earth it is immediately clear that clouds often organise into spatial patterns. Names have been given to the most prominent patterns we recognise (e.g. fronts, cyclones, cellular cloud-decks, etc) and we use this classification to study the impacts of clouds on Earth’s weather and climate through their precipitation and interaction with radiation and atmospheric circulation.
One particular form of clouds, shallow tradewind cumuli, have a profound importance in Earth’s climate system due to their ubiquity and net cooling effect, stemming from these clouds reflecting more incoming short-wave radiation from the sun compared to the outgoing long-wave radiation they permit (Bony \BOthers., \APACyear2004). Differing predictions of how these clouds will respond to a warming climate accounts for most of the variation in climate sensitivity between climate models (Bony \BBA Dufresne (\APACyear2005), Webb \BOthers. (\APACyear2006), Medeiros \BOthers. (\APACyear2008), Vial \BOthers. (\APACyear2013)), which highlights the urgent need to better understand how these clouds form and interact with their environment (one of the World Climate Research Programme’s Grand Science Challenges, Bony \BOthers. (\APACyear2015)).
One particular aspect of shallow convective clouds that is still poorly understood, is their mesoscale organisation, both in quantifying what regimes occur, the driving mechanisms behind them and extent to which mesoscale cloud organisation impacts Earth’s climate. This interest in convective organisation stems from the observation that in high-resolution (Large Eddy) simulations, clouds cluster (self-aggregate) under certain conditions (Wing \BOthers., \APACyear2018; Muller \BOthers., \APACyear2022), which results in a change in cloud-fraction and net radiation for the same domain-mean state. Given the necessarily coarse resolution of climate models ()), neither the processes driving organisation nor the organisational regimes can be explicitly resolved and so the behaviour of these shallow clouds (and their radiative impact) must be parameterised.
In the context of the EUREC4A field campaign (Stevens \BOthers., \APACyear2021) work by Stevens \BOthers. (\APACyear2019) [S19] developed a set of four classifications for shallow cloud organisation by manual examination of visual satellite imagery. These classes were motivated by the physical processes expected important in different regimes, and have since formed the framing for many studies investigating the conditions under which different forms of organisation occur, both in observations (Bony \BOthers., \APACyear2020; Schulz \BOthers., \APACyear2021) [B21, S21] and in simulations (Dauhut \BOthers., \APACyear2023), with particular focus on the transition from small to larger isolated detraining shallow clouds (Narenpitak \BOthers., \APACyear2021\APACexlab\BCnt1; Saffin \BOthers., \APACyear2023\APACexlab\BCnt1).
An alternative approach was taken by Denby (\APACyear2020) [D20] who developed an unsupervised machine learning approach to autonomously discover the possible states of mesoscale organisation without imposing specific classes. This approach of unsupervised learning was also taken by Kurihana, Foster\BCBL \BOthers. (\APACyear2022); Kurihana, Moyer, Willett\BCBL \BOthers. (\APACyear2022); Kurihana, Moyer\BCBL \BBA Foster (\APACyear2022) using clustering to produce individual classes of cloud patterns. Differently again, Janssens \BOthers. (\APACyear2021) [J21] utilised the framework of traditional metrics used for measuring clouds and their organisation (rather imposing specific classes), concluding that rather than occurring in isolated regimes, cloud organisation exists in a continuum (at least when viewed through these metrics).
By building on D20 we demonstrate in this work how the continuum of convective organisation states is captured as an emergent property of the internal embedding space representation learnt by a neural network through unsupervised learning. Specifically, we will extract the low-dimensional manifold within the high-dimensional embedding space on which all possible states of convective organisation lie, and explore this manifold through the metrics and classes of [J21] and [S19]. Through composition of reanalysis and observations onto this manifold we characterise environmental conditions vary with convective organisation, we quantify the effect of organisation on radiation correcting for changes in cloud-fraction, and further demonstrate how transitions between organisational states can be studied with the manifold.
2 Methods
The primary tool used in this work is a convolutional neural network which takes as input a 2D image-tile containing cloud imagery (derived here from satellite observations) and produces a point in a high-dimensional embedding space (here 100-dimensional, as in [D20]), a so-called embedding vector. During training the neural network has learnt to place tiles with similar cloud structures nearby in the embedding space. This is achieved by training the network on contrastive tile triplets of similar and dissimilar cloud-patterns (produced by sampling from satellite imagery both spatially closely-overlapping anchor-neighbor and randomly distributed distant tiles).
The image-tiles utilised here were generated by performing locally planar projections of observations from the geostationary GOES-16 satellite to produce pixel input tiles spanning . In extension to D20’s use of truecolor RGB-composite tiles, we here also generate a set of tiles using the three water-vapour window infrared channels (11, 14 & 15) and train a separate IR-tiles model. This enables characterisation of convective organisation throughout the diurnal cycle (including nighttime), enabling analysis of cloud evolution over multiple days (see subsection 3.4).
We use the Level-2 1-hourly CERES radiation products derived from the GOES-16 geostationary satellite (NASA/LARC/SD/ASDC, \APACyear2018) 222NASA/LARC/SD/ASDC (\APACyear2017) produces similar but smaller albedo variations due to its coarser resolution. Environmental characteristics associated with different states of organisation were extracted by resampling ERA5 reanalysis (Hersbach \BOthers., \APACyear2020) onto the dataset tiles. For cloud-fraction and cloud metric calculations (Denby \BBA Janssens, \APACyear2022) we use the shallow cloud-mask as defined by Bony \BOthers. (\APACyear2020), thresholding on GOES-16 channel 13 () brightness temperature (). To aid comparison with prior work we have chosen to restrict our analysis to tiles with minimum cloud top-temperature above freezing level .
3 Results
3.1 The manifold of mesoscale cloud organisation
In this section we will demonstrate how the continuum of cloud organisation states can be extracted as an emergent property of the embedding space utilised by a trained neural network. We do this by examining the topological structure of the embeddings produced by the neural network applied to a dataset of 10,000 triplet tiles.
As the neural network has learnt during training to place similar cloud structures close in the embedding space, the occurrence of evolution between organisation states will manifest as a continuum of points in the embedding space (assuming a dataset large enough to contain the in-between states). The extent to which this point-cloud maps out either isolated regions, clusters connected by isolated paths, or full manifolds of smooth evolution, tells us not only what kinds of regimes exist, but also how distinct they are and what transitions between regimes are actually observed in nature. Prior work by [S19] suggests that organisation in the tropical Atlantic comes in four distinct forms, which would manifest as the embeddings lying in four isolated clusters. However, clustering analysis shows no evidence of isolated clusters in the embedding space. Indeed, should we expect the atmosphere to gravitate to only few distinct forms of cloud organisation? If the atmosphere is constantly evolving between different forms of organisation, why would it stay ”stuck” in specific isolated regimes of organisation rather than spending as much time transitioning between regimes? Since attempts to find isolated clusters failed, we moved to techniques which are able to maintain the continuum representation that embedding vectors of organisation provide. By applying manifold extraction techniques to the embedding space we found that the tile embeddings do indeed appear to lie on a low-dimensional manifold within the high-dimensional embedding space.
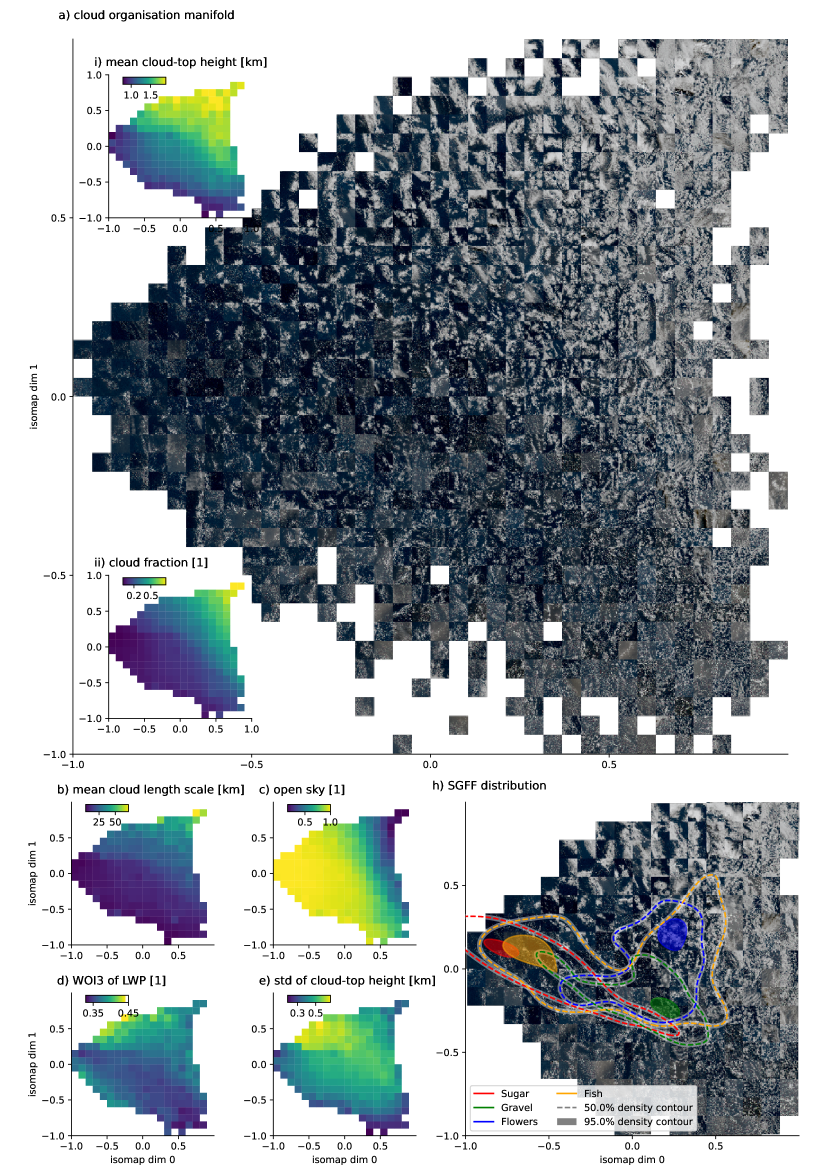
We applied the Isomap manifold extraction method (Tenenbaum \BOthers., \APACyear2000) to transform the 100D embedding-vector point cloud into a 2D plane, the result of which is visualised in Figure 1 by rendering tiles for individual points across the manifold. Isomap was selected because it through construction of a nearest-neighbour graph through the entire tile embedding point-cloud, ensures that the topology of the manifold is unchanged (i.e. does not introduce or remove new paths between points). The manifold extraction allows us to perform dimensionality reduction of the embedding space, by extracting only the part of the embedding space that the neural network has actually utilised. Using a manifold extraction method, rather than for example Principal Component Analysis (PCA), avoids assuming that the embedding points lie on a high-dimensional plane since Isomap follows the curvature of the manifold spanned by the tile embedding points.
To visualise the embedding manifold we select the closest anchor-neighbor pair for each fixed-width bin across the embedding manifold, and render the anchor tile from that pair. This produces tiles with a clearly discernable pattern by exploiting that where the trained neural network is unable to place two anchor-neighbor tiles in close proximity (in the embedding space), this suggests that either a) these tiles are very different in the cloud structures present (unlikely given the spatial overlap of anchor-neighbor tiles) or b) it is not possible for the neural network to characterise the organisational state of these two tiles and so these tiles are not in a clearly descernable organisational state. Conversely, closely-spaced anchor-neighbor tiles are not only similar, but in an organisational state clearly identifiable by the trained neural network.
We can by eye immediately identify differences in the morphological features of clouds in different parts of the manifold, with smaller isolated clouds concentrated in the lower left, larger isolated clouds in the upper corner and the bottom right populated by cellular cloud structures (cloud-size and cloud-fraction Figure 1 insets i and ii respectively). Having produced this 2D ”map” of cloud organisation through extraction of the underlying manifold utilised by the neural network, we next to turn to examining the organisational states spanned within this manifold, both in terms of contemporary means of cloud metrics and organisation classes identified by J21 and S19 respectively, and later through quantifying the environmental conditions associated with different forms of organisation with and radiation effects of organisation.
This is done by aggregating observations and reanalysis datasets (coincident in time and space with the sampled tiles) onto the 2D manifold by binning each physical variable in turn by the 2D manifold dimensions.
3.1.1 Cloud-metrics on manifold
We next set the extracted manifold in a more familiar context by computing the set of four cloud property metrics identified by J21 as collectively being able to describe the majority of variation between organisational regimes: b) the cloud length-scale (), c) open-sky amount (, Antonissen, \APACyear2019), d) directional anisotropy () of liquid water path (, Brune \BOthers., \APACyear2021) and e) standard deviation of cloud-top height (). The variation of these metrics across the embedding manifold is shown in the respective subfigures of Figure 1, which depict the mean value for each variable across all tiles falling within a given bin in on 2D manifold.
Visually, it is immediately clear that using just these metrics there are many ways to split up the embedding manifold into regions of similar characteristics, with both smooth and abrupt changes in the cloud property metrics across the manifold. As cloud-size is a very familiar characteristic that relates to how a cloud was formed and the radiative impact it has, we will concentrate on separately examining the large regions of the manifold where the characteristic cloud-size remains near-constant. For the very smallest clouds ( in Figure 1) the principal variation is the decrease in the characteristic open-sky amount (Figure 1) with increasing cloud-top height (Figure 1 inset i) (and lesser increase in cloud-fraction, Figure 1 inset ii), which describes the transition from scattered isolated clouds (left in the manifold) to more cellular (cold-pool arc) cloud formations (bottom right of the manifold). The largest clouds () are found in more varied configurations; specifically, with either a) very variable cloud-top height (Figure 1), intermediate cloud-fraction and large regions of open-sky (the large isolated clouds in the top left of the manifold), but also situations b) with less variation in cloud-top height and lower cloud-fraction (the top right of the manifold).
It is worth pausing here to consider how a 2D plane appears to be adequate to map all regimes of the shallow cumulus organisation when J21 showed that a full set off four metrics are needed. We, conjecture that this is principally because J21 used PCA and so explicitly assumed that variations in mesoscale organisation can be described by a set of linear basis defined by the metrics used. However, as noted by J21 it is not clear that the linear decomposition is physically meaningful for cloud organisation, evidenced by the metrics not being linearly separable. Said differently, it is quite possible that the full set of four metrics are only required to distinguish a subset of organisational states and for other regimes the metrics actually covary. We see this behaviour in our analysis as the first two metrics ( and ) show an unidirectional gradient across the entire embedding manifold, whereas the last two metrics, and (Figure 1 and 1) primarily vary within smaller regions where the first two metrics are near-constant.
The extent to which the space of possible organisational states is indeed inherently two-dimensional, will be investigated using topological analysis tools in future work. However, through the compositing cloud and environment characteristics (the latter in subsection 3.2) on the 2D embedding manifold we do find physically meaningful interpretations of variability observed and so we expect that to leading order the 2D manifold here is a useful tool to understanding what kinds of organisation form and why they form.
3.1.2 Finding Sugar, Fish, Flowers and Gravel
We next turn to examining the extent to which the convective organisation classes (Sugar, Gravel, Fish and Flowers) described by B19 appear as distinct regions on the embedding manifold, examining whether the self-supervised neural network has ”discovered” these manually defined classes of organisation. This is done by producing embeddings with the trained neural network at the same locations which have been manually labelled as belonging to one of the four classes and, for each of the four classes in turn, plotting the distribution of these embeddings over the manifold (see Figure 1), thereby showing where the trained neural network would place a tile with a given manual classification. The manually-labelled dataset produced for the EUREC4A field campaign Stevens \BOthers. (\APACyear2021) by Schulz (\APACyear2022) which gives at resolution for 1/7/2020 to 2/3/2022 in the tropical Atlantic the number of people labelling a given location in the four classes. As Schulz (\APACyear2022) any location with over agreement in labelling is designated as belonging to a specific class. The per-class distribution is visualised by the density contour (showing the spread) and then density contour (containing the peak) computed using Kernel Density Estimation (KDE).
The distribution of tiles labelled as Sugar, Gravel and Flowers peak in distinct regions of the embedding manifold suggesting these three classes of organisation have distinctive characteristics identifiable using unsupervised learning (in contrast to Fish, discussed below). The spatial regions labelled Sugar are concentrated in the region of the embedding space where scattered isolated cumuli with low vertical extent are concentrated, Gravel is associated with (often multi-) cellular cloud structures formed by cold-pool arcs, and Flowers in the region of larger, deeper isolated cumuli, all in agreement with B19.
However, although the distributions of these three classes peak in isolated regions in embedding manifold, they also show a broad and varying overlap between organisation classes. The Sugar class appears the most separated from the rest, fitting with it being the archetypical organisation comprising randomly scattered small shallow cumuli. Gravel organisation extends into the region of Sugar, fitting with Gravel being characterised by cloud-free voids (driven by cold-pools) within regions if shallow scattered cumuli. For tiles labelled as Flower organisation, the distribution extends to encompass the peak of the Gravel cloud distribution, which is consistent with these larger isolated clouds in some cases being associated with cold-pool arcs (Cui \BOthers., \APACyear2023). Finally, we consider the distribution of tile samples from regions labelled as Fish which is concentrated in same part of the embedding manifold as the Sugar class and extends to include all three of the other classes. We conjecture that this is due to the large characteristic length-scale of Fish organisation (visually often O()). Specifically, on the length-scale of tile-size used in this work it appears that Fish organisation is comprised from smaller patterns of mesoscale organisation rather than being distinct.
As mentioned above, the overlaps in the distribution across the embedding manifold of regions manually labelled as belonging to separate kinds of organisation can to some degree be explained by the fact that some kinds of mesoscale cloud structures could be expected to occur together based on physical mechanisms expected to be associated with their formation. The isolated nature of the peaks of the manifold distribution of the three Sugar, Gravel and Flower classes above supports findings of (Stevens \BOthers., \APACyear2019) that these kinds of organisation have distinct characteristics. However, looking across all tiles these same classes do not show up as isolated distributions across the embedding manifold. Said another way, these three classes of organisation should be considered as useful waymarkers in the full continuous state-space of mesoscale convective organisation, rather than defining the only distinct kinds of organisation to which most kinds of shallow cumulus cloud formations belong.
3.2 Environmental characteristics of mesoscale organisation
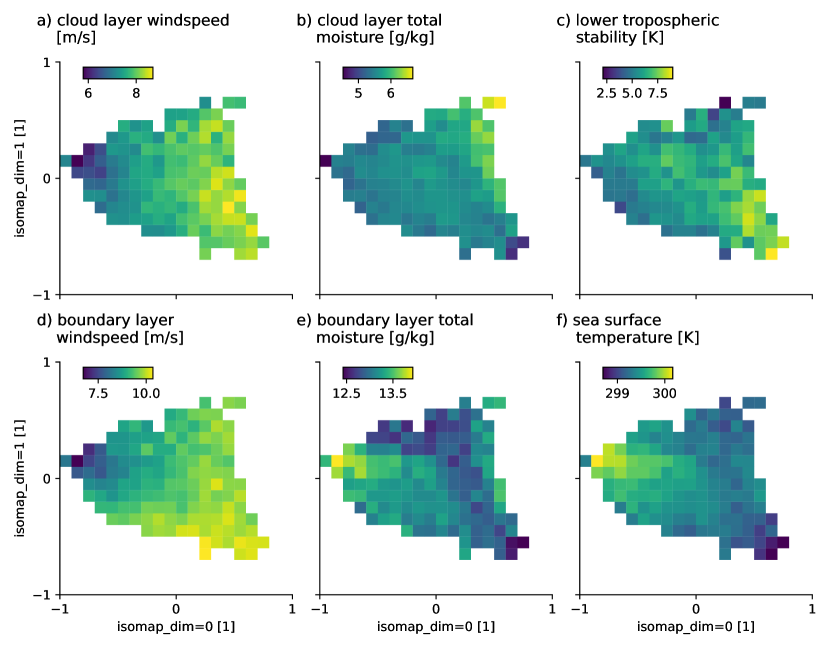
Next we will examine how the environment varies with different forms of organisation by compositing ERA5 reanalysis on the embedding manifold. Across the manifold we will quantify how organisation varies with environmental characteristics (Figure 2) and contrast these relationships with findings in prior work.
In agreement with B21 and S21, in conditions with the lowest wind-speeds (Figure 2 and 2) and relatively warm sea-surface temperatures (Figure 2), we find the archetypical scattered shallow cumuli and in conditions with lowest sea-surface temperature and highest wind-speeds, the shallow more cellular cloud structures formed by evaporation-driven cold-pools (these forms of organisation are also called Sugar and Gravel, see subsubsection 3.1.2). Contrasting the manifold regions with the smallest (and shallowest, ) and largest (and deepest, ) isolated clouds we find that the environmental factor which most clearly differentiates these regions to be sub-cloud and cloud-level moisture (Figure 2 and 2), with higher cloud-level and lower sub-cloud moisture in the latter case. In fact, the moisture and wind-speed appear nearly orthogonal in their variation across the embedding manifold, so that for contours of fixed moisture, the wind-speed uniquely defines a location on the manifold and thus the kind of organisation typically associated with these conditions. In contrast to B21 and S21, we do not find the strongest stability conditions (Figure 2) to be associated with large and deep isolated clouds, but rather with the strongest degree of cellular organisation.
3.3 Radiative impact of mesoscale organisation
The principal reason for being interested in convective organisation is the possible impact of organisation of shallow convective clouds on Earth’s radiation budget. Using the four classes of organisation by S19, B21 concluded that ”for a given low-cloud amount [we] did not find a significant effect of cloud organisation on the shortwave albedo.” From B21 it is clear that to leading-order that mesocale albedo is controlled by cloud-fraction, however, as the four regimes of organisation studied show little overlap in cloud-fraction, we wonder strong the effect of organisation is for a given cloud-fraction and so attempt to separate the effect of cloud-fraction and organisation on albedo.
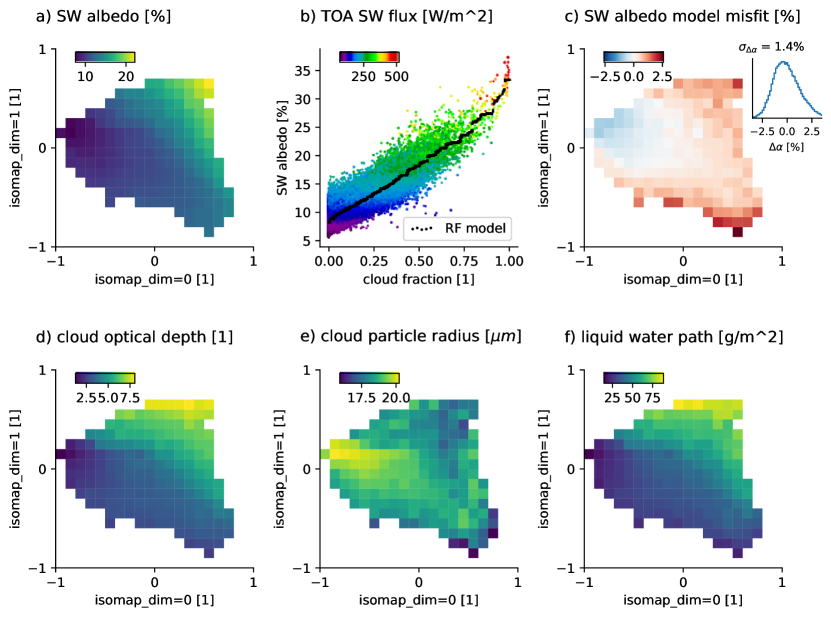
We do this by first fitting a simple model (a random forest, in effect an optimal-binning algorithm producing step-wise predictions) to predict the tile-mean shortwave albedo (Figure 3) from the tile cloud-fraction. The result of this fit can be seen in Figure 3) and shows the same monotonic increase in albedo with cloud-fraction as B21. The figure also highlights the significant spread in albedo for a given cloud-fraction. We next plot the mean error of this simple model across the embedding manifold (Figure 3), thereby getting a direct visualisation of the extent to which organisation alone affects albedo. In contrast to B21, we do find that organisation effects the shortwave albedo besides through the change of cloud-fraction, with the model albedo miss-fit of .
To set the effect of organisation on radiation in context we have included in Figure 3, 3 and 3, the mean optical depth, cloud particle radius and liquid water path respectively. Organisation dominated by small scattered cumuli has an anomalously low albedo (compared to what would be predicted from cloud-fraction alone) appearing to result from low cloud optical depth, which in turn results from larger drops and lower total amount of liquid water than other states of organisation across the manifold. In contrast, regimes with higher albedo generally have smaller droplets and higher liquid water path (in cellular organisation) or very small droplets and high liquid water path (large isolated cumuli).
The assumption that cloud organisation only effects the amount of reflected shortwave through changes in cloud-fraction, is in effect assuming that all shallow convective cloudy pixels have the same albedo and the only important factor is how many pixels contain cloud. We have shown here that properties of the cloudy pixels do indeed effect albedo, and the connection between mesoscale organisation and reflected shortwave radiation is more than just cloud-fraction. To fully unpick the role of cloud-properties changing with organisation, further work should be done with in-situ observations and modelling studies to compliment the remote-sensing retrievals used here.
3.4 Mapping the temporal evolution of organisation
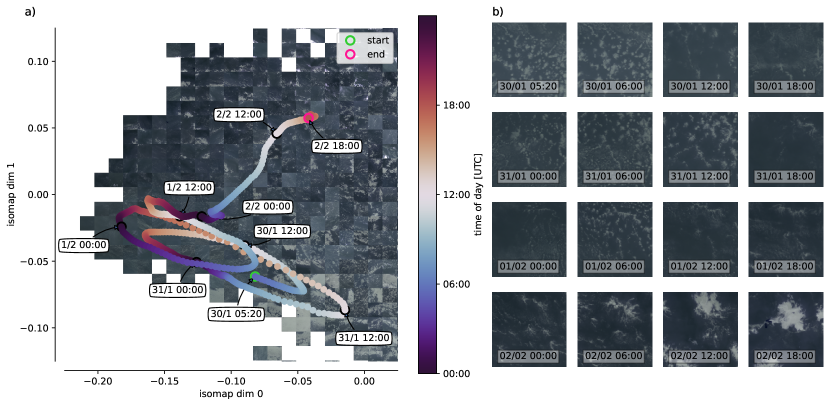
In the final use of the embedding manifold we demonstrate how it can be used to study the temporal evolution of cloud organisation. By applying the trained neural network on tiles sampled along a trajectory that follow clouds as they evolve, we can map out transitions between organisational states and thereby investigate the drivers behind these transitions. We use a 4-day trajectory (created with lagtraj, Denby \BBA Boeing, \APACyear2022), which follows a cloud-layer airmass across the Atlantic as organisation develops from initial isolated scattered cumuli (Sugar) into larger isolated cumuli (Flowers) (August 2nd 2020, studied by Saffin \BOthers., \APACyear2023\APACexlab\BCnt2; Narenpitak \BOthers., \APACyear2021\APACexlab\BCnt2). Tiles along the trajectory (examples in Figure 4) are then mapped onto the embedding manifold (Figure 4). The evolution on the manifold clearly shows, as is also indicated by the tile samples shown, that over the first three days organisation exhibits diurnal cycling that is eventually broken overnight ending in a drastically different regime on February 2nd. In future work this form of manifold trajectory analysis will be used to unpick the mechanisms behind this bifurcation behaviour.
4 Conclusions
In this work we have demonstrated that a map of all possible states of mesoscale organisation exists as an emergent property of the internal embedding space used by an unsupervised neural network, trained to group tiles of similar cloud patterns together.
Examining this embedding manifold map we find that across the manifold the visual variation in cloud patterns matches values of traditional metrics used to measure clouds. Although we find that traditional metrics used for measuring organisation are able to capture the continuum of organisation variation, their varying co-linearity may make them challenging to use in isolation to understand processes of mesoscale organisation. We find that the unsupervised neural network ”rediscovers” three (Sugar, Flowers and Gravel) of the four classes of organisation defined by Stevens \BOthers. (\APACyear2019), demonstrated by well-separated peaks in their manifold distribution. However, rather than appearing as isolated regions, these classes appear as useful waymarkers in the full map of cloud organisation produced in this work. By compositing ERA5 reanalysis onto the embedding manifold we find broad agreement with prior work in stronger winds and lower sea-surface temperature being associated with more cellular organisation. However, we also find that the larger isolated clouds are principally found in conditions with high cloud-level and low sub-cloud moisture (rather than lower tropospheric stability being key). Using the continuum representation of organisation we are able to show that cloud organisation does affect shortwave albedo beyond simply controlling cloud-fraction. We find that, as expected, this is primarily due to changes in the optical depth, the drivers of which can now be examined using the manifold of organisation. And finally, we have demonstrated how the ability to represent and measure the continuum of organisation allows for the study of how convective organisation develops; examining the evolution of Sugar (scattered small cumuli) to Flowers (larger isolated cumuli) and capturing the breakaway from diurnal cycling in organisation.
With the urgency of increased capacity to model Earth’s future climate, this novel technique to produce a map of all states of convective organisationa provides a new avenue for how to understand the processes of cloud organisation, both in models and observations, and paves the way for better representation in simulations of Earth’s climate.
Acknowledgements.
The author acknowledges funding from the Paracon GENESIS (NERC NE/N013840/1) and EUREC4A-UK (NERC NE/S015868/1) projects. GOES-16 data is available on the Amazon Open Data Registry at https://registry.opendata.aws/noaa-goes/. The Synoptic Radiative Fluxes and Clouds data sets (SYN1deg-1Hour_Terra-Aqua, Edition 4A, https://doi.org/10.5067/TERRA+AQUA/CERES/SYN1DEG-1HOUR_L3.004A and CER_GEO_Ed4_GOE16_NH_V01.2 https://doi.org/10.5067/GOES16/CERES/GEO_ED4_NH_V01.2) are made available by the NASA CERES group.References
- Alinaghi \BOthers. (\APACyear2023) \APACinsertmetastaralinaghi2023shallow{APACrefauthors}Alinaghi, P., Janssens, M., Choudhury, G., Goren, T., Siebesma, A\BPBIP.\BCBL \BBA Glassmeier, F. \APACrefYearMonthDay2023. \APACrefbtitleShallow Cumulus Cloud Fields Are Optically Thicker When They Are More Clustered. Shallow cumulus cloud fields are optically thicker when they are more clustered. {APACrefDOI} https://doi.org/10.48550/arXiv.2309.08346 \PrintBackRefs\CurrentBib
-
Antonissen (\APACyear2019)
\APACinsertmetastarAntonissen2019{APACrefauthors}Antonissen, C.
\APACrefYear2019.
\APACrefbtitleOrganization of Cumulus Convection over (sub) tropical
oceans Organization of Cumulus Convection over (sub) tropical oceans \APACtypeAddressSchool\BPhD.
{APACrefURL}
https://repository.tudelft.nl/islandora/object/uuid{
%}3Ad868273a-b028-4273-8380-ff1628ecabd5 \PrintBackRefs\CurrentBib - Bony \BBA Dufresne (\APACyear2005) \APACinsertmetastarBonyDufresne2005{APACrefauthors}Bony, S.\BCBT \BBA Dufresne, J\BPBIL. \APACrefYearMonthDay2005. \BBOQ\APACrefatitleMarine boundary layer clouds at the heart of tropical cloud feedback uncertainties in climate models Marine boundary layer clouds at the heart of tropical cloud feedback uncertainties in climate models.\BBCQ \APACjournalVolNumPagesGeophysical Research Letters32201–4. {APACrefDOI} 10.1029/2005GL023851 \PrintBackRefs\CurrentBib
- Bony \BOthers. (\APACyear2004) \APACinsertmetastarBony2004{APACrefauthors}Bony, S., Dufresne, J\BPBIL., Le Treut, H., Morcrette, J\BPBIJ.\BCBL \BBA Senior, C. \APACrefYearMonthDay2004. \BBOQ\APACrefatitleOn dynamic and thermodynamic components of cloud changes On dynamic and thermodynamic components of cloud changes.\BBCQ \APACjournalVolNumPagesClimate Dynamics222-371–86. {APACrefDOI} 10.1007/s00382-003-0369-6 \PrintBackRefs\CurrentBib
- Bony \BOthers. (\APACyear2020) \APACinsertmetastarbony2020sugar{APACrefauthors}Bony, S., Schulz, H., Vial, J.\BCBL \BBA Stevens, B. \APACrefYearMonthDay2020. \BBOQ\APACrefatitleSugar, gravel, fish, and flowers: Dependence of mesoscale patterns of trade-wind clouds on environmental conditions Sugar, gravel, fish, and flowers: Dependence of mesoscale patterns of trade-wind clouds on environmental conditions.\BBCQ \APACjournalVolNumPagesGeophysical research letters477e2019GL085988. \PrintBackRefs\CurrentBib
- Bony \BOthers. (\APACyear2015) \APACinsertmetastarBony2015{APACrefauthors}Bony, S., Stevens, B., Frierson, D\BPBIM\BPBIW., Jakob, C., Kageyama, M., Pincus, R.\BDBLWebb, M\BPBIJ. \APACrefYearMonthDay2015. \BBOQ\APACrefatitleClouds, circulation and climate sensitivity Clouds, circulation and climate sensitivity.\BBCQ \APACjournalVolNumPagesNature Geoscience84261–268. {APACrefURL} http://dx.doi.org/10.1038/ngeo2398 {APACrefDOI} 10.1038/ngeo2398 \PrintBackRefs\CurrentBib
- Brune \BOthers. (\APACyear2021) \APACinsertmetastarBrune2021{APACrefauthors}Brune, S., Buschow, S.\BCBL \BBA Friederichs, P. \APACrefYearMonthDay2021. \BBOQ\APACrefatitleThe local wavelet-based organization index – Quantification, localization and classification of convective organization from radar and satellite data The local wavelet-based organization index – Quantification, localization and classification of convective organization from radar and satellite data.\BBCQ \APACjournalVolNumPagesQuarterly Journal of the Royal Meteorological Society1477361853–1872. {APACrefDOI} 10.1002/qj.3998 \PrintBackRefs\CurrentBib
- Cui \BOthers. (\APACyear2023) \APACinsertmetastarCui2023{APACrefauthors}Cui, Z., Blyth, A., Burton, R., Bony, S., Böing, S., Gadian, A.\BCBL \BBA Danby, L. \APACrefYearMonthDay2023. \BBOQ\APACrefatitleLife cycle of a flower cloud system during the EUREC4A field campaign Life cycle of a flower cloud system during the eurec4a field campaign.\BBCQ \APACjournalVolNumPagesEGUsphere20231–24. {APACrefURL} https://egusphere.copernicus.org/preprints/2023/egusphere-2023-1999/ {APACrefDOI} 10.5194/egusphere-2023-1999 \PrintBackRefs\CurrentBib
- Dauhut \BOthers. (\APACyear2023) \APACinsertmetastarDauhut2023{APACrefauthors}Dauhut, T., Couvreux, F., Bouniol, D., Beucher, F., Volkmer, L., Pörtge, V.\BDBLWirth, M. \APACrefYearMonthDay2023. \BBOQ\APACrefatitleFlower trade-wind clouds are shallow mesoscale convective systems Flower trade-wind clouds are shallow mesoscale convective systems.\BBCQ \APACjournalVolNumPagesQuarterly Journal of the Royal Meteorological Society149750325-347. {APACrefURL} https://rmets.onlinelibrary.wiley.com/doi/abs/10.1002/qj.4409 {APACrefDOI} https://doi.org/10.1002/qj.4409 \PrintBackRefs\CurrentBib
- Denby (\APACyear2020) \APACinsertmetastarDenby2020{APACrefauthors}Denby, L. \APACrefYearMonthDay2020jan. \BBOQ\APACrefatitleDiscovering the Importance of Mesoscale Cloud Organization Through Unsupervised Classification Discovering the Importance of Mesoscale Cloud Organization Through Unsupervised Classification.\BBCQ \APACjournalVolNumPagesGeophysical Research Letters471. {APACrefURL} https://onlinelibrary.wiley.com/doi/10.1029/2019GL085190 {APACrefDOI} 10.1029/2019GL085190 \PrintBackRefs\CurrentBib
- Denby \BBA Boeing (\APACyear2022) \APACinsertmetastarlagtraj{APACrefauthors}Denby, L.\BCBT \BBA Boeing, S. \APACrefYearMonthDay2022. \APACrefbtitleEUREC4A-UK/lagtraj: v0.1.2. Eurec4a-uk/lagtraj: v0.1.2. \APACaddressPublisherZenodo. {APACrefURL} https://zenodo.org/record/7506620 {APACrefDOI} 10.5281/ZENODO.7506620 \PrintBackRefs\CurrentBib
- Denby \BBA Janssens (\APACyear2022) \APACinsertmetastarDenbyJanssens2022{APACrefauthors}Denby, L.\BCBT \BBA Janssens, M. \APACrefYearMonthDay2022aug. \APACrefbtitlecloudsci/cloudmetrics: v0.2.0. cloudsci/cloudmetrics: v0.2.0. \APACaddressPublisherZenodo. {APACrefURL} https://doi.org/10.5281/zenodo.7506966 {APACrefDOI} 10.5281/zenodo.7506966 \PrintBackRefs\CurrentBib
- Hersbach \BOthers. (\APACyear2020) \APACinsertmetastarERA5{APACrefauthors}Hersbach, H., Bell, B., Berrisford, P., Hirahara, S., Horányi, A., Muñoz-Sabater, J.\BDBLThépaut, J\BHBIN. \APACrefYearMonthDay2020. \BBOQ\APACrefatitleThe ERA5 global reanalysis The era5 global reanalysis.\BBCQ \APACjournalVolNumPagesQuarterly Journal of the Royal Meteorological Society1467301999-2049. {APACrefURL} https://rmets.onlinelibrary.wiley.com/doi/abs/10.1002/qj.3803 {APACrefDOI} https://doi.org/10.1002/qj.3803 \PrintBackRefs\CurrentBib
- Janssens \BOthers. (\APACyear2021) \APACinsertmetastarJanssens2021{APACrefauthors}Janssens, M., Vilà-Guerau de Arellano, J., Scheffer, M., Antonissen, C., Siebesma, A\BPBIP.\BCBL \BBA Glassmeier, F. \APACrefYearMonthDay2021mar. \BBOQ\APACrefatitleCloud Patterns in the Trades Have Four Interpretable Dimensions Cloud Patterns in the Trades Have Four Interpretable Dimensions.\BBCQ \APACjournalVolNumPagesGeophysical Research Letters4851–14. {APACrefURL} https://onlinelibrary.wiley.com/doi/10.1029/2020GL091001 {APACrefDOI} 10.1029/2020GL091001 \PrintBackRefs\CurrentBib
- Kurihana, Foster\BCBL \BOthers. (\APACyear2022) \APACinsertmetastarKurihana2022ClimInfo{APACrefauthors}Kurihana, T., Foster, I., Willett, R., Jenkins, S., Koenig, K., Werman, R.\BDBLMoyer, E. \APACrefYearMonthDay2022. \APACrefbtitleCloud Classification with Unsupervised Deep Learning. Cloud classification with unsupervised deep learning. \APACaddressPublisherarXiv. {APACrefURL} https://arxiv.org/abs/2209.15585 {APACrefDOI} 10.48550/ARXIV.2209.15585 \PrintBackRefs\CurrentBib
- Kurihana, Moyer, Willett\BCBL \BOthers. (\APACyear2022) \APACinsertmetastarKurihana_2022Autoenc{APACrefauthors}Kurihana, T., Moyer, E., Willett, R., Gilton, D.\BCBL \BBA Foster, I. \APACrefYearMonthDay2022. \BBOQ\APACrefatitleData-Driven Cloud Clustering via a Rotationally Invariant Autoencoder Data-driven cloud clustering via a rotationally invariant autoencoder.\BBCQ \APACjournalVolNumPagesIEEE Transactions on Geoscience and Remote Sensing601–25. {APACrefURL} https://doi.org/10.1109%2Ftgrs.2021.3098008 {APACrefDOI} 10.1109/tgrs.2021.3098008 \PrintBackRefs\CurrentBib
- Kurihana, Moyer\BCBL \BBA Foster (\APACyear2022) \APACinsertmetastarKurihana_2022_AICCA{APACrefauthors}Kurihana, T., Moyer, E\BPBIJ.\BCBL \BBA Foster, I\BPBIT. \APACrefYearMonthDay2022nov. \BBOQ\APACrefatitleAICCA: AI-Driven Cloud Classification Atlas AICCA: AI-driven cloud classification atlas.\BBCQ \APACjournalVolNumPagesRemote Sensing14225690. {APACrefURL} https://doi.org/10.3390%2Frs14225690 {APACrefDOI} 10.3390/rs14225690 \PrintBackRefs\CurrentBib
- Medeiros \BOthers. (\APACyear2008) \APACinsertmetastarMedeiros2008{APACrefauthors}Medeiros, B., Stevens, B., Held, I\BPBIM., Zhao, M., Williamson, D\BPBIL., Olson, J\BPBIG.\BCBL \BBA Bretherton, C\BPBIS. \APACrefYearMonthDay2008. \BBOQ\APACrefatitleAquaplanets, climate sensitivity, and low clouds Aquaplanets, climate sensitivity, and low clouds.\BBCQ \APACjournalVolNumPagesJournal of Climate21194974–4991. {APACrefDOI} 10.1175/2008JCLI1995.1 \PrintBackRefs\CurrentBib
- Muller \BOthers. (\APACyear2022) \APACinsertmetastarmuller2022spontaneous{APACrefauthors}Muller, C., Yang, D., Craig, G., Cronin, T., Fildier, B., Haerter, J\BPBIO.\BDBLothers \APACrefYearMonthDay2022. \BBOQ\APACrefatitleSpontaneous aggregation of convective storms Spontaneous aggregation of convective storms.\BBCQ \APACjournalVolNumPagesAnnual Review of Fluid Mechanics54133–157. \PrintBackRefs\CurrentBib
- Narenpitak \BOthers. (\APACyear2021\APACexlab\BCnt1) \APACinsertmetastarNarenpitak2021{APACrefauthors}Narenpitak, P., Kazil, J., Yamaguchi, T., Quinn, P.\BCBL \BBA Feingold, G. \APACrefYearMonthDay2021\BCnt1. \BBOQ\APACrefatitleFrom Sugar to Flowers: A Transition of Shallow Cumulus Organization During ATOMIC From sugar to flowers: A transition of shallow cumulus organization during atomic.\BBCQ \APACjournalVolNumPagesJournal of Advances in Modeling Earth Systems1310e2021MS002619. {APACrefURL} https://agupubs.onlinelibrary.wiley.com/doi/abs/10.1029/2021MS002619 \APACrefnotee2021MS002619 2021MS002619 {APACrefDOI} https://doi.org/10.1029/2021MS002619 \PrintBackRefs\CurrentBib
- Narenpitak \BOthers. (\APACyear2021\APACexlab\BCnt2) \APACinsertmetastarNarenpitak_2021{APACrefauthors}Narenpitak, P., Kazil, J., Yamaguchi, T., Quinn, P.\BCBL \BBA Feingold, G. \APACrefYearMonthDay2021\BCnt2oct. \BBOQ\APACrefatitleFrom Sugar to Flowers: A Transition of Shallow Cumulus Organization During ATOMIC From sugar to flowers: A transition of shallow cumulus organization during ATOMIC.\BBCQ \APACjournalVolNumPagesJournal of Advances in Modeling Earth Systems1310. {APACrefURL} https://doi.org/10.1029%2F2021ms002619 {APACrefDOI} 10.1029/2021ms002619 \PrintBackRefs\CurrentBib
- NASA/LARC/SD/ASDC (\APACyear2017) \APACinsertmetastarMODIS-Syn1Deg1Hour-Terra-Aqua{APACrefauthors}NASA/LARC/SD/ASDC. \APACrefYearMonthDay2017919. \APACrefbtitleCERES and GEO-Enhanced TOA, Within-Atmosphere and Surface Fluxes, Clouds and Aerosols 1-Hourly Terra-Aqua Edition4A. Ceres and geo-enhanced toa, within-atmosphere and surface fluxes, clouds and aerosols 1-hourly terra-aqua edition4a. \APACaddressPublisherNASA Langley Atmospheric Science Data Center DAAC. {APACrefURL} https://doi.org/10.5067/TERRA+AQUA/CERES/SYN1DEG-1HOUR_L3.004A \PrintBackRefs\CurrentBib
- NASA/LARC/SD/ASDC (\APACyear2018) \APACinsertmetastarASDC2018SatCORPS{APACrefauthors}NASA/LARC/SD/ASDC. \APACrefYearMonthDay201888. \APACrefbtitleSatCORPS CERES GEO Edition 4 GOES-16 Northern Hemisphere Version 1.2. Satcorps ceres geo edition 4 goes-16 northern hemisphere version 1.2. \APACaddressPublisherNASA Langley Atmospheric Science Data Center DAAC. {APACrefURL} https://doi.org/10.5067/GOES16/CERES/GEO_ED4_NH_V01.2 \PrintBackRefs\CurrentBib
- Saffin \BOthers. (\APACyear2023\APACexlab\BCnt1) \APACinsertmetastarSaffin2023{APACrefauthors}Saffin, L., Lock, A., Tomassini, L., Blyth, A., Böing, S., Denby, L.\BCBL \BBA Marsham, J. \APACrefYearMonthDay2023\BCnt1. \BBOQ\APACrefatitleKilometer-Scale Simulations of Trade-Wind Cumulus Capture Processes of Mesoscale Organization Kilometer-scale simulations of trade-wind cumulus capture processes of mesoscale organization.\BBCQ \APACjournalVolNumPagesJournal of Advances in Modeling Earth Systems153e2022MS003295. {APACrefURL} https://agupubs.onlinelibrary.wiley.com/doi/abs/10.1029/2022MS003295 \APACrefnotee2022MS003295 2022MS003295 {APACrefDOI} https://doi.org/10.1029/2022MS003295 \PrintBackRefs\CurrentBib
- Saffin \BOthers. (\APACyear2023\APACexlab\BCnt2) \APACinsertmetastarSaffin_2023{APACrefauthors}Saffin, L., Lock, A., Tomassini, L., Blyth, A., Böing, S., Denby, L.\BCBL \BBA Marsham, J. \APACrefYearMonthDay2023\BCnt2mar. \BBOQ\APACrefatitleKilometer-Scale Simulations of Trade-Wind Cumulus Capture Processes of Mesoscale Organization Kilometer-scale simulations of trade-wind cumulus capture processes of mesoscale organization.\BBCQ \APACjournalVolNumPagesJournal of Advances in Modeling Earth Systems153. {APACrefURL} https://doi.org/10.1029%2F2022ms003295 {APACrefDOI} 10.1029/2022ms003295 \PrintBackRefs\CurrentBib
- Schulz (\APACyear2022) \APACinsertmetastarSchulz2022{APACrefauthors}Schulz, H. \APACrefYearMonthDay2022. \BBOQ\APACrefatitleC3ONTEXT: A Common Consensus on Convective OrgaNizaTion during the EUREC4A eXperimenT C3ONTEXT: A Common Consensus on Convective OrgaNizaTion during the EUREC4A eXperimenT.\BBCQ \APACjournalVolNumPagesEarth System Science Data1431233–1256. {APACrefDOI} 10.5194/essd-14-1233-2022 \PrintBackRefs\CurrentBib
- Schulz \BOthers. (\APACyear2021) \APACinsertmetastarSchulz2021{APACrefauthors}Schulz, H., Eastman, R.\BCBL \BBA Stevens, B. \APACrefYearMonthDay2021. \BBOQ\APACrefatitleCharacterization and Evolution of Organized Shallow Convection in the Downstream North Atlantic Trades Characterization and Evolution of Organized Shallow Convection in the Downstream North Atlantic Trades.\BBCQ \APACjournalVolNumPagesJournal of Geophysical Research: Atmospheres126171–18. {APACrefDOI} 10.1029/2021JD034575 \PrintBackRefs\CurrentBib
- Stevens \BOthers. (\APACyear2019) \APACinsertmetastarStevens2019{APACrefauthors}Stevens, B., Bony, S., Brogniez, H., Hentgen, L., Hohenegger, C., Kiemle, C.\BDBLZuidema, P. \APACrefYearMonthDay2019. \BBOQ\APACrefatitleSugar, Gravel, Fish, and Flowers – Mesoscale cloud patterns in the Tradewinds Sugar, Gravel, Fish, and Flowers – Mesoscale cloud patterns in the Tradewinds.\BBCQ \APACjournalVolNumPagesQuarterly Journal of the Royal Meteorological Society. \PrintBackRefs\CurrentBib
- Stevens \BOthers. (\APACyear2021) \APACinsertmetastarStevens2021eurec4a{APACrefauthors}Stevens, B., Bony, S., Farrell, D., Ament, F., Blyth, A., Fairall, C.\BDBLZöger, M. \APACrefYearMonthDay2021. \BBOQ\APACrefatitleEurec4a Eurec4a.\BBCQ \APACjournalVolNumPagesEarth System Science Data1384067–4119. {APACrefDOI} 10.5194/essd-13-4067-2021 \PrintBackRefs\CurrentBib
- Tenenbaum \BOthers. (\APACyear2000) \APACinsertmetastarTenenbaum_2000{APACrefauthors}Tenenbaum, J\BPBIB., de Silva, V.\BCBL \BBA Langford, J\BPBIC. \APACrefYearMonthDay2000dec. \BBOQ\APACrefatitleA Global Geometric Framework for Nonlinear Dimensionality Reduction A global geometric framework for nonlinear dimensionality reduction.\BBCQ \APACjournalVolNumPagesScience29055002319–2323. {APACrefURL} https://doi.org/10.1126%2Fscience.290.5500.2319 {APACrefDOI} 10.1126/science.290.5500.2319 \PrintBackRefs\CurrentBib
- Vial \BOthers. (\APACyear2013) \APACinsertmetastarVial2013{APACrefauthors}Vial, J., Dufresne, J\BPBIL.\BCBL \BBA Bony, S. \APACrefYearMonthDay2013. \BBOQ\APACrefatitleOn the interpretation of inter-model spread in CMIP5 climate sensitivity estimates On the interpretation of inter-model spread in CMIP5 climate sensitivity estimates.\BBCQ \APACjournalVolNumPagesClimate Dynamics4111-123339–3362. {APACrefDOI} 10.1007/s00382-013-1725-9 \PrintBackRefs\CurrentBib
- Webb \BOthers. (\APACyear2006) \APACinsertmetastarWebb2006{APACrefauthors}Webb, M\BPBIJ., Senior, C\BPBIA., Sexton, D\BPBIM., Ingram, W\BPBIJ., Williams, K\BPBID., Ringer, M\BPBIA.\BDBLTaylor, K\BPBIE. \APACrefYearMonthDay2006. \BBOQ\APACrefatitleOn the contribution of local feedback mechanisms to the range of climate sensitivity in two GCM ensembles On the contribution of local feedback mechanisms to the range of climate sensitivity in two GCM ensembles.\BBCQ \APACjournalVolNumPagesClimate Dynamics27117–38. {APACrefDOI} 10.1016/j.pbiomolbio.2006.02.004 \PrintBackRefs\CurrentBib
- Wing \BOthers. (\APACyear2018) \APACinsertmetastarwing2018convective{APACrefauthors}Wing, A\BPBIA., Emanuel, K., Holloway, C\BPBIE.\BCBL \BBA Muller, C. \APACrefYearMonthDay2018. \BBOQ\APACrefatitleConvective self-aggregation in numerical simulations: A review Convective self-aggregation in numerical simulations: A review.\BBCQ \APACjournalVolNumPagesShallow clouds, water vapor, circulation, and climate sensitivity1–25. \PrintBackRefs\CurrentBib