Towards Last-layer Retraining for Group
Robustness with Fewer Annotations
Abstract
Empirical risk minimization (ERM) of neural networks is prone to over-reliance on spurious correlations and poor generalization on minority groups. The recent deep feature reweighting (DFR) technique [33] achieves state-of-the-art group robustness via simple last-layer retraining, but it requires held-out group and class annotations to construct a group-balanced reweighting dataset. In this work, we examine this impractical requirement and find that last-layer retraining can be surprisingly effective with no group annotations (other than for model selection) and only a handful of class annotations. We first show that last-layer retraining can greatly improve worst-group accuracy even when the reweighting dataset has only a small proportion of worst-group data. This implies a “free lunch” where holding out a subset of training data to retrain the last layer can substantially outperform ERM on the entire dataset with no additional data or annotations. To further improve group robustness, we introduce a lightweight method called selective last-layer finetuning (SELF), which constructs the reweighting dataset using misclassifications or disagreements. Our empirical and theoretical results present the first evidence that model disagreement upsamples worst-group data, enabling SELF to nearly match DFR on four well-established benchmarks across vision and language tasks with no group annotations and less than of the held-out class annotations. Our code is available at https://github.com/tmlabonte/last-layer-retraining.
1 Introduction
Classification tasks in machine learning often suffer from spurious correlations: patterns which are predictive of the target class in the training dataset but irrelevant to the true classification function. These spurious correlations, often in conjunction with the target class, create minority groups which are underrepresented in the training dataset. For example, in the task of classifying cows and camels, the training dataset may be biased so that a desert background is spuriously correlated with the camel class, creating a minority group of camels on grass backgrounds [5]. Beyond this simple scenario, spurious correlations have been observed in high-consequence applications including medicine [79], justice [9], and facial recognition [42].
Neural networks trained via the standard procedure of empirical risk minimization (ERM) [68], which minimizes the average training loss, tend to overfit to spurious correlations and generalize poorly on minority groups [18]. Even worse, it is possible for ERM models to rely exclusively on the spurious feature and incur minority group performance that is no better than random guessing [60]. Therefore, maximizing the model’s group robustness, quantified by its worst accuracy on any group, is a desirable objective in the presence of spurious correlations [58].
In contrast to more generic distribution shift settings (e.g., domain generalization [35]), the presence of spurious correlations enables the improvement of group robustness merely by addressing model bias (without collecting additional minority group data). The recently proposed deep feature reweighting (DFR) [33, 28] technique efficiently corrects model bias by retraining the last layer of the neural network, a simple procedure which achieves state-of-the-art group robustness. The key hypothesis underlying DFR is that ERM models which overfit to spurious correlations still learn core features that correlate with the ground-truth label on all groups, but they perform poorly because they overweight the spurious features in the last layer. Ostensibly, retraining the last layer on a group-balanced reweighting dataset would then upweight the core features and improve worst-group accuracy.
DFR compares favorably to existing methods such as group distributionally robust optimization (DRO) [58], which requires group annotations for the entire training dataset. However, DFR still necessitates a smaller reweighting dataset with group and class annotations to achieve maximal performance [33]. This requirement limits its practical application, as the groups are often unknown ahead of time or difficult to annotate (e.g., due to financial, privacy, or fairness concerns).
Our contributions
In this paper, we present a comprehensive examination of the performance of last-layer retraining in the absence of group and class annotations on four well-established benchmarks for group robustness across vision and language tasks.111Our methods in Section 4 do not require group annotations at all, while our SELF method in Section 5 assumes access to a small validation set with group annotations for model selection following previous work [58, 41, 48, 33, 28]. We show in Appendix B that SELF is robust even with 1% of these annotations. We first investigate the necessity of the reweighting dataset being balanced across groups, and we show that last-layer retraining can substantially improve worst-group accuracy even when the reweighting dataset has only a small proportion of worst-group data. Based on this observation, we propose class-balanced last-layer retraining as a simple but strong baseline for group robustness without group annotations. We show that, on average over the four datasets, this method achieves of DFR worst-group accuracy compared to without class balancing.
The strong performance of class-balanced last-layer retraining reveals a “free lunch” with practical ramifications. While class-balanced ERM was recently proposed by [27] as a competitive baseline for worst-group accuracy, we show that instead of using the entire training dataset for ERM, dependence on spurious correlations can be reduced by randomly splitting the training data in two, then performing ERM training on the first split and class-balanced last-layer retraining on the second. Our experiments indicate that this technique can improve worst-group accuracy by up to over class-balanced ERM on the original dataset using no additional data or annotations (even for model selection) – a surprising and unexplained result given that the two splits have equally drastic group imbalance.
While retraining the last layer on a class-balanced held-out dataset can be effective, it is inferior to DFR when group imbalance is large. To close this gap, we propose selective last-layer finetuning (SELF), which selects a small, more group-balanced reweighting dataset and finetunes the last layer instead of retraining. We implement SELF using points that are either misclassified or disagree in their predictions relative to a regularized model. Disagreement SELF does not require class annotations for the entire held-out set (only for the disagreements). We show that disagreement SELF between the ERM and early-stopped models performs the best in general, surpassing class-balanced last-layer retraining by up to worst-group accuracy with less than of the held-out class annotations.
Overall, our work shows benefits of last-layer retraining well beyond a group-balanced held-out dataset. Our results call for further investigation of the DFR hypothesis: while group balance is the most important factor in DFR performance, we show that a significant gain is solely due to class balancing, and the performance discrepancy between misclassification SELF and disagreement SELF suggests that worst-group accuracy may be affected by characteristics of the reweighting dataset other than group balance. Our main results are summarized and compared to previous methods in Table 1.
2 Related work
This work subsumes and improves our two previous workshop papers: [38] broadly covers Section 4, while [37] represents preliminary investigation into Section 5, which we have substantially updated with new methodology, evaluation, and theoretical analysis for this version.
Spurious correlations.
The performance of empirical risk minimization (ERM) in the presence of spurious correlations has been extensively studied [18]. In vision, ERM models are widely known to rely on spurious attributes like background [58, 75], texture [17], and secondary objects [56, 61, 62] to perform classification. In language, ERM models often utilize syntactic or statistical heuristics as a substitute for semantic understanding [20, 50, 46]. This behavior can lead to bias against demographic minorities [25, 6, 67, 23, 8] or failure in high-consequence applications [42, 9, 79, 51].
Robustness and group annotations.
If group annotations are available in the training dataset, group distributionally robust optimization (DRO) [58] can improve robustness by minimizing the worst-group loss, while other techniques learn invariant or diverse features [1, 19, 80, 76]. Methods which use only partial group annotations include deep feature reweighting (DFR) [33, 28], which retrains the last layer on a group-balanced held-out set, and spread spurious attribute [48], which performs DRO with group pseudo-labels. Recently, more lightweight methods that only adjust the model predictions using a group annotated held-out set have also been proposed [70]. However, since the groups are often unknown ahead of time or difficult to annotate in practice, there has been significant interest in methods which do not utilize group annotations except for model selection. The bulk of these techniques utilize auxiliary models to pseudo-label the minority group or spurious feature [63, 47, 77, 11, 31, 66, 32, 64, 81]; notably, just train twice (JTT) [41] upweights samples misclassified by an early-stopped model. Other techniques reweight or subsample the classes [27] or train with robust losses and regularization [54, 78].
| Method | Annotations | Worst-group test accuracy | ||||
| Group | Class | Waterbirds | CelebA | CivilComments | MultiNLI | |
| Class-balanced ERM | ✗ | ✓ | ||||
| JTT [41, 27] | ✗ | ✓ | – | |||
| RWY-ES [27, 28] | ✗ | ✓ | ||||
| CnC [81] | ✗ | ✓ | – | – | ||
| CB last-layer retraining | ✗ | ✓ | ||||
| ES disagreement SELF | ✗ | ✗ | ||||
| DFR (our impl.) | ✓ | ✓ | ||||
| DFR [33, 28] | ✓ | ✓ | ||||
| Group DRO-ES [58, 28] | ✓ | ✓ | ||||
Unlike DFR, our methods utilize no held-out group annotations, and unlike JTT, we do not have to “train twice”, only finetune the last layer. We also show that SELF performs best using disagreements between the ERM and early-stopped models instead of misclassifications as in JTT. Moreover, while JTT assumes the early-stopped model has low worst-group accuracy which improves during training, SELF performs well even when the early-stopped model has high worst-group accuracy which decreases during training – substantially improving performance on datasets such as CivilComments. The concurrent work of Qiu et al. [55] proposed a similar method to our Section 4.2; while they use a tunable loss to upweight misclassified samples, our method shows that similar results can be achieved with no hyperparameter tuning (and therefore no group annotations for the validation set). Finally, while our results partially corroborate the findings of Idrissi et al. [27] that class balancing during ERM is effective for group robustness, we observe that class-balanced last-layer retraining renders ERM class balancing optional. We compare our results with previous methods in Table 1.
| Dataset | Group | Training distribution | Data quantity | |||||
|---|---|---|---|---|---|---|---|---|
| Class | Spurious | Train | Val | Test | ||||
| Waterbirds | landbird | land | ||||||
| landbird | water | |||||||
| waterbird | land | |||||||
| waterbird | water | |||||||
| CelebA | non-blond | female | ||||||
| non-blond | male | |||||||
| blond | female | |||||||
| blond | male | |||||||
| CivilComments | neutral | no identity | ||||||
| neutral | identity | |||||||
| toxic | no identity | |||||||
| toxic | identity | |||||||
| MultiNLI | contradiction | no negation | ||||||
| contradiction | negation | |||||||
| entailment | no negation | |||||||
| entailment | negation | |||||||
| neither | no negation | |||||||
| neither | negation | |||||||
Generalization via disagreement.
Disagreement-based active learning for improving in-distribution generalization has been well-studied since before the deep learning era [10, 4, 21]. More recent research has utilized disagreements between SGD runs to predict in-distribution generalization [30], as well as between model classes (e.g., CNNs and Transformers) to predict out-of-distribution generalization [3]. Two works that are concurrent to ours, diversity by disagreement [52] and diversify and disambiguate [40], are methods for generalization under distribution shift which maximize the disagreement between multiple predictors to learn a diverse ensemble. Compared to our work, these methods are optimized for training datasets which exhibit a complete correlation (i.e., contain no minority group data) and they underperform in the less extreme spurious correlation setting we study.
3 Preliminaries
Setting. We consider classification tasks with input domain and target classes . We assume is a set of spurious features such that each sample is associated with exactly one feature . In conjunction with the target class, the spurious features partition the dataset into groups . While the groups may be heavily imbalanced in the training distribution, we desire a model which is invariant to the spurious feature and thus has roughly uniform performance over . Therefore, we evaluate worst-group accuracy (WGA), i.e., the minimum accuracy among all groups [58].
We will often refer to datasets and models as group-balanced or class-balanced, meaning that in expectation, the dataset is composed of an equal number of samples from groups in or classes in , respectively. This balance can be achieved by training on a subset with equal data from each group/class, or sampling from the data so that each minibatch is balanced in expectation [27]. To make the latter more concrete, for group balancing we first sample , then sample where is the training distribution; class balancing is the same with instead of . We use the minibatch sampling approach for both class-balanced ERM and class-balanced last-layer retraining, and we provide a comparison with the subset method in Appendix A.
Deep feature reweighting.
The recently proposed deep feature reweighting (DFR) [33, 28] method achieves state-of-the-art WGA by performing ERM on the training dataset, then retraining the last layer of the neural network on a group-balanced held-out dataset, called the reweighting dataset. In the original implementation, half the validation set is used to construct the reweighting dataset: all data from the smallest group is included and the other groups are randomly downsampled to that size. Then, the feature embeddings (i.e., the outputs of the penultimate layer) of the reweighting dataset are pre-computed and used to train a logistic regression model with explicit -regularization. The results are averaged over 10 randomly subsampled reweighting datasets, and a hyperparameter search is performed over regularization strength on the other half of the validation set.
To emphasize practicality and efficiency, our implementation of DFR has some differences from the original. (i) Instead of logistic regression, we train the last layer on the reweighting dataset via minibatch optimization using SGD and AdamW [43] for the vision and language tasks, respectively. This fits well into standard training pipelines and avoids pre-computing the feature embeddings and writing them to disk, which can be slow and memory-intensive. (ii) To reduce the number of hyperparameters, we use a fixed-value regularization instead of searching over regularization strength. We observed similar performance for and regularization, which we believe is because -regularized gradients do not induce sparsity [39]. (iii) We sample uniformly at random from the groups in the held-out dataset (to get group balanced minibatches) instead of averaging over group-balanced subsets of the data [27]. We compare the implementations in detail in Appendix A.
Datasets and models.
We study four datasets which are well-established as benchmarks for group robustness across vision and language tasks, detailed in Table 2 and summarized below.
-
•
Waterbirds [71, 69, 58] is an image classification dataset where the task is to predict whether a bird is a landbird or a waterbird. The spurious feature is the image background: more landbirds are present on land backgrounds than waterbirds, and vice versa.222We note that the Waterbirds dataset is known to contain incorrect labels [66]. We report results on the original, un-corrected version for a fair comparison with previous work.
- •
-
•
CivilComments [7, 35] is a text classification dataset where the task is to predict whether a comment is toxic or not. The spurious feature is the presence of one of the following categories: male, female, LGBT, black, white, Christian, Muslim, or other religion.333This version of CivilComments has four groups, used in this work and by [58, 28, 33]. There is another version where the identity categories are not collapsed into one spurious feature; this version is used by [41, 81], so we do not report their CivilComments accuracies in Table 1. Both versions use the WILDS split [35]. More toxic comments contain one of these categories than non-toxic comments, and vice versa.
- •
Importantly, Waterbirds is the only dataset that has a distribution shift – its validation and test datasets are group-balanced conditioned on the classes, although still class-imbalanced.444The Waterbirds validation and test datasets still contain more landbirds than waterbirds, but each class has equal quantities of land and water backgrounds. As a result, methods which use the validation set for training can improve performance without explicit group balancing.
We utilize a ResNet-50 [24] pretrained on ImageNet-1K [57] for Waterbirds and CelebA, and a BERT [14] model pretrained on Book Corpus [83] and English Wikipedia for CivilComments and MultiNLI. Following previous work, we use half the validation set for feature reweighting [33, 28] and half for model selection with group annotations [58, 41, 33, 48, 28]. We run each experiment on three random seeds and do not utilize explicit early stopping except as part of SELF (see Section 5). See Appendix D for further details on the training procedure.
4 Class-balanced last-layer retraining
In this section, we investigate the necessity of a group-balanced reweighting dataset for DFR and show that class-balanced last-layer retraining is a simple but strong baseline for group robustness without group annotations. To enable a fair comparison with our implementation of DFR (see Section 3), class-balanced last-layer retraining follows the same training procedure, except the reweighting dataset is constructed by sampling uniformly over the classes instead of the groups .
4.1 An ablation on the proportion of worst-group data
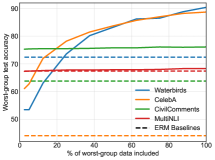
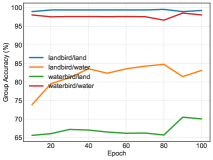
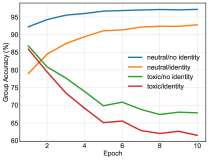
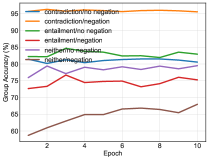
In this section, we perform an ablation on the percentage of worst-group data in the reweighting dataset and show that class-balanced last-layer retraining can substantially improve WGA even when the reweighting dataset has only a small proportion of worst group data. For our ablation, we choose the worst groups based on the performance of ERM, and if two groups have similarly poor performance, we vary both. The worst groups for Waterbirds are landbirds on water backgrounds and waterbirds on land backgrounds; for CelebA blond men; for CivilComments toxic comments containing identity categories; and for MultiNLI entailments and neutral pairs containing negations.
For these experiments, we begin with the DFR reweighting dataset, i.e., a random group-balanced subset of the held-out dataset, where the size of each group is the minimum of the worst-group size and half the size of any other group.555This is necessary because we keep the total data constant. By reducing the quantity of worst-group data to zero, we will at most double the size of any other group. We define this dataset to include of the worst-group data. We then reduce the percentage of worst-group data, while correspondingly increasing the percentage of data from the same class without the spurious feature. For example, the DFR reweighting dataset on CelebA has points from each group, so reducing the worst group to results in non-blond females, non-blond males, blond females, and blond males. The total data is kept constant.
| Method | Group annotations | Worst-group test accuracy | |||
|---|---|---|---|---|---|
| Waterbirds | CelebA | CivilComments | MultiNLI | ||
| Class-balanced ERM | ✗ | ||||
| UB last-layer retraining | ✗ | ||||
| CB last-layer retraining | ✗ | ||||
| DFR (our impl.) | ✓ | ||||
| DFR [33, 28] | ✓ | ||||
The results of this ablation are displayed in Figure 1. While a smooth increase in WGA with increasing worst-group data is expected, the extent of the early increase is surprising: over the four datasets, an average of of the increase in WGA over class-unbalanced ERM is obtained by the first of worst-group data. In particular, CelebA and CivilComments – the most class-imbalanced datasets we study – experience significant improvement even at low percentages of worst-group data. This phenomenon suggests that, while group balancing is still important for best results, class balancing is a major factor in the performance of DFR on these two datasets.
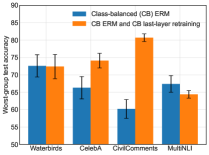
Furthermore, class-balanced last-layer retraining can improve worst-group accuracy even when the held-out dataset has similar group imbalance as the training dataset (i.e., at the stars ★ in Figure 1). Based on this observation, we propose that class-balanced last-layer retraining on the entire held-out dataset can be a simple but strong baseline for group robustness without group annotations. Table 3 details the results; on average over the four datasets, class-balanced last-layer retraining achieves of DFR performance, compared to without class balancing. However, it still trails DFR by a significant amount on CelebA and MultiNLI – the most group-imbalanced datasets we study. We improve these results with our selective last-layer finetuning (SELF) method described in Section 5.
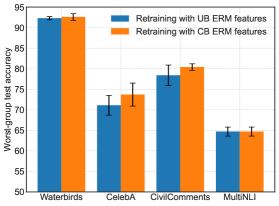
Moreover, our experiments in Figure 4 (deferred to Appendix A) indicate that class-balanced last layer retraining has similar performance regardless of whether it is initialized with class-unbalanced or class-balanced ERM features. Contrasting with Idrissi et al. [27], our results suggest that class balancing in the ERM stage is optional. This result has practical relevance for expensive models pre-trained without class balancing (e.g., large language models), as the benefits of class balancing on downstream tasks can be reaped by simply retraining the last layer instead of training a new model.
4.2 A “free lunch” in group robustness
Motivated by the promising results of Section 4.1, where we performed class-balanced last-layer retraining on a fixed held-out set, we now ask how can we best utilize a realistic training dataset? In particular, practical applications often work with a predetermined data, annotation, and compute budget. Within this budget, and with no explicit held-out dataset, would one achieve better group robustness by using the entire dataset for ERM or by holding out a subset for last-layer retraining?
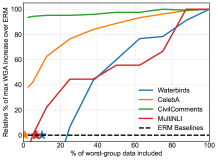
We investigate this question on our four benchmark datasets by randomly splitting the initial dataset into two, then performing class-balanced ERM training on the first split ( of the data) and class-balanced last-layer retraining on the second split ( of the data). Figure 2(a) illustrates the results of our experiments on the training dataset and Figure 2(b) on the combined training and held-out datasets. Since the quantity of data is higher in the case of combining the training and held-out datasets, we expect all numbers to be higher in Figure 2(b) compared to Figure 2(a) (especially on Waterbirds, which has a more group-balanced validation set). We perform no hyperparameter tuning for these experiments, and therefore we do not utilize group annotations even for model selection.
Figure 2 indicates that splitting the dataset and performing last-layer retraining substantially improves worst-group accuracy on Waterbirds, CelebA, and CivilComments. It decreases performance on MultiNLI, which is the only dataset where adding held-out data from the same distribution significantly increases ERM worst-group accuracy compared to DFR. Specifically, class-balanced ERM achieves % WGA on the training dataset and % on the combined training and held-out datasets, while our DFR implementation achieves %. Therefore, we hypothesize that last-layer retraining on the second split can improve group robustness only if there is enough data for ERM to perform near-optimally on the first split, i.e., if the performance of ERM on the first split is limited by dataset bias rather than sample variance.
Based on this hypothesis, our answer to the posed question is: if ERM performance is stable when holding out of data, perform last-layer retraining on the held-out dataset instead of ERM on the initial dataset. We call this technique a “free lunch” because it improves worst-group accuracy with no additional data or annotations beyond ERM (including for model selection). In particular, we utilize less data for ERM training and less compute due to the efficient nature of last-layer retraining. Therefore, we believe this method is especially relevant to practitioners, and it can be easily implemented with little change to data processing or model training workflows.
A critical remaining question is why last-layer retraining improves group robustness; since the training and held-out datasets have equally drastic group imbalance, it is counterintuitive that reducing the quantity of data used for ERM and performing last-layer retraining would increase worst-group accuracy. In some cases, as seen on MultiNLI in Figure 2, training an ERM model with less data can be detrimental – but on the other three datasets, last-layer retraining substantially improves over ERM. We leave it to future empirical and theoretical work to better understand this phenomenon.
5 Selective last-layer finetuning
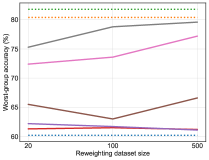
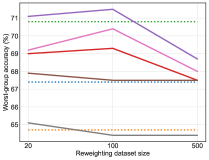
While class-balanced last-layer retraining can improve worst-group accuracy without group annotations, its performance is still inferior to DFR, particularly on the highly group-imbalanced CelebA and MultiNLI datasets. In these cases, training on the entire held-out set can be detrimental; instead, we show that constructing the reweighting dataset by detecting and upsampling worst-group data is more effective. We propose selective last-layer finetuning (SELF), which uses an auxiliary model to select a small, more group-balanced reweighting dataset, then finetunes the ERM last layer instead of retraining entirely to avoid overfitting on this smaller dataset.
| Method | Held-out annotations | Worst-group test accuracy | ||||
| Group | Class | Waterbirds | CelebA | CivilComments | MultiNLI | |
| Class-balanced ERM | ✗ | ✓ | ||||
| CB last-layer retraining | ✗ | ✓ | ||||
| Random SELF | ✗ | ✗ | ||||
| Misclassification SELF | ✗ | ✓ | ||||
| ES misclassification SELF | ✗ | ✓ | ||||
| Dropout disagreement SELF | ✗ | ✗ | ||||
| ES disagreement SELF | ✗ | ✗ | ||||
| DFR (our impl.) | ✓ | ✓ | ||||
| DFR [33, 28] | ✓ | ✓ | ||||
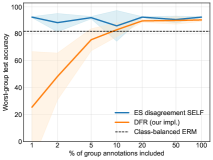
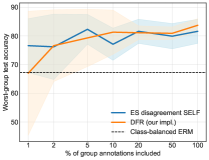
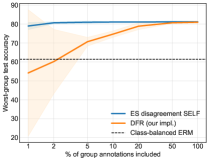
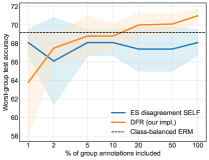
SELF does not use group annotations for training and can be implemented even when class annotations are unavailable in the held-out dataset, making it applicable in settings not captured by current techniques (e.g., adaptation to an unlabeled target domain [45]). If class annotations are not available, we select points which are disagreed upon by ERM and a regularized model, then request their labels. If class annotations are available, we can still use disagreement, or alternatively, we select points which are misclassified by the ERM or early-stopped model. Our experiments indicate that disagreement SELF between the ERM and early-stopped models performs the best overall, increasing the worst-group accuracy of class-balanced last-layer retraining to near-DFR levels while requesting less than 3% of the held-out class annotations. Our results are detailed in Table 4.
We formalize SELF as follows. Let be models with logit outputs, be a held-out dataset, be a cost function, and be an integer. SELF constructs the reweighting set by greedily selecting the points in whose outputs incur the highest cost, i.e.,
| (1) |
Then, SELF requests class annotations and performs class-balanced finetuning (i.e., starting from the ERM weights) of the last layer of the ERM model on , using the same implementation as last-layer retraining (see Section 4). We study the following four variants of SELF:
-
•
Misclassification: is an ERM model and is the labeling function, i.e., , for a datapoint with label , the output is the one-hot encoded vector for . The cost function is cross entropy loss.
-
•
Early-stop misclassification:666Using early-stop misclassification to upsample worst-group data is the premise of JTT [41]. is an early-stopped ERM model and is the labeling function. The cost function is cross entropy loss.
-
•
Dropout disagreement: is an ERM model and is the same model where inference is run with nodes randomly dropped out in the last layer [65]. The cost function is KL divergence with softmax.
-
•
Early-stop disagreement: is an ERM model and is an early-stopped ERM model. The cost function is KL divergence with softmax.
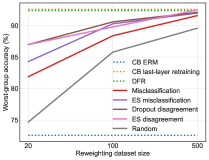
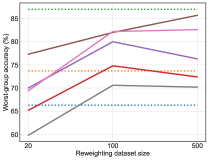
We also experiment with a pure random baseline, referred as Random SELF in Table 4, where consists of random points from . While Random SELF suffers high variance as expected, perhaps surprisingly its performance is still competitive on average. The reweighting dataset size is a hyperparameter, and for disagreement SELF it corresponds to the quantity of class annotations requested. Please see Appendices B and D for hyperparameter details and ablation studies.
5.1 Analysis of SELF performance
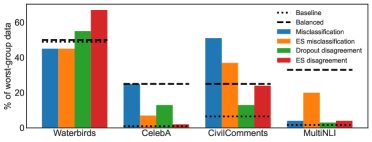
To quantify the extent of SELF’s upsampling, we plot the percentage of the reweighting dataset consisting of worst-group data in Figure 3. In particular, we present to the best of our knowledge the first evidence that model disagreement effectively upsamples worst-group data, an observation which may be of independent interest. With that said, Figure 3 does not formally establish that better group balance has a strong correlation with WGA – rather, it suggests an additional subtlety in the DFR hypothesis, since group balance alone does not fully explain the performance of last-layer retraining. In addition to the balance of the reweighting dataset, it is likely that characteristics of the specific data selected also contribute to SELF results. Additionally, the competitive performance of pure random SELF in Table 4 further questions the importance of group balancing in DFR.
The importance of which data are selected could explain why disagreement SELF often outperforms misclassification SELF despite having access to less information. While misclassification selects the most difficult or noisiest points, disagreement selects the most uncertain points. For example, dropout models approximate a theoretically justified uncertainty metric [16] which is likely to be higher on worst-group data, and early-stopped models tend to fit simple patterns first [2, 41] including the majority group. Training on the most uncertain data is a key tenet of active learning [13, 59, 12], which rationalizes the performance of disagreement SELF and provides motivation for further investigation of why last-layer retraining improves group robustness.
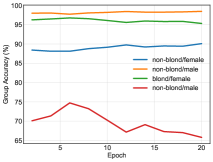
A remaining question is why the performance of disagreement SELF is so strong on CivilComments compared to misclassification-based methods such as JTT [41] and ES misclassification SELF. We show in Figure 6 (deferred to Appendix B) that, contrary to the assumptions made by JTT and other early-stop misclassification methods, the worst-group accuracy decreases with training on CivilComments. This highlights a potential advantage of disagreement methods over misclassification methods, as disagreement is justified regardless of whether the regularized or ERM model has a greater dependence on spurious features. Moreover, while misclassification methods do indeed upsample the minority group in Figure 3, we show in Table 10 (deferred to Appendix B) that the held-out set training accuracy of misclassification SELF tends to be very low – down to on MultiNLI – evidence that misclassifications are too difficult to learn without modifying the features.
Theoretical proof-of-concept.
The observations of Section 5.1 raise the question of whether disagreement SELF can ever be shown to provably upsample minority group points. We provide a simple proof-of-concept for SELF by considering the last layer to be a linear model (which could be under- or overparameterized) with core, spurious and junk features. We show that the disagreement between the regularized model and the ERM model (measured by total variation distance between the predicted distributions) is provably higher on minority examples than majority examples, regardless of model dependence on the spurious feature. In particular, this shows provable benefits of disagreement SELF even in situations where the early-stopped model has higher worst-group accuracy than the convergent model, which may not be captured by related methods in the literature [41]. Our detailed setup, assumptions, and main theoretical result (Theorem 1) are stated in detail in Appendix C.
6 Conclusion
In this paper, we presented a comprehensive examination of the performance of last-layer retraining in the absence of group and class annotations. We showed that class-balanced last-layer retraining is a simple but strong baseline for group robustness, and that holding out a subset of the training data to retrain the last layer can substantially improve worst-group accuracy. We then proposed selective last-layer finetuning (SELF), whose early-stop disagreement version improves performance to near-DFR levels with no group annotations and less than of the held-out class annotations.
Our work has generated several open questions which could prove fruitful for further research. First, why does last-layer retraining on a held-out split of the training dataset improve group robustness (see Section 4.2)? Second, to what extent does the precise data selected matter for reweighting, e.g., which of disagreement SELF and misclassification SELF would perform better when hyperparameters are set to equalize group balance? Third, what is the optimal strategy in general for obtaining the regularized model in disagreement SELF (dropout, early-stopping, or a different technique) and why?
Acknowledgments.
We thank Google Cloud for the gift of compute credits, Jacob Abernethy and Eva Dyer for the additional compute assistance, and anonymous reviewers for their helpful feedback. We also thank Harikrishna Narasimhan for reading an earlier version of the manuscript and providing thoughtful comments and Seokhyeon Jeong for catching an error in an earlier version of the code. T.L. acknowledges support from the DoD NDSEG Fellowship. V.M. acknowledges support from the NSF (through CAREER award CCF-2239151 and award IIS-2212182), an Adobe Data Science Research Award, an Amazon Research Award, and a Google Research Collabs Award.
References
- Arjovsky et al. [2019] Martin Arjovsky, Léon Bottou, Ishaan Gulrajani, and David Lopez-Paz. Invariant risk minimization. arXiv preprint 1907.02893, 2019.
- Arpit et al. [2017] Devansh Arpit, Stanisław Jastrzębski, Nicolas Ballas, David Krueger, Emmanuel Bengio, Maxinder S. Kanwal, Tegan Maharaj, Asja Fischer, Aaron Courville, Yoshua Bengio, and Simon Lacoste-Julien. A closer look at memorization in deep networks. In International Conference on Machine Learning (ICML), 2017.
- Baek et al. [2022] Christina Baek, Yiding Jiang, Aditi Raghunathan, and Zico Kolter. Agreement-on-the-line: Predicting the performance of neural networks under distribution shift. In Conference on Neural Information Processing Systems (NeurIPS), 2022.
- Balcan et al. [2006] Maria-Florina Balcan, Alina Beygelzimer, and John Langford. Agnostic active learning. In International Conference on Machine Learning (ICML), 2006.
- Beery et al. [2018] Sara Beery, Grant van Horn, and Pietro Perona. Recognition in terra incognita. In European Conference on Computer Vision (ECCV), 2018.
- Blodgett et al. [2016] Su Lin Blodgett, Lisa Green, and Brendan O’Connor. Demographic dialectal variation in social media: A case study of African-American English. In Empirical Methods in Natural Language Processing (EMNLP), 2016.
- Borkan et al. [2019] Daniel Borkan, Lucas Dixon, Jeffrey Sorenson, Nithium Thain, and Lucy Vasserman. Nuanced metrics for measuring unintended bias with real data for text classification. In World Wide Web (WWW), 2019.
- Buolamwini and Gebru [2018] Joy Buolamwini and Timnit Gebru. Gender shades: Intersectional accuracy disparities in commercial gender classification. In Conference on Fairness, Accountability, and Transparency in Machine Learning (FATML), 2018.
- Chouldechova [2016] Alexandra Chouldechova. Fair prediction with disparate impact: A study of bias in recidivism prediction instruments. In Conference on Fairness, Accountability, and Transparency in Machine Learning (FATML), 2016.
- Cohn et al. [1994] David Cohn, Les Atlas, and Richard Ladner. Improving generalization with active learning. Machine Learning, 15(2):201–221, 1994.
- Creager et al. [2021] Elliot Creager, Jörn-Henrik Jacobsen, and Richard Zemel. Environment inference for invariant learning. In International Conference on Machine Learning (ICML), 2021.
- Culotta and McCallum [2005] Aron Culotta and Andrew McCallum. Reducing labeling effort for structured prediction tasks. In Conference on Artificial Intelligence (AAAI), 2005.
- Dagan and Engelson [1995] Ido Dagan and Sean P. Engelson. Committee-based sampling for training probabilistic classifiers. In International Conference on Machine Learning (ICML), 1995.
- Devlin et al. [2019] Jacob Devlin, Ming-Wei Chang, Kenton Lee, and Kristina Toutanova. BERT: pre-training of deep bidirectional transformers for language understanding. In North American Association for Computational Linguistics (NAACL), 2019.
- Fort et al. [2020] Stanislav Fort, Gintare Karolina Dziugaite, Mansheej Paul, Sepideh Kharaghani, Daniel M. Roy, and Surya Ganguli. Deep learning versus kernel learning: an empirical study of loss landscape geometry and the time evolution of the neural tangent kernel. In Conference on Neural Information Processing Systems (NeurIPS), 2020.
- Gal and Ghahramani [2016] Yarin Gal and Zoubin Ghahramani. Dropout as a Bayesian approximation: Representing model uncertainty in deep learning. In International Conference on Machine Learning (ICML), 2016.
- Geirhos et al. [2019] Robert Geirhos, Patricia Rubisch, Claudio Michaelis, Matthias Bethge, Felix A. Wichmann, and Wieland Brendel. ImageNet-trained CNNs are biased towards texture; increasing shape bias improves accuracy and robustness. In International Conference on Learning Representations (ICLR), 2019.
- Geirhos et al. [2020] Robert Geirhos, Jörn-Henrik Jacobsen, Claudio Michaelis, Richard Zemel, Wieland Brendel, Matthias Bethge, and Felix A. Wichmann. Shortcut learning in deep neural networks. Nature Machine Intelligence, 2:665–673, 2020.
- Goel et al. [2021] Karan Goel, Albert Gu, Yixuan Li, and Christopher Ré. Model patching: Closing the subgroup performance gap with data augmentation. In International Conference on Learning Representations (ICLR), 2021.
- Gururangan et al. [2018] Suchin Gururangan, Swabha Swayamdipta, Omer Levy, Roy Schwartz, Samuel Bowman, and Noah A. Smith. Annotation artifacts in natural language inference data. In North American Association for Computational Linguistics (NAACL), 2018.
- Hanneke [2014] Steve Hanneke. Theory of Disagreement-Based Active Learning. Foundations and Trends in Machine Learning, 2014.
- Harris et al. [2020] Charles R. Harris, K. Jarrod Millman, Stéfan J. van der Walt, Ralf Gommers, Pauli Virtanen, David Cournapeau, Eric Wieser, Julian Taylor, Sebastian Berg, Nathaniel J. Smith, Robert Kern, Matti Picus, Stephan Hoyer, Marten H. van Kerkwijk, Matthew Brett, Allan Haldane, Jaime Fernández del Río, Mark Wiebe, Pearu Peterson, Pierre Gérard-Marchant, Kevin Sheppard, Tyler Reddy, Warren Weckesser, Hameer Abbasi, Christoph Gohlke, and Travis E. Oliphant. Array programming with NumPy. Nature, 585(1):357–362, 2020.
- Hashimoto et al. [2018] Tatsunori B. Hashimoto, Megha Srivastava, Hongseok Namkoong, and Percy Liang. Fairness without demographics in repeated loss minimization. In International Conference on Machine Learning (ICML), 2018.
- He et al. [2016] Kaiming He, Xiangyu Zhang, Shaoqing Ren, and Jian Sun. Deep residual learning for image recognition. In Conference on Computer Vision and Pattern Recognition (CVPR), 2016.
- Hovy and Søgaard [2015] Dirk Hovy and Anders Søgaard. Tagging performance correlates with author age. In Association for Computational Linguistics (ACL), 2015.
- Hunter [2007] John D. Hunter. Matplotlib: A 2D graphics environment. Computing in Science & Engineering, 9(3):90–95, 2007.
- Idrissi et al. [2022] Badr Youbi Idrissi, Martín Arjovsky, Mohammad Pezeshki, and David Lopez-Paz. Simple data balancing achieves competitive worst-group-accuracy. In Conference on Causal Learning and Reasoning (CLeaR), 2022.
- Izmailov et al. [2022] Pavel Izmailov, Polina Kirichenko, Nate Gruver, and Andrew Gordon Wilson. On feature learning in the presence of spurious correlations. In Conference on Neural Information Processing Systems (NeurIPS), 2022.
- Jastrzębski et al. [2020] Stanisław Jastrzębski, Maciej Szymczak, Stanislav Fort, Devansh Arpit, Jacek Tabor, Kyunghyun Cho, and Krzysztof Geras. The break-even point on optimization trajectories of deep neural networks. In International Conference on Learning Representations (ICLR), 2020.
- Jiang et al. [2022] Yiding Jiang, Vaishnavh Nagarajan, Christina Baek, and J. Zico Kolter. Assessing generalization of SGD via disagreement. In International Conference on Learning Representations (ICLR), 2022.
- Kim et al. [2021] Eungyeup Kim, Jihyeon Lee, and Jaegul Choo. BiaSwap: removing dataset bias with bias-tailored swapping augmentation. In International Conference on Computer Vision (ICCV), 2021.
- Kim et al. [2022] Nayeong Kim, Sehyun Hwang, Sungsoo Ahn, Jaesik Park, and Suha Kwak. Learning debiased classifier with biased committee. In Conference on Neural Information Processing Systems (NeurIPS), 2022.
- Kirichenko et al. [2023] Polina Kirichenko, Pavel Izmailov, and Andrew Gordon Wilson. Last layer re-training is sufficient for robustness to spurious correlations. In International Conference on Learning Representations (ICLR), 2023.
- Koehler et al. [2021] Frederic Koehler, Lijia Zhou, Danica J. Sutherland, and Nathan Srebro. Uniform convergence of interpolators: Gaussian width, norm bounds and benign overfitting. In Conference on Neural Information Processing Systems (NeurIPS), 2021.
- Koh et al. [2021] Pang Wei Koh, Shiori Sagawa, Henrik Marklund, Sang Michael Xie, Marvin Zhang, Akshay Balsubramani, Weihua Hu, Michihiro Yasunaga, Richard Lanas Phillips, Sara Beery, Jure Leskovec, Anshul Kundaje, Emma Pierson, Sergey Levine, Chelsea Finn, and Percy Liang. WILDS: A benchmark of in-the-wild distribution shifts. In International Conference on Machine Learning (ICML), 2021.
- LaBonte [2023] Tyler LaBonte. Milkshake: Quick and extendable experimentation with classification models. http://github.com/tmlabonte/milkshake, 2023.
- LaBonte et al. [2022] Tyler LaBonte, Vidya Muthukumar, and Abhishek Kumar. Dropout disagreement: A recipe for group robustness with fewer annotations. In Conference on Neural Information Processing Systems (NeurIPS) Workshop on Distribution Shifts, 2022.
- LaBonte et al. [2023] Tyler LaBonte, Vidya Muthukumar, and Abhishek Kumar. Saving a split for last-layer retraining can improve group robustness without group annotations. In International Conference on Machine Learning (ICML) Workshop on Spurious Correlations, Invariance, and Stability, 2023.
- Langford et al. [2009] John Langford, Lihong Li, and Tong Zhang. Sparse online learning via truncated gradient. Journal of Machine Learning Research (JMLR), 10(1):777–801, 2009.
- Lee et al. [2023] Yoonho Lee, Huaxiu Yao, and Chelsea Finn. Diversify and disambiguate: Learning from underspecified data. In International Conference on Learning Representations (ICLR), 2023.
- Liu et al. [2021] Evan Zheran Liu, Behzad Haghgoo, Annie S. Chen, Aditi Raghunathan, Pang Wei Koh, Shiori Sagawa, Percy Liang, and Chelsea Finn. Just train twice: Improving group robustness without training group information. In International Conference on Machine Learning (ICML), 2021.
- Liu et al. [2015] Ziwei Liu, Ping Luo, Xiaogang Wang, and Xiaoou Tang. Deep learning face attributes in the wild. In International Conference on Computer Vision (ICCV), 2015.
- Loshchilov and Hutter [2019] Ilya Loshchilov and Frank Hutter. Decoupled weight decay regularization. In International Conference on Learning Representations (ICLR), 2019.
- maintainers and contributors [2016] TorchVision maintainers and contributors. TorchVision: PyTorch’s computer vision library. GitHub, 2016.
- Mansour et al. [2009] Yishay Mansour, Mehryar Mohri, and Afshin Rostamizadeh. Domain adaptation: Learning bounds and algorithms. In Conference on Learning Theory (COLT), 2009.
- McCoy et al. [2019] Tom McCoy, Ellie Pavlick, and Tal Linzen. Right for the wrong reasons: Diagnosing syntactic heuristics in natural language inference. In Association for Computational Linguistics (ACL), 2019.
- Nam et al. [2020] Junhyun Nam, Hyuntak Cha, Sungsoo Ahn, Jaeho Lee, and Jinwoo Shin. Learning from failure: Training debiased classifier from biased classifier. In Conference on Neural Information Processing Systems (NeurIPS), 2020.
- Nam et al. [2022] Junhyun Nam, Jaehyung Kim, Jaeho Lee, and Jinwoo Shin. Spread spurious attribute: Improving worst-group accuracy with spurious attribute estimation. In International Conference on Learning Representations (ICLR), 2022.
- Neyshabur et al. [2014] Behnam Neyshabur, Ryota Tomioka, and Nathan Srebro. In search of the real inductive bias: On the role of implicit regularization in deep learning. arXiv preprint arXiv:1412.6614, 2014.
- Niven and Kao [2019] Timothy Niven and Hung-Yu Kao. Probing neural network comprehension of natural language arguments. In Association for Computational Linguistics (ACL), 2019.
- Oakden-Rayner et al. [2019] Luke Oakden-Rayner, Jared Dunnmon, Gustavo Carneiro, and Christopher Ré. Hidden stratification causes clinically meaningful failures in machine learning for medical imaging. In Conference on Neural Information Processing Systems (NeurIPS) Workshop on Machine Learning for Health, 2019.
- Pagliardini et al. [2023] Matteo Pagliardini, Martin Jaggi, François Fleuret, and Sai Praneeth Karimireddy. Agree to disagree: Diversity through disagreement for better transferability. In International Conference on Learning Representations (ICLR), 2023.
- Paszke et al. [2017] Adam Paszke, Sam Gross, Soumith Chintala, Gregory Chanan, Edward Yang, Zachary DeVito, Zeming Lin, Alban Desmaison, Luca Antiga, and Adam Lerer. Automatic differentiation in PyTorch. In Conference on Neural Information Processing Systems (NeurIPS) Workshop on Automatic Differentiation, 2017.
- Pezeshki et al. [2021] Mohammad Pezeshki, Sékou-Oumar Kaba, Yoshua Bengio, Aaron Courville, Doina Precup, and Guillaume Lajoie. Gradient starvation: A learning proclivity in neural networks. In Conference on Neural Information Processing Systems (NeurIPS), 2021.
- Qiu et al. [2023] Shikai Qiu, Andres Potapczynski, Pavel Izmailov, and Andrew Gordon Wilson. Simple and fast group robustness by automatic feature reweighting. In International Conference on Machine Learning (ICML), 2023.
- Rosenfeld et al. [2018] Amir Rosenfeld, Richard Zemel, and John K. Tsotsos. The elephant in the room. arXiv preprint 1808.03305, 2018.
- Russakovsky et al. [2015] Olga Russakovsky, Jia Deng, Hao Su, Jonathan Krause, Sanjeev Satheesh, Sean Ma, Zhiheng Huang, Andrej Karpathy, Aditya Khosla, Michael Bernstein, Alexander C. Berg, and Li Fei-Fei. ImageNet large scale visual recognition challenge. International Journal of Computer Vision (IJCV), 115(1):211–252, 2015.
- Sagawa et al. [2020] Shiori Sagawa, Pang Wei Koh, Tatsunori B. Hashimoto, and Percy Liang. Distributionally robust neural networks for group shifts: On the importance of regularization for worst-case generalization. In International Conference on Learning Representations (ICLR), 2020.
- Scheffer et al. [2001] Tobias Scheffer, Christian Decomain, and Stefan Wrobel. Active hidden markov models for information extraction. In International Conference on Advances in Intelligent Data (CAIDA), 2001.
- Shah et al. [2020] Harshay Shah, Kaustav Tamuly, Aditi Raghunathan, Prateek Jain, and Praneeth Netrapalli. The pitfalls of simplicity bias in neural networks. In Conference on Neural Information Processing Systems (NeurIPS), 2020.
- Shetty et al. [2019] Rakshith Shetty, Bernt Schiele, and Mario Fritz. Not using the car to see the sidewalk: Quantifying and controlling the effects of context in classification and segmentation. In Conference on Computer Vision and Pattern Recognition (CVPR), 2019.
- Singla and Feizi [2022] Sahil Singla and Soheil Feizi. Salient ImageNet: how to discover spurious features in deep learning? In International Conference on Learning Representations (ICLR), 2022.
- Sohoni et al. [2020] Nimit S. Sohoni, Jared A. Dunnmon, Geoffrey Angus, Albert Gu, and Christopher Ré. No subclass left behind: Fine-grained robustness in coarse-grained classification problems. In Conference on Neural Information Processing Systems (NeurIPS), 2020.
- Sohoni et al. [2022] Nimit S. Sohoni, Maziar Sanjabi, Nicolas Ballas, Aditya Grover, Shaoliang Nie, Hamed Firooz, and Christopher Ré. BARACK: partially supervised group robustness with guarantees. In International Conference on Machine Learning (ICML) Workshop on Spurious Correlations, Invariance, and Stability, 2022.
- Srivastava et al. [2014] Nitish Srivastava, Geoffrey Hinton, Alex Krizhevsky, Ilya Sutskever, and Ruslan Salakhutdinov. Dropout: A simple way to prevent neural networks from overfitting. Journal of Machine Learning Research, 15(1):1929–1958, 2014.
- Taghanaki et al. [2022] Saeid Asgari Taghanaki, Aliasghar Khani, Fereshte Khani, Ali Gholami, Linh Trana, Ali Mahdavi-Amiri, and Ghassan Hamarneh. MaskTune: mitigating spurious correlations by forcing to explore. In Conference on Neural Information Processing Systems (NeurIPS), 2022.
- Tatman [2017] Rachael Tatman. Gender and dialect bias in YouTube’s automatic captions. In Association for Computational Linguistics (ACL) Workshop on Ethics in Natural Language Processing, 2017.
- Vapnik [1998] Vladimir Vapnik. Statistical Learning Theory. Wiley, 1998.
- Wah et al. [2011] Catherine Wah, Steve Branson, Peter Welinder, Pietro Perona, and Serge Belongie. The Caltech-UCSD birds-200-2011 dataset. Technical report, California Institute of Technology, 2011.
- Wei et al. [2022] Jiaheng Wei, Harikrishna Narasimhan, Ehsan Amid, Wen-Sheng Chu, Yang Liu, and Abhishek Kumar. Distributionally robust post-hoc classifiers under prior shifts. In The Eleventh International Conference on Learning Representations, 2022.
- Welinder et al. [2010] Peter Welinder, Steve Branson, Takeshi Mita, Catherine Wah, Florian Schroff, Serge Belongie, and Pietro Perona. Caltech-UCSD birds 200. Technical report, California Institute of Technology, 2010.
- William Falcon and the PyTorch Lightning maintainers and contributors [2019] William Falcon and the PyTorch Lightning maintainers and contributors. PyTorch Lightning. GitHub, 2019.
- Williams et al. [2018] Adina Williams, Nikita Nangia, and Samuel Bowman. A broad-coverage challenge corpus for sentence understanding through inference. In North American Association for Computational Linguistics (NAACL), 2018.
- Wolf et al. [2020] Thomas Wolf, Lysandre Debut, Victor Sanh, Julien Chaumond, Clement Delangue, Anthony Moi, Pierric Cistac, Tim Rault, Remi Louf, Morgan Funtowicz, Joe Davison, Sam Shleifer, Patrick von Platen, Clara Ma, Yacine Jernite, Julien Plu, Canwen Xu, Teven Le Scao, Sylvain Gugger, Mariama Drame, Quentin Lhoest, and Alexander Rush. Transformers: State-of-the-art natural language processing. In Conference on Empirical Methods in Natural Language Processing (EMNLP) System Demonstrations, 2020.
- Xiao et al. [2021] Kai Yuanqing Xiao, Logan Engstrom, Andrew Ilyas, and Aleksander Mądry. Noise or signal: The role of image backgrounds in object recognition. In International Conference on Learning Representations (ICLR), 2021.
- Xu et al. [2022] Yilun Xu, Hao He, Tianxiao Shen, and Tommi Jaakkola. Controlling directions orthogonal to a classifier. In International Conference on Learning Representations (ICLR), 2022.
- Yaghoobzadeh et al. [2021] Yadollah Yaghoobzadeh, Soroush Mehri, Remi Tachet, T.J. Hazen, and Alessandro Sordoni. Increasing robustness to spurious correlations using forgettable examples. In European Association for Computational Linguistics (EACL), 2021.
- Yang et al. [2022] Yao-Yuan Yang, Chi-Ning Chou, and Kamalika Chaudhuri. Understanding rare spurious correlations in neural networks. arXiv preprint 2202.05189, 2022.
- Zech et al. [2018] John R. Zech, Marcus A. Badgeley, Manway Liu, Anthony B. Costa, Joseph J. Titano, and Eric Karl Oermann. Variable generalization performance of a deep learning model to detect pneumonia in chest radiographs: A cross-sectional study. PLoS Medicine, 15:e1002683, 2018.
- Zhang et al. [2022a] Jianyu Zhang, David Lopez-Paz, and Léon Bottou. Rich feature construction for the optimization-generalization dilemma. In International Conference on Machine Learning (ICML), 2022a.
- Zhang et al. [2022b] Michael Zhang, Nimit S. Sohoni, Hongyang R. Zhang, Chelsea Finn, and Christopher Ré. Correct-n-contrast: A contrastive approach for improving robustness to spurious correlations. In International Conference on Machine Learning (ICML), 2022b.
- Zhou et al. [2020] Lijia Zhou, Danica J. Sutherland, and Nathan Srebro. On uniform convergence and low-norm interpolation learning. In Conference on Neural Information Processing Systems (NeurIPS), 2020.
- Zhu et al. [2015] Yukun Zhu, Ryan Kiros, Rich Zemel, Ruslan Salakhutdinov, Raquel Urtasun, Antonio Torralba, and Sanja Fidler. Aligning books and movies: Towards story-like visual explanations by watching movies and reading books. In International Conference on Computer Vision (ICCV), 2015.
Appendix Outline
The appendix is organized as follows. In Appendix A we include additional experiments for Sections 3 and 4. In Appendix B we include additional experiments for Section 5. In Appendix C we include the statement and proof of our theoretical proof-of-concept (Theorem 1). In Appendix D we describe in detail our training procedure and hyperparameters. Appendix E include tables to accompany the figures in the main paper. Finally, Appendix F discusses broader impacts, limitations, and compute.
Appendix A Additional experiments for Sections 3 and 4
| Method | Held-out dataset included | Worst-group test accuracy | |||
|---|---|---|---|---|---|
| Waterbirds | CelebA | CivilComments | MultiNLI | ||
| CU ERM | ✗ | ||||
| CB ERM | ✗ | ||||
| CU ERM | ✓ | ||||
| CB ERM | ✓ | ||||
| Last-layer retraining method | Worst-group test accuracy | |||
|---|---|---|---|---|
| Waterbirds | CelebA | CivilComments | MultiNLI | |
| Class-unbalanced | ||||
| Class-balanced sampling | ||||
| Class-balanced subset | ||||
| Group-balanced sampling | ||||
| Group-balanced subset | ||||
| DFR [33, 28] | ||||
| Method | Worst-group test accuracy | |||
|---|---|---|---|---|
| Waterbirds | CelebA | CivilComments | MultiNLI | |
| CB ERM | ||||
| CB last-layer retraining on training dataset | ||||
| CB last-layer retraining on held-out dataset | ||||
| Method | Group Anns | Average test accuracy | |||
|---|---|---|---|---|---|
| Waterbirds | CelebA | CivilComments | MultiNLI | ||
| ERM | ✗ | ||||
| CB last-layer retraining | ✗ | ||||
| ES disagreement SELF | ✗ | ||||
| DFR (our impl.) | ✓ | ||||
Appendix B Additional experiments for Section 5
In this section we include the detailed results of additional experiments for Section 5.
| Method | Worst-group test accuracy | |||
|---|---|---|---|---|
| Waterbirds | CelebA | CivilComments | MultiNLI | |
| KL divergence | ||||
| Total variation distance | ||||
| Method | Held-out training accuracy | |||
|---|---|---|---|---|
| Waterbirds | CelebA | CivilComments | MultiNLI | |
| Random SELF | ||||
| Misclassification SELF | ||||
| ES Misclassification SELF | ||||
| Dropout Disagreement SELF | ||||
| ES Disagreement SELF | ||||
Appendix C Theoretical proof-of-concept for disagreement SELF
In tthis section, we describe and state our main theoretical proof-of-concept of disagreement SELF (Theorem 1). We begin with a description of our setup and assumptions.
Setup.
Let be the data domain, be the sample size, and be the number of features. For and weights we assume that the learned predictor of both the ERM and regularized models takes the form
| (2) |
and assume that the label is generated by (i.e., zero label noise). Note that this specific split of features into core, spurious, and junk categories is an extension of a common simplified setting in the literature on overparameterized linear models [82, 34], where only core and junk features are considered and only in-distribution accuracy is analyzed. We also consider the domain to be partitioned into a minority group and majority group such that for all and for all . (By definition, for any .)
Assumptions on the feature learning process.
We make some extra simplifying assumptions on the feature learning process that are motivated by empirical observations in the literature. First, we assume that the learned features are identical for the regularized and ERM models, and are only weighted differently in the last layer. This assumption is well-justified for dropout disagreement SELF since we only use dropout for inference in the last layer (with frozen features), and for early-stop disagreement SELF since feature learning has empirically been observed to occur during the initial phase of training [29, 15]. More concretely, we consider the ERM model to have weights and , and the regularized model to have weights and . Second, we assume that weights on the core and spurious features are normalized such that , essentially positing that the proportion of junk feature strength is the same in both ERM and regularized models. This is also justified by the empirical observation that regularization methods such as early stopping make minimal difference to in-distribution accuracy [49].
Main result.
The following result compares a minority group test example and a majority group test example with features that are equal in magnitude, and shows that the disagreement is higher for minority group points regardless of whether the ERM or regularized model weights the spurious feature higher. We will use the total variation distance (TVD) as our cost function for disagreement SELF. We focus on TVD instead of KL divergence to simplify the proof; we show in Table 9 (detailed in Appendix B) that the empirical results are competitive using TVD (though worse on CelebA). We show that the difference of the TVD terms is proportional to , illustrating that the models disagree more drastically the greater the discrepancy between their dependence on the spurious feature (or, equivalently, the core feature).
Theorem 1 (Disagreement SELF).
Consider two examples and which have the same labels and whose features have the same magnitude, i.e., , , and . Let and be distributions over which take value with probability and respectively, and likewise for and .777These are the estimated distributions we use to classify the inputs. Then, we have
| (3) |
Appendix D Training details
We utilize a ResNet-50 [24] pretrained on ImageNet-1K [57] for the vision tasks and a BERT [14] model pretrained on Book Corpus [83] and English Wikipedia for the language tasks. These pretrained models are used as the initialization for ERM on the four datasets we study. We use standard ImageNet normalization with standard flip and crop data augmentation for the vision tasks and BERT tokenization for the language tasks [28]. Our implementation uses the following packages: NumPy [22], PyTorch [53], Lightning [72], TorchVision [44], Matplotlib [26], Transformers [74], and Milkshake [36].
For ERM and last-layer retraining (Section 4), we do not vary any hyperparameters; their fixed values are listed in Table 11. Recall that our SELF method (Section 5) splits the validation dataset in half, using the first half as a held-out dataset for selecting reweighting points and the second half for model selection [33, 28]. We vary the reweighting dataset size (the number of points selected from the held-out dataset) in the range . For the vision datasets, we search over learning rates and train for steps. For the language datasets, we search over learning rates and train for steps. For the two early-stopping methods, we search over checkpoints saved at , , and of model training, while for dropout disagreement, we search over dropout probabilities of , , and applied only at the last layer. See Appendix B for additional ablation studies.
| Dataset | Optimizer | Initial LR | LR schedule | Batch size | Weight decay | Epochs |
|---|---|---|---|---|---|---|
| Waterbirds | SGD | Cosine | ||||
| CelebA | SGD | Cosine | ||||
| CivilComments | AdamW [43] | Linear | ||||
| MultiNLI | AdamW [43] | Linear |
Appendix E Additional tables
In this section we provide results in a tabular form to accompany figures in the main paper.
| Percent of worst-group data included | Worst-group test accuracy | |||
|---|---|---|---|---|
| Waterbirds | CelebA | CivilComments | MultiNLI | |
| Percent of worst-group data included | Percent of max WGA increase over ERM | |||
|---|---|---|---|---|
| Waterbirds | CelebA | CivilComments | MultiNLI | |
| Method | Held-out dataset included | Worst-group test accuracy | |||
|---|---|---|---|---|---|
| Waterbirds | CelebA | CivilComments | MultiNLI | ||
| CB ERM | ✗ | ||||
| CB last-layer retraining | ✗ | ||||
| CB ERM | ✓ | ||||
| CB last-layer retraining | ✓ | ||||
| Method | WGA/Percent of worst-group data | |||
|---|---|---|---|---|
| Waterbirds | CelebA | CivilComments | MultiNLI | |
| Baseline | ||||
| Misclassification | ||||
| ES misclassification | ||||
| Dropout disagreement | ||||
| ES disagreement | ||||
| Balanced | ||||
| ERM class balancing | Last-layer retraining class balancing | Worst-group test accuracy | |||
|---|---|---|---|---|---|
| Waterbirds | CelebA | CivilComments | MultiNLI | ||
| ✗ | ✗ | ||||
| ✓ | ✗ | ||||
| ✗ | ✓ | ||||
| ✓ | ✓ | ||||
Appendix F Broader impacts, limitations, and compute
Broader impacts. We hope our work contributes to the safe and equitable application of machine learning and motivates further research in ML fairness. A potential negative outcome may arise if practitioners assume their models are bias-free after applying our techniques; while we show reduced dependence on spurious correlations, no method can completely alleviate the issue, and other modes of bias may exist. We encourage practitioners to conduct rigorous examinations of model fairness.
Limitations. Our methods take advantage of the specificity of the spurious correlation setting, and therefore would likely underperform on datasets which exhibit a more extreme complete correlation (i.e., contain zero minority group data) [52, 40]. Furthermore, following previous work in this setting [58, 41, 48, 33, 28], SELF utilizes a small validation dataset with group annotations for model selection. While we show in Appendix B that SELF is robust to using as few as 1% of these annotations, and our last-layer retraining method (Section 4) does not require them, completely removing this assumption is an important direction for future research.
Compute. Our experiments were conducted on Nvidia Tesla V100 and A5000 GPUs. We used about in compute credits in the course of this research. We believe this paper could be reproduced for under in credits, and a majority of this compute would go towards the ablation studies. With that said, our last-layer retraining methods only train the linear classifier, making them cheap and efficient to run even on older hardware.