Photo-induced reversible modification of the Curie-Weiss temperature in paramagnetic gadolinium compounds
Abstract
Gadolinium oxyhydride GdHO is a photochromic material that darkens under illumination and bleaches back by thermal relaxation. As an inorganic photochromic material that can be easily deposited by magnetron sputtering, GdHO has very interesting potential applications as a functional material, specially for smart glazing applications. However, the underlying reasons behind the photochromic mechanism–which can be instrumental for the correct optimisation of GdOH for different applications–are not completely understood. In this paper, we rely on the well-stablished magnetic properties of Gd3+ to shed light on this matter. GdOH thin films present paramagnetic behaviour similar to other Gd3+ compounds such as Gd2O3. Illumination of the films result in a reversible increase of the Curie-Weiss temperature pointing to RKKY interactions, which is consistent with the resistivity decrease observed in the photo-darkened films.
Single anion compounds, e.g. oxides, nitrides, fluorides, have been extensively studied during the past decades and play a cornerstone role in today’s technological development. In contrast, multiple-anion compounds, that is, materials in which two or more anions coexist in a single phase, e.g. oxyhydrides, have been barely explored Kageyama et al. (2018). Some notable examples of oxyhydrides include LaHO Ooya et al. (2021); Malaman and Brice (1984), NdHO Kutsuzawa et al. (2019); Widerøe et al. (2011), YHO Zapp et al. (2019) and GdHO Ueda et al. (2018). According to Kageyama et al. Kageyama et al. (2018), due to the flexibility resulting from the introduction of different anions, oxyhydrides (and mixed anions in general) can constitute a scaffolding upon which future functional materials exhibiting new or enhanced properties [sic] can be built. This idea is supported by the rare-earth (e.g. Dy, Er, Gd, La, Y) oxyhydride family , which has arisen in recent years as a new group of materials exhibiting photochromic Nafezarefi et al. (2017), luminescent Ueda et al. (2018) and photocatalytic properties Ooya et al. (2021).
Rare-earth oxyhydrides are positive T-type photochromic materials that is, they darken upon illumination and bleach by thermal relaxation. Photochromism in oxyhydrides has attracted attention due to its potential industrial applications for, e.g., the fabrication of photochromic smart windows, given their superiority in certain technological aspects when compared with conventional photochromic materials. Photochromic oxyhydrides can be easily fabricated in thin film form by magnetron sputtering Montero et al. (2018), which gives them a huge advantage over the popular photochromic silver halides and, in addition, are inorganic and thus presumably more resilient to harsh conditions (particularly to high UV doses) than the photochromic organic dyes commonly used by the industry nowadays Towns (2016).
Understanding the cause of the photochromic response in rare-earth oxyhydrides is of crucial importance towards a practical application of such compounds. Unfortunately, the underlying physico-chemical reasons behind the photochromic mechanism are not completely understood. There is, however, a consensus that points to the formation during illumination of metallic-like domains in the oxyhydride lattice Montero et al. (2017); Komatsu et al. (2022); Wu et al. (2022), a phenomenon that is accompanied by persistent photoconductivity You et al. (2019). It is also known that the lattice of these oxyhydrides contracts under illumination, and it relaxes back to the original state during bleaching Baba et al. (2020).
At this point, it is natural to wonder how these structural and electronic changes induced by illumination affect the magnetic properties of rare-earth oxyhydride thin films and what can we learn about the photochromic mechanism from a magnetic perspective. Accordingly, among different rare-earths oxyhydrides, in this work we have selected GdOH. Our choice is based on the electronic configuration of Gd3+, i.e., Xe, which endows Gd3+ with a large magnetic moment. If we assume Gd3+ to govern the magnetic behaviour of gadolinium oxyhydride compounds – of stoichiometry GdOxHy but to which we will refer in the text as GdOH for simplicity – then we expect a paramagnetic behaviour and a reasonable agreement to the Curie-Weiss law. This paper aims to answer the following questions: (i) how does the magnetic susceptibility of GdOH thin films looks like and how does it compare with corresponding to other closely related compounds, namely GdH2 and Gd2O3? (ii) How does illumination affects in GdOH and what can we learn about the photochromic mechanism from it?
For our purpose, GdHO thin films were prepared by a two-stage synthesis process as described elsewhere Nafezarefi et al. (2017); Montero et al. (2018). This process comprises the deposition of GdH2 films by reactive magnetron sputtering onto glass substrates under conditions that result in a porous structure that allows for the quick incorporation of oxygen, and hence the formation of GdOH, once the films are exposed to air Zubkins et al. (2022). In our case the conditions were 8.6 mbar for base pressure, 6 mbar for working pressure (40 sccm and 12 sccm Ar and H2 flow, respectively) and 100 W power applied to a 2 inch. diameter Gd target (TREM 99.6 %, Gd/TREM 99.9 %). The thickness of each sample was determined by a Bruker DektakXT stylus profilometer using the step between film and substrate.
The magnetic susceptibility of the obtained GdOH films (before and after illumination) was determined in a Magnetic Properties Measurement System MPMS (Quantum Design), between 5 K and 150 K in a field of 50 mT. For this measurement the films were cut in pieces of area 0.40.4 cm2. The uncoated substrate (glass) was measured in the same temperature range applying 1 T and the obtained results used for the diamagnetic correction of the measurements. For the optical and structural properties of the GdOH films before and after illumination see Supplemental Material sup , which includes Refs Colombi et al. (2020); Baba et al. (2020); Li (2013).
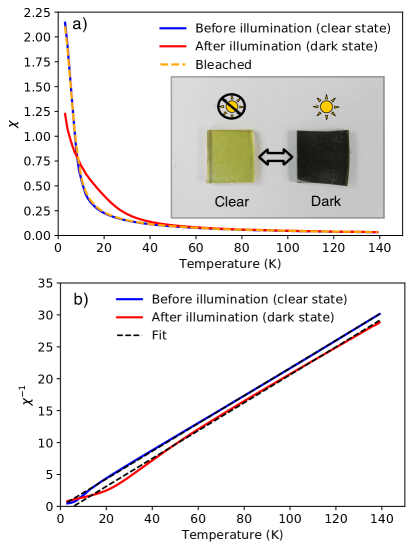
Figure 1 (a) depicts the magnetic susceptibility corresponding to a clear, photodarkened (dark state) and recovered (bleached) GdHO sample (approx. 1.0 -thick). The photodarkened state was obtained after 15 h illumination (wavelength , power 27 mW/cm2) and the bleached state was measured after allowing the films to bleach during several weeks, knowing that the actual bleaching time is considerably shorter Colombi et al. (2021). Inset in Figure 1 (a) shows photographs of two fragments of the same GdHO sample before and after illumination. The change in luminous transmittance of the film before/after illumination is 50 % sup . Since susceptibility studies of the photodarkened state have to be done ex-situ, risk of partial bleaching during measurement exists. However, we assume that in a helium gas atmosphere and at low temperature (the experimental conditions) the recovery is negligible. In any case, vs. curves were measured from low to high and from high to low , resulting in perfect match, which confirms that the photodarkened sample has not changed during the measurement. The data presented in Figure 1 corresponds to measurements performed exactly in the same fragment of sample in the clear, dark and bleached state.
From Fig. 1 (a) we can infer that (i) gadolinium oxyhydride shows a paramagnetic behaviour and (ii), illumination affects in gadolinium oxyhydride, specially at low temperatures. It is also important to note that the change is reversible, since the vs. curve recovers its initial shape after bleaching.
According to the Curie-Weiss law, can be written as a function of the temperature as follows:
| (1) |
being the Curie constant and the Curie-Weiss temperature. is related to the effective magnetic moment per ion by:
| (2) |
where is the Boltzmann constant, the vacuum magnetic permeability, the Bohr magneton and the number or magnetic ions (i.e., in our case Gd3+) contained in the sample.
The parameters and can, according to Equation 1, be obtained by fitting vs. , see Figure 1 (b). The curve corresponding to the bleached sample is not shown in Figure 1 (b) for simplification, since it overlaps with the one corresponding to the clear state. Note that we have selected to fit vs. rather than vs. . In this way the weight of the fitting moves towards higher temperatures where the compliance with the Curie-Weiss law is best Mugiraneza and Hallas (2022). In fact, we can observe in Figure 1 (b) how deviates from the Curie-Weiss law at low temperatures, the deviation being more important when the sample is in the photodarkened state.
The reversible increase observed in in the photodarkened samples (ferromagnetic interaction) can be tentatively explained by the increase in electrical conductivity after illumination reported in GdHO films Colombi et al. (2023), and hence the possible exchange interaction between conduction electrons and 4f electrons according to the RKKY interaction model, as often reported in GdHx compounds Yayama and Tomokiyo (1992). This is consistent with the study of the sheet resistance of our samples as performed in an AIT-CMT-SR200N four-point prove instrument before and after illumination. Before illumination, the sheet resistance corresponding 1.0 m-thick GdOH films was out of range of our instrument (which according to the manufacturer’s specifications, corresponds to values above 2 MOhm/sq). In the photodarkened films, however, the sheet resistance dropped to the kOhm/sq range, although repeated measurements presented a large standard deviation (7.0 3.0 kOhm/sq).
can be estimated from the volume of each sample and the density of GdOH. Thus, by inserting in Equation 2, we can calculate from the value of obtained from the fitting shown in Figure 1 (b). However, the situation is not straightforward because the samples are thin films prepared by sputtering in a porous deposition regime, and hence less dense than bulk. Moreover GdOH, due to its mixed-anion nature, has a flexible stoichiometry and, what is worse, can contain other phases (particularly amorphous Gd2O3). In any case, we can assume that the actual density of our samples must lie between that of GdH2 and Gd2O3. Accordingly, in Table 1 we report calculated using the density of Gd2O3 and GdH2 taken from the data contained in their respective International Centre of Diffraction Data ICDD-pdf cards num. 00-120797 and 00-050-1107 and the density estimated for GdHO by Colombi et al. Colombi et al. (2020). Irrespectively of the density chosen, the obtained values of are in reasonable agreement with experimental ( = 7.90 ) and theoretical ( = 7.94 ) values for Gd3+ Mugiraneza and Hallas (2022).
The data presented in Figure 1 corresponds to a sample of approximate thickness of 1.0 , labeled as S1 in Table 1. The data corresponding to an additional sample, S2, of thickness is also presented in Table 1. The data corresponding to the photodarkened state was collected after irradiating S1 and S2 with a 365 nm-light source (27 mW/cm2) during 15 and 19 h, respectively. Note that, contrary to the case of S1, the clear and dark state of S2 have not been measured in the same fragment, but in different fragments of the same sample, and hence errors arising from different areas and sample inhomogeneity may occur.
Over 16 measurements were performed on different samples under different illumination conditions, always with the same outcome: increase of after illumination. A preliminary observation suggests that there is a direct relation between illumination time and change in . However the experimental limitations of the present study– inhomogeneity of lamp beam and sample size differences– prevent us from making any definite conclusion in this respect. All measurements confirm qualitatively the results presented in Figure 1 and Table 1, namely the increase in after illumination.
| Sample | (m) | (K) | |||
|---|---|---|---|---|---|
| S1-Clear | 1.0 | 0.15 | 8.46 | 8.13 | 8.35 |
| S1-Dark | 1.0 | 5.63 | 8.44 | 8.10 | 8.33 |
| S1-Bleach | 1.0 | 0.19 | 8.53 | 8.19 | 8.42 |
| S2-Clear | 0.5 | 0.37 | 8.1 | 7.78 | 8.00 |
| S2-Dark | 0.5 | 10.36 | 7.99 | 7.67 | 7.89 |
In Figure 2, vs curves corresponding to GdHO (sample S2) in the clear and photodarkened state are compared to those of Gd2O3 and GH2.01 as reported by Mugiraneza et al. Mugiraneza and Hallas (2022) and Wallace et al. Wallace et al. (1963), respectively. Note that for convenience when comparing with literature data, the susceptibility in Figure 2 is given in molar units, being molN the product of the number of moles times the number of magnetic ions per formula unit Mugiraneza and Hallas (2022).
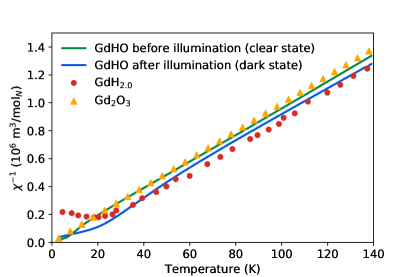
Figure 2 is conveniently discussed in light of the magnetic properties of the Gd–H system Wallace et al. (1963): metallic Gd exhibits strong ferromagnetic properties, whereas fully hydrogenated GdH3 exhibits no tendency to magnetic ordering. Thus, according to Wallace et al. Wallace et al. (1963), the interactions between 4f electrons must occur trough delocalised conduction electrons which, while abundant in metallic Gd, are absent in fully hydrogenated GdH3. Similarly to GdH3, the oxide Gd2O3 has no conduction electrons Mugiraneza and Hallas (2022) and thus behaves as a paramagnet, see Figure 2. As ferromagnetic Gd metal is hydrogenated and Gd hydride is formed, conducting electrons are trapped in the hydride anion H-. Consequently, the free electron concentration is reduced, which causes a decrease of the saturated magnetic moment Yayama and Tomokiyo (1992). At stoichiometries GdHx, with in the range , although from an optical perspective the material still behaves as a metal Colombi et al. (2020), the behaviour is very different from a magnetic point of view. In this stoichiometry range an antiferromagnetic transition is usually reported at a temperature K Wallace et al. (1963); Yayama and Tomokiyo (1992), above which the the material follows the Curie-Weiss law, as illustrated in Figure 2 by GdH2. In particular, for the case of GdH2.0, Wallace et al. Wallace et al. (1963) report a Neél temperature = 21 K, = 3.0 K and = 7.7 (our analysis carried out in their digitised data resulted in = 7.9 and = 6.0 K). Our study of the digitised data provided by Yayama et al. Yayama and Tomokiyo (1992) for GdH2 (not shown), resulted in = 7.9 and = 6.20 K. We note that, although Gd cations in GH2 are in the oxidation state Gd2+, is governed by the electrons, whereas the extra delocalised electron is the cause of exchange interactions that affect .
In light of the study of the literature, our results can be interpreted as follows: before illumination GdHO is highly resistive and contains no free electrons Colombi et al. (2023); Miniotas et al. (2000), thus behaving as a paramagnet similar to Gd2O3, Figure 2. On the other hand, as observed by Colombi Colombi et al. (2023), and in agreement with our sheet resistance measurements, the free electron concentration is larger in photodarkened GdHO films, and hence the emergence of ferromagnetic interactions reflected in the increase of presented in Table 1. As a consequence, the curve vs. corresponding to GdHO in the photodarkened state is similar to the one corresponding to GdH2, Figure 2. As stated before, this is because in both GH2 and photodarkened GdHO the magnetic properties are governed by the electrons, although the exchange interactions caused by the conducting electrons need to be considered. We note that the results from temperature dependent susceptibility measurements for the photodarkened state do not reveal the signature of an antiferromagnetic transition, instead a broad feature in vs. is observed (cf. Figure 1 (a)). A likely explanation for this is that the RKKY interactions, considering both nearest neighbour and next-nearest neighbour interactions, include both ferro- and antiferromagnetic interactions. The existence of both ferro- and antiferromagnetic interactions may explain why previous studies of GdH2.0 report an antiferromagnetic transition at the same time as reporting a positive value Wallace et al. (1963).
A likely cause of the increase of free electron density after illumination in GdHO is the reduction of some Gd3+ cations to Gd2+ Colombi et al. (2023). This hypothesis is in agreement with our observations, since it will allow the slope of the vs. T curve to remain unaltered before and after illumination. The photoreduction of Gd3+ to Gd2+ would result in an increase of in the dark state, which explains the observations in Figures 1, 2, and Table 1. We cannot rule out, however, other causes behind the increment of free carriers after illumination.
Conclusions
The magnetic susceptibility of the GdHO films in the clear state correspond to that of a paramagnetic material, very similar to Gd2O3, with an effective magnetic moment per ion of 7.9 , as expected for Gd3+ compounds. Illumination causes the emergence of persistent magnetic exchange interactions, which lead to an increase of the Curie-Weiss temperature when compared to the initial transparent state. These magnetic exchange interactions, which disappear when the GdHO films are allowed to relax back to the transparent state, point to the formation of metallic domains occurring upon photorreduction of some Gd3+ cations into Gd2+. However, the formation of Gd2+ cannot be directly inferred from the determination of the effective magnetic moment which is governed by the electrons in both Gd3+ and Gd2+.
Acknowledgements
This work has been supported by the Swedish Energy Agency E2B2 Project Ref. P2022-00859. J. M. is grateful to Dr. H. Stopfel for helping in operating the MPMS and to Dr. R. Mathieu for the fruitful discussions.
References
- Kageyama et al. (2018) H. Kageyama, K. Hayashi, K. Maeda, J. P. Attfield, Z. Hiroi, J. M. Rondinelli, and K. R. Poeppelmeier, Nat. Commun. 9, 1 (2018).
- Ooya et al. (2021) K. Ooya, J. Li, K. Fukui, S. Iimura, T. Nakao, K. Ogasawara, M. Sasase, H. Abe, Y. Niwa, M. Kitano, and H. Hosono, Adv. Energy Mater. 11, 2003723 (2021).
- Malaman and Brice (1984) B. Malaman and J. Brice, J. Solid State Chem. 53, 44 (1984).
- Kutsuzawa et al. (2019) D. Kutsuzawa, Y. Hirose, Y. Sugisawa, J. Kikuda, D. Sekiba, and T. Hasegawa, Phys. Rev. Mater. 3, 044408 (2019).
- Widerøe et al. (2011) M. Widerøe, H. Fjellvåg, T. Norby, F. Willy Poulsen, and R. Willestofte Berg, J. Solid State Chem. 184, 1890 (2011).
- Zapp et al. (2019) N. Zapp, H. Auer, and H. Kohlmann, Inorg. Chem. 58, 14635 (2019).
- Ueda et al. (2018) J. Ueda, S. Matsuishi, T. Tokunaga, and S. Tanabe, J. Mater. Chem. C 6, 7541 (2018).
- Nafezarefi et al. (2017) F. Nafezarefi, H. Schreuders, B. Dam, and S. Cornelius, Appl. Phys. Lett. 111, 103903 (2017).
- Montero et al. (2018) J. Montero, F. A. Martinsen, M. Lelis, S. Z. Karazhanov, B. C. Hauback, and E. S. Marstein, Sol. Energy Mater. Sol. Cells 177, 106 (2018).
- Towns (2016) A. D. Towns, “Applied Photochemistry,” (Springer, Chem, 2016) Chap. 5. Industrial Photochromism, pp. 227–279.
- Montero et al. (2017) J. Montero, F. A. Martinsen, M. García-Tecedor, S. Z. Karazhanov, D. Maestre, B. Hauback, and E. S. Marstein, Phys. Rev. B 95, 201301 (2017).
- Komatsu et al. (2022) Y. Komatsu, R. Shimizu, R. Sato, M. Wilde, K. Nishio, T. Katase, D. Matsumura, H. Saitoh, M. Miyauchi, J. R. Adelman, et al., Chem. Mater. 34, 3616 (2022).
- Wu et al. (2022) Z. Wu, T. de Krom, G. Colombi, D. Chaykina, G. van Hattem, H. Schut, M. Dickmann, W. Egger, C. Hugenschmidt, E. Brück, B. Dam, and S. W. H. Eijt, Phys. Rev. Mater. 6, 065201 (2022).
- You et al. (2019) C. C. You, T. Mongstad, E. S. Marstein, and S. Z. Karazhanov, Materialia 6, 100307 (2019).
- Baba et al. (2020) E. M. Baba, J. Montero, E. Strugovshchikov, E. O. Zayim, and S. Karazhanov, Phys. Rev. Mater. 4, 025201 (2020).
- Zubkins et al. (2022) M. Zubkins, I. Aulika, E. Strods, V. Vibornijs, L. Bikse, A. Sarakovskis, G. Chikvaidze, J. Gabrusenoks, H. Arslan, and J. Purans, Vacuum 203, 111218 (2022).
- (17) “See supplemental material at [url will be inserted by publisher] for the optical and structural properties of the gdoh films before and after illumination.” .
- Colombi et al. (2020) G. Colombi, S. Cornelius, A. Longo, and B. Dam, J. Phys. Chem. C 124, 13541 (2020).
- Li (2013) S. Li, VO2-based Thermochromic and Nanothermochromic Materials for Energy Efficient Windows, Ph.D. thesis, Uppsala University (2013).
- Colombi et al. (2021) G. Colombi, T. De Krom, D. Chaykina, S. Cornelius, S. W. H. Eijt, and B. Dam, ACS Photonics 8, 709 (2021).
- Mugiraneza and Hallas (2022) S. Mugiraneza and A. M. Hallas, Commun. Phys. 5, 1 (2022).
- Colombi et al. (2023) G. Colombi, B. Boshuizen, D. Chaykina, L. Hsu, H. Schreuders, T. J. Savenije, and B. Dam, Adv. Opt. Mater. 11, 2202660 (2023).
- Yayama and Tomokiyo (1992) H. Yayama and A. Tomokiyo, Materials , 293 (1992).
- Wallace et al. (1963) W. Wallace, Y. Kubota, and R. Zanowick, “Nonstoichiometric compounds,” (ACS Publications, 1963) Chap. 11: Magnetic Characteristics of Gadolinium, Terbium, and Ytterbium Hydrides in Relation to the Electronic Nature of the Lanthanide Hydrides, pp. 122–130.
- Miniotas et al. (2000) A. Miniotas, B. Hjörvasson, L. Douysset, and P. Nostell, Appl. Phys. Lett. 76, 2056 (2000).