Mandarin Lombard Flavor Classification
Abstract
The Lombard effect refers to individuals’ unconscious modulation of vocal effort in response to variations in the ambient noise levels, intending to enhance speech intelligibility. The impact of different decibel levels and types of background noise on Lombard effects remains unclear. Building upon the characteristic of Lombard speech that individuals adjust their speech to improve intelligibility dynamically based on the self-feedback speech, we propose a flavor classification approach for the Lombard effect. We first collected Mandarin Lombard speech under different noise conditions, then simulated self-feedback speech, and ultimately conducted the statistical test on the word correct rate. We found that both SSN and babble noise types result in four distinct categories of Mandarin Lombard speech in the range of 30 to 80 dBA with different transition points.
Index Terms— Lombard effect, Lombard flavor classification
1 Introduction
The Lombard effect is a vocal response whereby speakers involuntarily adjust their vocal effort in a noisy environment according to their self-auditory monitoring to make their speech more intelligible [1, 2]. Current Lombard datasets have background noise levels ranging from 35 to 96 dB, and have various types of noise, including pink noise, speech-shaped noise (SSN), car noise, etc. [3, 4, 5]. However, it’s uncertain how these noise levels and types relate to triggering the distinctive Lombard flavor. Prolonged speech in noisy environments may potentially result in hearing impairment and speech-related issues. Consequently, it is essential to determine the distinctive Lombard flavor based on the background noise level and type to offer guidance for the collection of Lombard datasets, ultimately aiming to minimize the workload associated with the acquisition of such datasets.
Previous studies on the Lombard effect aimed to identify the starting point of the Lombard effect, which is the transition from plain speech to Lombard speech, i.e., the first Lombard style. However, these findings lack consistency.
Pearsons et al. stated that teachers in the classroom environment began to raise their voice sound pressure level (SPL) when the background noise’s SPL was above 48 dB [6].
Yiu et al. recorded 24 vocally healthy young adults’ 3 to 5 minutes monologue passage in the clinic room (35.5 dBA), clinic corridor (54.5 dBA), and pantry room (67.5 dBA) situations. Speakers’ voice SPL showed significant increases in the 67.5 dBA environment than in the other two conditions. They deduced that background noise adversely affected voice production when the noise level was beyond 60 dBA [7].
Pasquale Bottalico investigated the starting point of the Lombard effect in relation to background noise decibel levels. twenty subjects, consisting of men and women aged 18 to 34, were recruited to carry out recordings in an anechoic chamber. They employed 10 decibel levels of pink noise, ranging from 20 dBA to 65 dBA with 5 dBA increments. To emulate a realistic conversation, a listener was positioned 2.5 meters away from the speaker, who read six sentences from the Rainbow passage. The vocal effort of speakers was evaluated using sound pressure levels. Then they fit change curves at various decibel levels and identify the point where the slopes altered. The study concluded that the Lombard effect starts at 43.3 dBA, based on a noticeable change in the speaker’s vocal effort curve at that noise level [8].
Then Bottalico conducted a similar experiment with typical restaurant noise between 35 and 85 dBA in 2018. However, the starting point moved to 57.3 dBA. Bottalico speculated that the difference could be due to that automatic mechanism in speech regulation related to privacy [9].
One possible explanation for the divergent conclusions reached by existing studies is that they use speakers’ voice SPL to classify. Research shows that even at the same SPL, Lombard speech exhibits higher intelligibility than ordinary speech [10]. Thus, it would be more reasonable to evaluate the variability of the Lombard effect using speech intelligibility. Another potential explanation for the differences in past research findings may stem from the use of varied noise types like classroom, crowd, and pink noise, potentially eliciting distinct Lombard effect styles.
Further, Hansen et al. first proposed that the Lombard effect has a different style [5]. They used a Gaussian Mixture Model (GMM) trained with 19 female speakers’ speech to classify 3-s duration Lombard utterances’ noise level (from 65 to 90dB SPL, 5 dB increments) and noise type (car noise, large crowd noise, and pink noise). The classification performance is significantly different from random. Thus, they suggested that Lombard speech exists distinct flavors responding to varying noise levels and types.
Although Hansen proposed that the Lombard effect under different background noise types belong to different Lombard flavors, in past studies, it was generally agreed that the type of noise had no significant effect on the Lombard effect.
T Letowski et al. compared vocal pitch and overall SPL of Lombard speech produced by 10 subjects(5 men and 5 women) in multi-talker, traffic, and wideband noise presented at 70 and 90 dB SPL. No significant differences exist between noise types, indicating that the type of noise has no specific effect on the Lombard effect [11]. Maria Södersten also claimed no significant differences in Lombard speech’s SPL between soft noise and day-care babble, and no significant differences were observed between disco and loud noise [12].
Studies have found inconsistent and even contradictory results regarding the effect of noise levels and noise types on the Lombard flavor. Therefore, it is necessary to develop an approach that can classify the Lombard effect under varying noise levels.
In our previous study, we attempted to analyze the Lombard flavor by combining the self-feedback speech with different noise levels and then using statistical tests on the short-time objective intelligibility (STOI) [13]scores of the mixed audio [14]. However, the study limited its focus to Lombard classification under SSN, neglecting other noise types. The use of nonsensical Grid sentences likely weakened Lombard effect elicitation [15]. Additionally, the absence of the STOI-to-word correct rate (WCR) mapping questions the reliability of the results.
Based on this work, we made the following improvements: (1)in contrast to using nonsensical sentences, which have been shown to induce a less Lombard effect [16], we selected sentences with high naturalness, longer length, and covering the maximum number of Mandarin tones and tonal combinations to elicit a more pronounced Lombard effect; (2) we introduced babble noise to verify the existence of different Lombard flavors under varying noise types; (3) the STOI scores were mapped to subjectively measured word correct rates to enhance the reliability of the statistical test.
We observed that Mandarin Lombard speech exhibits four distinct patterns under both SSN and babble noise in the 30-80 dBA range. The transition points differ: 45, 65, and 75 dBA for SSN and 55, 65, and 75 dBA for babble noise.
| dBA level combination | lower level | higher level | t | dBA level combination | lower level | higher level | t |
2 Lombard Speech dataset collection
2.1 Subjects Selection
To mitigate the impact of inter-speaker variability, the participant pool was expanded from 4 to 10. Participants were 10 students, 5 males and 5 females, in the 20-23 year age range. All participants reported no hearing impairment and scored Class 2 Level 1 on the Putonghua Shuiping Ceshi proficiency test. They were all paid for their participation.
A simple online hearing test was conducted on the Philips HearLink hearing aid official website before the recording began. After the test showed that the participants had no hearing loss, we would move to the recording step.
2.2 Sentence Material
Sentences were chosen from the Global TIMIT Mandarin Chinese ”Calibration” set, a total of 20 sentences, covering the maximum number of tones and tonal combinations. Every subject read the same 20 sentences under each noise condition being tested.
2.3 Background Noise
Research showed that the Lombard effect induced by background noise whose spectral composition is similar to speech noise is more pronounced than that evoked by background noise without speech frequency components [17, 18].
SSN is stable, which provides greater experimental control, and has been shown to elicit the Lombard effect more effectively. Thus, we chose SSN as the background noise to classify Lombard styles under different decibel levels of noise. We also included babble noise to simulate real-world auditory environments. Its complexity allows for a nuanced exploration of the Lombard effect under conditions that more closely mimic natural human interactions.
2.4 Recording Conditions and Procedures
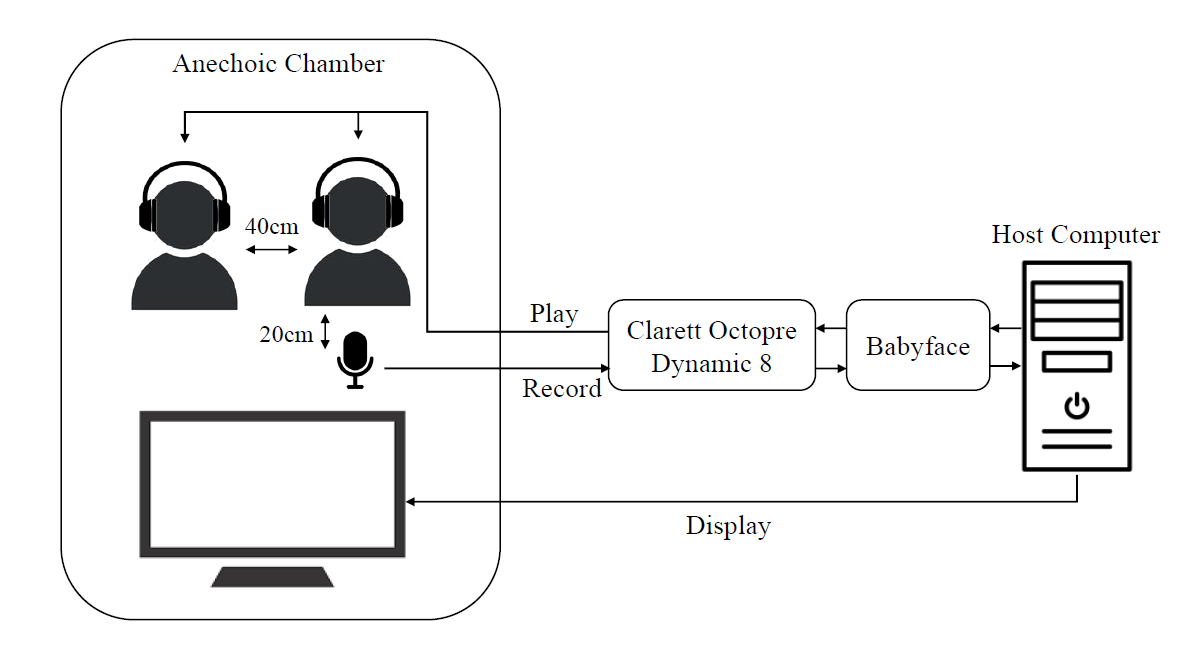
Lombard speech was recorded within the anechoic chamber at Wuhan University to ensure optimal acoustic conditions. The recording scenario is shown in Figure 1.
To simulate a realistic communication scenario, two participants sat apart, facing a touch screen with recording software. Both participants wore Sennheiser HD 300Pro closed-back headphones, while a RODE NT1-A microphone was situated from the speaker. The audio files were recorded at a sample rate of 48 kHz.
The closed-back headphones presented various noise conditions in a randomized order. To guarantee that the noise levels experienced by the speakers through the headphones were equivalent to those in an open field, we calibrated the headphones accordingly. As closed headphones attenuate air-conducted speech, we use TotalMix FX to compensate. This allows speakers to hear their own voices through the headphones, ensuring a comparable perception of speech with and without the headphones.
During the recording process, one participant read the displayed text while the other acted as the listener to confirm its accuracy before proceeding. Speakers were permitted to take breaks and rehydrate as needed throughout the recording session.
3 Lombard flavor classification
3.1 Self-feedback Speech Model
A key component of the Lombard effect is self-monitoring, which uses auditory feedback to detect speech errors [17]. Thus, generating self-feedback speech to add bone-conducted speech can better simulate the process of Lombard speech generation.
To simulate the speech that speakers heard by themselves, we employed a two-parameter self-feedback voice model involving both air-conducted and bone-conducted pathways [19]. We obtained self-feedback speech by applying the transformation function to the recorded speech captured by the microphone.
3.2 Mapping Objective Intelligibility Scores to Subjective Word Correct Rate
Studies have demonstrated that Lombard speech is more intelligible than plain speech (uttered in quiet) when presented at the same signal-to-noise ratio (SNR) [10, 20]. Therefore, using speech intelligibility to classify the Lombard style is reasonable. We used the widely-accepted STOI measure [13] to assess intelligibility. Drawing from that, we designed intelligibility mapping experiments for speech samples with both SSN and babble background noises.
We curated a dataset from 34 speakers, each recording 100 sentences at noise levels of 40dBA and 80dBA [16]. Randomly selected sentences from the 40dBA set were processed through three normal to Lombard voice conversion models, namely LSTM [21], CycleGAN [22] , and StarGAN [23], creating three conditions’ speech. Additional conditions were formed using random samples from the original 40dBA and 80dBA sets. The evaluation was conducted at ten distinct SNR levels, ranging from -18.5 to 4dB, using both SSN and babble noises.
For the evaluation phase, 15 subjects participated in a speech audiometry hearing test. Each subject was exposed to two sentences under each condition at every SNR level. Participants transcribed sentences heard under various conditions and SNRs, and the word correct rate (WCR) was calculated as the intelligibility metric.
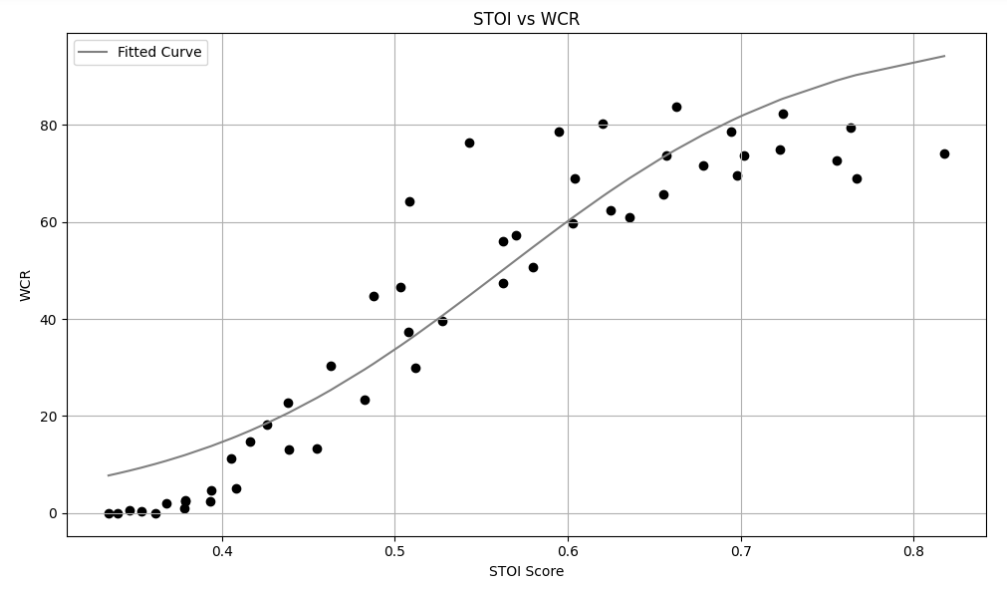
Finally, STOI scores corresponding to these audio samples were calculated and then mapped to subjective intelligibility metrics using the mapping function
thereby accomplishing the intended nonlinear translation between the objective and subjective measures of speech intelligibility.
| dBA level combination | lower level | higher level | t | dBA level combination | lower level | higher level | t |
3.3 Iterative Statistical Test
Self-feedback speech at two decibel levels was overlaid with noise at the higher decibel level of each pair resulting in two groups of audio. We adjusted the energy of lower-decibel speech to match higher-decibel speech before overlaying. This ensures that the combined audio samples in two groups have the same SNR.
Vocal behavior in relation to noise exposure is highly individual [24], and gender differences were also noticed in the size of the Lombard effect [25]. In order to obtain a general conclusion, we calculated the average WCR for the same sentence’s mixed audio (self-feedback speech overlaid with noise) from all subjects, resulting in 20 WCR for each group of such tests. Using an average WCR reduces variability in the data, thereby contributing to the overall rigor and validity.
We iterated the statistical test as follows: if no significant differences were observed, we then repeated the statistical test steps with a higher level of noise overlaid with the lower level’s speech used in the current test; otherwise, we continued the iteration starting from the higher level of the current test.
4 Results
4.1 Mapping Result
The means of the root of the mean squared prediction error (RMSE) and correlation coefficient of WCR and STOI before mapping are and respectively.
The result of mapping STOI to WCR is shown in Figure 2. The obtained values for the free parameters of the nonlinear mappings, denoted as and , are and respectively. The RMSE and correlation coefficient are improved to and respectively.
4.2 Lombard Flavor Classification Result
A total of 10 speakers (balanced by gender) were recruited to participate in creating the dataset, each recording Lombard speech across 11 distinct noise levels and 2 noise types. In each noise condition, the speakers recorded 20 sentences, resulting in a total of 4400 recorded sentences.
The results for Lombard flavor classification over decibel levels under SSN and babble noise are shown in Table 1 and Table 2. Mandarin Lombard speech under SSN and babble noise both fall into 4 categories in the 30-80 dBA range. However, the SSN transition points are at 45, 65, and 75 dBA, while for babble they are at 55, 65, and 75 dBA. These findings suggest that the pressure level of noise significantly impacts the intelligibility of Lombard speech. The difference in transition points indicates that the type of noise impacts the Lombard effect in distinct ways.
5 Conclusion and Discussion
This paper aims to address the challenge of the ambiguous boundaries of Lombard speech and to provide guidance for the efficient acquisition of Mandarin Lombard speech datasets. The divergence in our noise level classification results from those presented in [14]may be attributed to a more pronounced Lombard effect observed in meaningful text [16]. Furthermore, we expanded our participant pool to mitigate the impact of individual variations in the Lombard effect across different speakers. Our research findings align with those of [8], both suggesting that the onset of the Lombard effect occurs between 40-45 dBA. Additionally, we corroborate the views expressed in [5] regarding the existence of distinct Lombard flavors under varying noise levels and types.
6 Acknowledgments
This research is funded in part by the National Natural Science Foundation of China (62171326), Key Research and Development Program of Hubei Province (220171406) and Guangdong OPPO Mobile Telecommunications Corp.
References
- [1] Etienne Lombard et al., “Le signe de i’elevation de la voix, annals maladiers oreille,” Larynx, Nez Pharynx, vol. 37, pp. 101–119, 1911.
- [2] Henrik Brumm and Sue Anne Zollinger, “The evolution of the lombard effect: 100 years of psychoacoustic research,” Behaviour, vol. 148, no. 11-13, pp. 1173–1198, 2011.
- [3] Vivien C Tartter, Hilary Gomes, and Elissa Litwin, “Some acoustic effects of listening to noise on speech production,” The Journal of the Acoustical Society of America, vol. 94, no. 4, pp. 2437–2440, 1993.
- [4] Hynek Bořil and John HL Hansen, “Ut-scope: Towards lvcsr under lombard effect induced by varying types and levels of noisy background,” in 2011 IEEE International Conference on Acoustics, Speech and Signal Processing (ICASSP). IEEE, 2011, pp. 4472–4475.
- [5] John HL Hansen and Vaishnevi Varadarajan, “Analysis and compensation of lombard speech across noise type and levels with application to in-set/out-of-set speaker recognition,” IEEE Transactions on Audio, Speech, and Language Processing, vol. 17, no. 2, pp. 366–378, 2009.
- [6] Karl S Pearsons, Ricarda L Bennett, and Sanford A Fidell, Speech levels in various noise environments, Office of Health and Ecological Effects, Office of Research and Development …, 1977.
- [7] Edwin ML Yiu and Priscilla PS Yip, “Effect of noise on vocal loudness and pitch in natural environments: an accelerometer (ambulatory phonation monitor) study,” Journal of Voice, vol. 30, no. 4, pp. 389–393, 2016.
- [8] Pasquale Bottalico, Ivano Ipsaro Passione, Simone Graetzer, and Eric J Hunter, “Evaluation of the starting point of the lombard effect,” Acta Acustica United With Acustica, vol. 103, no. 1, pp. 169–172, 2017.
- [9] Pasquale Bottalico, “Lombard effect, ambient noise, and willingness to spend time and money in a restaurant,” The Journal of the Acoustical Society of America, vol. 144, no. 3, pp. EL209–EL214, 2018.
- [10] W Van Summers, David B Pisoni, Robert H Bernacki, Robert I Pedlow, and Michael A Stokes, “Effects of noise on speech production: Acoustic and perceptual analyses,” The Journal of the Acoustical Society of America, vol. 84, no. 3, pp. 917–928, 1988.
- [11] Tomasz Letowski, Tom Frank, and Jane Caravella, “Acoustical properties of speech produced in noise presented through supra-aural earphones,” Ear and Hearing, vol. 14, no. 5, pp. 332–338, 1993.
- [12] Maria Södersten, Sten Ternström, and Mikael Bohman, “Loud speech in realistic environmental noise: phonetogram data, perceptual voice quality, subjective ratings, and gender differences in healthy speakers,” Journal of Voice, vol. 19, no. 1, pp. 29–46, 2005.
- [13] Cees H Taal, Richard C Hendriks, Richard Heusdens, and Jesper Jensen, “A short-time objective intelligibility measure for time-frequency weighted noisy speech,” in 2010 IEEE international conference on acoustics, speech and signal processing. IEEE, 2010, pp. 4214–4217.
- [14] Yuhong Yang, Xufeng Chen, Qingmu Liu, Weiping Tu, Hongyang Chen, and Linjun Cai, “Mandarin Lombard Grid: a Lombard-grid-like corpus of Standard Chinese,” in Proc. Interspeech 2022, 2022, pp. 3078–3082.
- [15] Stephen M Tasko and Michael D McClean, “Variations in articulatory movement with changes in speech task,” 2004.
- [16] Baifeng Li, Qingmu Liu, Yuhong Yang, Hongyang Chen, Weiping Tu, and Song Lin, “Emalg: An enhanced mandarin lombard grid corpus with meaningful sentences,” 2023.
- [17] Maëva Garnier, Nathalie Henrich, and Danièle Dubois, “Influence of sound immersion and communicative interaction on the lombard effect,” 2010.
- [18] Lauren M Stowe and Edward J Golob, “Evidence that the lombard effect is frequency-specific in humans,” The Journal of the Acoustical Society of America, vol. 134, no. 1, pp. 640–647, 2013.
- [19] Sook Young Won, Jonathan Berger, and Malcolm Slaney, “Simulation of one‘s own voice in a two-parameter model,” in Proc Int Conf Music Percept Cogn. Citeseer, 2014.
- [20] Martin Cooke, Catherine Mayo, and Julián Villegas, “The contribution of durational and spectral changes to the lombard speech intelligibility benefit,” The Journal of the Acoustical Society of America, vol. 135, no. 2, pp. 874–883, 2014.
- [21] Gang Li, Xiaochen Wang, Ruimin Hu, Huyin Zhang, and Shanfa Ke, “Intelligibility enhancement via normal-to-lombard speech conversion with long short-term memory network and bayesian gaussian mixture model,” IEEE Transactions on Multimedia, vol. 23, pp. 3035–3047, 2021.
- [22] Shreyas Seshadri, Lauri Juvela, Junichi Yamagishi, Okko Räsänen, and Paavo Alku, “Cycle-consistent adversarial networks for non-parallel vocal effort based speaking style conversion,” in ICASSP 2019 - 2019 IEEE International Conference on Acoustics, Speech and Signal Processing (ICASSP), 2019, pp. 6835–6839.
- [23] Gang Li, Ruimin Hu, Shanfa Ke, Rui Zhang, Xiaochen Wang, and Li Gao, “Speech intelligibility enhancement using non-parallel speaking style conversion with stargan and dynamic range compression,” in 2020 IEEE International Conference on Multimedia and Expo (ICME). IEEE, 2020, pp. 1–6.
- [24] Fredric Lindstrom, Kerstin Persson Waye, Maria Södersten, Anita McAllister, and Sten Ternström, “Observations of the relationship between noise exposure and preschool teacher voice usage in day-care center environments,” Journal of Voice, vol. 25, no. 2, pp. 166–172, 2011.
- [25] Najwa Alghamdi, Steve Maddock, Ricard Marxer, Jon Barker, and Guy J Brown, “A corpus of audio-visual lombard speech with frontal and profile views,” The Journal of the Acoustical Society of America, vol. 143, no. 6, pp. EL523–EL529, 2018.