Temperature dependent convective parameters for RRc 1D-models
Abstract
Nonlinear pulsation modeling of classical variable stars is among the first topics which were developed at the beginning of the computational era. Various developments were made, and many questions were answered in the past 60 years, and the models became more complex, describing the genuinely 3D convection in a single dimension. Despite its successes, the recent public availability of the MESA Radial Stellar Pulsations (MESA RSP) module and the emerging results from multidimensional codes made clear that the 8 free convective parameters, unique to these models, together with the underlying physical models need calibration. This could be done by comparing them against multi-dimensional codes, but before that, it is important to scrutinize the free parameters of the 1D codes using observations. This is a follow-up work of our previous calibration on the convective parameters of the Budapest-Florida and MESA RSP pulsation codes for RRab stars. In this paper, we extend the previous calibration to the RRc stars and the RR Lyrae stars in general. We found that correlations of some of the parameters are present in RRc stars as well but have a different nature, while high-temperature RRc stars’ pulsation properties are very sensitive to the chosen parameter sets.
keywords:
convection – methods: numerical – stars: oscillations – stars: variables: RR Lyrae –– globular clusters: individual: M31 Introduction
Nonlinear numerical modeling of classical pulsating stars (Cepheids, RR Lyrae stars) has a long history, which started with the first models of Christy (1964) and culminated in the development of the various pulsation codes used today (Bono & Stellingwerf, 1994; Yecko et al., 1998; Smolec & Moskalik, 2008a). In the meantime, the most important problems shifted from the driving mechanisms to the mode-selection problem (Stellingwerf, 1982; Kolláth et al., 2002). The physical formalism also became more complex, and the role of the convective processes in the outer layers of these stars became one of the main problems (Deupree, 1977); for a quick walk-through of the development of the 1D nonlinear radial pulsation codes, we refer to Kovács et al. (2023).
The theoretical description of the 1D convection theory also improved from the first attempts of time-dependent mixing length of Gough (1977) and Unno (1967) to the descriptions of Kuhfuss (1986) and Gehmeyr & Winkler (1992). We suggest Baker (1987) for a good review of the history of these theories.
The availability of running non-linear calculations was greatly enhanced by including the code of Smolec & Moskalik (2008a) into the MESA software package (Paxton et al., 2019) as the RSP module. Meanwhile, other groups used other codes to successfully model Cepheid stars (Marconi et al., 2013a; Marconi et al., 2013b, 2015; Keller & Wood, 2006). The availability of these codes allows computing large grids of models, so for example, Das et al. (2021) have investigated convective and metallicity effects on BL Her model grids, while Kurbah et al. (2023) studied phase-dependent Cepheid period-luminosity relations using model grids, with different parameter sets.
The usage of different convective parameter sets is very common in these studies. This is because there is no overall calibration of the convective parameters currently. In the case of the RSP code, there are only prescriptions (Paxton et al., 2019). It is well known that there should be no existing simple parameter set that suits every pulsator due to the limitations of the theory and the vast differences in the stellar structure of different types of stars in the instability strip (Smolec & Moskalik, 2008a). Although Kolláth et al. (2002) gave parameter sets for Cepheids and RR Lyrae stars for the Budapest-Florida code (BpF hereafter) (Yecko et al., 1998), most studies in this field did not include stellar parameter dependence of the convective parameters, while there is evidence in the case of the pulsation code of Bono & Stellingwerf (1994) that convective parameters may be affected by effective temperatures (Di Criscienzo et al., 2004).
Recently we have done a calibration for these parameters for the RSP and BpF codes in the case of the RRab stars (Kovács et al., 2023, hereafter Paper I). In our Paper I, we concluded that there is a degeneracy between the scale parameter of the eddy viscosity pressure and the dissipation efficiency parameter , which is dependent on the effective temperature. We also showed that a discrepancy arises between the synthetic light and radial velocity (RV) curves around the blue edge of the instability strip. In the current work, we extend this effort towards RRc stars in an attempt to find a general RR Lyrae parameter set (if such exists), which would help any large-scale modeling efforts requiring extensive model grid computations and will also provide a way into the transition applying multidimensional codes.
2 Observational data
Albeit radial velocity and multi-band light-curve can be fitted with pulsation models simultaneously to derive stellar parameters (Di Fabrizio et al., 2002; Natale et al., 2008; Marconi et al., 2013b; Marconi et al., 2013a; Marconi et al., 2015), this approach includes further assumptions regarding the atmosphere of the star which is not modeled by these codes (Paper I), while using only radial velocity curves we can study the dynamical structure more thoroughly. For this reason, we use only RV curves of Jurcsik et al. (2017) for calibration and V light curves from Jurcsik et al. (2015) only for comparison. We use these data of selected first overtone RR Lyrae stars from the M3 globular cluster based on their RV curve coverage (Paper I). We use the cleaned and equidistantly re-sampled RV curves calculated from the Hectoshelle@MMT (Szentgyorgyi et al., 2011) measurements with 1 km/s errors; we also show light curves for comparison, which were measured simultaneously with the Hectoshelle@MMT measurements with the 60/90 Schmidt telescope at Konkoly Observatory (Jurcsik et al., 2015).
The value of the projection factor (the multiplier factor which connects the measured radial velocities to the actual pulsating velocities of the star and has a value between 1.0 and 1.5) is central in evaluating the radial velocity curves. There is an ongoing debate about whether this p-factor has a period dependence or not (Molinaro et al., 2012; Marconi et al., 2013a; Trahin et al., 2021, and references therein), which can be caused by structural differences among Cepheids, but among RR Lyrae stars the intrinsic stellar parameters span a much smaller parameter range. In this regard, we choose the value of p-factor to , the same as in Paper I, and consider the uncertainty of the factor in the error propagation of the convective parameters.
We derived the measured stellar parameters in the same way as in Paper I. We have used bolometric corrections of Torres (2010), interstellar cluster reddening from Schlafly & Finkbeiner (2011), and the Baade-Wesselink distances from Jurcsik et al. (2017) to determine the bolometric luminosities of the stars.
| Star | Period⋆ | |||||
| ID | [d] | [K] | [] | |||
| v056 | 0.329598 | 0.5636 | 0.76 | 0.0005 | ||
| v086 | 0.292656 | 0.58154 | 0.71 | 0.0005 | ||
| v097 | 0.334997 | 0.58339 | ||||
| v107 | 0.309026 | 0.58881 | 0.72 | 0.0006 | ||
| ⋆: directly adopted from Jurcsik et al. (2017), error is | ||||||
| ⋆⋆: calculated from mean magnitudes of Jurcsik et al. (2015) | ||||||
| a: calculated from LNA model interpolation, error is | ||||||
| b: derived from the non-linear fits, errors are and | ||||||
| respectively | ||||||
3 Models and the fitting method
We aim at determining the eight convective parameters of the non-linear radial pulsation models (Gehmeyr & Winkler, 1992; Kuhfuss, 1986) from radial velocity observations in the case of RRc stars in a similar way as it has been recently done for RRab stars in Paper I.
We use the Budapest-Florida code (Yecko et al., 1998) and the MESA Radial Stellar Pulsation module (Paxton et al., 2019) for the convective parameter fitting. These two codes are very similar to each other; their main difference is the handling of negative buoyancy effects (Paper I). For a one-to-one comparison, see our Paper I and also the original papers of Yecko et al. (1998) and Smolec & Moskalik (2008a).
These types of models have 5 input parameters intrinsic to the star: the stellar mass (), the bolometric luminosity (), the effective temperature (), the hydrogen () and a metal mass fraction (). Some of these parameters are directly measurable (,), while others can be determined indirectly by the models. As in Paper I, we determine the pulsating mass by interpolating the period from linear models and and by finding the best-fit values from non-linear calculations.
Our fitting procedure remains unchanged from Kovács et al. (2023). Briefly, it means that we run model grids for the dissipation efficiency and eddy viscosity parameter , as these two parameters have the largest effect on the observed RV curves, and they are also degenerate (Kovács et al., 2023). The turbulent source () and convective flux () parameters have stronger effects on the synthetic RV and LC curves of first overtones, hence instead of independent fitting (as in Paper I, ) we fit these parameters together.
We are fitting the full radial velocity (RV) curve (in contrast with Paper I, where minimum phase was omitted), which weakens the overall fit but helps to avoid nonphysical artificially strong dissipation fronts in the models, that would cause very strong secondary light curve features e.g. flare-like spikes.
4 Results
| BpF | RSP | |||||
|---|---|---|---|---|---|---|
| Star | ||||||
| v056 | -16.35 | 381.65 | 0.9661 | 0.16886 | 61.3950 | 0.9645 |
| v086 | -24.59 | 802.76 | 0.8682 | 0.22024 | 130.582 | 0.9590 |
| v097 | -23.59 | 374.39 | 0.9475 | 0.85470 | 58.4948 | 0.9698 |
| v107 | -14.01 | 532.11 | 0.8649 | 1.43412 | 87.7540 | 0.9896 |
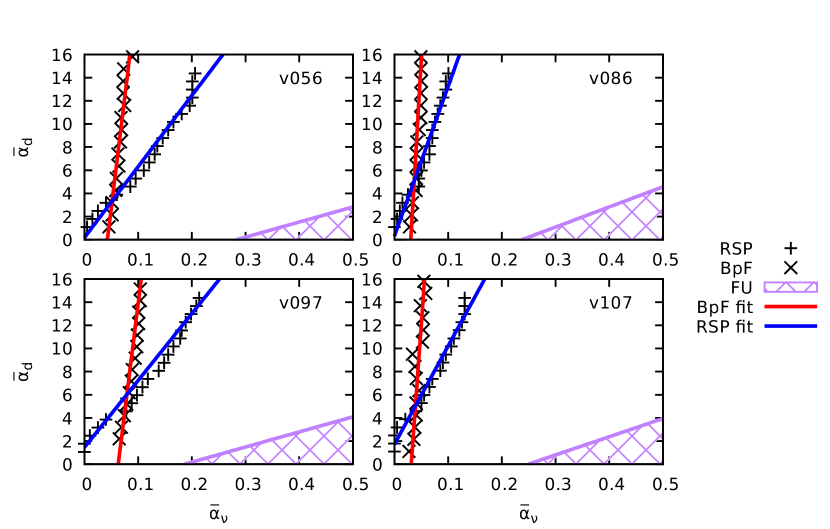
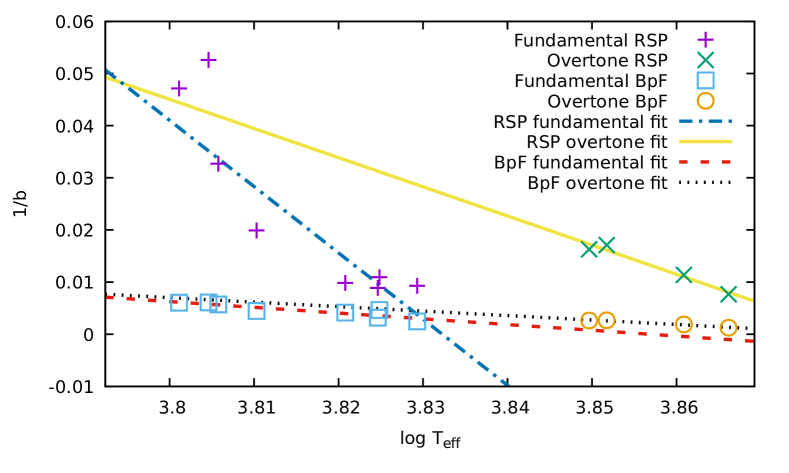
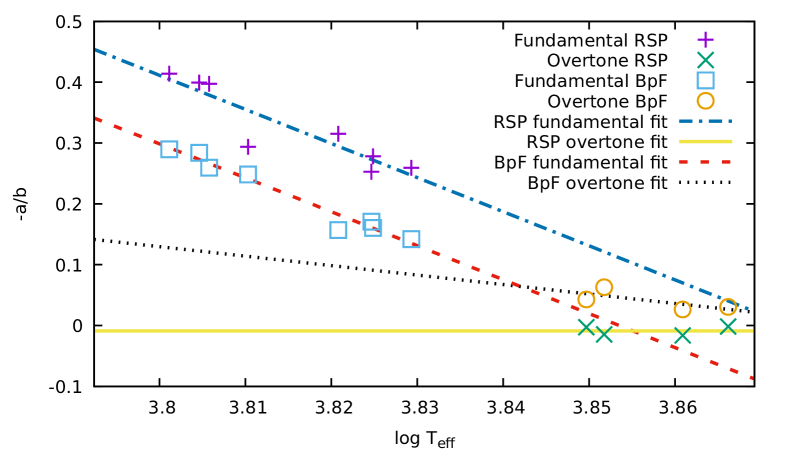
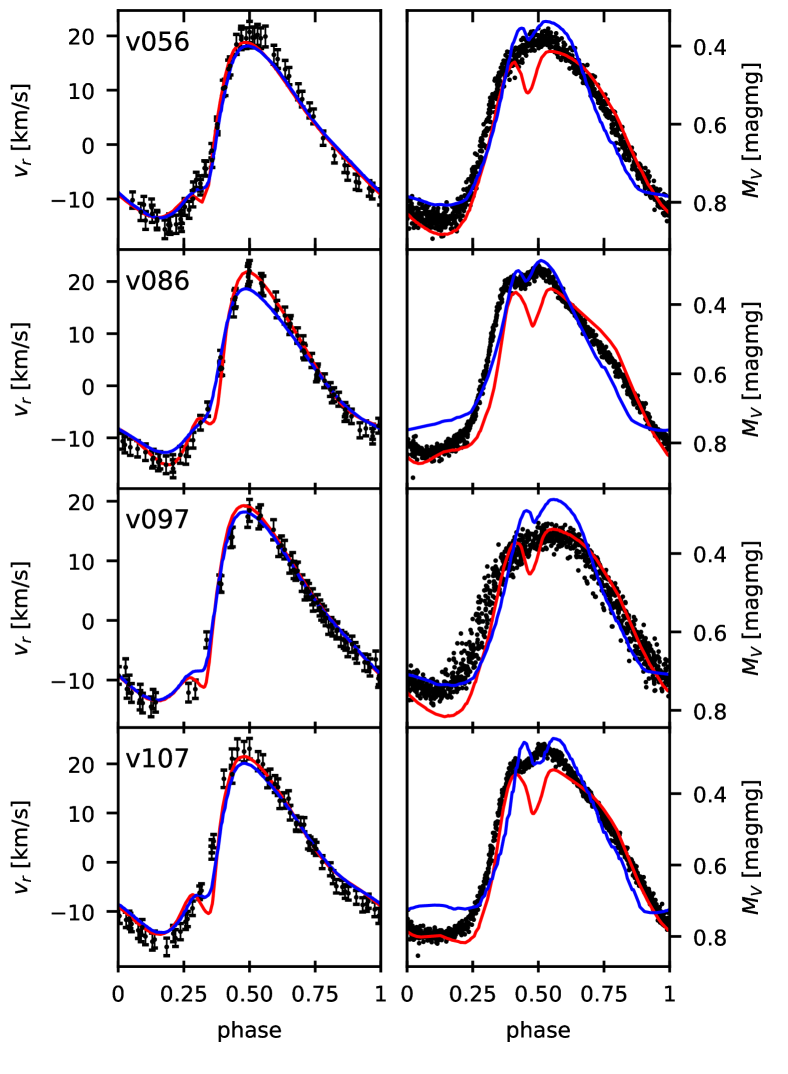
The RRc stars show a similar degeneracy between the dissipation () and eddy viscosity () parameters as was observed in the case of RRab stars (Kovács et al., 2023) (see Fig. 1), but the regression parameters have a different correlation with the effective temperature which is shown in Figs. 2. and 3. We show our best-fit RV curves alongside the light curves as a reference in Fig. 4. We see good agreement in the amplitudes, albeit secondary light curve features are too large in some cases, especially in the BpF code, which can be attributed to the sensitivity of the features to the underlying convection models (Marconi, 2017).
In addition to the known effects (Paper I) of and , we found that the convective flux () and source parameters () have stronger effects on the first overtone stars, and we found that on a grid, the parameters show a degeneracy of hyperbolic shape, for each star. We can see this also by recalculating this grid for the RRab stars from Paper I. This hyperbole has an interception with the line, so we can further reduce the number of free parameters by one.
We present the details of these results for both codes separately below.
| Star | RSP | BpF |
|---|---|---|
| v086 | ||
| v097 | ||
| v056 | ||
| v107 |
4.1 BpF results
In the case of the BpF the correlation is the following:
| (1) |
The rms of the fit is .
The parameters (3) show a correlation with temperature (), while RRab parameters don’t show this feature. But due to the large errors and the low number of points, one can use a generally constant value of for both parameters, which is within the errors of the previous values of RRab stars. and have little effect on actual RV and light curves.
4.2 RSP results
In the case of the RSP code, the correlation of the is as follows:
| (2) |
with an rms of .
The parameters are weakly correlated () and differ from the RRab case. The changes introduced on the RV curves are small while having stronger effects on the light curves. Because of this, we also considered the light curve shape in the fitting process, and this way, the mean , which is greater than the RRab value of but they match within the errorbars. Because of this, we can suggest a general value of . The (turbulent flux) parameter has a small effect, and its best value is around .
4.3 General RR Lyrae parameter set
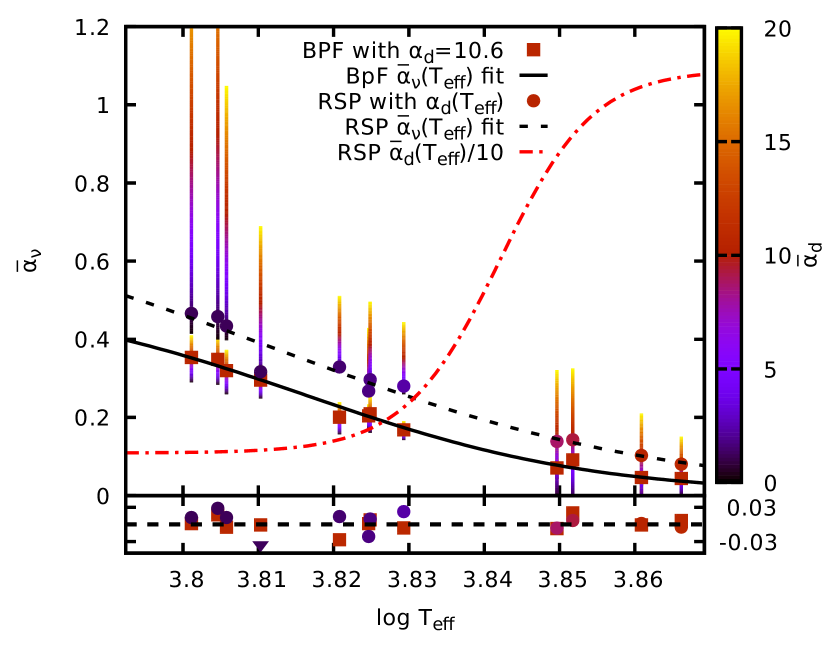
We also derived a general set for the eddy viscosity () and dissipation () parameters, which can be seen in Fig. 5. For this purpose, we have chosen the logistic function in the form of:
| (3) |
This function can quickly converge to and , which is ideal for avoiding unphysical parameters (negative and too high -s).
In the BpF case, we could get a good fit with , while in the case of the RSP code, it was necessary for to change with a logistic function, too. We present these parameters in Table 4.
Case rms BpF 0.015 RSP 0.02 RSP 1.089 N/A
5 Discussion
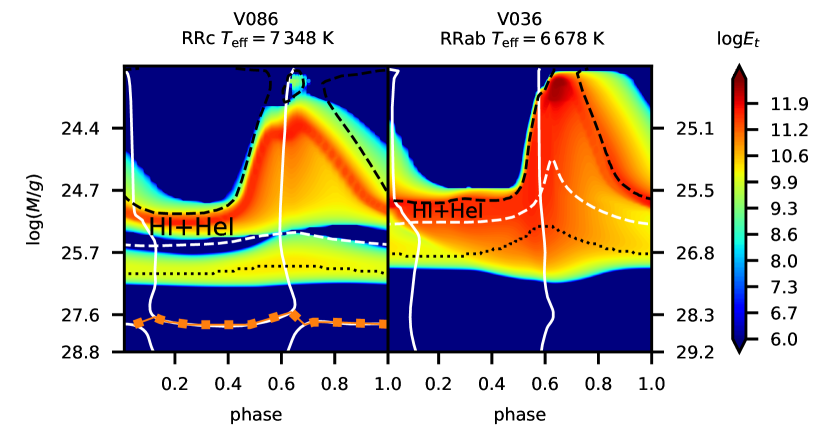
The fact that we arrived at different parameter sets for different pulsational modes can be understood since the convective processes influence mode selection, and in turn, the selected mode affects the stellar structure and transport processes. In practice, this means that the parameters depend not only on the physical parameters of the matter but also on the flow structure. We can see an example of this interaction in Fig. 7. Here we can see that in the case of the RRc stars, the flow itself helps to separate the two convective regions, while in the RRab case, the convective zones are connected independently from the temperature. The exact interaction between pulsation and convection is still a research subject, and it can be done using multi-dimensional pulsation codes (Kupka & Muthsam, 2017; Mundprecht et al., 2015; Geroux & Deupree, 2015).
As the mode selection problem can lead to disjoint sets of structural properties between pulsators (Szabó et al., 2004), this different response to the parameters is understandable but also may question the validity of the mode-selection surveys. In spite of this, the BpF code has more restricted parameter space, which strengthens these studies, while in the case of the RSP code, set B and D are in the purple region of Fig.1, which means this parameter sets can lead to misleading results. Moreover, higher temperature RRc stars can be rendered pulsationally stable (non-pulsating) with parameter sets A and B as well. In Figure 6 we can see the linear cumulative work integrals111The cumulative sum of the amount of work done by the sum of the pressure terms during one pulsational cycle calculated over the zones of the star V086 ( K). We can see that the effect of the convective parameters increases for higher overtones. Altogether, we can assume that some features like the fundamental blue edge (Szabó et al., 2004) or the period-doubling phenomena (Smolec, 2016) are probably more robust, while other features like RRd regions (Szabó et al., 2004; Smolec & Moskalik, 2008b) are more sensitive to the convective parameters.
The joint RR Lyrae parameter set has been chosen and calibrated to describe stars in the given temperature range K, and due to the sigmoid functions, it has believable constraints outside of this range. Further work on calibration to Cepheid stars may reveal more details regarding the connection between the parameter space and intrinsic stellar parameters. The light and RV curves are insensitive to the turbulent flux and pressure (,) parameters, making some features smoother. These parameters have larger roles in mode selection, so they can be better calibrated by e.g., fundamental blue edge or other features.
6 Conclusions
We continued our previous work (Kovács et al., 2023) on scrutinizing the convective parameter space of the 1D non-linear radial stellar pulsation codes, the Budapest-Florida and MESA Radial Stellar Pulsations. We used high-precision radial velocity measurements of four first overtone RR Lyrae stars from globular cluster M3 measured by Jurcsik et al. (2017).
We fitted the convective parameters to these RV curves and found degeneracies between the parameters similar but also different to the RRab case. This different nature of the parameters can be interpreted as the effect of the different flow structures of the modes. Nevertheless, the two (RRab and RRc) parameter sets can be approximated by sigmoid functions to reach a general RR Lyrae parameter set, which can be used for survey-like studies and also for comparison with multi-dimensional models. Some parameters have little effect on the observables, but mode-selection features can calibrate them. Our final results on these temperature-dependent parameter sets can be found in Table 5.
We also found that the standard four-parameter set of the RSP code (Paxton et al., 2019) is inadequate to describe some of the RRc stars as they damp pulsations, while in some cases, sets B and D interfere with the mode selection process. We emphasize the need for more studies in this direction and warn against using parameter sets without sanity checks.
Numerical simulations in 2 and 3 dimensions are the next logical step in pulsation modeling. Our results give further basis to 1D-3D model comparisons (e.g. Mundprecht et al., 2015) by providing observationally calibrated parameters.
Acknowledgements
This project has been supported by the Lendület Program of the Hungarian Academy of Sciences, project No. LP2018-7/2022, the ‘SeismoLab’ KKP-137523 Élvonal, OTKA projects K-129249 and NN-129075, as well as the MW-Gaia COST Action (CA18104).
On behalf of Project ’Hydrodynamical modeling of classical pulsating variables with SPHERLS’ we are grateful for the usage of ELKH Cloud (see Héder et al., 2022, https://science-cloud.hu/) which helped us achieve the results published in this paper.
Data Availability
References
- Baker (1987) Baker N. H., 1987, in Hillebrandt W., Meyer-Hofmeister E., Thomas H. C., Kippenhahn R., eds, Physical Processes in Comets, Stars and Active Galaxies. pp 105–124
- Bono & Stellingwerf (1994) Bono G., Stellingwerf R. F., 1994, ApJS, 93, 233
- Christy (1964) Christy R. F., 1964, Reviews of Modern Physics, 36, 555
- Das et al. (2021) Das S., Kanbur S. M., Smolec R., Bhardwaj A., Singh H. P., Rejkuba M., 2021, MNRAS, 501, 875
- Deupree (1977) Deupree R. G., 1977, ApJ, 211, 509
- Di Criscienzo et al. (2004) Di Criscienzo M., Marconi M., Caputo F., 2004, Mem. Soc. Astron. Italiana, 75, 190
- Di Fabrizio et al. (2002) Di Fabrizio L., et al., 2002, MNRAS, 336, 841
- Gehmeyr & Winkler (1992) Gehmeyr M., Winkler K. H. A., 1992, A&A, 253, 92
- Geroux & Deupree (2015) Geroux C. M., Deupree R. G., 2015, ApJ, 800, 35
- Gough (1977) Gough D. O., 1977, ApJ, 214, 196
- Héder et al. (2022) Héder M., et al., 2022, Információs Társadalom, 22, 128
- Jurcsik et al. (2015) Jurcsik J., et al., 2015, ApJS, 219, 25
- Jurcsik et al. (2017) Jurcsik J., et al., 2017, MNRAS, 468, 1317
- Keller & Wood (2006) Keller S. C., Wood P. R., 2006, ApJ, 642, 834
- Kolláth et al. (2002) Kolláth Z., Buchler J. R., Szabó R., Csubry Z., 2002, A&A, 385, 932
- Kovács et al. (2023) Kovács G. B., Nuspl J., Szabó R., 2023, MNRAS, 521, 4878
- Kuhfuss (1986) Kuhfuss R., 1986, A&A, 160, 116
- Kupka & Muthsam (2017) Kupka F., Muthsam H. J., 2017, Living Reviews in Computational Astrophysics, 3, 1
- Kurbah et al. (2023) Kurbah K., Deb S., Kanbur S. M., Das S., Deka M., Bhardwaj A., Randall H. R., Kalici S., 2023, MNRAS, 521, 6034
- Marconi (2017) Marconi M., 2017, in European Physical Journal Web of Conferences. p. 06001, doi:10.1051/epjconf/201715206001
- Marconi et al. (2013a) Marconi M., Molinaro R., Ripepi V., Musella I., Brocato E., 2013a, MNRAS, 428, 2185
- Marconi et al. (2013b) Marconi M., et al., 2013b, ApJ, 768, L6
- Marconi et al. (2015) Marconi M., et al., 2015, ApJ, 808, 50
- Molinaro et al. (2012) Molinaro R., et al., 2012, ApJ, 748, 69
- Mundprecht et al. (2015) Mundprecht E., Muthsam H. J., Kupka F., 2015, MNRAS, 449, 2539
- Natale et al. (2008) Natale G., Marconi M., Bono G., 2008, ApJ, 674, L93
- Paxton et al. (2019) Paxton B., et al., 2019, The Astrophysical Journal Supplement Series, 243, 10
- Schlafly & Finkbeiner (2011) Schlafly E. F., Finkbeiner D. P., 2011, ApJ, 737, 103
- Smolec (2016) Smolec R., 2016, MNRAS, 456, 3475
- Smolec & Moskalik (2008a) Smolec R., Moskalik P., 2008a, ActAA, 58, 193
- Smolec & Moskalik (2008b) Smolec R., Moskalik P., 2008b, Acta Astron., 58, 233
- Stellingwerf (1982) Stellingwerf R. F., 1982, ApJ, 262, 330
- Szabó et al. (2004) Szabó R., Kolláth Z., Buchler J. R., 2004, A&A, 425, 627
- Szentgyorgyi et al. (2011) Szentgyorgyi A., et al., 2011, PASP, 123, 1188
- Torres (2010) Torres G., 2010, The Astronomical Journal, 140, 1158
- Trahin et al. (2021) Trahin B., Breuval L., Kervella P., Mérand A., Nardetto N., Gallenne A., Hocdé V., Gieren W., 2021, A&A, 656, A102
- Unno (1967) Unno W., 1967, PASJ, 19, 140
- Yecko et al. (1998) Yecko P. A., Kollath Z., Buchler J. R., 1998, AAP, 336, 553