DEFormer: DCT-driven Enhancement Transformer for Low-light Image and Dark Vision
Abstract
The goal of low-light image enhancement is to restore the color and details of the image and is of great significance for high-level visual tasks in autonomous driving. However, it is difficult to restore the lost details in the dark area by relying only on the RGB domain. In this paper we introduce frequency as a new clue into the network and propose a novel DCT-driven enhancement transformer (DEFormer). First, we propose a learnable frequency branch (LFB) for frequency enhancement contains DCT processing and curvature-based frequency enhancement (CFE). CFE calculates the curvature of each channel to represent the detail richness of different frequency bands, then we divides the frequency features, which focuses on frequency bands with richer textures. In addition, we propose a cross domain fusion (CDF) for reducing the differences between the RGB domain and the frequency domain. We also adopt DEFormer as a preprocessing in dark detection, DEFormer effectively improves the performance of the detector, bringing 2.1% and 3.4% improvement in ExDark and DARK FACE datasets on mAP respectively.
I INTRODUCTION
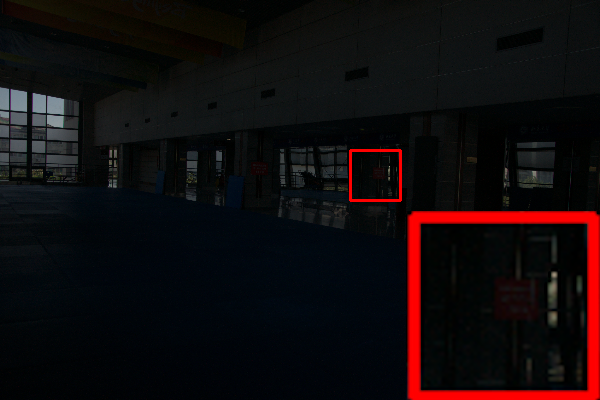
Low-light images have many dark areas, which generate noise, lose details and bringing a negative visual experience. There are many low-light scenes in autonomous driving such as night, tunnel and etc., they makes the performance of high-level visual tasks (such as object detection[1, 2, 3], face detection[4]) decline. The goal of low-light enhancement is to restore the lost information and improve the quality of the image, it has received attention in computer vision. An effective low-light enhancement model make other vision models robust in complex scenes, which is critical for the safety of autonomous driving as well as the accuracy of other vision systems.
Many low-light image enhancement (LLIE) methods have been proposed recently. Initially, low-light images are mainly enhanced by traditional methods. Some methods [5, 6, 7] use histogram to count the characteristics of the image to balance its dynamic range. Based on the Retinex theory[8], other methods [9, 10, 5] decompose the image into reflection components and illumination components and enhance them. However, the traditional method of manual feature learning has large limitations and poor generalization. In recent years, the low-light enhancement method [11, 12, 13, 14, 15] based on convolutional neural networks (CNNs) gradually become popular. CNN directly fit the process of low-light enhancement without prior knowledge and learn the mapping from low-light images to normal images, which achieves better accuracy and speed than traditional methods.
|
|
|
|---|---|---|
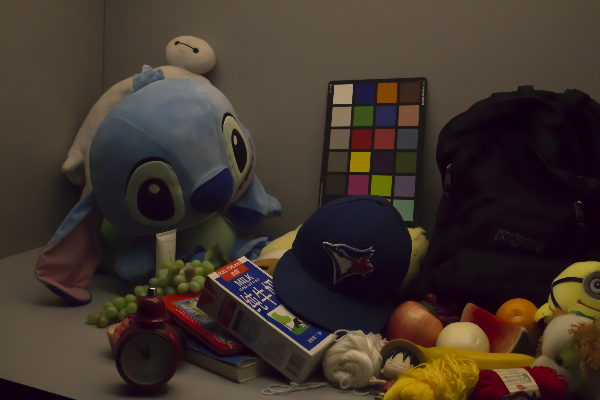
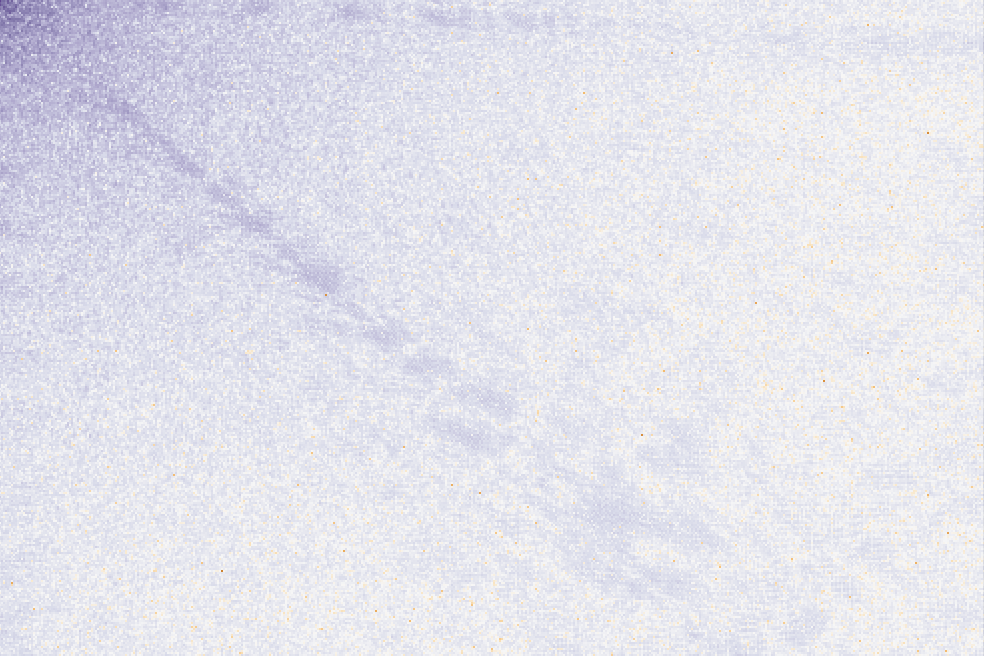
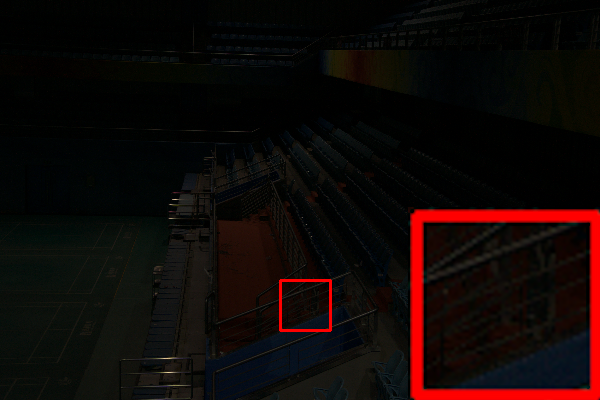
| (a) Input | (b) Frequency spectrum |
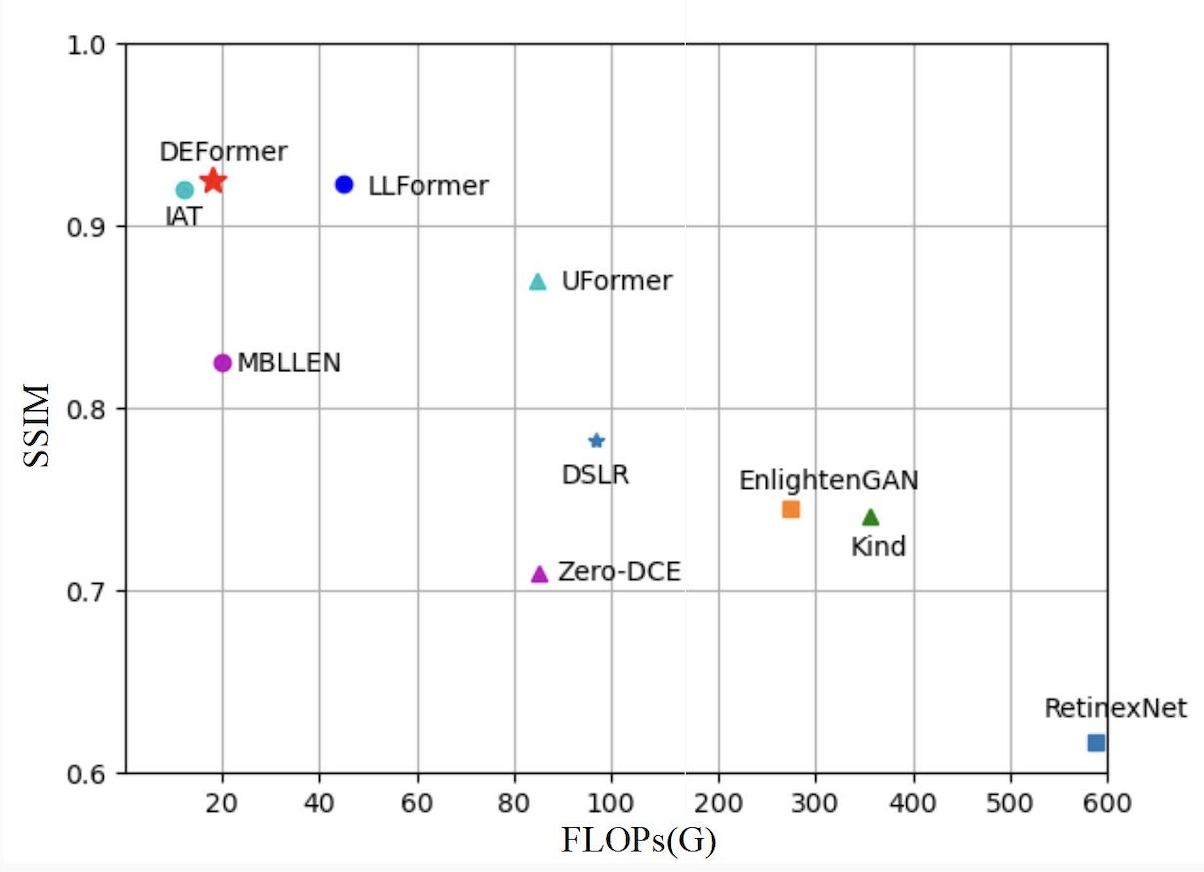
(c) Performance comparison
Discrete cosine transform (DCT) is an important part of frequency signal analysis, which has been proven effective in computer vision. DCT concentrate the energy in the image and aggregate information. At present, the frequency has been applied in the fields of camouflage object detection[16, 17], face super resolution[18] and so on [19, 20]. However, Currently DCT has not been applied to low-light enhancement, and most of the previous networks learn features in the spatial domain. The properties of DCT are important both for the problem of excessive image enhancement and for the recovery of lost information. The performance comparison of different SOTA methods is shown in Fig. 1 (c). Taking the SSIM and Flops as a reference in the MIT-Adobe FiveK dataset, we found that our model has high SSIM, and FLOPs is only 17.96G.
Inspired by the frequency, in this paper we propose a DCT-driven enhancement transformer (DEFormer) for low-light enhancement. To embed the information of DCT into the network as new clue, we propose a learnable frequency branch (LFB) that contains DCT processing and curvature-based frequency enhancement (CFE). First, we divide the image in to patches and process them through DCT and each feature channel is a frequency band. In CFE, we use the learnable curvature to calculate the content richness of each frequency band, and divide the frequency information into high part and low part to enhance respectively, so that the model pays more attention to the frequency band features with richer texture. In addition, we propose a cross domain fusion (CDF) for reducing the differences between different domains. We adopt LOL[11] and MIT-Adobe FiveK[21] datasets for low-light enhancement experiments and the results show that DEFormer achieves advanced performance comparing with other state-of-the-art methods. We achieve effective improvements on ExDark[3] and DARK FACE[4] datasets through end-to-end finetuning.
Our contributions are summarized as follows:
-
•
Combining DCT with transformer, we propose a DCT-driven enhancement transformer (DEFormer) for low-light enhancement. We design a learnable frequency branch (LFB) to embed frequency clue. In the frequency, DEFormer recovers the information lost in the dark areas, bringing effective improvements to downstream detection tasks.
-
•
We propose curvature-based frequency enhancement (CFE) to adaptively focus on frequency-band channels with rich textures. In addition, to reduce the differences between two domains, we propose a cross domain fusion (CDF) to fuse the features of RGB domain and frequency domain.
-
•
DEFormer has obtained advanced results on public datasets, and end-to-end training of DEFormer and detectors has a outstanding performance improvement for downstream dark detection tasks.
II Related Work
Initially, images were enhanced through traditional methods, which were to balance the brightness and contrast of images through mathematics or statistics. Guo et al. [22] proposed a low-light image enhancement (LIME) by finding the maximum value in different channels and adding a structure to refine the initial light map. Although traditional methods have achieved certain results, their generalization is poor. Based on CNN, the model can directly learn the low-light to normal-light mapping with better image generation quality. Chen et al. [11] proposed RetinexNet, which uses Retinex theory in CNN for image enhancement. Ma et al. [13] propose a self-calibrating illumination (SCI) for fast and robust low-light enhancement. SCI proposes an illumination learning with weight sharing, and builds a self-calibration module to gradually converge at each stage. Many current deep learning-based methods over-enhance the brightness of images, and do not pay attention to recovering lost details, and their help for advanced vision tasks is limited. Even the parameters of some models are too complex, which puts pressure on the real-time performance of the vision system.
There are currently some works proposed for bad scenes such as night. Kalwar et al. [23] proposed a gated differentiable image processing (GDIP) block for end-to-end training with detector, which is applied to object detection in bad weather. Yin et al. [2] proposed PENet for robust object detection in dark environments. Zheng et al. [24] proposed an end-to-end trained image enhancer for nighttime depth estimation.
The frequency domain is an important part of image signal processing and has been proven to be an effective method in many fields of computer vision. In the frequency domain, Qian et al. [25] proposed Frequency in Face Forgery Network (F3Net), which achieved DeepFake detection by constructing Frequency-aware Image Decomposition (FAD) and Local Frequency Statistics (LFS). Zhong et al. [16] integrated frequency domain information into CNN for concealed object detection, and designed a frequency enhancement module (FEM) for mining clues of concealed objects. Qin et al. [26] used the frequency domain to analyze the channel representation, and proposed a multi-spectral attention method FCANet. Yu et al. [27] combines frequency domain and spatial domain information to achieve image dehazing. The methods described above would have used frequency-domain information for many directions in computer vision, but there is currently no work using the discrete cosine transform (DCT) for low-light image enhancement. In this paper, we joint Transformer [28] with discrete cosine transform, and use frequency domain information as clues to mine lost details in dark areas.
III Method
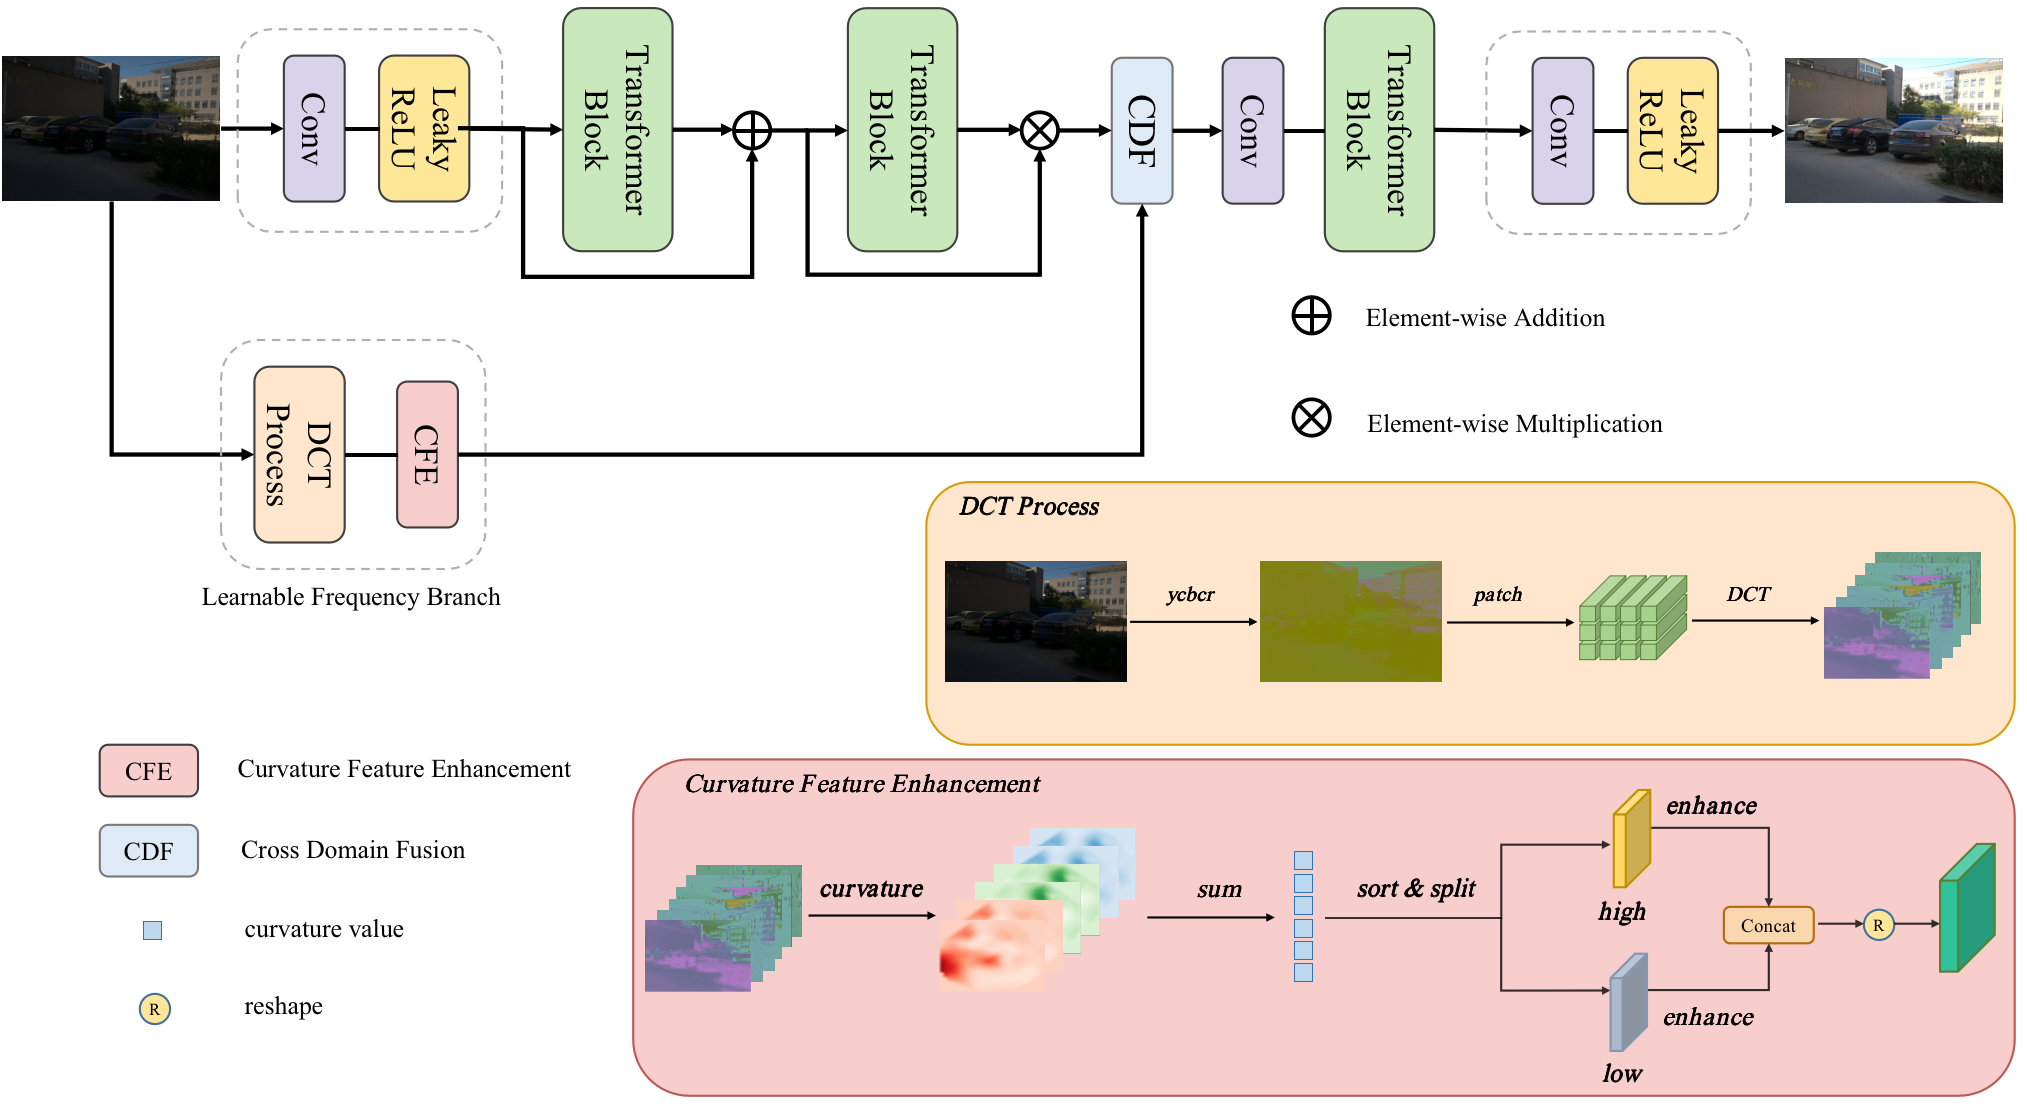
The overview of DEFormer is shown in Fig. 2. Taking the low-light image as input, first we extract the shallow features through a convolution activated by Leaky ReLU. Then we apply two transformer blocks to predict a multiple map and an add map respectively, and get the feature of the RGB domain . In the learnable frequency branch (LFB), we first perform DCT processing on , and then divide it into high and low parts through the curvature-based frequency enhancement (CFE) and enhance them respectively, then by tensor concat we obtain the features . Then we reshape to and extract features through convolution to get the feature of the frequency domain . We reduce the differences of domain between and by cross fusion in cross domain fusion (CDF). After fusion, we apply a transformer block to extract deep features . Finally, we use a convolution and Leaky ReLU function to obtain the enhanced image .
III-A Learnable Frequency Branch
Most of the existing methods apply complex techniques to enhance images in the RGB domain. However, recovering lost details in dark regions is difficult with only in the RGB domain. Therefore, we apply DCT to introduce the frequency as a additional clue. The learnable frequency branch (LFB) consists of DCT processing and curvature-based frequency enhancement (CFE), as shown in Fig. 2.
DCT process. Given an RGB image , convert it to the color space of YCbCr to get . Then we split in each channel according to the patch of to get . After that, we process each patch through slide window DCT to obtain local frequency information. DCT has the characteristics of energy concentration, most signals will be concentrated in the low-frequency part after DCT processing, which properly summarizes the rules between image pixels. As shown in Fig. 1 (b), the information is concentrated in the upper left corner of the spectrum, which is also helpful for the separation of noise. The DCT processing of the image is described as
| (1) | |||
where and , is the frequency signals and is RGB signals. We attribute all the components of the same frequency band to a channel, and get the feature in the frequency domain.
Curvature-based frequency enhancement. In 2D surfaces, the average curvature can represent the surface roughness, which originates from the details of the image. Due to each channel is a different frequency band, we measure different frequency bands on the channel based on the curvature to obtain the quantization parameter of the feature on each channel. The larger the parameter, the richer the information in the channel. Set a curved surface , the average curvature will be calculated as
| (2) |
However, this nonlinear curvature formula has a large amount of calculation. we adopt another linear curvature calculation method, this process is described as
| (3) |
where represents the frequency feature, represents the curvature map, represents initial weight, adapting to the network through microscopic during the training process.
| (4) |
then we sum the curvature map in two dimensions to obtain an energy vector representing each channel. Then we sort and divide the frequency features into high part and low part according to 3:1. The high part has most of the details in the frequency. In high part we apply several and skip connection to enhance frequency domain information. In the low part, we use a convolution for simple calibration. Then the two parts are concat in channel dimensions. Finally, we reshape the enhanced to , and use a convolution to get the enhanced frequency domain feature .
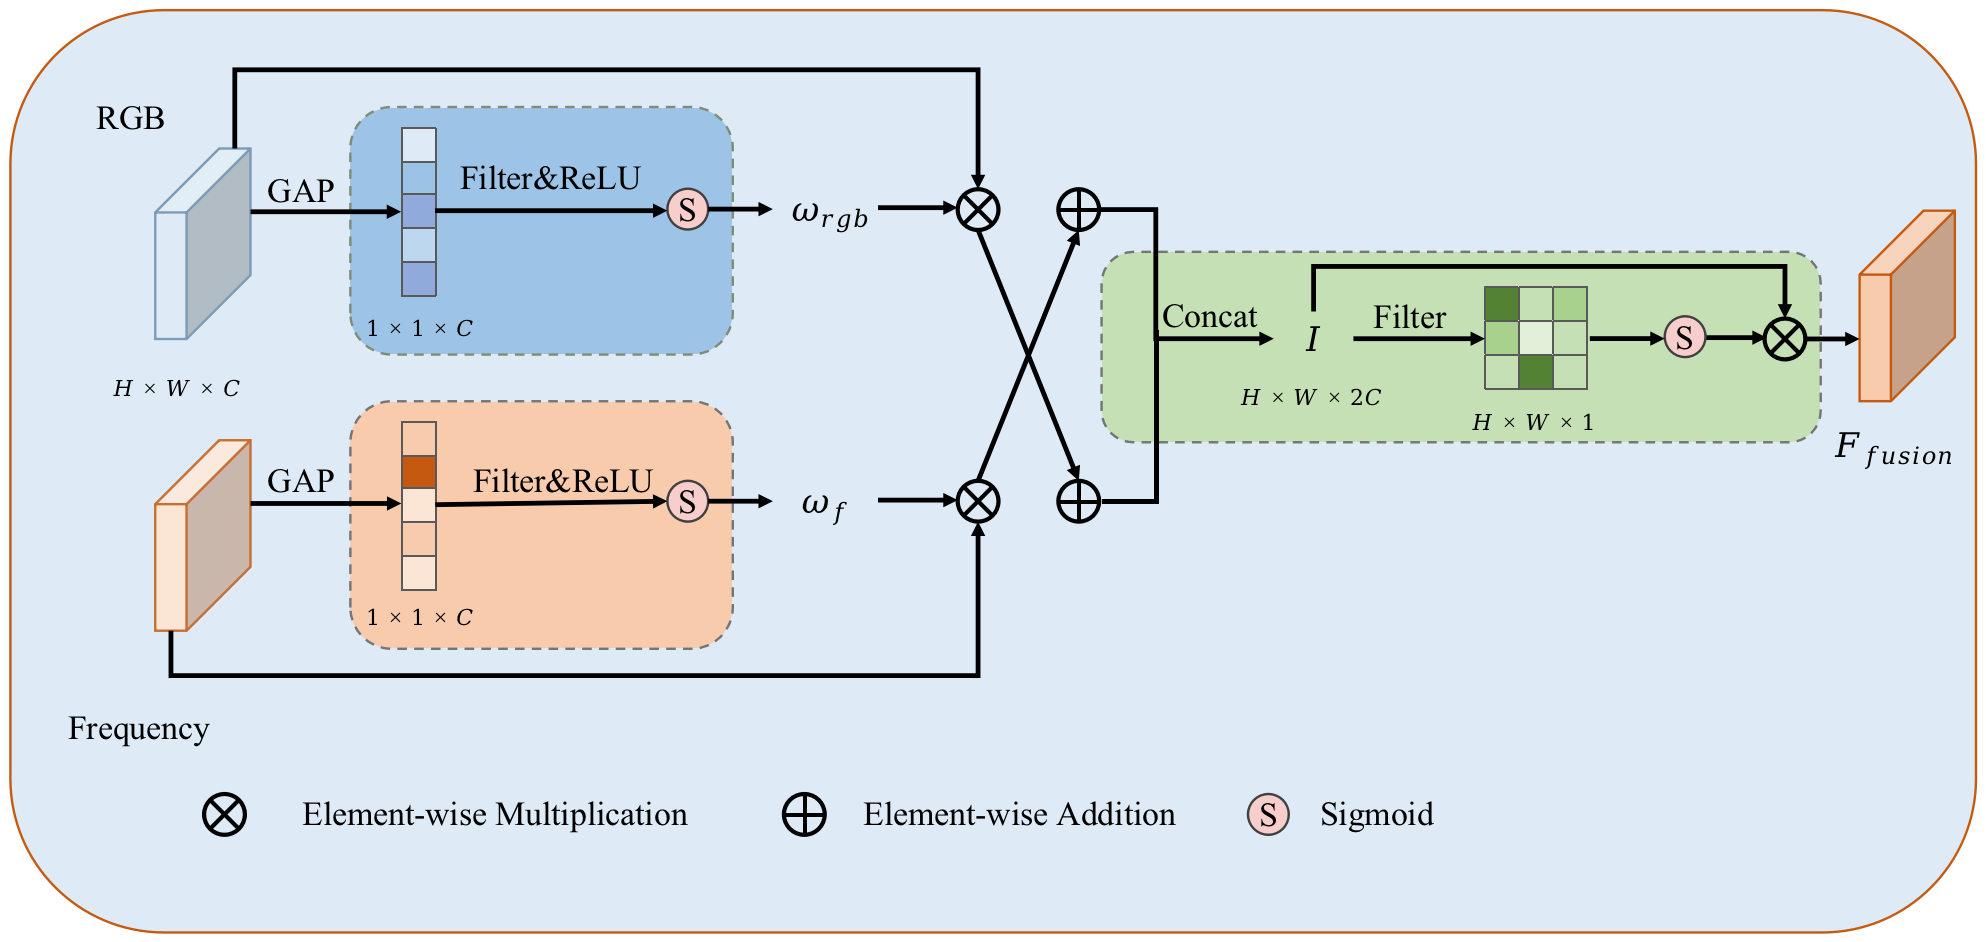
III-B Cross Domain Fusion
The feature of the frequency domain and the feature of the RGB domain are not consistent, so we design a cross domain fusion (CDF) to reduce the differences between two domains, as shown in Fig. 3 . Different from the add or multiple operations in normal fusion, we use a cross fusion to achieve complementarity between domains. First, we obtain global information by global average pooling along the channels, and then obtain attention vectors through two filters respectively. This process is described as
| (5) |
| (6) |
where represents the sigmoid function, and we need to scale the weights to . GAP represents global average pooling. The weights can effectively suppress the importance of the noisy part, allowing the network to utilize the most informative RGB representation. Then we adopt cross fusion, which is described as
| (7) |
where represents the features of the initial fusion, and represents the tensor concat. This process effectively reduce the large differences between domains and improve the feature representation of fusion. The features of two domains are closely complementary in space, and we apply a soft attention to control the spatial information and attenuate the propagation of noise. We apply a convolution and sigmoid function to obtain the information of in the spatial dimension and recalibrate it. The activation of low confidence regions will also be suppressed, obtaining a more robust fusion representation. The process is as follows
| (8) |
where is the feature after fusion.
|
|
|
| YOLOv3 | Kind | |
|
|
|
| MBLLEN | DEFormer |
| Model | Venue | LOL | MIT-Adobe FiveK | Parameters(M) | FLOPs(G) | ||
|---|---|---|---|---|---|---|---|
| PSNR | SSIM | PSNR | SSIM | ||||
| RetinexNet[11] | BMVC2018 | 16.77 | 0.562 | 12.51 | 0.671 | 0.84 | 587.47 |
| MBLLEN[29] | MM2018 | 17.90 | 0.715 | 19.78 | 0.825 | 20.47 | 19.95 |
| Kind[12] | MM2019 | 20.86 | 0.790 | 14.54 | 0.741 | 8.16 | 356.72 |
| Zero-DCE[14] | MM2019 | 14.86 | 0.589 | 13.20 | 0.709 | 0.08 | 84.99 |
| ExCNet[30] | MM2019 | 15.78 | 0.515 | 13.98 | 0.710 | 8.27 | - |
| EnlightenGAN[31] | TIP2021 | 17.48 | 0.677 | 13.26 | 0.745 | 8.64 | 273.24 |
| DSLR[32] | TMM2022 | 15.05 | 0.597 | 16.63 | 0.782 | 14.93 | 96.68 |
| IAT[33] | BMVC2022 | 21.87 | 0.788 | 25.10 | 0.920 | 0.09 | 12.16 |
| UFormer[34] | CVPR2022 | 19.39 | 0.786 | 21.92 | 0.870 | 5.29 | 84.94 |
| Restormer [35] | CVPR2022 | 22.37 | 0.816 | 24.92 | 0.911 | 26.13 | 281.98 |
| LLFormer[36] | AAAI2023 | 23.64 | 0.816 | 25.75 | 0.923 | 24.55 | 45.04 |
| PairLIE[37] | CVPR2023 | 19.51 | 0.736 | - | - | 3.42 | 179.58 |
| DEFormer (Ours) | - | 23.73 | 0.821 | 25.14 | 0.925 | 2.25 | 17.96 |
|
|
|
|
| YOLOv3 | DEFormer |
IV Experiments
For low-light enhancement, we apply the LOL and MIT-Adobe FiveK datasets. LOL consists of 500 low-light-normal image pairs, each of size , of which 485 pairs are used for training and 15 for testing. The MIT-Adobe FiveK dataset contains 5,000 images, each of which is manually enhanced by five different experts. We adopt ExDark and DARK FACE datasets to verify the performance improvement of our DEFormer on detection tasks. ExDark has collected 7363 low-light images with 12 categories of object annotations, which are used for dark object detection research. We split ExDark and 80% as training set and 20% as testing set. DARK FACE has 6000 real low-light images, annotated with boxes of faces.
We conduct our experiments under Ubuntu 18.04, Pytorch, RTX 3090. In low-light enhancement, we use SGD and set the initial learning rate and weight decay to 0.0001 and 0.00005, respectively. During training, epoch is set to 1000, and batch-size is set to 8. To simplify the experiment of the downstream object detection task, we use mmdetection as the framework. During training, the image will undergo basic data augmentation such as flipping, and the batch-size and epoch are set to 8 and 30, respectively. The optimizer is SGD, and the initial learning rate and weight decay are 0.001 and 0.0005, respectively.
In the experiments of the low-light image enhancement model, we use PSNR and SSIM for evaluation, which are commonly used image quality evaluation indicators. When evaluating detectors, we adopt mAP, which is described as
| (9) |
where is the number of class, and is the average precision of each category, calculated by the area of the Precision-Recall curve. When evaluating the complexity and calculation amount of the model, we use the parameters and Flops to calculate respectively.
|
|
|
|
|
|
|
|

|
|
|
|
|
|
|
|
|
|
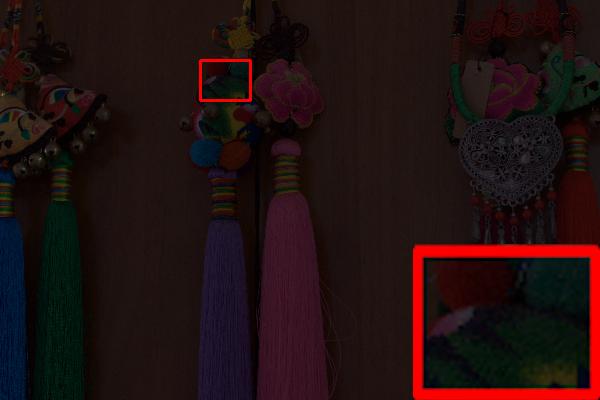
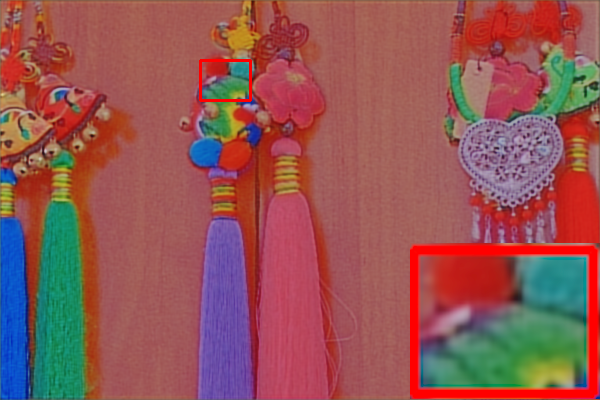
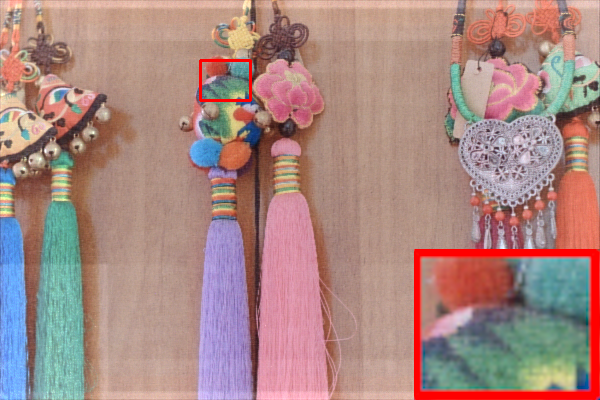
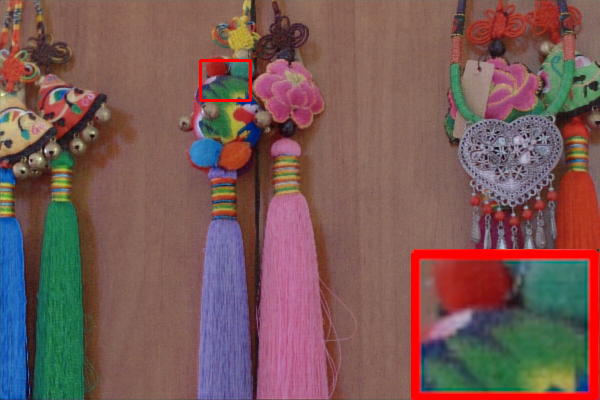
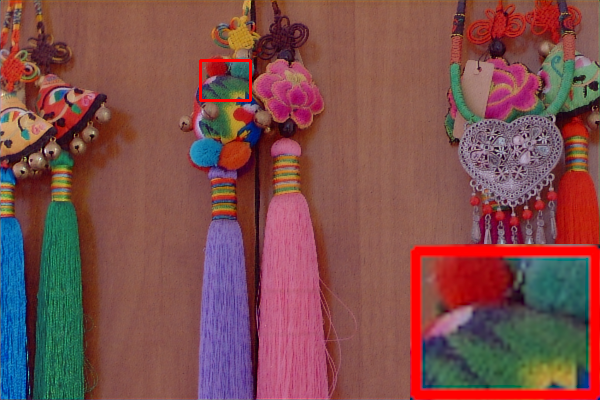
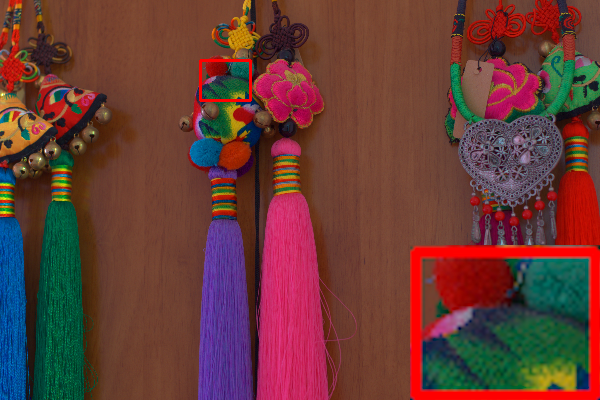
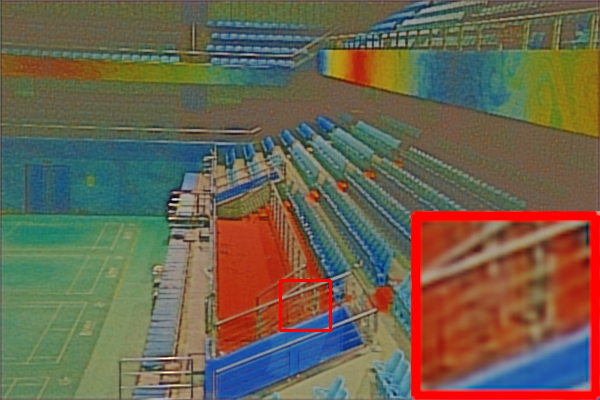
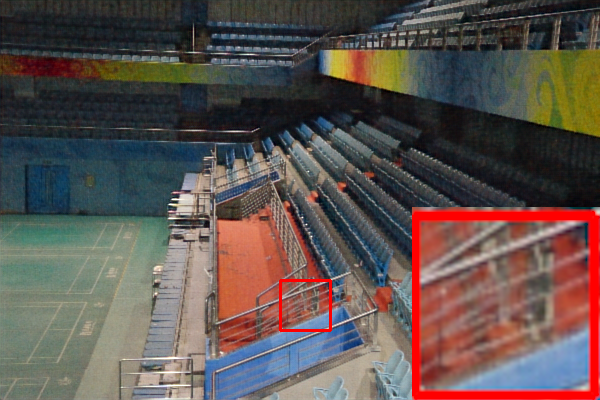
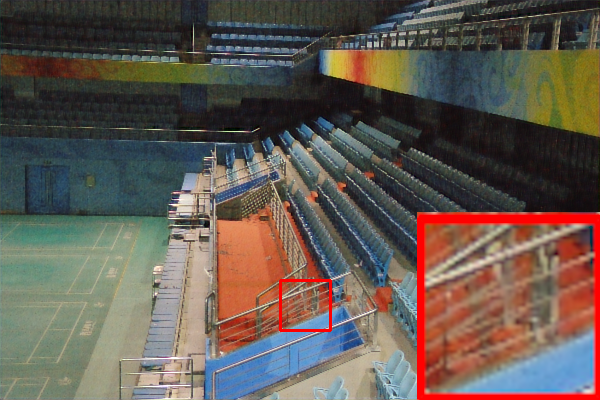
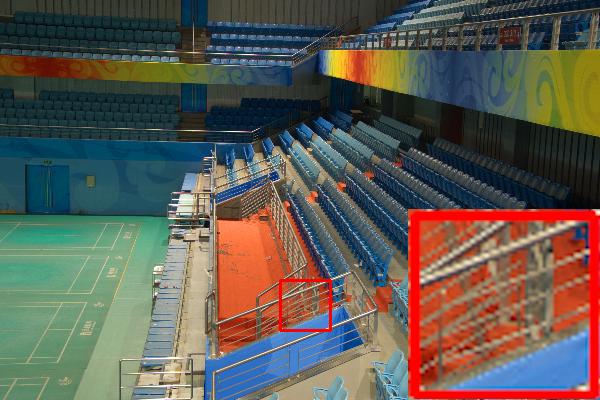
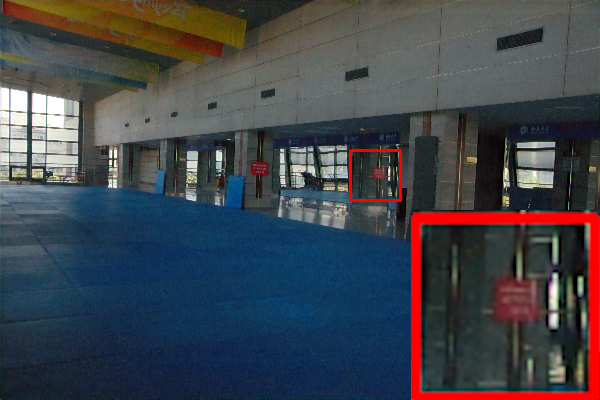
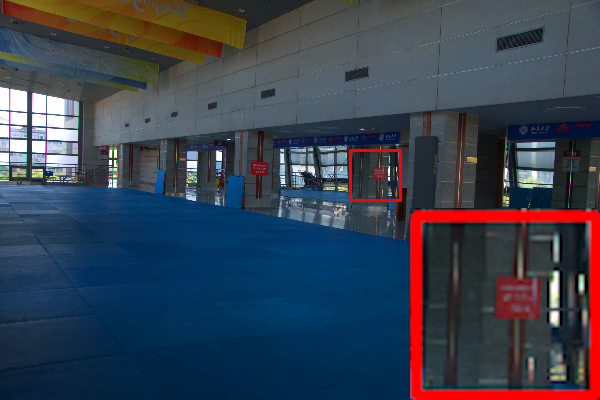
| Input | RetinexNet | UFormer | LLFormer | DEFormer | GT |
IV-A Comparison of Low-light Enhancement
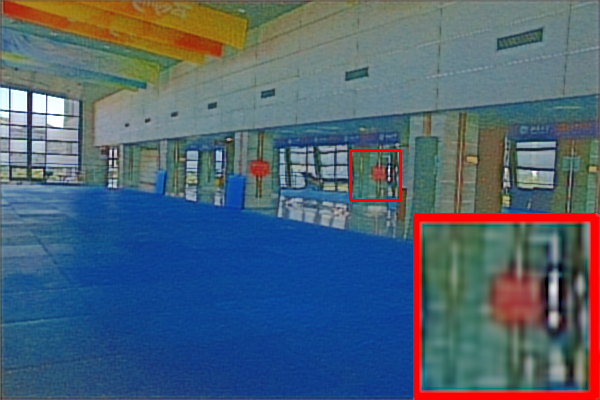
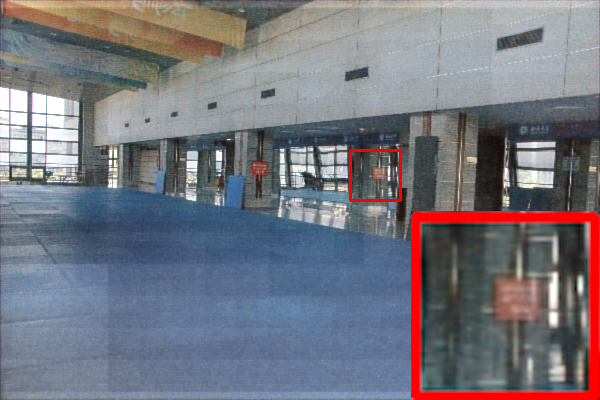
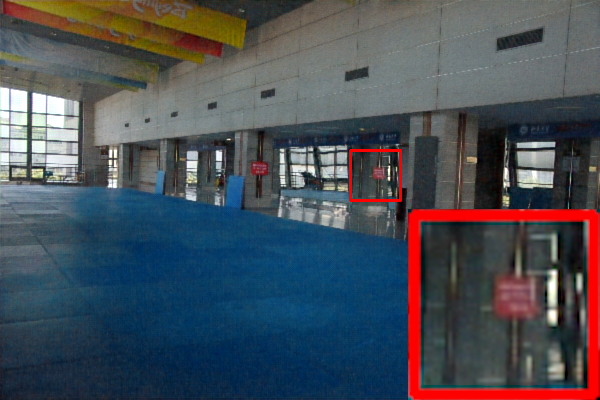
We quantitatively compared DEFormer with other state-of-art methods such as RetinexNet [11], Uformer [34], LLFormer [36], and IAT [33]. The results are shown in Table I. Our DEFormer has achieved advanced results in both the LOL and MIT-Adobe FiveK datasets, and the parameters also achieves the second best result in all models, only 17.96G. We visualize the results of some SOTA models and DEFormer in the LOL dataset, as shown in Fig. 6. We found that RetinexNet enlarge the noise when enhancing the image and is like a crayon figure, which affects the visual beauty. UFormer has some color distortion. Although LLFormer generates good quality, it has a certain loss of detail. In contrast our method has high quality in both texture and color.
|
|
|
|
|---|---|---|---|
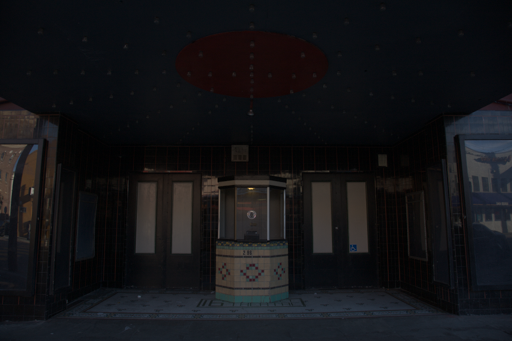
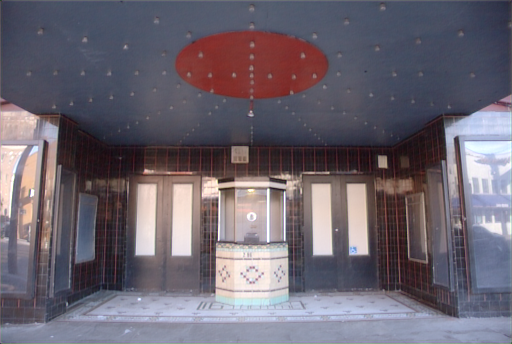
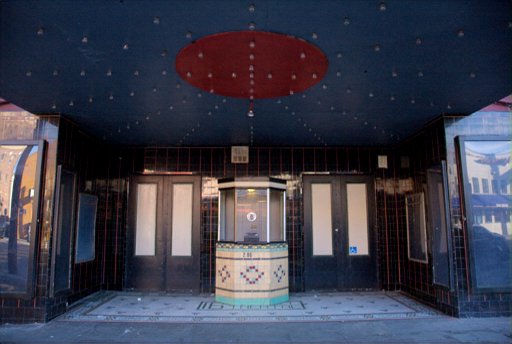
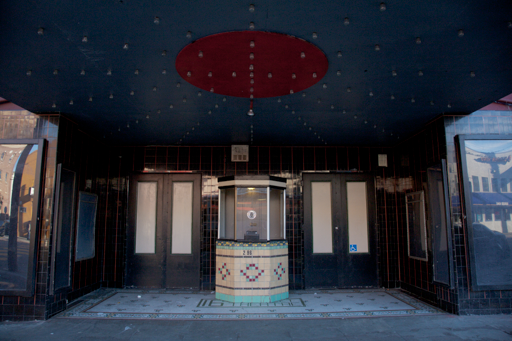
| Input | Baseline | DEFormer | GT |
(a) Visualization of enhancement.
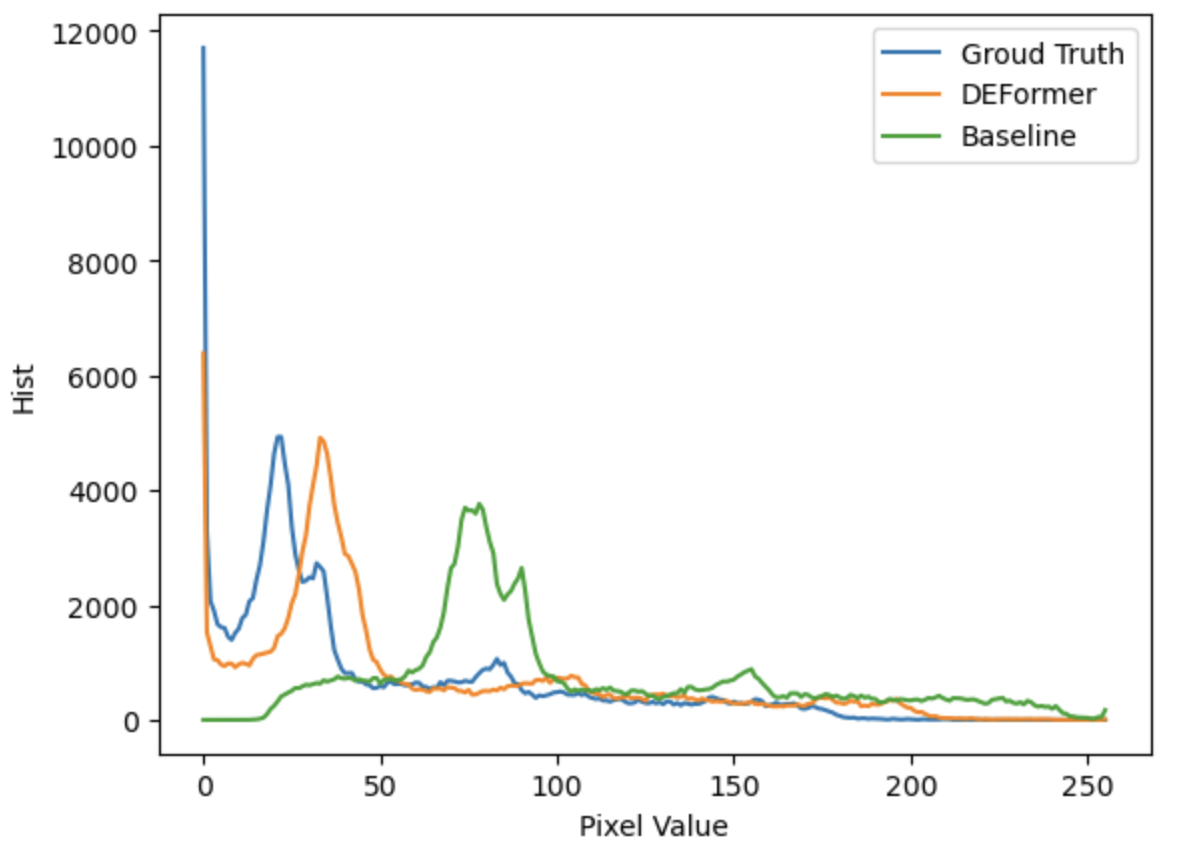
(b) Visualization of histograms.
IV-B Results of Downstream Detection Task
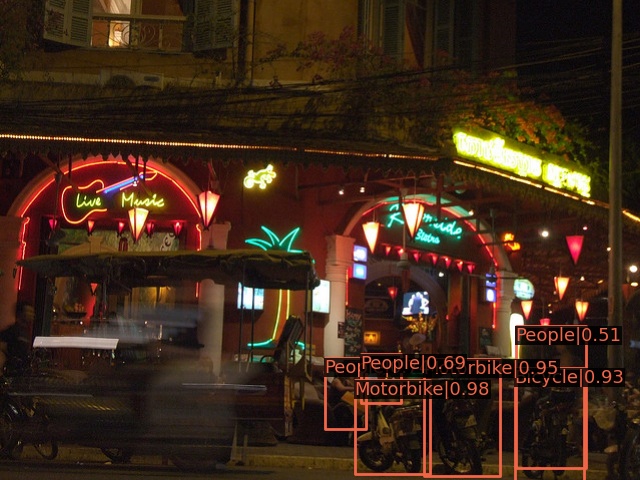
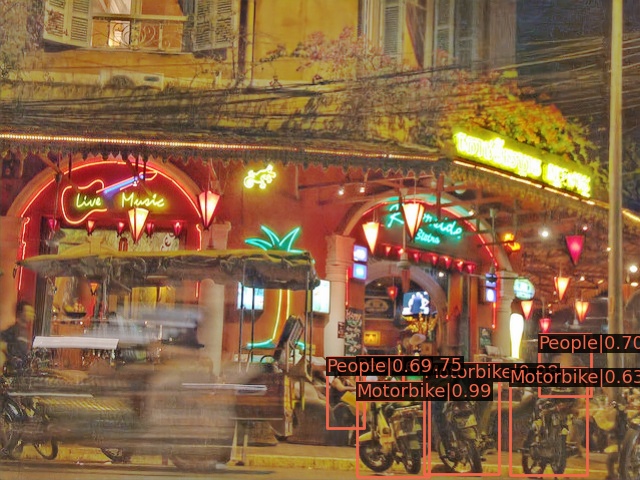
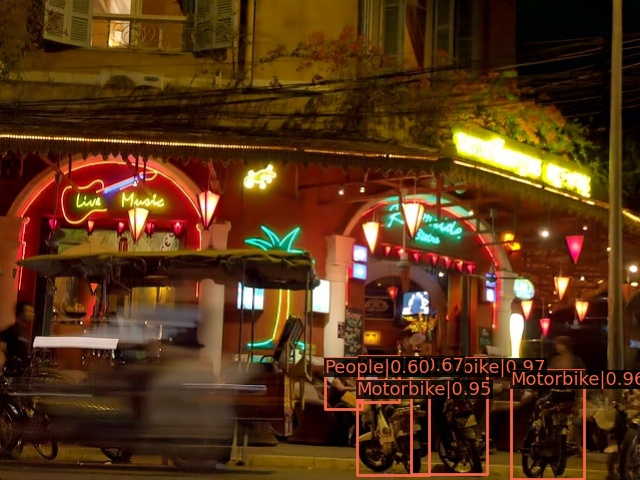
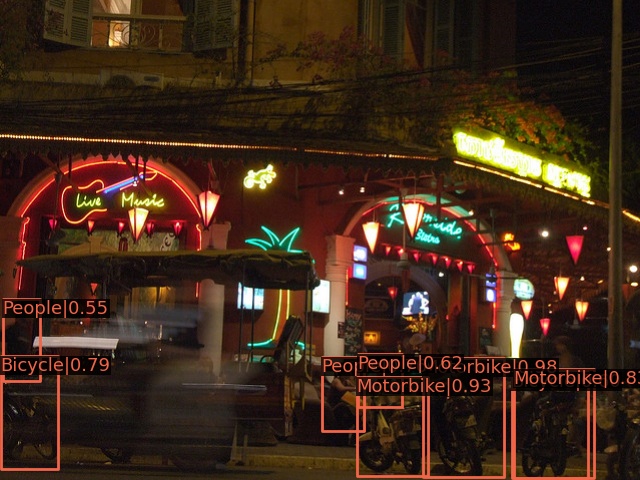
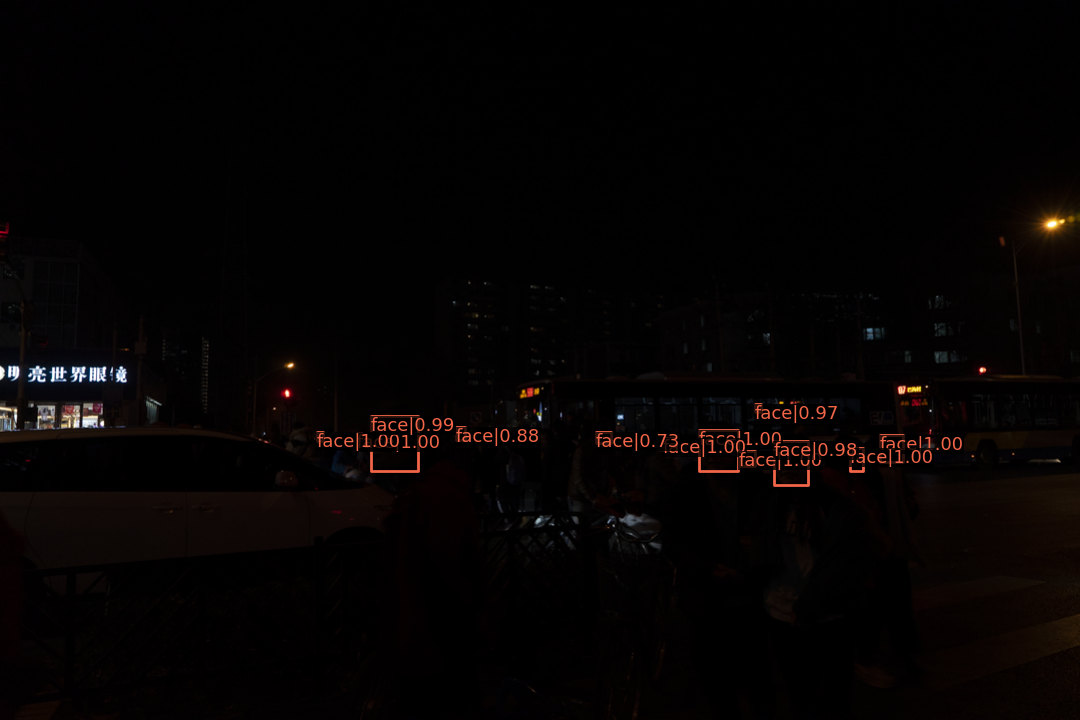
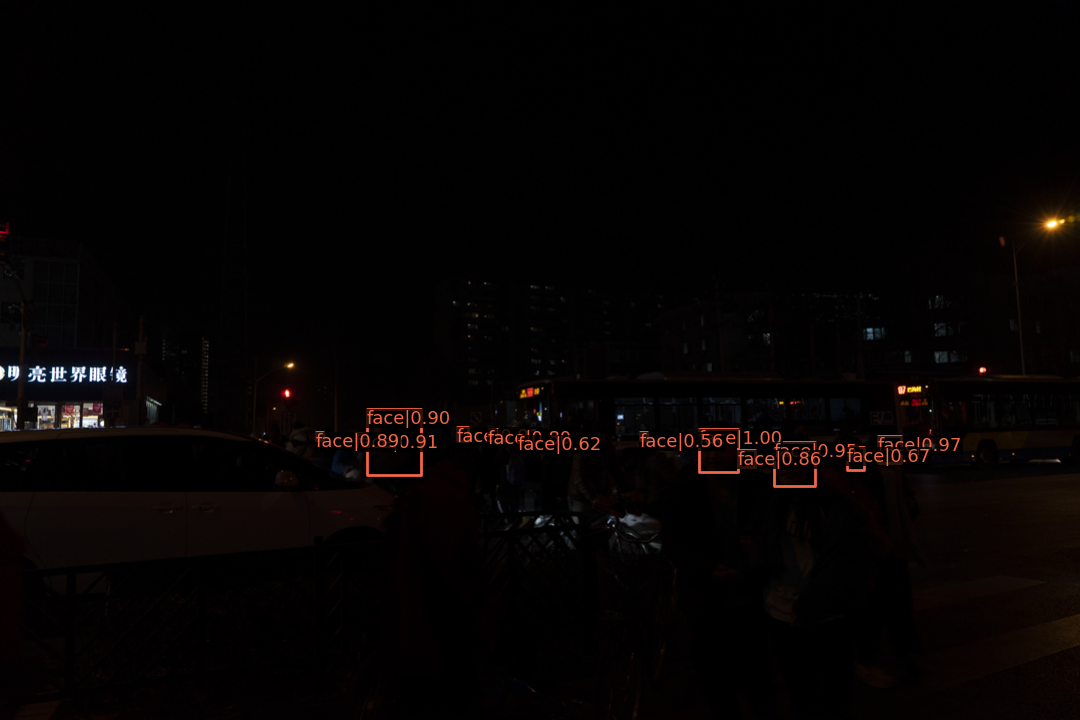
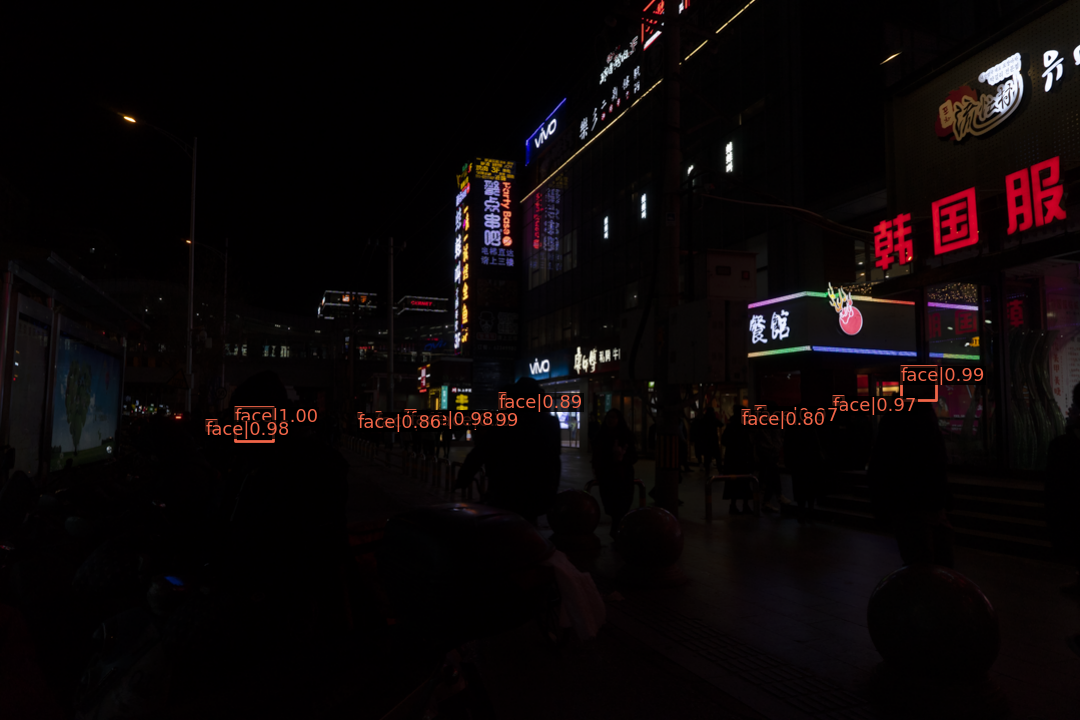
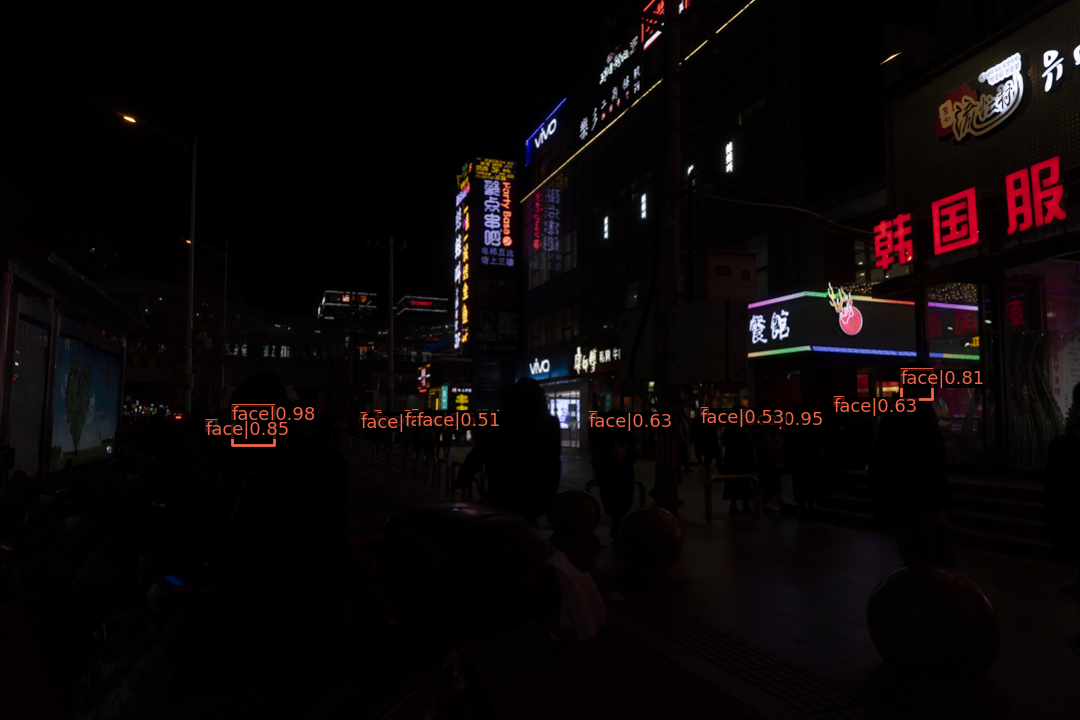
We use different models for object detection and face detection in dark environments, and the results are shown in Table II. The detector used in all experiments in this section is YOLOv3. We fine-tune DEFormer and detectors through end-to-end training. Our DEFormer has achieved effective improvements in both the ExDark and DARK FACE datasets, which are 2.1% and 3.4% higher than baseline in mAP, respectively. Additionally, we visualize in ExDark and DARK FACE datasets, as shown in Fig. 4 and Fig. 5, respectively. We find that after being enhanced by DEFormer, problems such as missed detection of the detector have been greatly improved. Experiments show that DEFormer has an outstanding performance improvement for downstream detection tasks, which increases 2.1% in ExDark dataset and 3.4% in DARK FACE dataset on mAP.
| Component | PSNR/SSIM | FLOPs (G) | Para(M) |
|---|---|---|---|
| Baseline | 21.12/0.793 | 13.54 | 1.24 |
| LFB(FI) | 21.57/0.797 | 13.78 | 1.28 |
| LFB(CFE+FI) | 22.14/0.805 | 15.48 | 2.20 |
| LFB+CDF | 23.73/0.821 | 17.96 | 2.25 |
IV-C Ablation Study
To verify the effectiveness of each component in DEFormer, we conducted ablation studies on the LOL dataset, and the results are shown in Table III. We directly added the frequency domain information to the network. Compared with the baseline, PSNR and SSIM increased by 0.45 and 0.004 respectively, indicating that the frequency domain is effective as a clue, but the direct embeded method is not suitable. After adopting the curvature-based frequency enhancement, PSNR and SSIM are 1.02 and 0.012 higher than the baseline, respectively, which shows that the curvature-based frequency enhancement is effective. After using cross domain fusion, PSNR and SSIM have increased by 2.61 and 0.028, respectively, which shows that cross fusion can well reduce the differences in RGB features and frequency features. We visualize the outputs of baseline and DEFormer and the corresponding histogram, as shown in Fig. 7. It can be found that the baseline is too bright, and our enhancement results solve this problem well, with a histogram similar to ground truth. Overall, this ablation study shows that using frequency information as additional clue in the network is an effective solution.
V CONCLUSIONS
In this paper, we propose a DCT-driven enhancement transformer (DEFormer) using frequency as a new clue, which mainly includes learnable frequency branch (LFB) and cross domain fusion (CDF). Extensive experiments show that DEFormer not only outperforms state-of-the-art methods in low-light enhancement, but also improves downstream detection tasks well as preprocessing.
References
- [1] T.-Y. Lin, M. Maire, S. Belongie, J. Hays, P. Perona, D. Ramanan, P. Dollár, and C. L. Zitnick, “Microsoft coco: Common objects in context,” in Computer Vision–ECCV 2014: 13th European Conference, Zurich, Switzerland, September 6-12, 2014, Proceedings, Part V 13. Springer, 2014, pp. 740–755.
- [2] X. Yin, Z. Yu, Z. Fei, W. Lv, and X. Gao, “Pe-yolo: Pyramid enhancement network for dark object detection,” 2023.
- [3] Y. P. Loh and C. S. Chan, “Getting to know low-light images with the exclusively dark dataset,” Computer Vision and Image Understanding, vol. 178, pp. 30–42, 2019.
- [4] W. Yang, Y. Yuan, W. Ren, J. Liu, W. J. Scheirer, Z. Wang, T. Zhang, Q. Zhong, D. Xie, S. Pu et al., “Advancing image understanding in poor visibility environments: A collective benchmark study,” IEEE Transactions on Image Processing, vol. 29, pp. 5737–5752, 2020.
- [5] T. Celik and T. Tjahjadi, “Contextual and variational contrast enhancement,” IEEE Transactions on Image Processing, vol. 20, no. 12, pp. 3431–3441, 2011.
- [6] H. Ibrahim and N. S. P. Kong, “Brightness preserving dynamic histogram equalization for image contrast enhancement,” IEEE Transactions on Consumer Electronics, vol. 53, no. 4, pp. 1752–1758, 2007.
- [7] A. M. Reza, “Realization of the contrast limited adaptive histogram equalization (clahe) for real-time image enhancement,” Journal of VLSI signal processing systems for signal, image and video technology, vol. 38, pp. 35–44, 2004.
- [8] E. H. Land, “The retinex theory of color vision,” Scientific american, vol. 237, no. 6, pp. 108–129, 1977.
- [9] M. Li, J. Liu, W. Yang, X. Sun, and Z. Guo, “Structure-revealing low-light image enhancement via robust retinex model,” IEEE Transactions on Image Processing, vol. 27, no. 6, pp. 2828–2841, 2018.
- [10] S. Wang, J. Zheng, H.-M. Hu, and B. Li, “Naturalness preserved enhancement algorithm for non-uniform illumination images,” IEEE transactions on image processing, vol. 22, no. 9, pp. 3538–3548, 2013.
- [11] C. Wei, W. Wang, W. Yang, and J. Liu, “Deep retinex decomposition for low-light enhancement,” arXiv preprint arXiv:1808.04560, 2018.
- [12] Y. Zhang, J. Zhang, and X. Guo, “Kindling the darkness: A practical low-light image enhancer,” in Proceedings of the 27th ACM international conference on multimedia, 2019, pp. 1632–1640.
- [13] L. Ma, T. Ma, R. Liu, X. Fan, and Z. Luo, “Toward fast, flexible, and robust low-light image enhancement,” in Proceedings of the IEEE/CVF Conference on Computer Vision and Pattern Recognition, 2022, pp. 5637–5646.
- [14] C. Guo, C. Li, J. Guo, C. C. Loy, J. Hou, S. Kwong, and R. Cong, “Zero-reference deep curve estimation for low-light image enhancement,” in Proceedings of the IEEE/CVF conference on computer vision and pattern recognition, 2020, pp. 1780–1789.
- [15] K. He, X. Zhang, S. Ren, and J. Sun, “Deep residual learning for image recognition,” in Proceedings of the IEEE Conference on Computer Vision and Pattern Recognition (CVPR), June 2016.
- [16] Y. Zhong, B. Li, L. Tang, S. Kuang, S. Wu, and S. Ding, “Detecting camouflaged object in frequency domain,” in Proceedings of the IEEE/CVF Conference on Computer Vision and Pattern Recognition, 2022, pp. 4504–4513.
- [17] M.-Q. Le, M.-T. Tran, T.-N. Le, T. V. Nguyen, and T.-T. Do, “Unveiling camouflage: A learnable fourier-based augmentation for camouflaged object detection and instance segmentation,” arXiv preprint arXiv:2308.15660, 2023.
- [18] H. Huang, R. He, Z. Sun, and T. Tan, “Wavelet-srnet: A wavelet-based cnn for multi-scale face super resolution,” in Proceedings of the IEEE international conference on computer vision, 2017, pp. 1689–1697.
- [19] L. Liu, J. Liu, S. Yuan, G. Slabaugh, A. Leonardis, W. Zhou, and Q. Tian, “Wavelet-based dual-branch network for image demoiréing,” in Computer Vision–ECCV 2020: 16th European Conference, Glasgow, UK, August 23–28, 2020, Proceedings, Part XIII 16. Springer, 2020, pp. 86–102.
- [20] S. Fujieda, K. Takayama, and T. Hachisuka, “Wavelet convolutional neural networks for texture classification,” arXiv preprint arXiv:1707.07394, 2017.
- [21] V. Bychkovsky, S. Paris, E. Chan, and F. Durand, “Learning photographic global tonal adjustment with a database of input/output image pairs,” in CVPR 2011. IEEE, 2011, pp. 97–104.
- [22] X. Guo, Y. Li, and H. Ling, “Lime: Low-light image enhancement via illumination map estimation,” IEEE Transactions on image processing, vol. 26, no. 2, pp. 982–993, 2016.
- [23] S. Kalwar, D. Patel, A. Aanegola, K. R. Konda, S. Garg, and K. M. Krishna, “Gdip: Gated differentiable image processing for object detection in adverse conditions,” in 2023 IEEE International Conference on Robotics and Automation (ICRA). IEEE, 2023, pp. 7083–7089.
- [24] Y. Zheng, C. Zhong, P. Li, H.-a. Gao, Y. Zheng, B. Jin, L. Wang, H. Zhao, G. Zhou, Q. Zhang et al., “Steps: Joint self-supervised nighttime image enhancement and depth estimation,” arXiv preprint arXiv:2302.01334, 2023.
- [25] Y. Qian, G. Yin, L. Sheng, Z. Chen, and J. Shao, “Thinking in frequency: Face forgery detection by mining frequency-aware clues,” in European conference on computer vision. Springer, 2020, pp. 86–103.
- [26] Z. Qin, P. Zhang, F. Wu, and X. Li, “Fcanet: Frequency channel attention networks,” in Proceedings of the IEEE/CVF International Conference on Computer Vision (ICCV), October 2021, pp. 783–792.
- [27] H. Yu, N. Zheng, M. Zhou, J. Huang, Z. Xiao, and F. Zhao, “Frequency and spatial dual guidance for image dehazing,” in European Conference on Computer Vision. Springer, 2022, pp. 181–198.
- [28] A. Vaswani, N. Shazeer, N. Parmar, J. Uszkoreit, L. Jones, A. N. Gomez, Ł. Kaiser, and I. Polosukhin, “Attention is all you need,” Advances in neural information processing systems, vol. 30, 2017.
- [29] F. Lv, F. Lu, J. Wu, and C. Lim, “Mbllen: Low-light image/video enhancement using cnns.” in BMVC, vol. 220, no. 1, 2018, p. 4.
- [30] L. Zhang, L. Zhang, X. Liu, Y. Shen, S. Zhang, and S. Zhao, “Zero-shot restoration of back-lit images using deep internal learning,” in Proceedings of the 27th ACM international conference on multimedia, 2019, pp. 1623–1631.
- [31] Y. Jiang, X. Gong, D. Liu, Y. Cheng, C. Fang, X. Shen, J. Yang, P. Zhou, and Z. Wang, “Enlightengan: Deep light enhancement without paired supervision,” IEEE transactions on image processing, vol. 30, pp. 2340–2349, 2021.
- [32] K. Zhou, B. Zhang, W. X. Zhao, and J.-R. Wen, “Debiased contrastive learning of unsupervised sentence representations,” arXiv preprint arXiv:2205.00656, 2022.
- [33] Z. Cui, K. Li, L. Gu, S. Su, P. Gao, Z. Jiang, Y. Qiao, and T. Harada, “Illumination adaptive transformer,” arXiv preprint arXiv:2205.14871, 2022.
- [34] Z. Wang, X. Cun, J. Bao, W. Zhou, J. Liu, and H. Li, “Uformer: A general u-shaped transformer for image restoration,” in Proceedings of the IEEE/CVF conference on computer vision and pattern recognition, 2022, pp. 17 683–17 693.
- [35] S. W. Zamir, A. Arora, S. Khan, M. Hayat, F. S. Khan, and M.-H. Yang, “Restormer: Efficient transformer for high-resolution image restoration,” in Proceedings of the IEEE/CVF conference on computer vision and pattern recognition, 2022, pp. 5728–5739.
- [36] H. Jie, X. Zuo, J. Gao, W. Liu, J. Hu, and S. Cheng, “Llformer: An efficient and real-time lidar lane detection method based on transformer,” in Proceedings of the 2023 5th International Conference on Pattern Recognition and Intelligent Systems, 2023, pp. 18–23.
- [37] Z. Fu, Y. Yang, X. Tu, Y. Huang, X. Ding, and K.-K. Ma, “Learning a simple low-light image enhancer from paired low-light instances,” in Proceedings of the IEEE/CVF Conference on Computer Vision and Pattern Recognition, 2023, pp. 22 252–22 261.
- [38] J. Redmon and A. Farhadi, “Yolov3: An incremental improvement,” arXiv preprint arXiv:1804.02767, 2018.