Discovery of An X-ray Photoionized Optical Nebula and A Radio Nebula Associated with the ULX NGC 4861 X-1
Abstract
We have conducted long-slit spectroscopic observations and analyzed archival radio data for the ultraluminous X-ray source (ULX) NGC 4861 X-1. Our spectral line analysis unveils that NGC 4861 X-1 is the fourth ULX situated within an X-ray photoionized nebula, following three previous findings made approximately two decades ago. Remarkably, we discover NGC 4861 X-1 also possesses a radio nebula emitting optically thin synchrotron radiation, which contradicts its X-ray photoionization and raises doubts about the four ULXs being a mere coincidence. Instead of gradually accumulating from different bands bit by bit, our multi-band discovery is made all at once. Moreover, we tentatively perceive a faint continuum spectrum of the optical nebula. Further observations are needed to ascertain its radio structures and verify the optical continuum.
1 Introduction
Ultra-luminous X-ray sources (ULXs, Kaaret et al., 2017; Fabrika et al., 2021; King et al., 2023; Pinto & Walton, 2023) are off-nuclear X-ray sources with X-ray luminosities exceeding in nearby galaxies. They were once considered to be promising intermediate-mass black hole (IMBH) candidates due to their extreme . However, as more and more ULX pulsars are discovered (e.g., Bachetti et al., 2014), luminosity-based identifications have become feeble. It is now clear that the majority of ULXs are stellar-mass () objects accreting at super-Eddington rates rather than sub-Eddington IMBHs. In the ULX family, very few (e.g., Farrell et al., 2009; Pasham et al., 2014; Mezcua et al., 2015) are still considered to be IMBHs of decent quality.
Due to their large distances, most of the ULXs do not show optical counterparts even in HST images (Gladstone et al., 2013). Except for few ULXs (e.g., Motch et al., 2014; Liu et al., 2015) which have optical counterparts with confirmed stellar types, most of the optically visible ULXs are buried in extended nebular powered by shocks or X-ray photoionization, or usually both (Pakull et al., 2006; Abolmasov et al., 2007). Differentiating these mechanisms requires emission line diagnostics (Osterbrock & Ferland, 2006), commonly achieved by the examination of line ratios encompassing elements such as hydrogen, oxygen, sulphur and nitrogen. Furthermore, He II4686, which needs strong UV or X-ray photons (54 eV) to produce, favors X-ray photoionization. The presence of emission line broadening implies the existence of shocks. For instance, in the large optical bubble (452 x 266 pc) of NGC 1313 X-1 (Gúrpide et al., 2022), shock ionization was revealed by [O I]6300 and [SII]6716 in the outer regions, while a highly ionized zone (140 pc) traced by [O III]5007/Hβ was detected in the interior region.
The interactions of ULXs with their surrounding environment occur across multi-bands, primarily via winds or jets, releasing vast amounts of radiation energy and mechanical power (Pinto & Walton, 2023). However, similarly, it is noteworthy that only a limited number of ULXs have been detected in the radio bands, indicating a relatively low probability of detection (Mezcua et al., 2013). A handful of their counterparts are identified to be radio bubbles (e.g., Berghea et al., 2020) inflated by jets or winds. Approximately five ULXs display radio emission formed by core or lobes. To date, Ho II X-1 (Cseh et al., 2014) is unique as it is the only one where the radio core and two radio lobes have been resolved. In the case of NGC 7793 S26 (Soria et al., 2010) and NGC 2276 3c (Mezcua et al., 2013), they each possess two radio lobes. However, M83 MQ1 (Soria et al., 2014) and M51 ULX-1 (Urquhart et al., 2018) only have a one-sided lobe.
Based on emission line diagnostics, there have been three ULXs identified to have X-ray photoionized optical nebulae. They are NGC 6946 ULX-1 (Blair & Fesen, 1994; Abolmasov et al., 2008), NGC 5408 X-1 (Kaaret & Corbel, 2009) and the aforementioned Ho II X-1 (Pakull & Mirioni, 2002; Kaaret et al., 2004). Meanwhile, they all have extended but small (20–50 pc) radio nebulae with optically thin synchrotron emission and 5 GHz luminosities of 2–11 (van Dyk et al., 1994; Lang et al., 2007; Cseh et al., 2014), which apparently contradict their X-ray photoionization. Here we present multi-wavelength observations of the ULX NGC 4861 X-1. Through long-slit optical observations and C-band Very Large Array (VLA) archival data analysis, we demonstrate that the source is embedded in an X-ray photoionized nebula and extended radio emission. We also perceive a possible continuum spectrum of its optical nebula.
2 The ULX and Its Data Analysis
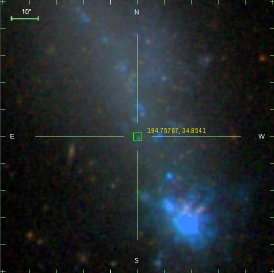
NGC 4861 X-1 (aka. CXOU J125901.8345115), also dubbed as IXO 73 in Colbert & Ptak (2002), is a ULX located in a cometary blue compact dwarf (BCD) galaxy NGC 4861 (aka. Arp 266 or I Zw 49). BCD galaxies are characterized by their irregular morphology, with a bright off-centered star burst region that resembles a comet’s head, which means Mrk 59 for NGC 4861 (Markaryan, 1967), and a fainter body that resembles a comet’s tail. Accordingly, NGC 4861 (Fig.1, left) contains a large number of young, massive and blue stars, resulting in strong UV emission (Thuan et al., 2014). A recent IFU observation performed by the Calar Alto 3.5m telescope shows He II4686 emission in the central region of Mrk 59 comparable to the amount of Wolf-Rayet stars (Roche et al., 2023). No Cepheid variable stars have been reported in this galaxy to determine its distance. Two slightly different distances 10.7 Mpc (Thuan et al., 2014) and 9.95 Mpc (Ozdogan Ela et al., 2021), which are based on HI Kinematics and Tully-Fisher relation, respectively, were used in previous studies. We simply adopt a distance of 10 Mpc in this paper.
The main effective studies of NGC 4861 X-1 (Thuan et al., 2014; Ozdogan Ela et al., 2021) were based on HST photometry and X-ray analysis of XMM-Newton and Chandra data. The ULX has a persistent on the level of several erg s-1. However, despite the sparse sampling of X-ray observations (e.g., 2003-06, 2003-07 and 2003-12 by XMM-Newton; 2012-01 and 2018-03 by Chandra), it should be noted that NGC 4861 X-1 may vary, at least on a relatively long time scale. For example, regardless of the spectral model adopted (Table.7 of Ozdogan Ela et al., 2021), its Chandra fell by a factor of at least three between the observation in January 2012 (ObsID=12473) and four observations in March 2018 (e.g., ObsID=20993), but still remained around . Additionally, Colbert & Ptak (2002) reported that IXO 73’s ROSAT/HRI count rate increased by about five times within two observations separated by half a year.
The optical counterpart of NGC 4861 X-1 has been identified as a moderately isolated bright point source with a magnitude of in the HST/F814W band image (Thuan et al., 2014). The authors also suggest that the point source corresponds to a late-type O supergiant or a hypergiant star. However, both Thuan et al. (2014) and Ozdogan Ela et al. (2021) also argue the optical counterpart coincides with an HII region based on its HST/F658N image. Ozdogan Ela et al. (2021) also mentioned an optical spectroscopic observation conducted by Russia’s BTA-6 telescope in March 2020, but only the value of A(V) was reported.
2.1 Optical
Here we present two optical spectroscopic observations of NGC 4861 X-1’s optical counterpart in a time span of seven years.
2.1.1 Gran Telescopio Canarias
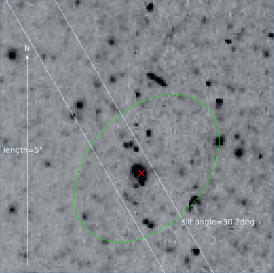
Our main observation (PI: Liu), which was simultaneous with a Chandra observation (ObsID=20992), was performed by the OSIRIS, the workhorse instrument of the 10.4 m Gran Telescopio Canarias (GTC) of Spain in March 2018. A 1 slit and a 30.2∘ slit angle from north to east (Fig.1, middle) were utilized to encompass the galaxy’s head area. However, subsequent data analysis revealed the head spectra are saturated due to its brightness. The target remained in the slit during the exposures, as confirmed by a slit image. A visual inspection of the optical counterpart suggests an obvious elongation, with the geometric center of the optical emission near the red X (Fig.1, middle). In the slit direction, the optical counterpart has an extension of ( pc at 10 Mpc). Perpendicular to the slit, the extension is roughly . The seeing was .
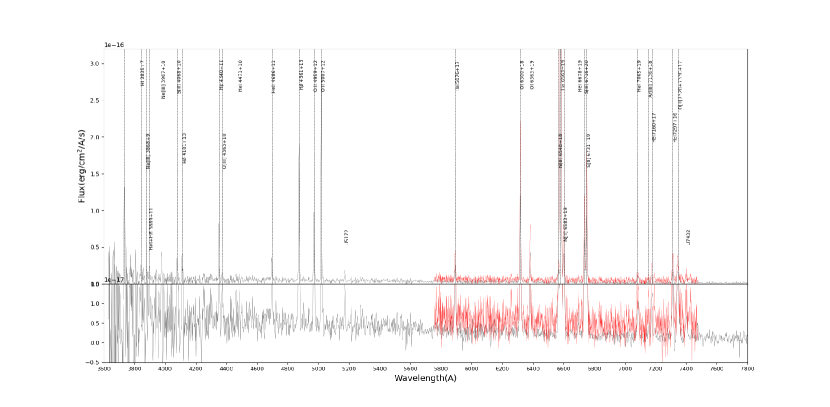
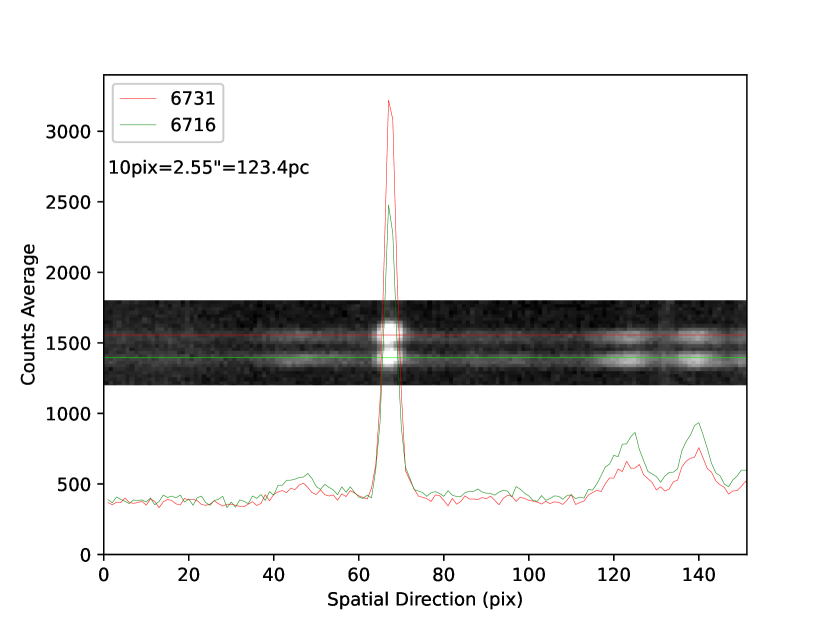
We used IRAF and followed standard procedures for the spectroscopic data reduction. Fig.2 demonstrates that both sub-spectra are primarily composed of emission lines. We used IRAF routine splot to determine the line properties. In the case of blended lines, such as the [S II] doublet, a Gaussian fit was utilized to deblend them. Uncertainties were obtained by calculating the mean values and standard deviations of these measurements, respectively (Kehrig et al., 2015). Results for the line properties of NGC 4861 X-1 are compiled in Table.1. There are two narrow emission lines unidentified (5172 and 7402 in Fig.2). They can not be attributed to second order contamination, as they did not appear in the blue grisms as R1000B111http://www.gtc.iac.es/instruments/osiris/. Additionally, they can not be classified as ghost lines, as they typically only manifest under highly illuminated conditions such as arcs and flats. Furthermore, no strong sky lines appear at 5172 or 7402 , leading us to conclude that the unidentified lines are from the ULX.
The optical counterpart has a negligible level of Galactic foreground extinction (A(V)=0.029 222https://irsa.ipac.caltech.edu/applications/DUST/), due to its high Galactic latitude (82.1∘). Assuming A(V)/E(B-V)=3.1 (Cardelli et al., 1989), the color excess E(B-V) is , which is consistent with the value of E(B-V)=0.01 for NGC 4861 in Table.4 of Leitherer et al. (2011). After correcting for the foreground extinction, we also corrected for the main extinction caused by NGC 4861 itself. Assuming a Case B scenario, beginning with electron density =100 cm-3 and electron temperature =10000 K, based on their corresponding theoretical Balmer line ratios Hα/Hβ=2.86, Hγ/Hβ=0.468 and Hδ/Hβ=0.259 (Storey & Hummer, 1995; Osterbrock & Ferland, 2006), we derived E(B-V), 0.537 and 0.716, respectively, if we adopt R(V)=4.05, which is common for star-burst galaxies (Calzetti et al., 2000). Note that when is around 10000 K, the intrinsic Balmer line ratios are not sensitive to , even if changes between 102 and 10.
We speculate that in this optical nebula E(B-V), and may be not unified but complicated and position-dependent, as reported in galaxy observations (Tremblay et al., 2018), despite the optical nebula being a point source compared to the slit width. Inconsistencies in E(B-V) may not be rare, but are often obscured due to the lack of sufficient wavelength coverage in ULX observations to cover enough Balmer lines simultaneously. Abolmasov et al. (2008) briefly addressed nonuniform electron densities in MF16 (NGC 6946 ULX-1). As shown in Fig.3, the sulphur line ratio changes as the distance to the nebular center changes, demonstrating that should be different. Reminded by the statements about the dust impact in MF16 (Abolmasov et al., 2008), we argue different dust destruction in different regions of our nebula might lead to position-dependent extinction. We also note that Roche et al. (2023) used Hγ/Hβ to estimate the extinction due to possible sub-theoretical ratios (Guseva et al., 2003; Gao et al., 2017) in NGC 4861, which was not seen by Noeske et al. (2000). As showed later, adopting which Balmer line ratio would not affect the recognition that the optical nebula of NGC 4861 X-1 is X-ray photoionized.
We naively adopted, like most of the papers, the E(B-V) based on Hα/Hβ to correct reddening (the third column of Table.1) in this paper. [OIII]4959,5007 and [SII]6716,6731 are good diagnostic lines to derive and , respectively. The [OII]3726,3729 doublet is also an indicator of , but this doublet could not be resolved in the GTC spectra. Using the IRAF routine temden, we obtained =22488 K and =3017 , respectively. Note that both line ratios are not sensitive to extinction correction due to their adjacent wavelengths. The electron density in this particular region is at least fifty times higher compared to other regions (Roche et al., 2023), and at least five times higher compared to other ULX nebulae (Abolmasov et al., 2008). It is not inconsistent with that found in HII regions (Hunt & Hirashita, 2009).
Based on Table.1, [O I]6300/Hα=21.5% indicates that NGC 4861 X-1 has warm and weakly ionized gas generated by X-ray photoionization (Pakull & Mirioni, 2002; Gúrpide et al., 2022). The [S II](6716+6731)/Hα=28.4% ratio and [O II](3727+3729)/[O III]5007=42.9% ratio (3727,3729 are blended, but can be fitted with a single Gauss profile) also favor X-ray photoionization (Smith et al., 1993; Moy & Rocca-Volmerange, 2002; Soria et al., 2021). The impact of reddening on line ratios is not significant enough to alter the determination of whether the nebula is X-ray photoionized. Adopting Hγ/Hβ like Roche et al. (2023) would only double the [O II](3727+3729)/[O III]5007 ratio, which still keeps this value within a safe range.
The immense L4686 additionally supports X-ray photoionization. According to our GTC observation, NGC 4861 X-1 is one of the brightest HeII emitters among ULXs (Abolmasov et al., 2007; Gutiérrez & Moon, 2014). Assuming spherical radiation, its corrected L4686 amounts to 3.5 erg s-1. Nevertheless, compared with other three X-ray photoionized ULXs, NGC 6946 ULX-1 ( in Abolmasov et al., 2008), NGC 5408 X-1 ( in Kaaret & Corbel, 2009) and Ho II X-1 ( in Kaaret et al., 2004), NGC 4861 X-1 just has a moderate L4686. It is worth noting that among the four ULXs, NGC 4861 X-1’s L4861 is least compatible with its theoretical L4861, as determined from Osterbrock (1989), primarily due to its notably higher electron density. In addition, we also examined line broadenings in order to analyze the potential impact of shocks. As a result of line blendings, non-Gaussian or irregular profiles, and the relatively low resolution of the spectra, only a limited number of lines can be utilized for estimating the instrumental broadening. The FWHM of [O I]6300 ( ) is consistent with the FWHMs of the sky lines at 6300 ( ), 5577 ( ) and 6863 ( ). Other sky lines include an emission close to 5020, which should be a blended line (5016 and 5020, McLennan & Shrum, 1925), and the blended sodium doublet. The narrow and isolated He II4686, [O III]4959 and [O III]5007 are not broadened significantly because they have consistent FWHMs and simple profiles. Together with [O I]6300 and [O I]6363, these five emission lines should have intrinsic widths , which can exclude shocks with V100 km/s safely.
It appears that there is an upward trend that peaks around 4300 (Fig.2, bottom). The trend is evident for wavelengths longer than 4300 . However, it becomes erratic due to the comparatively low CCD response in the blue end. If the trend is real, the continuum may arise from a companion star, an accretion disc, or the nebula itself (Kaaret & Corbel, 2009). For the first scenario, based on the observed flux density (3–5) in the V band, the continuum would have an observed 22.2–22.7 mag333https://irsa.ipac.caltech.edu/data/SPITZER/docs/dataanalysistools/tools/pet/magtojy/. Taking E(B-V) and A(V)=0.47 mag in to account, at 10 Mpc, this leads to an M(V) of -8.3 mag to -7.8 mag, which corresponds to an F-type supergiant star or a yellow hypergiant star (de Jager, 1998).
2.1.2 BTA-6
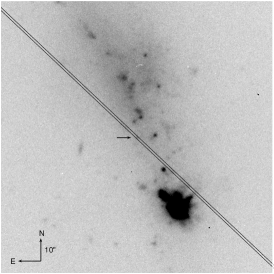
Prior to the BTA-6 observation performed in the blue band in March 2020 (Ozdogan Ela et al., 2021), the other NGC 4861 X-1’s BTA-6 observation was carried out using the spectrograph SCORPIO in the red band (Fig.1, right) in February 2011. The exposure time and slit width were the same with the GTC observation. The seeing was .
The types of emission lines within the common wavelength range of the red band and the GTC observations are consistent (Table.1). Nevertheless, the red band spectrum taken seven years earlier has a higher flux level, which occurred around the same time that Chandra observed NGC 4861 in 2012. Thus, a potential correlation between the optical and X-ray bands can be established, where a higher ( in Ozdogan Ela et al., 2021) associated with a higher optical flux level of emission lines and a lower ( in Ozdogan Ela et al., 2021) corresponds to a lower optical flux level of emission lines. Nevertheless, the primary issue is that the observation conditions, especially seeing conditions, vary. NGC 5408 X-1 (Kaaret & Corbel, 2009) was initially asserted to demonstrate temporal flux variabilities in both its optical continuum and emission lines. However, further analysis disproved this assertion and ascribed the variabilities to changes in the seeing (Cseh et al., 2011). Contrary to NGC 5408 X-1, for NGC 4861 X-1, the worse seeing () corresponds to a higher flux level (Fig.2, bottom). Nevertheless, due to the significant time span between the two observations, we can only provide a preliminary indication of a correlation in flux, and it is imperative that this be further verified through more meticulous observations. The existence of the continuum of NGC 4861 X-1 is relatively reliable, but still requires verification too.
The line ratios of the two observations are consistent (Table.1). For instance, [O I]6300/Hα=20.9% and [S II](6716+6731)/Hα=28.8% based on the red band spectrum indicates that an X-ray photoionization scenario is still favored. The line width analysis (Table.1) also supports that the optical nebula is X-ray photoionized.
| Lines() | GTC(100) | Dereddened(Hα/Hβ) | gfwhm() | BTA-6(observed) | |
|---|---|---|---|---|---|
| [O II]3727,3729 | 60.60.9 | 118.81.8 | 5.4 | ||
| [Ne III]3868 | 14.60.4 | 28.00.8 | 3.9 | ||
| [Ne III]3967 | 16.80.5 | 31.91.0 | 5.3 | ||
| [S II]4067,4076 | 18.51.3 | 34.52.4 | 7.6 | ||
| Hδ4101 | 15.20.8 | 28.41.5 | 4.1 | ||
| Hγ4340 | 35.91.0 | 65.01.8 | 5.4 | ||
| [O III]4363 | 5.30.2 | 9.50.4 | 6.1 | ||
| He II4686 | 13.00.3 | 22.50.5 | 5.7 | ||
| Hβ4861 | 1001.6 | 170.02.7 | 6.5 | ||
| [O III]4959 | 45.71.3 | 76.82.2 | 5.7 | ||
| [O III]5007 | 141.40.8 | 236.11.3 | 5.8 | ||
| He I5874 | 9.80.3 | 15.10.5 | 6.6 | 21.61.0 | |
| [O I]6300 | 71.30.9 | 107.01.4 | 7.1 | 148.21.3 | |
| [O I]6363 | 24.10.3 | 35.90.4 | 7.1 | 49.11.1 | |
| [N II]6548 | 9.71.3 | 14.21.9 | 9.4 | 11.11.6 | |
| H6563 | 331.20.5 | 483.60.7 | 7.5 | 707.81.2 | |
| [N II]6583 | 22.51.3 | 32.91.9 | 7.9 | 44.22.1 | |
| [S II]6716 | 38.60.2 | 56.00.3 | 7.9 | 79.50.9 | |
| [S II]6731 | 55.30.4 | 79.60.6 | 7.8 | 124.40.5 | |
| [O II]7320,7330 | 19.60.7 | 27.41.0 | 13.8 | 38.51.7 |
The dereddened fluxes are obtained by utilizing the E(B-V) determined according to the theoretical Hα/Hβ value. The uncorrected f4861 and L4861 of the GTC is and , respectively. The BTA-6’s flux unit is .
2.2 Radio
2.2.1 LOFAR
In the 2nd data release (Shimwell et al., 2022) of the LOFAR Two-meter Sky Survey (Shimwell et al., 2017), we found a radio source ILTJ125901.83345114.7 0.15 away from the ULX. The LOFAR observation was performed one year (2019-03; field=P13535444https://lofar-surveys.org/observations.html) after the simultaneous GTC and Chandra observation. The radio source was significantly detected between 120–168 MHz with a total flux density of 1.10.2 mJy. The deconvolved major axis and minor axis of the source FWHM is 4.4 and 2.1, respectively. Considering LOFAR’s 6 beam size and its typical astrometric accuracy of 0.2, with just a 0.15 offset with the Chandra position (ObsID=12473), we argue ILTJ125901.83345114.7 is the radio counterpart of NGC 4861 X-1.
2.2.2 VLA
NGC 4861 was observed ten times with the VLA between June and July 2015 (project code 15A-040; PI: M. Mezcua). The data were taken with C band receivers (4–8 GHz) while the telescope was in its extended A configuration. Each observation had hr of on-source time, which we eventually concatenated together to achieve a total on-source time of 3 hr. The observations only covered 4.5–6.5 GHz of the total C band, which were then divided into two 1024-MHz-wide subbands centered at 5 GHz and 6 GHz (Fig.4). 3C 286 was used as the flux and bandpass calibrator, while J13083546 was the complex gain calibrator. The data were prepared with the Common Astronomy Software Application v5.6.3 (CASA; McMullin et al. 2007). Initially, the data were processed using the CASA (Common Astronomy Applications Software) calibration pipeline (McMullin et al., 2007); additional flagging was performed as needed.
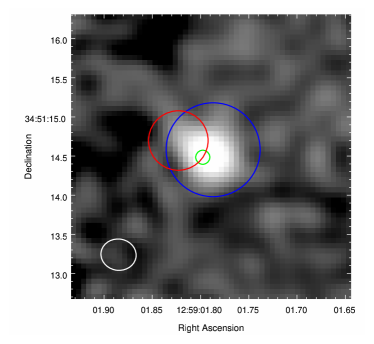
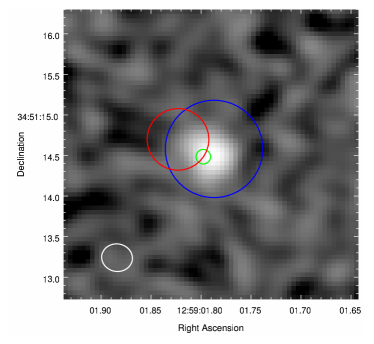
Coincident with the X-ray position of NGC 4861 X-1, we have discovered a radio source (Fig.4) with peak fluxes of Jy beam-1 (5 GHz) and Jy beam-1 (6 GHz). Taking the peak fluxes results in a spectral index of -1.10.4 and L = erg s-1. The radio source is mildly extended, as the integrated flux differs significantly from the peak flux. It has integrated fluxes of (5 GHz) and (6 GHz). This equates to an integrated 5 GHz luminosity of erg s-1. Based on our estimation, the size of the radio counterpart is at 5 GHz and at 6 GHz. This suggests that the radio source could be around –20 pc in size (at D=10 Mpc). In the radio and optical bands, the extension directions of the ULX are almost consistent.
The average spectral index towards the center of the source is 0.4. This steep index is consistent with optically-thin synchrotron emission, as expected for ULX bubbles or lobes. However, due to the relatively bigger errors, it is also consistent with flat () bremsstrahlung emission from hot gas. Nevertheless, we can rule-out notable free-free emission from the Balmer/free-free relation (Caplan & Deharveng, 1986; Soria et al., 2010). At the most, only Jy beam-1 is from free-free emission, which means the contribution of synchrotron emission dominates the observed radio luminosity. More importantly, if we consider both the LOFAR and VLA emission, the spectral index is around -0.6, which is well consistent with the in-band spectral index of the VLA.
While the astrometric accuracy of the radio source should be better than 555https://science.nrao.edu/facilities/vla/docs/manuals/oss/performance/positional-accuracy, in order to investigate any link between the radio source and the ULX, we need to improve the astrometry of Chandra. Based on five positions of archival Chandra observations derived by wavdetect of CIAO 4.14, we used Equation.5 of Hong et al. (2005) to estimate the statistical uncertainty due to the centroiding performed by wavdetect. We took their weighted average and weighted error, and got the final position/error at 12:59:01.823 +34:51:14.70 0.38 (the red circle in Fig.4). Alternatively, we used three GAIA sources near the ULX to improve the Chandra astrometry. We found in the observation (ObsID=12473) three significant X-ray sources on the same CCD of the ULX have GAIA counterparts with a offset. In other four Chandra observations (e.g., ObsID=20993), although their off-axis angles are smaller, their offsets with their GAIA counterparts are bigger (1.3′′–1.6′′). The bigger offsets are consistent with Chandra’s astrometric accuracy degradation over time666https://cxc.cfa.harvard.edu/cal/ASPECT/celmon/. Following the CIAO thread of ’Correcting Absolute Astrometry’ 777https://cxc.cfa.harvard.edu/ciao/threads/reproject_aspect/, we used the three GAIA sources to correct the astrometry of Chandra observation (ObsID=12473) and obtained an updated position of the ULX at 12:59:01.798 +34:51:14.48 0.09 (the green circle in Fig.4), which is consistent with the position of the radio source. We take the GAIA-corrected position as a better value due to the small position uncertainties ( mas) of the three GAIA sources.
3 Discussion
The four X-ray photoionized optical nebulae exhibit similarities in their absence of shock-ionization, substantial L4686 and relatively moderate size. Furthermore, despite the low probability of exhibiting strong synchrotron radio emission in the ULX family, all four ULXs demonstrate a pronounced presence of this type of radio emission. Therefore, a question arises as to whether this is merely a coincidence. Although establishing a definitive link between X-ray photoionized nebulae and synchrotron radio emission remains challenging, this does prompt the inquiry as to why the four optical nebulae do not show any noticeable indicators of jets. In the case of Ho II X-1, the aforementioned issue can be effectively mitigated due to its comparatively smaller radius of radio influence (Cseh et al., 2014) compared with its extension in the optical band (Pakull & Mirioni, 2002). The jet may be young and not long-lasting. Consequently, the interstellar medium may not have had sufficient time to enter its radiative phase. The discovery of the small triple radio structures (core+lobes) of Ho II X-1 was made only after new observations with improved angular resolution from the VLA (Cseh et al., 2015). As for NGC 6946 ULX-1, similarly, shock waves do not significantly contribute to the emission lines of MF16 (Abolmasov et al., 2008). The large L4686 and L4861 of MF16 can not be produced by its limited kinematics (Dopita & Sutherland, 1996; Abolmasov et al., 2008). Shock waves do play a role in heating the medium and destroying dust. However, its [S II](6716+6731)/Hα=85% ratio, which exceeds the commonly used 40% threshold for identifying shock-excited nebulae (Blair & Fesen, 1994), indicates that it may be in a relatively later stage prior to entering its radiative phase. Regarding NGC 5408 X-1, its synchrotron radio emission is slightly extended (Lang et al., 2007) and relativistic X-ray outflows have been detected (Pinto et al., 2016). Additionally, its notable extension in the optical band (D in Grisé et al., 2012) reinforced the belief held by Gúrpide et al. (2022) that previous long-slit observations may have overlooked the shock-excited regions of NGC 5408 X-1. We speculate that NGC 4861 X-1 may be more like the case of Ho II X-1 due to NGC 4861 X-1’s small size and small [S II](6716+6731)/Hα ratio. Further VLA or SKA observations with better angular resolution may help resolve the structures of NGC 4861 X-1. It would be interesting if shocks can not be detected in all regions of NGC 5408 X-1.
For the unidentified lines, despite conducting extensive searches in other ULXs that display numerous emission lines (e.g., Abolmasov et al., 2008; Urquhart et al., 2018; López et al., 2019), we have been unable to find any suitable lines in close proximity to the redshift-corrected wavelength of U5172 and U7402 (Fig.2). We note that [Fe VII]5159, which is in agreement with the redshift-corrected wavelength of U5172, was accompanied by a question mark among the lines of MF16 (Abolmasov et al., 2008). Besides, the progenitor of NGC 300 ULX-1 (Carpano et al., 2018), SN 2010da, showed strong [Fe VII]5159 lines (Villar et al., 2016). However, their [Fe VII]5159 was not seen in isolation, but rather appeared alongside other iron lines, including stronger ones (Fig.8 and Table.9 of Villar et al., 2016). Identifying U5172 encounters a similar issue when we turn to the spectra of non-ULX sources (e.g., Kraemer et al., 1994; Young et al., 2005; Rose et al., 2011, 2015). Further observations with improved spectral resolution are necessary to help identify them.
Finally, the identification of a possible continuum and a suspicious flux correlation remains tentative. It is reasonable that a correlation is present, albeit in this specific study, it could potentially be attributed to flux calibration of the BTA-6 observation. To confirm or refute the correlation, and incidentally determine the authenticity of the continuum, repeated spectroscopic observations under different X-ray flux levels are necessary.
References
- Abolmasov et al. (2007) Abolmasov, P., Fabrika, S., Sholukhova, O., & Afanasiev, V. 2007, Astrophysical Bulletin, 62, 36, doi: 10.1134/S199034130701004X
- Abolmasov et al. (2008) Abolmasov, P., Fabrika, S., Sholukhova, O., & Kotani, T. 2008, arXiv e-prints, arXiv:0809.0409, doi: 10.48550/arXiv.0809.0409
- Bachetti et al. (2014) Bachetti, M., Harrison, F. A., Walton, D. J., et al. 2014, Nature, 514, 202, doi: 10.1038/nature13791
- Berghea et al. (2020) Berghea, C. T., Johnson, M. C., Secrest, N. J., et al. 2020, ApJ, 896, 117, doi: 10.3847/1538-4357/ab9108
- Blair & Fesen (1994) Blair, W. P., & Fesen, R. A. 1994, ApJ, 424, L103, doi: 10.1086/187285
- Calzetti et al. (2000) Calzetti, D., Armus, L., Bohlin, R. C., et al. 2000, ApJ, 533, 682, doi: 10.1086/308692
- Caplan & Deharveng (1986) Caplan, J., & Deharveng, L. 1986, A&A, 155, 297
- Cardelli et al. (1989) Cardelli, J. A., Clayton, G. C., & Mathis, J. S. 1989, ApJ, 345, 245, doi: 10.1086/167900
- Carpano et al. (2018) Carpano, S., Haberl, F., Maitra, C., & Vasilopoulos, G. 2018, MNRAS, 476, L45, doi: 10.1093/mnrasl/sly030
- Colbert & Ptak (2002) Colbert, E. J. M., & Ptak, A. F. 2002, ApJS, 143, 25, doi: 10.1086/342507
- Cseh et al. (2011) Cseh, D., Grisé, F., Corbel, S., & Kaaret, P. 2011, ApJ, 728, L5, doi: 10.1088/2041-8205/728/1/L5
- Cseh et al. (2014) Cseh, D., Kaaret, P., Corbel, S., et al. 2014, MNRAS, 439, L1, doi: 10.1093/mnrasl/slt166
- Cseh et al. (2015) Cseh, D., Miller-Jones, J. C. A., Jonker, P. G., et al. 2015, MNRAS, 452, 24, doi: 10.1093/mnras/stv1308
- de Jager (1998) de Jager, C. 1998, A&A Rev., 8, 145, doi: 10.1007/s001590050009
- Dopita & Sutherland (1996) Dopita, M. A., & Sutherland, R. S. 1996, ApJS, 102, 161, doi: 10.1086/192255
- Fabrika et al. (2021) Fabrika, S. N., Atapin, K. E., Vinokurov, A. S., & Sholukhova, O. N. 2021, Astrophysical Bulletin, 76, 6, doi: 10.1134/S1990341321010077
- Farrell et al. (2009) Farrell, S. A., Webb, N. A., Barret, D., Godet, O., & Rodrigues, J. M. 2009, Nature, 460, 73, doi: 10.1038/nature08083
- Gao et al. (2017) Gao, Y.-L., Lian, J.-H., Kong, X., et al. 2017, Research in Astronomy and Astrophysics, 17, 041, doi: 10.1088/1674-4527/17/5/41
- Gladstone et al. (2013) Gladstone, J. C., Copperwheat, C., Heinke, C. O., et al. 2013, ApJS, 206, 14, doi: 10.1088/0067-0049/206/2/14
- Grisé et al. (2012) Grisé, F., Kaaret, P., Corbel, S., et al. 2012, ApJ, 745, 123, doi: 10.1088/0004-637X/745/2/123
- Gúrpide et al. (2022) Gúrpide, A., Parra, M., Godet, O., Contini, T., & Olive, J. F. 2022, A&A, 666, A100, doi: 10.1051/0004-6361/202142229
- Guseva et al. (2003) Guseva, N. G., Papaderos, P., Izotov, Y. I., et al. 2003, A&A, 407, 75, doi: 10.1051/0004-6361:20030806
- Gutiérrez & Moon (2014) Gutiérrez, C. M., & Moon, D.-S. 2014, ApJ, 797, L7, doi: 10.1088/2041-8205/797/1/L7
- Hong et al. (2005) Hong, J., van den Berg, M., Schlegel, E. M., et al. 2005, ApJ, 635, 907, doi: 10.1086/496966
- Hunt & Hirashita (2009) Hunt, L. K., & Hirashita, H. 2009, A&A, 507, 1327, doi: 10.1051/0004-6361/200912020
- Kaaret & Corbel (2009) Kaaret, P., & Corbel, S. 2009, ApJ, 697, 950, doi: 10.1088/0004-637X/697/1/950
- Kaaret et al. (2017) Kaaret, P., Feng, H., & Roberts, T. P. 2017, ARA&A, 55, 303, doi: 10.1146/annurev-astro-091916-055259
- Kaaret et al. (2004) Kaaret, P., Ward, M. J., & Zezas, A. 2004, MNRAS, 351, L83, doi: 10.1111/j.1365-2966.2004.08020.x
- Kehrig et al. (2015) Kehrig, C., Vílchez, J. M., Pérez-Montero, E., et al. 2015, ApJ, 801, L28, doi: 10.1088/2041-8205/801/2/L28
- King et al. (2023) King, A., Lasota, J.-P., & Middleton, M. 2023, New A Rev., 96, 101672, doi: 10.1016/j.newar.2022.101672
- Kraemer et al. (1994) Kraemer, S. B., Wu, C.-C., Crenshaw, D. M., & Harrington, J. P. 1994, ApJ, 435, 171, doi: 10.1086/174803
- Lang et al. (2007) Lang, C. C., Kaaret, P., Corbel, S., & Mercer, A. 2007, ApJ, 666, 79, doi: 10.1086/519553
- Leitherer et al. (2011) Leitherer, C., Tremonti, C. A., Heckman, T. M., & Calzetti, D. 2011, AJ, 141, 37, doi: 10.1088/0004-6256/141/2/37
- Liu et al. (2015) Liu, J.-F., Bai, Y., Wang, S., et al. 2015, Nature, 528, 108, doi: 10.1038/nature15751
- López et al. (2019) López, K. M., Jonker, P. G., Heida, M., et al. 2019, MNRAS, 489, 1249, doi: 10.1093/mnras/stz2127
- Markaryan (1967) Markaryan, B. E. 1967, Astrofizika, 3, 55
- McLennan & Shrum (1925) McLennan, J. C., & Shrum, G. M. 1925, Proceedings of the Royal Society of London Series A, 108, 501, doi: 10.1098/rspa.1925.0088
- McMullin et al. (2007) McMullin, J. P., Waters, B., Schiebel, D., Young, W., & Golap, K. 2007, in Astronomical Society of the Pacific Conference Series, Vol. 376, Astronomical Data Analysis Software and Systems XVI, ed. R. A. Shaw, F. Hill, & D. J. Bell, 127
- Mezcua et al. (2015) Mezcua, M., Roberts, T. P., Lobanov, A. P., & Sutton, A. D. 2015, MNRAS, 448, 1893, doi: 10.1093/mnras/stv143
- Mezcua et al. (2013) Mezcua, M., Roberts, T. P., Sutton, A. D., & Lobanov, A. P. 2013, MNRAS, 436, 3128, doi: 10.1093/mnras/stt1794
- Motch et al. (2014) Motch, C., Pakull, M. W., Soria, R., Grisé, F., & Pietrzyński, G. 2014, Nature, 514, 198, doi: 10.1038/nature13730
- Moy & Rocca-Volmerange (2002) Moy, E., & Rocca-Volmerange, B. 2002, A&A, 383, 46, doi: 10.1051/0004-6361:20011727
- Noeske et al. (2000) Noeske, K. G., Guseva, N. G., Fricke, K. J., et al. 2000, A&A, 361, 33, doi: 10.48550/arXiv.astro-ph/0007130
- Osterbrock (1989) Osterbrock, D. E. 1989, Astrophysics of gaseous nebulae and active galactic nuclei
- Osterbrock & Ferland (2006) Osterbrock, D. E., & Ferland, G. J. 2006, Astrophysics of gaseous nebulae and active galactic nuclei
- Ozdogan Ela et al. (2021) Ozdogan Ela, M., Akyuz, A., Aksaker, N., et al. 2021, MNRAS, 505, 771, doi: 10.1093/mnras/stab1321
- Pakull et al. (2006) Pakull, M. W., Grisé, F., & Motch, C. 2006, in Populations of High Energy Sources in Galaxies, ed. E. J. A. Meurs & G. Fabbiano, Vol. 230, 293–297, doi: 10.1017/S1743921306008489
- Pakull & Mirioni (2002) Pakull, M. W., & Mirioni, L. 2002, arXiv e-prints, astro, doi: 10.48550/arXiv.astro-ph/0202488
- Pasham et al. (2014) Pasham, D. R., Strohmayer, T. E., & Mushotzky, R. F. 2014, Nature, 513, 74, doi: 10.1038/nature13710
- Pinto et al. (2016) Pinto, C., Middleton, M. J., & Fabian, A. C. 2016, Nature, 533, 64, doi: 10.1038/nature17417
- Pinto & Walton (2023) Pinto, C., & Walton, D. J. 2023, arXiv e-prints, arXiv:2302.00006, doi: 10.48550/arXiv.2302.00006
- Roche et al. (2023) Roche, N., Vílchez, J. M., Iglesias-Páramo, J., et al. 2023, MNRAS, 523, 270, doi: 10.1093/mnras/stad1219
- Rose et al. (2015) Rose, M., Elvis, M., & Tadhunter, C. N. 2015, MNRAS, 448, 2900, doi: 10.1093/mnras/stv113
- Rose et al. (2011) Rose, M., Tadhunter, C. N., Holt, J., Ramos Almeida, C., & Littlefair, S. P. 2011, MNRAS, 414, 3360, doi: 10.1111/j.1365-2966.2011.18639.x
- Shimwell et al. (2017) Shimwell, T. W., Röttgering, H. J. A., Best, P. N., et al. 2017, A&A, 598, A104, doi: 10.1051/0004-6361/201629313
- Shimwell et al. (2022) Shimwell, T. W., Hardcastle, M. J., Tasse, C., et al. 2022, A&A, 659, A1, doi: 10.1051/0004-6361/202142484
- Smith et al. (1993) Smith, R. C., Kirshner, R. P., Blair, W. P., Long, K. S., & Winkler, P. F. 1993, ApJ, 407, 564, doi: 10.1086/172538
- Soria et al. (2014) Soria, R., Long, K. S., Blair, W. P., et al. 2014, Science, 343, 1330, doi: 10.1126/science.1248759
- Soria et al. (2010) Soria, R., Pakull, M. W., Broderick, J. W., Corbel, S., & Motch, C. 2010, MNRAS, 409, 541, doi: 10.1111/j.1365-2966.2010.17360.x
- Soria et al. (2021) Soria, R., Pakull, M. W., Motch, C., et al. 2021, MNRAS, 501, 1644, doi: 10.1093/mnras/staa3784
- Storey & Hummer (1995) Storey, P. J., & Hummer, D. G. 1995, MNRAS, 272, 41, doi: 10.1093/mnras/272.1.41
- Thuan et al. (2014) Thuan, T. X., Bauer, F. E., & Izotov, Y. I. 2014, MNRAS, 441, 1841, doi: 10.1093/mnras/stu716
- Tremblay et al. (2018) Tremblay, G. R., Combes, F., Oonk, J. B. R., et al. 2018, ApJ, 865, 13, doi: 10.3847/1538-4357/aad6dd
- Urquhart et al. (2018) Urquhart, R., Soria, R., Johnston, H. M., et al. 2018, MNRAS, 475, 3561, doi: 10.1093/mnras/sty014
- van Dyk et al. (1994) van Dyk, S. D., Sramek, R. A., Weiler, K. W., Hyman, S. D., & Virden, R. E. 1994, ApJ, 425, L77, doi: 10.1086/187314
- Villar et al. (2016) Villar, V. A., Berger, E., Chornock, R., et al. 2016, ApJ, 830, 11, doi: 10.3847/0004-637X/830/1/11
- Young et al. (2005) Young, P. R., Berrington, K. A., & Lobel, A. 2005, A&A, 432, 665, doi: 10.1051/0004-6361:20042033