Role of ionizing background on the non-thermal broadening inferred for the aligned absorbers
Abstract
Using cosmological hydrodynamical simulations at we identify the aligned absorbers and measure the thermal () and non-thermal () contribution to the line broadening using O vi and H i absorption lines. We find that the inferred temperature based on correlates strongly with the optical depth-weighted kinetic temperature of the absorbing gas albeit with a large scatter. We show this scatter comes from the spread in the kinetic temperature of the gas contributing to the absorption and hence depends on the feedback processes and the ionizing UV background (UVB) used in the simulations. We show the distribution of is also affected by both feedback processes and the ionizing UVB. Therefore, derived using aligned absorbers may not be a good probe of sub-grid turbulence. Instead, the distribution of and together with the frequency of occurrence of the aligned absorbers can be used to place additional constraints on the parameters of the simulation for a given assumed UVB.
keywords:
Cosmology: large-scale structure of Universe - Cosmology: diffuse radiation - Galaxies: intergalactic medium - Galaxies: quasars : absorption lines1 Introduction
The Ly and metal absorption lines detected in the spectra of distant quasars are frequently used to probe the physics of the intervening medium. Heavier elements (metals) are believed to originate in stars and are transported into the low-density inter-galactic and circum-galactic medium (IGM and CGM, respectively) via different feedback processes. The detectability of the metals depends on their covering fraction and the thermal and ionization state of the absorbing medium, which are governed by the spectra of the ionizing Ultra-Violet background (UVB). Different feedback mechanisms, such as kinetic and thermal contribution due to stellar and AGN feedback, affect the metal distribution and the physical conditions in the intervening medium. Many cosmological hydrodynamical simulations incorporating a varied range of feedback prescriptions (see for example, Oppenheimer & Davé, 2009; Tepper-García et al., 2011; Oppenheimer et al., 2012; Tepper-García et al., 2013; Rahmani et al., 2016; Nelson et al., 2018; Bradley et al., 2022; Mallik et al., 2023; Khaire et al., 2023) are used to understand the influence of feedback processes on statistics of the Ly and metal absorbers like column density distribution function (hereafter CDDF), Doppler parameter distribution, line-width distribution and association of metal absorbers with Ly.
The spectra of the UVB at high redshifts can not be directly observed and are computed using the spectral energy distribution (SED) and volume densities of quasars and galaxies after taking into account cosmological radiative transport (refer to Haardt & Madau, 1996; Faucher-Giguère et al., 2009; Haardt & Madau, 2012; Khaire & Srianand, 2019; Faucher-Giguère, 2020). The UVB spectra computed in the literature are uncertain in the extreme UV to soft X-ray energies because of the absence of direct measurements of quasar SED due to attenuation by Milky Way’s interstellar medium. The effect of uncertainties in the UVB on the estimated physical parameters like density, temperature, metallicity, elemental abundance, and ionization state of the absorbers has been demonstrated in many previous works, (see for example, Schaye et al., 2003; Simcoe et al., 2004; Aguirre et al., 2004, 2008; Howk et al., 2009; Simcoe, 2011; Fechner, 2011; Hussain et al., 2017; Haislmaier et al., 2021; Acharya & Khaire, 2022). Very few works like Oppenheimer & Davé (2009) and recently in Appleby et al. (2021) and Mallik et al. (2023) discuss the effect of uncertainties in the UVB on the statistics of observed and simulated metal absorbers. Mallik et al. (2023) (hereafter Paper I) have shown that the CDDF, cumulative distribution function (CDF) of Doppler parameter (b) and system width (), and metal association statistics of Ly are affected by the feedback models as well as the UVB. More importantly, it is found that the effect of uncertainty in UVB on different absorber statistics depends on the feedback used in the simulation, indicating a possible degeneracy in constraining the feedback mechanisms using these statistics.
The kinetic feedback due to the SNe explosion not only influences the metal enrichment in lower-density regions but is also a major source of turbulence in the interstellar and intergalactic medium (MacLow, 2004; Evoli & Ferrara, 2011). While stellar feedback (star formation, stellar wind, and SNe explosion) dominates the turbulent energy input at the scale of supernova-remnant (10-100 pc) (see for example McKee & Ostriker, 1977; Norman & Ferrara, 1996; Dib et al., 2006; de Avillez & Breitschwerdt, 2007; Joung et al., 2009; Lu et al., 2020), intermediate and large-scale turbulence also originates due to gravitational (Schaye, 2004; Fensch et al., 2023; Forbes et al., 2023) and magneto-rotational instabilities (Fleck, 1981; Sellwood & Balbus, 1999; Beck, 2015). At small scales (1 pc), plasma instabilities driven by cosmic rays lead to cosmic ray acceleration and magnetic field amplification. One of the manifestations of the resulting turbulent motion is an additional source of line broadening apart from the thermal contribution (Armstrong et al., 1995; Chepurnov & Lazarian, 2010; Lazarian et al., 2023). Such small-scale turbulence is usually not captured well in cosmological simulations due to insufficient spatial resolution.
A hint of turbulent energy contribution as non-thermal line broadening comes from the fact that the median Doppler parameter found for the low- Ly forest in the simulations is much lower than that found in the observations (Meiksin et al., 2001; Viel et al., 2017; Nasir et al., 2017). This is sometimes compensated by introducing turbulent broadening as a subgrid physics in simulations (Oppenheimer & Davé, 2009; Turner et al., 2016; Gaikwad et al., 2017; Maitra et al., 2020; Bolton et al., 2022). The non-thermal line broadening is also introduced by Hubble flow, local kinematics, the approximation of blended lines with single/multiple Voigt profiles, etc. The effect of Hubble flow may not be a dominant source as the length of the absorbing medium is, at most, a few hundred kpcs (as discussed for low redshift absorbers in Richter et al., 2006a; Prause et al., 2007; Hussain et al., 2017; Mohapatra et al., 2021). The higher non-thermal broadening in the multiphase system reported in Tripp et al. (2008) indicates that fluctuations in density-temperature-peculiar velocity fields of the absorbing media can create such effects. Hence, simulations need to either incorporate appropriate subgrid physics to include the effects of turbulence or introduce some form of non-thermal line broadening to match the observed Doppler parameter distribution. Therefore, the measurement of non-thermal broadening in aligned absorbers could also provide some useful constraints on various parameters of the cosmological simulations. This is what we explore in this work.
It is a common practice to find non-thermal contribution to the line broadening by separating the thermal and non-thermal parts in the Doppler parameter of the aligned absorption of two different species having widely different masses. For high redshift absorbers, Rauch et al. (1996) (using aligned C iv - Si iv lines), Muzahid et al. (2012) (using aligned O vi - Ly lines) have reported low values of the non-thermal Doppler parameters (with median value 10 km s-1). In contrast, Tripp et al. (2008), Savage et al. (2014) have reported a much higher value of non-thermal broadening with a median value of 20-26 km s-1 for low-redshift observations. In the photoionized gas (i.e., T of few 104K), this non-thermal b-value will indicate super-sonic turbulence. However, the relative contribution of thermal and non-thermal broadening varies in different samples. In the low redshift Broad Lyman Alpha (BLA) sample, Danforth et al. (2010) considers only non-thermal contribution in line broadening, as also found by Richter et al. (2006b) in simulated BLA absorbers. Although a more recent work by Pessa et al. (2018) finds the non-thermal contribution for BLAs in inter-cluster medium to be as high as . For the aligned absorbers (not classified as BLA or non-BLA) in the sample reported in Tripp et al. (2008) and Savage et al. (2014), more than 80 non-thermal contribution is found in 25 and 33 of absorbers, respectively. Some previous works (see for example, Cen & Chisari, 2011; Tepper-García et al., 2012; Pessa et al., 2018) finds a trend of higher non-thermal contribution in the H i high column density absorbers.
In the simulations, absorption at a given redshift can originate from spatially well-separated regions (Peeples et al., 2019; Marra et al., 2021; Mallik et al., 2023). The gradients in the density-temperature field and local kinematics and the decomposition of the absorption profile into single/multiple Voigt profiles can introduce non-thermal line broadening in the simulated absorbers. Mallik et al. (2023) found variation in UVB alters the region contributing to the absorption, and the effect depends on the feedback models incorporated in the simulation. This motivates us to explore the effect of uncertainty in UVB on the thermal and non-thermal broadening of the aligned O vi and Ly absorbers in two sets of cosmological hydrodynamical simulations with different implementations of feedback mechanisms.
This paper is arranged as follows. In section 2, we present a summary of the simulations and different ionizing backgrounds used in this work, along with the overview of simulated spectra generation and Voigt profile fitting of the simulated spectra. We also provide details about the method followed to identify the aligned Ly and O vi absorbers. We study various statistical distributions of thermal and non-thermal line broadening and their dependence on other physical parameters in section 3. We discuss our results in section 4.
2 Details of simulations used and different ionizing backgrounds
In this work, we use the Sherwood simulation suit (Bolton et al., 2017) based on parallel Tree-PM SPH code P-Gadget-3, incorporating two different feedback models. The comparison between these two simulations is discussed in detail in Paper I (see section 2 in Paper I). Briefly, both the simulations have boxsize of 80 h-1cMpc containing 25123 dark matter and baryonic particles and use cosmological parameters {, , , , , } = {0.308, 0.0482, 0.692, 0.829, 0.961, 0.678} from Planck Collaboration et al. (2014). The initial conditions were generated on a regular grid using the N-GENIC code (Springel, 2005) and transfer functions generated by CAMB (Lewis et al., 2000) at . Initial particle mass in Sherwood simulation are (DM), (baryon) with gravitational softening length set to 1/25th of the mean inter-particle spacing. We use two models of the Sherwood simulation suit: the Sherwood "WIND" model, which has only stellar wind feedback, and the Sherwood "WIND+AGN" model, which includes both the wind feedback and AGN feedback. These two models were initiated with the same seed, and all other parameters were the same except for the feedback prescriptions. The feedback parameters implemented in the sherwood simulations were chosen such that the galaxy properties like galaxy stellar mass function and redshift evolution of star formation rate density are consistent with the observations (see section 3.1-3.3 in Puchwein & Springel, 2013). The wind and AGN feedback models used here broadly agree with the other recent simulations like EAGLE (Schaye et al., 2015; Crain et al., 2015) and Illustris TNG (Pillepich et al., 2018; Weinberger et al., 2017), but are less severe than the AGN feedback used in SIMBA simulation (Davé et al., 2019). Puchwein & Springel (2013) found the convergence for the wind feedback-only models is well established, but the models, including both wind and AGN feedback, may have some issues in converges for their lowest resolution model (with mass resolution 2.75 times higher than the model used in this work). This may not be a major issues for our study, as we aim to probe how well the temperature derived from the aligned absorbers trace the underlying gas temperature. The global metallicity of the gas particles is retained, and we assume solar relative abundance of different elements. The UVB given by Haardt & Madau (2012) was used in these simulation runs. We generate sightlines for both the simulation boxes for a given UVB at . The volume, as well as the resolution of the simulation box and the implemented feedback prescriptions, are comparable to the state-of-the-art simulations used to study metal absorbers in IGM (for example, Oppenheimer & Davé, 2009; Oppenheimer et al., 2012; Tepper-García et al., 2011, 2013; Nelson et al., 2018).
As discussed in Paper I, variation in UVB strongly influences neither the baryon fraction in the diffuse gas phase nor the parameters of the temperature-density relation. Following Mallik et al. (2023), we assume the effect of variation in UVB on the gas temperature is negligible, and we will mainly study its effect on the ionization state of the absorbing gas. Our fiducial UVB is given by Khaire & Srianand (2019) with a spectral index of -1.8 (denoted as "ks19q18" hereafter). However, other UVB spectra are reported in the literature. A detailed comparison among them can be found in section 2.1 of Paper I. Our fiducial UVB and the UVB given by Faucher-Giguère et al. (2009) (the 2011 updated version of it, hereafter referred to as "fg11") span the range of UVB in the literature in the energy range relevant for O vi ionization. We use "ks19q18" and "fg11" UVBs to study the effect of uncertainty in the UVB on absorber statistics.
2.1 Generating simulated metal spectra
We shoot lines-of-sight along the simulation box and generate transmitted flux spectra. We calculate the number-density of a given ion species from the density and metallicity of SPH particles considering the ionization correction obtained from photoionization code cloudy for a given UVB, with the assumption that the absorbing gas is optically thin. This is a valid assumption as we found later that most of our Ly absorbers have H i column density lower than the threshold H i column density (given by Rahmati et al., 2013) where self-shielding becomes essential. We divide the length of the sightline (80 h-1cMpc) into 1024 equispaced grids (7 km s-1), and at each grid point, we calculate the SPH smoothed ion number density (nXI), temperature (T), and peculiar velocity (v) field of the SPH particles within the smoothing length from the sightline. We use the SPH smoothed quantities in the grid points along the line of sight to calculate the optical depth of a given ion species (), following the sightline generation procedure described in section 2.3 in Paper I. We convolve the transmitted flux (FXI= exp()) with a Gaussian profile with a FWHM of 17 kms-1, mimicking the instrumental resolution of HST/COS spectrograph and added Gaussian noise corresponding to SNR=10 per pixel. The spectral resolution of the simulated spectra is sufficient to compare the results with HST/COS observations.
2.2 Selection criteria for aligned absorbers
We have generated 10000 sightlines following the procedure described above. The initial identification of absorption lines and Voigt profile fitting were performed using the automated Voigt profile fitting code, viper (see Gaikwad et al., 2017, for details). Currently, viper can automatically identify absorption systems above a chosen significant level (i.e Rigorous Significant Level, RSL 4, in our case) and fit multiple voigt profile components minimizing and Akaike information criterion(AIC). However, simultaneous fitting of several absorption lines (that is required to decompose the thermal and non-thermal contribution to the line broadening) is at present not possible with viper.
Therefore, we considered two steps in identifying and fitting the absorption lines to optimize the process. We initially use viper to independently identify and fit the Ly and O vi lines along the 10000 spectra generated from our simulations. Then we identify the components that produce significant absorption lines (i.e., with RSL) both in Ly and O vi absorption. Next, identify the Ly and O vi absorption components having redshift difference corresponding to a velocity offset within 10 kms-1 (we refer to them as aligned absorbers). Our definition of aligned absorbers is slightly conservative compared to previous work both in observation (see for example Rauch et al., 1996; Tripp et al., 2008; Muzahid et al., 2012; Savage et al., 2014) and simulations (such as Oppenheimer & Davé, 2009; Tepper-García et al., 2012; Pessa et al., 2018) which considers O vi and Ly components either having same redshift or a velocity offset within the error of the velocity-centroid measurement, as the aligned absorbers. We then performed simultaneous multi-component Voigt profile fitting of all the detectable Lyman-series absorption lines O vi doublet absorption in the aligned absorbers using vpfit Carswell & Webb (version 10.4, 2014). During the fit, we constrained the redshift to be identical (i.e., complete alignment for H i and O vi components). We obtained the column density ( and ) and the Doppler parameter due to thermal (bt) and non-thermal (bnt) broadening of the line for individual components.
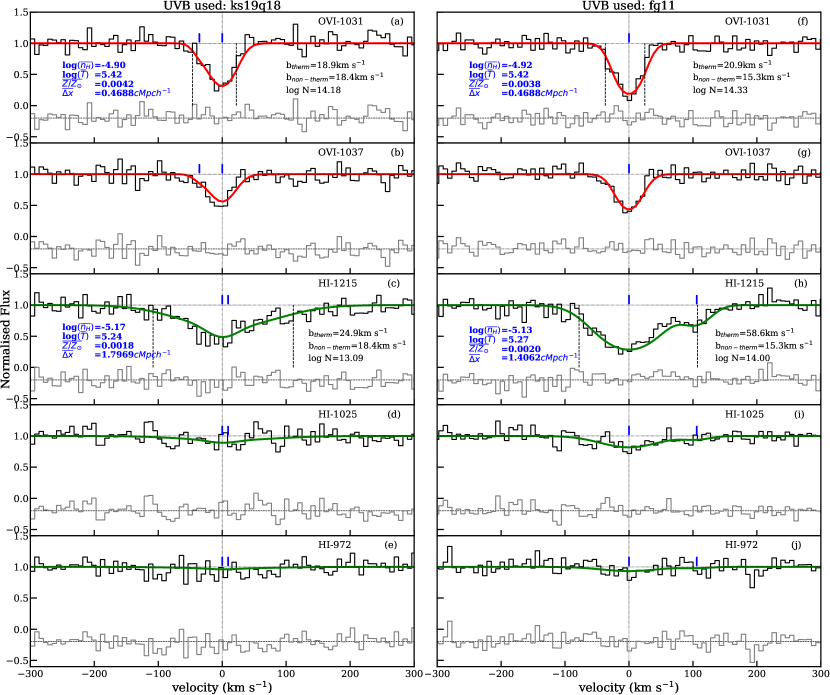
As an example, in Figure 1, we show the simultaneous Voigt profile fitting results to H i and O vi absorption in one of the aligned absorbers from "WIND+AGN" simulations when we consider the "ks19q18" (left panels) and "fg11" (right panels) UVBs. The mean density, temperature, metallicity, and the length of the gas contributing to the absorption are influenced by the UVB, as indicated by the legends provided in Figure 1.
3 Results
It has been shown in Paper I that the b-distribution is significantly affected by the feedback processes (see their Figure 8). Here, when we decompose the b into thermal (bt) and non-thermal (bnt) parts, we notice that the feedback effects are minimal for the thermal broadening but significant for the non-thermal line broadening. We also study how these results are affected by the assumed UVB.
3.1 Temperature estimation of the absorbers
The width (i.e., b) of an absorption line is contributed by both thermal and non-thermal broadening. If we assume a Gaussian line shape for the non-thermal broadening, then the total Doppler parameter is given by b= (b b)1/2. As in observations, the aligned absorbers are assumed to trace the gas with the same temperature, ionizing conditions, and identical non-thermal broadening. The temperature, T(bt), of the aligned absorbers, is deduced from bt, which is inversely proportional to the square root of the mass of the species.
In simulations, the average temperature of the gas traced by the aligned absorption component can also be estimated from the optical-depth-weighted temperature (). Let is the optical depth contribution at the pixel from the gas at pixel having a temperature . Then the optical depth weighted temperature at the pixel is given by, . As Ly profile often shows multiple components and not all of them produce detectable O vi absorption, we used O vi optical depth for calculating . We have assigned the median value of for pixels within the system-width of the absorption to be the optical-depth-weighted temperature () of the absorber.
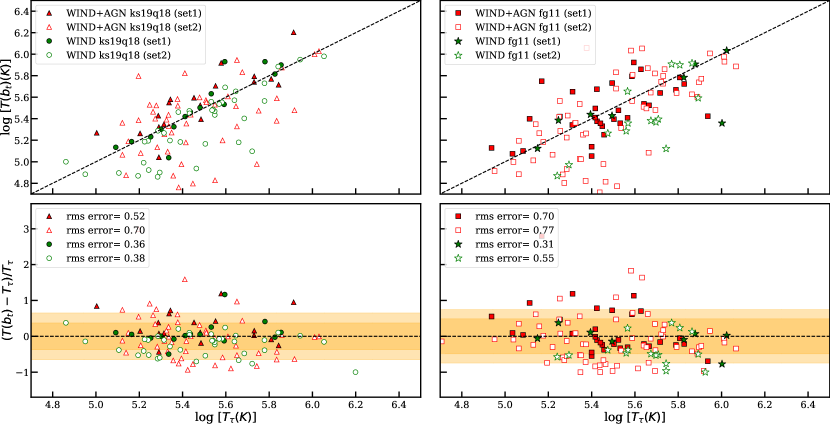
In the left panel of Figure 2, we compare the kinetic temperature [] derived from for the aligned absorption components with for Sherwood "WIND" and "WIND+AGN" simulations that use "ks19q18" UVB. Firstly, we notice a strong correlation between and for all the absorbers. This suggests that T() is a good representation of the optical depth-weighted temperature of the regions contributing to the absorption. However, there is a large scatter around the equality line. The scatter seems to be higher for the WING+AGN simulations compared to the WIND-only simulations. To quantify this, in the lower panel, we show the fractional deviation between these two estimates of temperature (defined as ) for both the simulations. We find the RMS of the scatter to be 0.37 and 0.65 for "WIND" and "WIND+AGN" simulations, respectively.
To explore this further, we have divided the absorbers into two sets. The first set ("set1") contains absorbers where both O vi and Ly absorption are fitted with a single Voigt component. The "set2" contains absorbers with Ly absorption fitted with multiple components and only one or few of these components are aligned with O vi absorption component(s). In this case it is possible that some of the derived parameters of Ly absorption may be influenced by the uncertainty in the voigt profile decomposition. The "WIND" and "WIND+AGN" simulations have 26-29 absorbers in "set1" for "ks19q18" UVB. The absorbers in "set1" show lesser scatter in the fractional deviation in temperature with respect to the unity line compared to the absorbers in "set2". In the case of WIND-only simulations, the RMS of the fractional deviation is 0.36 and 0.38 for "set1" and "set2" respectively. The same in the case of "WIND+AGN" simulations are 0.52 and 0.70, respectively.
While measuring the temperature from bt, we assume the absorption originates from a cloud with a single temperature. In reality, a given absorption component is contributed by gas with a range of density and temperature. Thus, the difference between the optical depth-weighted temperature and T(bt) originates from diverse regions contributing to the absorption. This explains why there is a large scatter in the case of "WIND+AGN" simulations. We have also shown that some deviation can originate from the uncertainties involved in the Voigt profile decomposition in the case of Ly absorbers with multiple components.
Next, we explore the influence of UVB on the measured non-thermal broadening. In the right panel of Figure 2, we show the results considering the "fg11" UVB. As in the case of "ks19q18" UVB, the inferred T(bt) in the case of "fg11" UVB is broadly consistent with . However, we do see the scatter around the unity line is increased in the case of "fg11", i.e., the RMS increases to 0.49 and 0.75 for the "WIND" and "WIND+AGN" models, respectively (shown in the yellow shaded regions in the right-lower panel) when we considered the full sample. Similar to the case of "ks19q18" UVB, around of the absorbers in both simulations are in "set1" for "fg11" UVB. The multi-component absorbers ("set2") in the case of "fg11" also show a larger scatter from the equality line compared to the single-component absorbers ("set1"). The RMS of fractional deviation for absorbers in "set1" and "set2" in the "WIND" simulation is 0.31 and 0.55, respectively. The scatter is considerably higher in the case of the "WIND+AGN" simulation, with RMS of fractional deviation being 0.70 and 0.77, respectively.
This is easy to understand as more low-density regions contribute to the absorption when softer UVB like "fg11" is used. This increases the range of density (temperature) of the gas contributing to a given absorption, and hence, we expect the T(bt) to deviate more from the optical depth weighted value, as reported here.
To explore this scatter further, in the case of "set2" we regenerated a modified profile of Ly absorbers, considering only the pixels that contribute to the O vi absorption of the aligned component. This eliminates the possible source of scatter originating from the uncertainty in assigning a particular Ly component as an aligned component in a multi-component blended Ly profile. We find the scatter in around the optical depth weighted temperature in the "WIND+AGN" model reduces by compared to the full sample of absorbers. However, the scatter (RMS ) is comparable to or slightly less than the scatter found for absorbers in "set1".
Overall the temperature estimated from bt roughly agrees with the optical-depth-weighted value for both "WIND" and "WIND+AGN" simulations for spectra obtained using both "ks19q18" and "fg11" UVBs. In individual cases, the estimated temperature is expected to have a scatter introduced by our assumption of absorption originating from a gas having a single temperature. Therefore, the scatter also depends on the nature of feedback used in simulations.
3.2 Temperature distribution of the absorbers
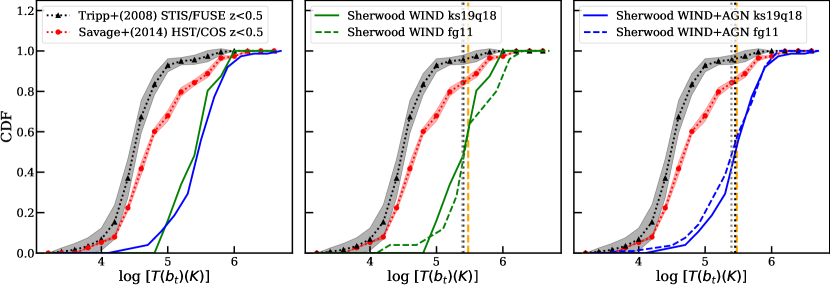
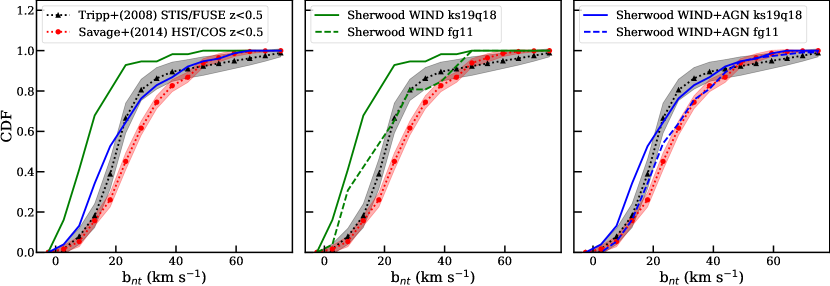
In Figure 3 left panel, we show the distribution of T(bt) for simulated spectra using "ks19q18" UVB for "WIND" and "WIND+AGN" models. We compare the simulation results with the allowed range in observation, reported by Tripp et al. (2008) and Savage et al. (2014), as shown in black and red lines in Figure 3. We generated 500 sets of mock observation values from Gaussian random number selection within the error range of each observed temperature value and calculated CDF for each set. The mean value of these CDFs is plotted in red/black symbols, and error in CDF is obtained from the standard deviation. We notice both simulations produce O vi absorption from a much hotter medium compared to the observation reported in Tripp et al. (2008) and Savage et al. (2014). This is related to shortcomings of the Sherwood simulations discussed in Mallik et al. (2023).
The median temperatures in the two simulations (K and K for "WIND" and "WIND+AGN" models, respectively) differ by 20. However, the temperature distribution of the aligned absorbers in these two simulations is not significantly different, having median T(bt) close to the temperature of peak fraction in collisionally ionized O vi (TK). This is also confirmed by the KS test, resulting in a p-value of 0.20. The temperature distribution of absorbers also does not differ significantly between "set1" and "set2" in both simulations, although the KS-test, in this case, may be affected by the small number of data points. Just for the completeness sake the observed median value of are K and K for Tripp et al. (2008) and Savage et al. (2014) respectively.
We compare the T(bt)-CDF obtained for simulated spectra generated using "ks19q18" uvb with "fg11" in the middle (for the "WIND") model and right (for the "WIND+AGN" model) panel. Both these panels show T(bt)-CDF in "fg11" UVB also does not agree with the allowed range from observation. The median value in "fg11" increases by 20 for the "WIND" model but decreases by 10 for the "WIND+AGN" models. The p-values in the KS-test for both the feedback models are , which implies T(bt) distribution does not change significantly with variation in UVB. This is expected as the temperature of individual SPH particles is not modified when we use different UVBs.
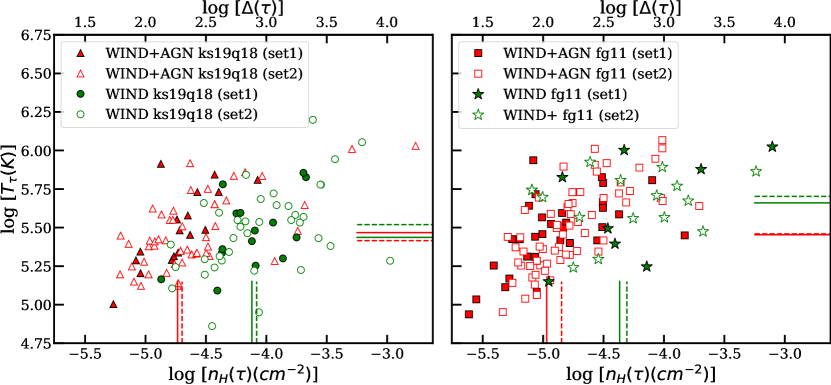
To further investigate the physical conditions of the aligned absorbers, we compared the absorbers in optical depth weighted temperature-density plane in Figure 4. The left panel shows the absorbers in "ks19q18" UVB. Although the absorbers in both simulations trace temperatures in the collisional ionization range, the majority of absorbers in the WIND-only model trace higher density medium compared to the absorbers in the "WIND+AGN" simulation. This behaviour is commensurate with the finding in Paper-I that the absorbers found in the "WIND" model trace higher-density regions compared to those from the "WIND+AGN" model. The absorbers for "fg11" UVB in two simulations also show a similar trend, as shown in the right panel of Figure 4. These absorbers also trace lower-density regions compared to "ks19q18" UVB, again confirming the conclusion in Paper-I that more absorbers can originate in lower-density regions for softer UVB.
3.3 Distribution of non-thermal b-parameters
We show the Cumulative distribution of bnt for aligned b(O vi)-b(H i) pairs in Figure 5. For completeness, we compare our results with the observations reported in Tripp et al. (2008) and Savage et al. (2014), plotted in black and red points. The bnt-CDF and corresponding errors from the observation data are calculated in a similar procedure as T(bt)-CDF of observation, as described in section 3.2. The error in bnt is found by propagating the errors in and . The bnt-CDF for the "WIND+AGN" model roughly agrees with the observed range, while the "WIND" only model has lower bnt values compared to the observations. The KS-test between bnt of "WIND" and "WIND+AGN" models for "ks19q18" UVB tells us these two distributions are significantly different, as also evident from the left panel of Figure 5. The median bnt of the "WIND+AGN" model (=16.06 km s-1) is 1.8 times higher than the "WIND" model (=9.09 km s-1) for "ks19q18" UVB. Also, the KS-test p-value ( ) shows bnt-CDF values in the "WIND" and "WIND+AGN" models can not be tracing the same distribution. The observed data from Tripp et al. (2008) and Savage et al. (2014) has median bnt values of 20 km s-1 and 26 km s-1, respectively, which is higher than both the simulations in "ks19q18" UVB.
The middle and right panels show that the results obtained using a softer UVB like "fg11" statistically result in a higher non-thermal broadening of the lines for both the "WIND" and the "WIND+AGN" models. In "fg11" UVB, the median bnt value for the "WIND" model and the "WIND+AGN" model increases to 15.84 km s-1 and 21.83 km s-1, respectively. The KS-test shows bnt distributions for both models differ from "ks19q18" to "fg11" with more than 90 probability. The median bnt values for both simulations are lower than the observed data in Savage et al. (2014).
3.4 Thermal vs. non-thermal contribution in line-broadening
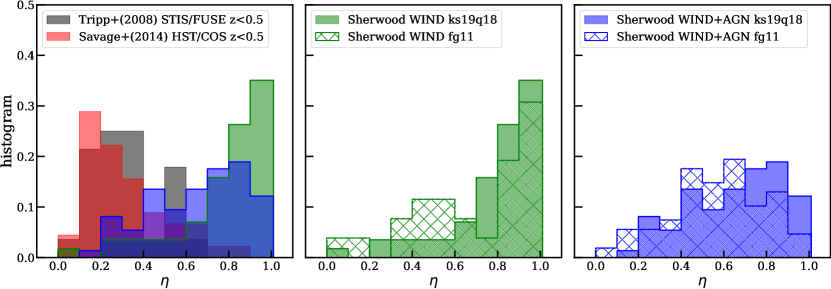
We characterize the nature of line broadening (i.e., whether thermal or non-thermal broadening dominates) of aligned absorbers using a parameter , as previously done in Cen & Chisari (2011). Note that the value of varies between 0 to 1 depending on the relative importance of thermal and non-thermal broadening in the Doppler parameter; for a purely thermal broadened absorber, and a non-thermal broadening-dominated absorber has .
We show the histogram of for the "WIND" and "WIND+AGN" model for "ks19q18" UVB in the left panel of Figure 6 along with the observations from Tripp et al. (2008) and Savage et al. (2014). As expected based on the discussions presented till now, most of the absorbers in the "WIND" model have values near 1, implying mostly thermal broadening dominated Doppler width, whereas the "WIND+AGN" model has relatively lower values, implying higher importance of non-thermal broadening. This suggests that the distribution of can provide interesting constraints on the feedback models used in the simulations. As expected based on the discussions above, both models have lower non-thermal contributions in line broadening compared to the observation, which is also influenced by the fact that the inferred temperatures simulation temperatures are high for the simulations used here.
The histogram in the middle and right panels shows non-thermal contribution increases when "fg11" UVB is used in both the "WIND" and the "WIND+AGN" simulations, respectively. We believe the effect of UVB on the distribution will be higher if the gas temperature is lower compared to what we find in Sherwood simulations. This is because the contribution of photoionization is expected to be higher when the gas temperature is lower.
Some previous works (see for example, Cen & Chisari, 2011; Tepper-García et al., 2012; Pessa et al., 2018) reported could depend on the Ly column density with high column density absorbers having more non-thermal contribution. The observed data from Savage et al. (2014) shows weak anti-correlation with a Pearson correlation coefficient equal to -0.37 (p-value =0.01). However, we do not find any significant correlation in the observed data from Tripp et al. (2008) or for the simulations used here for both the UVB as confirmed by a low value of the Pearson correlation coefficient () and/or high p-values ().
4 Summary and discussions
Absorption lines produced by different ion species of the aligned absorbers are often used to probe the thermal and non-thermal contribution to the absorption line-broadening. Such measurements are used to infer the kinetic temperature of the absorbing gas and the non-thermal contribution to the velocity spread. The latter is broadly interpreted as turbulence in the literature.
Recently, we have shown that the distribution of Doppler parameters of the simulated O vi absorbers is influenced by the feedback model and the choice of UVB used in the hydrodynamical simulation (Mallik et al., 2023). This study also emphasized the importance of the simultaneous usage of several statistical distributions to lift degeneracies between the effect of feedback and the UVB assumed. Recently, we have shown that the line of sight two-point correlation function at different length scales can provide non-degenerate constraints.
Here, using cosmological simulations, we probe how well the temperature derived using the aligned absorbers probe the underlying gas temperature. For this, we consider two different simulations (viz., Sherwood "WIND" model and Sherwood "WIND+AGN" model) having varied feedback. We also explore the effects of the background radiation field, using two different UVB models viz. "ks19q18" and "fg11". Similar to the method followed in observation, we identify the Ly absorbers aligned to a O vi absorber and simultaneously fit these aligned absorbers using vpfit to find the thermal and non-thermal contribution in the line-broadening.
We show the temperature of the absorbers estimated from the thermal contribution in the line-broadening correlates strongly with the optical depth weighted temperature of the absorbing gas, although showing RMS scatter of 0.37-0.49 and 0.65-0.75 (in the fractional deviation from zero) for the "WIND" and the "WIND+AGN" models, respectively considering two different UVB. The single-component isolated O vi-Ly aligned absorbers have much less scatter compared to the aligned absorbers in a multi-component blended system. We show the scatter primarily comes from the spread in kinetic temperature of the gas contributing to the absorption and hence depends on the feedback processes and the UVB. The uncertainty in the Voigt-profile decomposition further increases the scatter in the case of blended systems.
We find the median temperature () in the "WIND" model (K) is 20 higher than that of the "WIND+AGN" model (K) for the "ks19q18" UVB. In "fg11" UVB, the median temperature in the "WIND" model increases by and decreases by in the "WIND+AGN" model. However, the temperature distribution of the absorbers in both simulations are similar. This is expected as we have ignored any different radiative heating of the gas when we use different UVBs. We find the median temperature value found in the simulations used here are higher compared to the observed median value of temperature ( K) from Tripp et al. (2008) and Savage et al. (2014). This confirms some of the shortcomings of Sherwood simulations found in Mallik et al. (2023).
The median value of non-thermal line broadening of aligned absorbers in the "WIND+AGN" model (= 16.06 km s-1) is 1.8 times higher than that in the "WIND" model (= 9.09 km s-1). The non-thermal contribution increases in the case of "fg11" UVB, but median non-thermal broadening values in both simulations are lower than the observed values by Savage et al. (2014).
The relative contribution of thermal broadening in the Doppler parameter of an absorber is estimated using a parameter (as defined in section 3.4). The absorbers in the "WIND" model have values mostly near 1, whereas the absorbers in the "WIND+AGN" model have relatively lower values. The histogram of for simulated absorbers does not agree with the observed distribution, which is partly because of higher temperature estimation in the simulations used here.
The main caveats in this work are that we assumed the change in UVB only alters the ionization state and not the temperature of the gas and also assumed the gas to be optically thin. We plan to address this issue by using different UVBs during the simulation run in our future work. It will also be an interesting exercise to explore the effects of the feedback model variations on the non-thermal line broadening using a wide range of feedback models in a higher resolution simulation box like Illustris TNG, as varied feedback results in large dispersion in O vi CDDF (see Figure 6 in Nelson et al., 2018).
In conclusion, we find that the derived temperature using the aligned absorber roughly provides the optical depth-weighted kinetic temperature of the gas. The non-thermal broadening inferred arises due to the inhomogeneities in the temperature-density fields and from the uncertainties associated with the multiple-component Voigt profile decomposition. Therefore, the derived non-thermal line-broadening using aligned absorbers may not be probing the sub-grid turbulence arising due to stellar feedback or gravitational instabilities. Together with flux statistics (flux probability distribution function and two-point correlation function) as well as column density and Doppler parameter distribution, the number of metal absorption aligned with a Ly component and distribution of thermal and non-thermal line broadening can be used to place additional constraints on the feedback models used in the simulation for a given UVB.
Acknowledgments
We acknowledge the use of High-performance computing facilities PERSEUS and PEGASUS at IUCAA. We are grateful to K. Subramanian, S. Muzahid, Vikram Khaire and A. Mohapatra for insightful discussions regarding this work. The Sherwood simulations were performed using the Curie supercomputer at the Tre Grand Centre de Calcul (TGCC), and the DiRAC Data Analytic system at the University of Cambridge, operated by the University of Cambridge High Performance Computing Service on behalf of the STFC DiRAC HPC Facility (www.dirac.ac.uk) . This was funded by BIS National E-infrastructure capital grant (ST/K001590/1), STFC capital grants ST/H008861/1 and ST/H00887X/1, and STFC DiRAC Operations grant ST/K00333X/1. DiRAC is part of the National E-Infrastructure.
Data Availability
The data underlying this article are available in the article and in its online supplementary material.
References
- Acharya & Khaire (2022) Acharya A., Khaire V., 2022, MNRAS, 509, 5559
- Aguirre et al. (2004) Aguirre A., Schaye J., Kim T.-S., Theuns T., Rauch M., Sargent W. L. W., 2004, ApJ, 602, 38
- Aguirre et al. (2008) Aguirre A., Dow-Hygelund C., Schaye J., Theuns T., 2008, ApJ, 689, 851
- Appleby et al. (2021) Appleby S., Davé R., Sorini D., Storey-Fisher K., Smith B., 2021, MNRAS, 507, 2383
- Armstrong et al. (1995) Armstrong J. W., Rickett B. J., Spangler S. R., 1995, ApJ, 443, 209
- Beck (2015) Beck R., 2015, A&ARv, 24, 4
- Bolton et al. (2017) Bolton J. S., Puchwein E., Sijacki D., Haehnelt M. G., Kim T.-S., Meiksin A., Regan J. A., Viel M., 2017, MNRAS, 464, 897
- Bolton et al. (2022) Bolton J. S., Gaikwad P., Haehnelt M. G., Kim T.-S., Nasir F., Puchwein E., Viel M., Wakker B. P., 2022, MNRAS, 513, 864
- Bradley et al. (2022) Bradley L., Davé R., Cui W., Smith B., Sorini D., 2022, arXiv e-prints, p. arXiv:2203.15055
- Carswell & Webb (2014) Carswell R. F., Webb J. K., 2014, VPFIT: Voigt profile fitting program (ascl:1408.015)
- Cen & Chisari (2011) Cen R., Chisari N. E., 2011, ApJ, 731, 11
- Chepurnov & Lazarian (2010) Chepurnov A., Lazarian A., 2010, ApJ, 710, 853
- Crain et al. (2015) Crain R. A., et al., 2015, MNRAS, 450, 1937
- Danforth et al. (2010) Danforth C. W., Stocke J. T., Shull J. M., 2010, ApJ, 710, 613
- Davé et al. (2019) Davé R., Anglés-Alcázar D., Narayanan D., Li Q., Rafieferantsoa M. H., Appleby S., 2019, MNRAS, 486, 2827
- Dib et al. (2006) Dib S., Bell E., Burkert A., 2006, ApJ, 638, 797
- Evoli & Ferrara (2011) Evoli C., Ferrara A., 2011, MNRAS, 413, 2721
- Faucher-Giguère (2020) Faucher-Giguère C.-A., 2020, MNRAS, 493, 1614
- Faucher-Giguère et al. (2009) Faucher-Giguère C.-A., Lidz A., Zaldarriaga M., Hernquist L., 2009, ApJ, 703, 1416
- Fechner (2011) Fechner C., 2011, A&A, 532, A62
- Fensch et al. (2023) Fensch J., Bournaud F., Brucy N., Dubois Y., Hennebelle P., Rosdahl J., 2023, A&A, 672, A193
- Fleck (1981) Fleck R. C. J., 1981, ApJ, 246, L151
- Forbes et al. (2023) Forbes J. C., et al., 2023, ApJ, 948, 107
- Gaikwad et al. (2017) Gaikwad P., Srianand R., Choudhury T. R., Khaire V., 2017, MNRAS, 467, 3172
- Haardt & Madau (1996) Haardt F., Madau P., 1996, ApJ, 461, 20
- Haardt & Madau (2012) Haardt F., Madau P., 2012, ApJ, 746, 125
- Haislmaier et al. (2021) Haislmaier K. J., Tripp T. M., Katz N., Prochaska J. X., Burchett J. N., O’Meara J. M., Werk J. K., 2021, MNRAS, 502, 4993
- Howk et al. (2009) Howk J. C., Ribaudo J. S., Lehner N., Prochaska J. X., Chen H.-W., 2009, MNRAS, 396, 1875
- Hussain et al. (2017) Hussain T., Khaire V., Srianand R., Muzahid S., Pathak A., 2017, MNRAS, 466, 3133
- Joung et al. (2009) Joung M. R., Mac Low M.-M., Bryan G. L., 2009, ApJ, 704, 137
- Khaire & Srianand (2019) Khaire V., Srianand R., 2019, MNRAS, 484, 4174
- Khaire et al. (2023) Khaire V., Hu T., Hennawi J. F., Walther M., Davies F., 2023, arXiv e-prints, p. arXiv:2306.05466
- Lazarian et al. (2023) Lazarian A., Xu S., Hu Y., 2023, Frontiers in Astronomy and Space Sciences, 10, 1154760
- Lewis et al. (2000) Lewis A., Challinor A., Lasenby A., 2000, ApJ, 538, 473
- Lu et al. (2020) Lu Z.-J., Pelkonen V.-M., Padoan P., Pan L., Haugbølle T., Nordlund Å., 2020, ApJ, 904, 58
- MacLow (2004) MacLow M.-M., 2004, Ap&SS, 289, 323
- Maitra et al. (2020) Maitra S., Srianand R., Gaikwad P., Khandai N., 2020, arXiv e-prints, p. arXiv:2012.05926
- Mallik et al. (2023) Mallik S., Srianand R., Maitra S., Gaikwad P., Khandai N., 2023, MNRAS,
- Marra et al. (2021) Marra R., et al., 2021, MNRAS, 508, 4938
- McKee & Ostriker (1977) McKee C. F., Ostriker J. P., 1977, ApJ, 218, 148
- Meiksin et al. (2001) Meiksin A., Bryan G., Machacek M., 2001, MNRAS, 327, 296
- Mohapatra et al. (2021) Mohapatra A., Srianand R., Pradhan A. C., 2021, MNRAS, 501, 5424
- Muzahid et al. (2012) Muzahid S., Srianand R., Bergeron J., Petitjean P., 2012, MNRAS, 421, 446
- Nasir et al. (2017) Nasir F., Bolton J. S., Viel M., Kim T.-S., Haehnelt M. G., Puchwein E., Sijacki D., 2017, MNRAS, 471, 1056
- Nelson et al. (2018) Nelson D., et al., 2018, MNRAS, 477, 450
- Norman & Ferrara (1996) Norman C. A., Ferrara A., 1996, ApJ, 467, 280
- Oppenheimer & Davé (2009) Oppenheimer B. D., Davé R., 2009, MNRAS, 395, 1875
- Oppenheimer et al. (2012) Oppenheimer B. D., Davé R., Katz N., Kollmeier J. A., Weinberg D. H., 2012, Monthly Notices of the Royal Astronomical Society, 420, 829
- Peeples et al. (2019) Peeples M. S., et al., 2019, ApJ, 873, 129
- Pessa et al. (2018) Pessa I., et al., 2018, MNRAS, 477, 2991
- Pillepich et al. (2018) Pillepich A., et al., 2018, MNRAS, 473, 4077
- Planck Collaboration et al. (2014) Planck Collaboration et al., 2014, A&A, 571, A16
- Prause et al. (2007) Prause N., Reimers D., Fechner C., Janknecht E., 2007, A&A, 470, 67
- Puchwein & Springel (2013) Puchwein E., Springel V., 2013, MNRAS, 428, 2966
- Rahmani et al. (2016) Rahmani H., et al., 2016, MNRAS, 463, 980
- Rahmati et al. (2013) Rahmati A., Pawlik A. H., Raičević M., Schaye J., 2013, MNRAS, 430, 2427
- Rauch et al. (1996) Rauch M., Sargent W. L. W., Womble D. S., Barlow T. A., 1996, ApJ, 467, L5
- Richter et al. (2006a) Richter P., Savage B. D., Sembach K. R., Tripp T. M., 2006a, A&A, 445, 827
- Richter et al. (2006b) Richter P., Fang T., Bryan G. L., 2006b, A&A, 451, 767
- Savage et al. (2014) Savage B. D., Kim T. S., Wakker B. P., Keeney B., Shull J. M., Stocke J. T., Green J. C., 2014, ApJS, 212, 8
- Schaye (2004) Schaye J., 2004, ApJ, 609, 667
- Schaye et al. (2003) Schaye J., Aguirre A., Kim T.-S., Theuns T., Rauch M., Sargent W. L. W., 2003, ApJ, 596, 768
- Schaye et al. (2015) Schaye J., et al., 2015, MNRAS, 446, 521
- Sellwood & Balbus (1999) Sellwood J. A., Balbus S. A., 1999, ApJ, 511, 660
- Simcoe (2011) Simcoe R. A., 2011, ApJ, 738, 159
- Simcoe et al. (2004) Simcoe R. A., Sargent W. L. W., Rauch M., 2004, ApJ, 606, 92
- Springel (2005) Springel V., 2005, MNRAS, 364, 1105
- Tepper-García et al. (2011) Tepper-García T., Richter P., Schaye J., Booth C., Vecchia C. D., Theuns T., Wiersma R. P., 2011, Monthly Notices of the Royal Astronomical Society, 413, 190
- Tepper-García et al. (2012) Tepper-García T., Richter P., Schaye J., Booth C. M., Dalla Vecchia C., Theuns T., 2012, MNRAS, 425, 1640
- Tepper-García et al. (2013) Tepper-García T., Richter P., Schaye J., 2013, MNRAS, 436, 2063
- Tripp et al. (2008) Tripp T. M., Sembach K. R., Bowen D. V., Savage B. D., Jenkins E. B., Lehner N., Richter P., 2008, ApJS, 177, 39
- Turner et al. (2016) Turner M. L., Schaye J., Crain R. A., Theuns T., Wendt M., 2016, MNRAS, 462, 2440
- Viel et al. (2017) Viel M., Haehnelt M. G., Bolton J. S., Kim T.-S., Puchwein E., Nasir F., Wakker B. P., 2017, MNRAS, 467, L86
- Weinberger et al. (2017) Weinberger R., et al., 2017, MNRAS, 465, 3291
- de Avillez & Breitschwerdt (2007) de Avillez M. A., Breitschwerdt D., 2007, ApJ, 665, L35