Kinematics and Collimation of the Two-Sided Jets in NGC 4261: VLBI Study on Sub-parsec Scales
Abstract
We report multi-frequency VLBI studies of the sub-parsec scale structure of the two-sided jet in the nearby radio galaxy NGC 4261. Our analyses include new observations using the Source Frequency Phase Referencing technique with the Very Long Baseline Array at 44 and 88 GHz, as well as archival data at 15 and 43 GHz. Our results show an extended double-sided structure at 43/44 GHz and provide a clear image of the nuclear region at 88 GHz, showing a core size of 0.09 mas and a brightness temperature of K. Proper motions are measured for the first time in the two-sided jet, with apparent speeds ranging from to in the approaching jet and in the receding jet. The jet-to-counter-jet brightness ratio allows us to constrain the viewing angle to between and and the intrinsic speed to between and . We confirm the parabolic shape of the upstream jet on both sides of the central engine, with a power-law index of . Notably, the jet collimation is found to be already completed at sub-parsec scales, with a transition location of about 0.61 pc, which is significantly smaller than the Bondi radius of 99.2 pc. This behavior can be interpreted as the initial confinement of the jet by external pressure from either the geometrically thick, optically thin advection-dominated accretion flows (ADAF) or the disk wind launched from it. Alternatively, the shape transition may also be explained by the internal flow transition from a magnetically dominated to a particle-dominated regime.
1 Introduction
| Freq. | P.C. | Date | Array | Pol | Bandwidth | Beam size | ||
|---|---|---|---|---|---|---|---|---|
| (GHz) | (MHz) | (mas mas, deg) | (Jy beam-1) | (Jy beam-1) | ||||
| 15 | BM166 | 2002.07.05 | VLBA | Dual | 64 | 0.9220.512, -4.3 | 0.129 | 0.0005 |
| 15 | BM175b | 2002.09.27 | VLBA | LCP | 64 | 1.040.498, -5.1 | 0.133 | 0.0005 |
| 15 | BM175c | 2003.05.05 | VLBA | LCP | 64 | 1.010.456, -5.12 | 0.121 | 0.0005 |
| 15 | BM175a | 2003.07.04 | VLBA | LCP | 64 | 1.020.459, -4.66 | 0.130 | 0.0005 |
| 43 | BM215a | 2004.12.20 | VLBA | Dual | 64 | 0.3440.175, -8.31 | 0.143 | 0.0006 |
| 44 | BY167 | 2022.02.14 | VLBA, -SC,-HN | Dual | 1024 | 0.6270.171, -22.4 | 0.113 | 0.0005 |
| 88 | BY167 | 2022.02.14 | VLBA, -SC,-HN | Dual | 1024 | 0.4670.101, -19.2 | 0.0492 | 0.0015 |
Note. — Column (1): Observing frequency. Column (2): Project code. Column (3): Date of observation. Column (4): Participating stations. Stations not involved are indicated with a minus sign. Column (5): Polarization. Column (6): Bandwidth. Column (7): Full width at half maximum (FWHM) and position angle of the synthesized beam. Column (8)-(9): Peak intensity and rms noise.
Relativistic jets in active galactic nuclei (AGN) undergo poorly understood acceleration and collimation processes that are closely linked to their launching mechanisms. Theoretical studies and simulations (e.g., McKinney, 2006; Tchekhovskoy et al., 2011) suggest that jets can originate from either a spinning black hole (Blandford & Znajek, 1977) or an accretion flow (Blandford & Payne, 1982). Moreover, the initial jet is suggested to be magnetically dominated with a parabolic shape due to external pressure (e.g., McKinney et al., 2012). However, as the jet propagates, it transits to a kinetically dominated state, expanding freely in a conical shape.
Very Long Baseline Interferometry (VLBI) is a powerful tool for studying the jet formation, acceleration and collimation processes. It has been extensively applied to several nearby low-luminosity AGN (LLAGN) to study jet collimation, such as M 87 (e.g., Asada & Nakamura, 2012; Lu et al., 2023), NGC 6251 (Tseng et al., 2016), NGC 4261 (Nakahara et al., 2018), NGC 1052 (Nakahara et al., 2020) and NGC 315 (Park et al., 2021; Boccardi et al., 2021). Recently, Kovalev et al. (2020) proposed that the transition from a parabolic to conical shape may be a common effect in nearby AGN jets based on their analysis of a sample of 367 AGN. They also noted that the transition location does not necessarily coincide with the Bondi radius. NGC 315 serves as a typical example, where the jet collimation is completed early on sub-parsec scales (Boccardi et al., 2021). This behavior is interpreted as the initial confinement of the jet by the external pressure exerted by either the ADAF or the disk wind launched from it.
Among the above-mentioned sources, the Fanaroff-Riley Class I (FR-I) source, NGC 4261, deserves particular attention. First, the jet is observed at a large viewing angle of (Piner et al., 2001) and is double-sided (e.g., Jones & Wehrle, 1997). Second, precise core-shift measurements have determined the location of the central supermassive black hole (SMBH, at a distance of as from the 43 GHz core, Haga et al., 2015). This allows an accurate estimate of the de-projected radial distance between the jet and the central SMBH. Furthermore, the proximity of NGC 4261 (31.6 Mpc, Tonry et al., 2001) and its large black hole mass (, Boizelle et al., 2021; Ruffa et al., 2023) make it a valuable laboratory for studying jet properties, with 1 mas corresponding to 0.15 pc or 988 Schwarzschild radii ().
Despite these advantages, the collimation and kinematics of the NGC 4261 jet remain largely unexplored. Although previous observations found parabolic-to-conical transition signatures on the jet width profile, the upstream parabolic shape could not be well sampled due to the limited number of width measurements (see Figures 2-4 in Nakahara et al., 2018). In addition, apart from the work by Piner et al. (2001), who provided only one jet speed measurement, there have been no further kinematic analyses conducted on the NGC 4261 jet. For these reasons, we aim to examine the width profile of the upstream jet and investigate its kinematics.
This paper is organized as follows. In Section 2, we present our observations and data reduction. Section 3 describes the methods used for our kinematic analysis and transverse width measurement. The results are presented in Section 4, followed by a discussion in Section 5. Finally, we summarize in Section 6.
2 Observations and Data Reduction
2.1 New VLBA observations
We observed NGC 4261 using the Very Long Baseline Array (VLBA) with the Source Frequency Phase Referencing (SFPR) technique (Rioja & Dodson, 2011) on February 14, 2022. The observations were performed at 44 and 88 GHz, with a data rate of 4 Gbits/s and 2-bit sampling. Both left-hand circular polarization (LCP) and right-hand circular polarization (RCP) were recorded, covering a total bandwidth of 1024 MHz. Each polarization was divided into 4 sub-bands (IFs). We used 3C 279 and 3C 273 as the fringe finder and amplitude/phase calibrator, respectively. A summary of the observations is provided in Table 1.
We calibrated the data using NRAO’s Astronomical Image Processing System (AIPS, Greisen, 2003) following the procedures in Jiang et al. (2021). The phase calibration involved several steps. Firstly, we removed the constant single-band delays and phase offsets using high signal-to-noise ratio (SNR) calibrator scans. Then, we performed global fringe fitting to eliminate single- and multi-band residual delays and solve for fringe rates. Afterward, we applied frequency phase transfer (FPT) to the 88 GHz data by multiplying the 44 GHz residual phase solutions by the frequency ratio of 2. For the 88 GHz data, a re-fringe-fitting was run on the calibrator 3C 273 and the solutions were applied to NGC 4261 to further correct the residual ionospheric errors as well as the instrumental offsets between 44 and 88 GHz. We performed a prior amplitude calibration using the antenna system temperatures and gain curves with opacity corrections. The band-pass calibration was derived from scans on a bright calibrator source. Once calibration was completed, we averaged the data over frequency and conducted imaging and self-calibration using DIFMAP (Shepherd, 1997).
2.2 Archival VLBA data
We also analyzed archival VLBA data of NGC 4261 at 15 and 43 GHz. The details of these observations are provided in Table 1. The BM166 data (15 GHz) were originally observed for polarimetry (Middelberg, 2004). The three-epoch BM175 datasets were observed at multiple frequencies but we only utilized the 15 GHz data for our analysis. In addition, we noted that the BM175c data were already published (Middelberg et al., 2005). The BM215a data (43 GHz) were also designed for polarimetry. For all these archival observations, we performed data reduction and imaging using AIPS and DIFMAP following standard procedures (e.g., Lu et al., 2023).
| ID | Ep. | (mas) | (mJy) | (mas) | (c) |
|---|---|---|---|---|---|
| Core | 1 | 0 | |||
| 2 | 0 | ||||
| 3 | 0 | ||||
| 4 | 0 | 0 | |||
| W1 | 1 | ||||
| 2 | |||||
| 3 | |||||
| 4 | |||||
| W2 | 1 | ||||
| 2 | |||||
| 3 | |||||
| 4 | |||||
| W3 | 1 | ||||
| 2 | |||||
| 3 | |||||
| 4 | |||||
| W4 | 1 | ||||
| 2 | |||||
| 3 | |||||
| 4 | |||||
| W5 | 2 | ||||
| 3 | |||||
| 4 | |||||
| E1 | 1 | ||||
| 2 | |||||
| 3 | |||||
| 4 |
Note. — Column (1): Component label. Column (2): Epoch (1: 2002.07.05, 2: 2002.09.27, 3: 2003.05.05, 4: 2003.07.04). Column (3): The radial distance from the core component. Column (4): The flux density. Column (5): The size (FWHM). Column (6): Apparent speed in units of the speed of light .
3 Data analysis
3.1 Model fitting
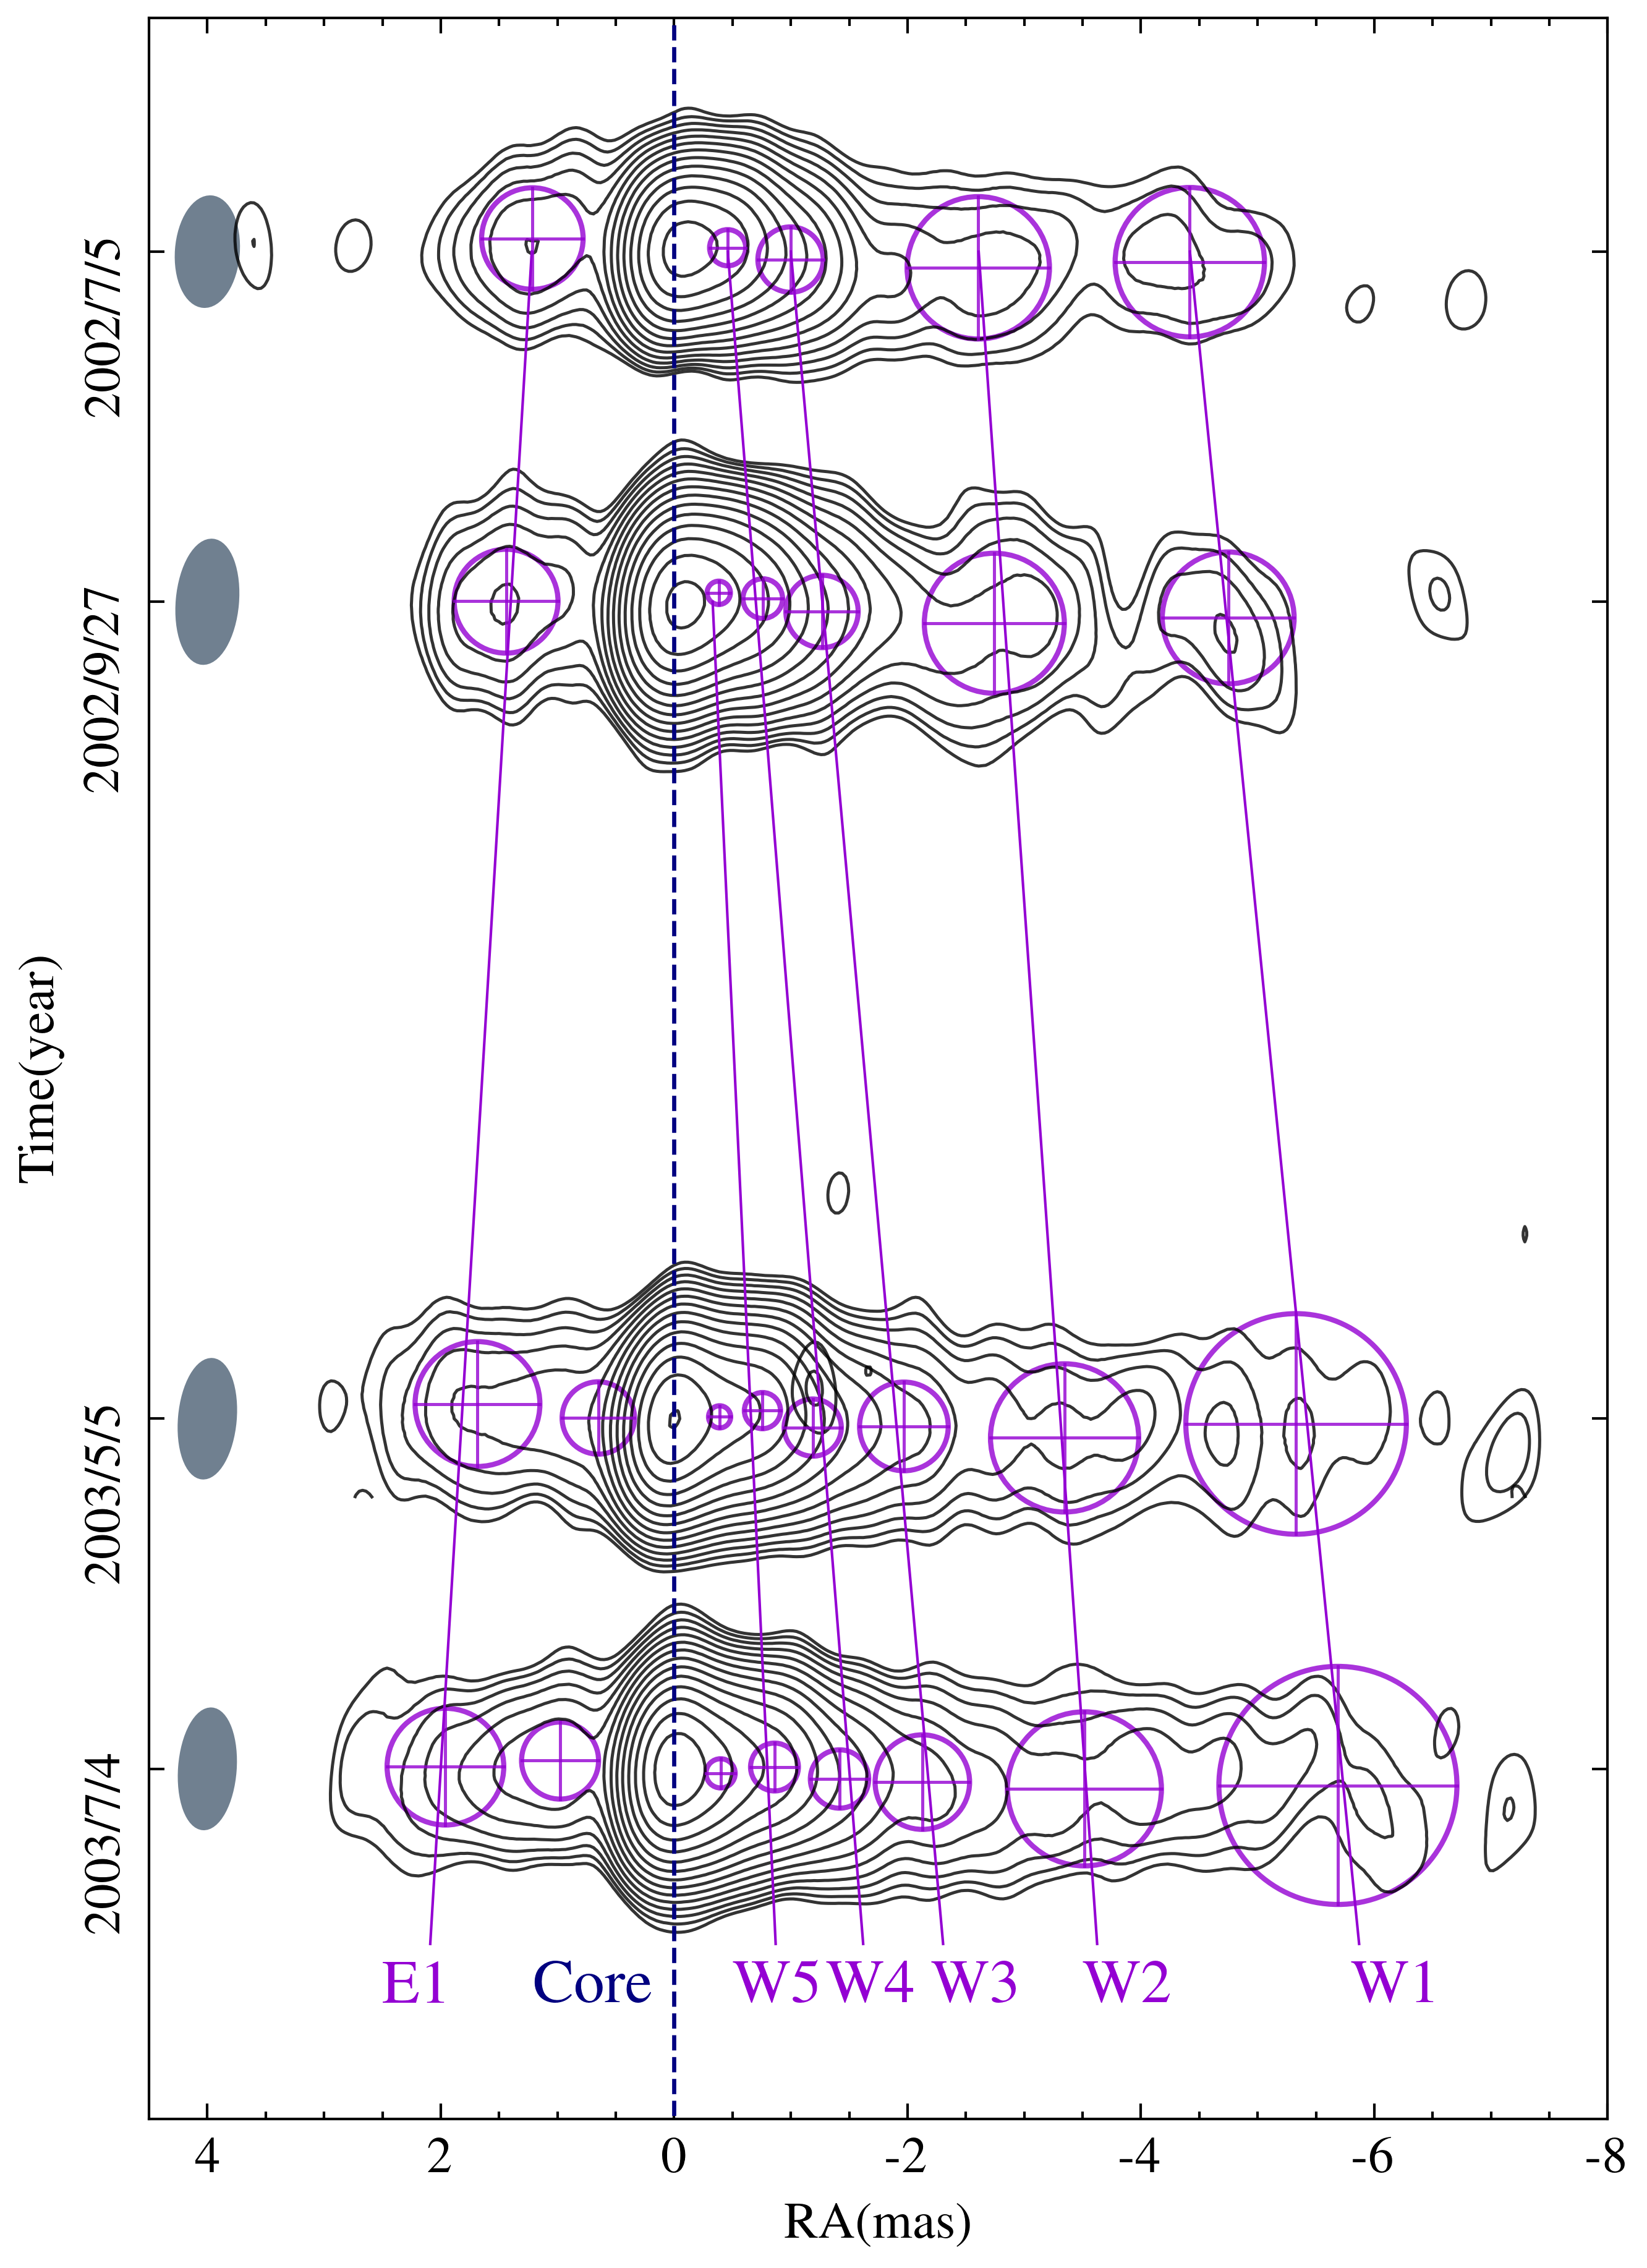
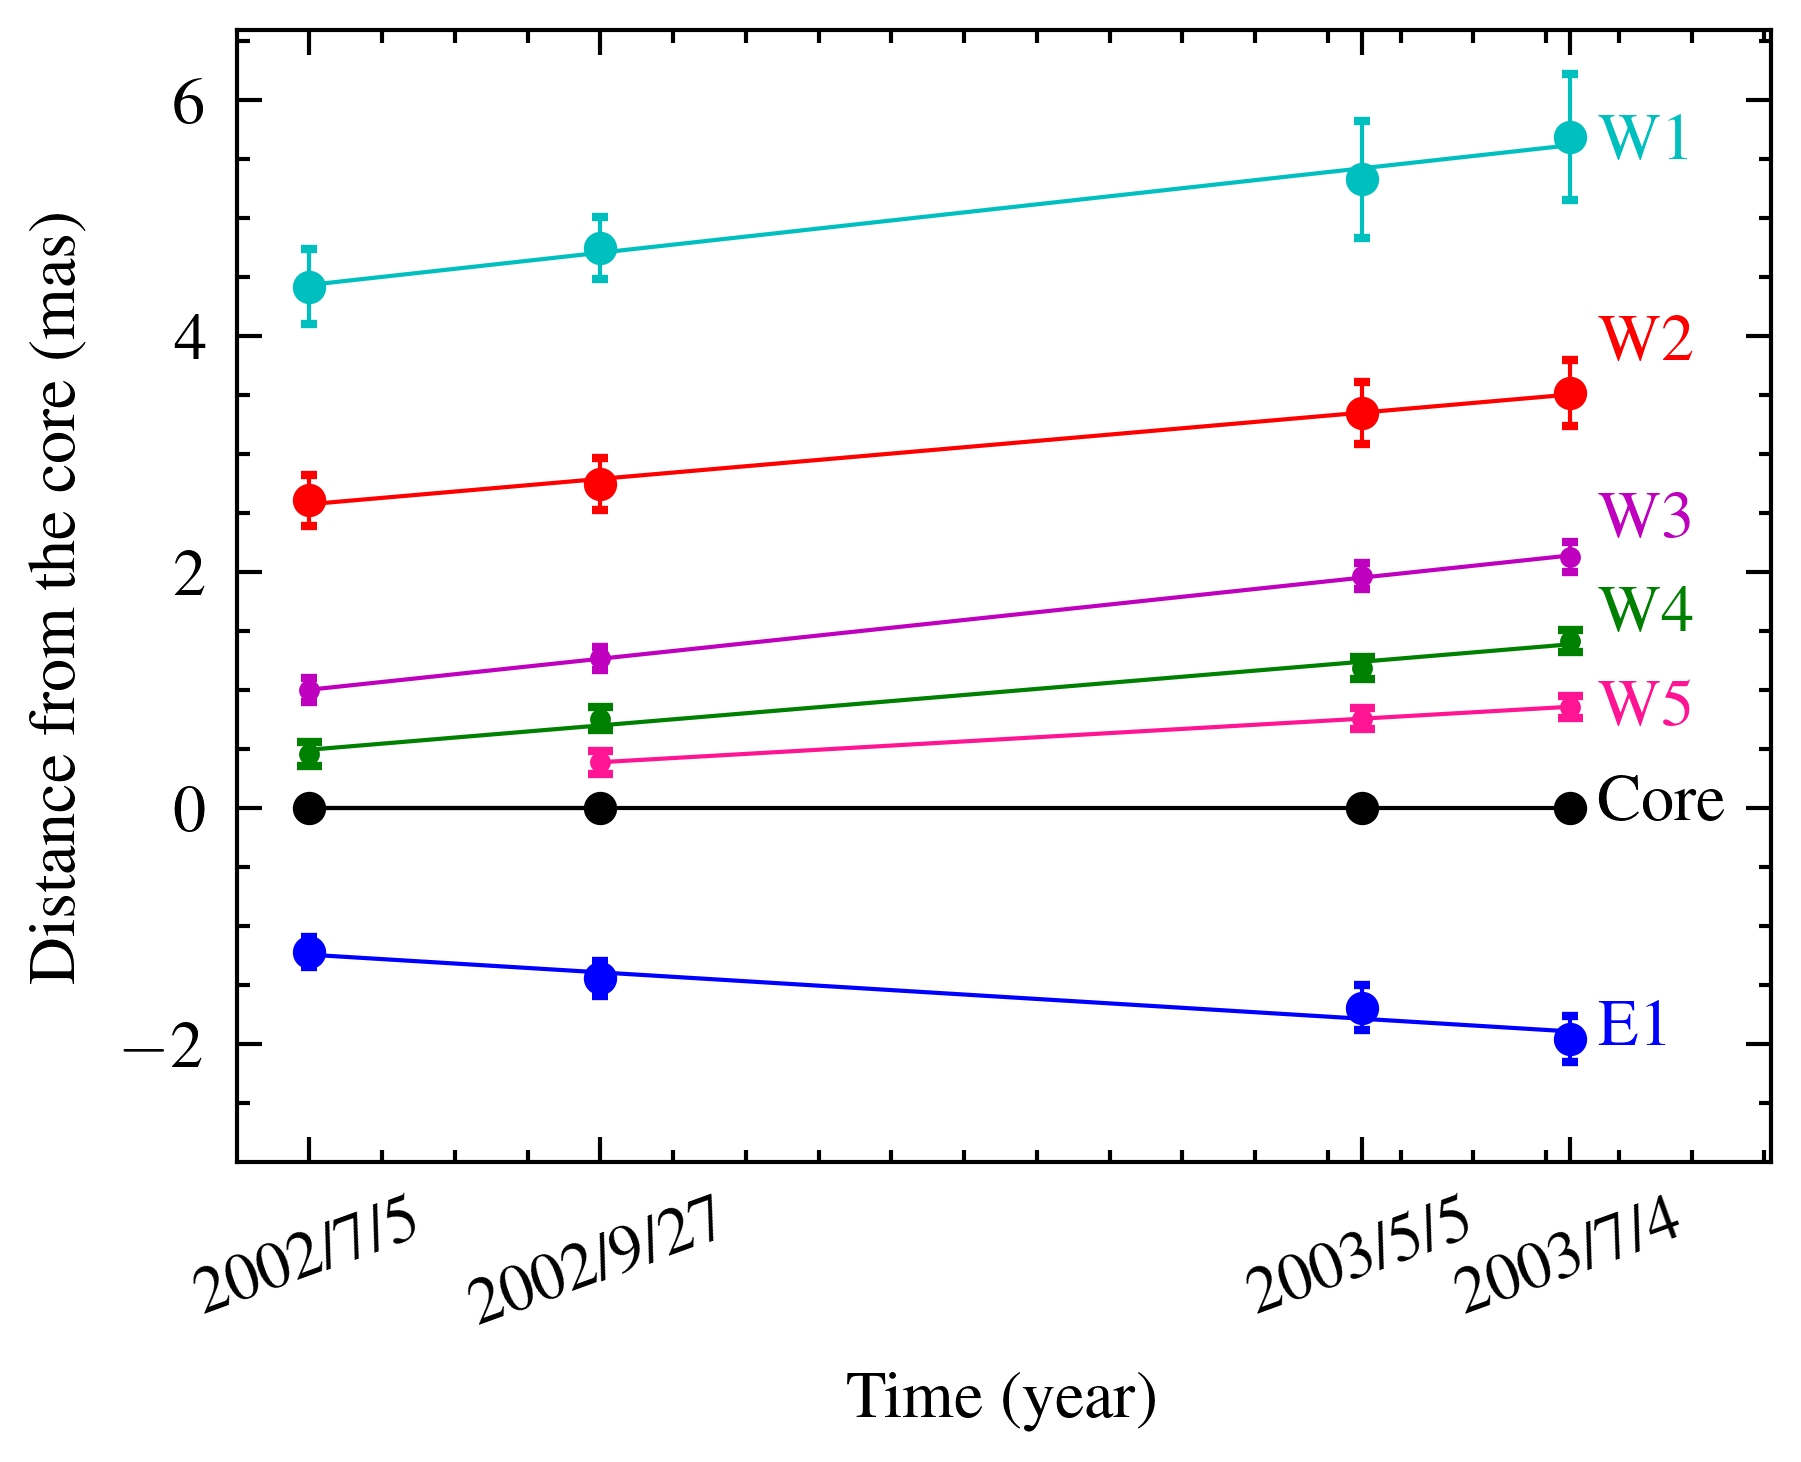
We performed kinematic analysis using the 15 GHz data. To model the source structure, we fitted several circular Gaussian models to the complex visibilities using the MODELFIT task in DIFMAP. Then the fitted components in the four epochs were cross-identified based on their location, flux density and size (Table 2). To align the images, we used the compact bright core component as the reference position (Figure 1). The error in the fitted parameters was determined by considering the local SNR in the image around each feature (Lee et al., 2008). For positional uncertainties smaller than one-fifth of the minor beam size, we adopted the latter as the error estimate.
3.2 Image analysis
To obtain the transverse structure of the jet, we measured the width of the double-sided jets. For the 15 GHz data, we used the stacked image created after convolving each individual image with a common beam. As for the 43 and 44 GHz data, we used the two individual images. Since the jet is almost along the east-west direction, we sliced the jet along PA= using the AIPS task SLICE and obtained a series of pixel-based transverse intensity profiles. Each transverse intensity profile was fitted with a Gaussian function to determine the full width at half maximum (FWHM), . Then we calculated the de-convolved jet width as , where is the resolution along PA=0. To obtain the radial profile of the jet width, we calculated the distance from the central engine to each slice location, taking into account the measured core-shift relation (Haga et al., 2015).
4 Results
4.1 Source morphology
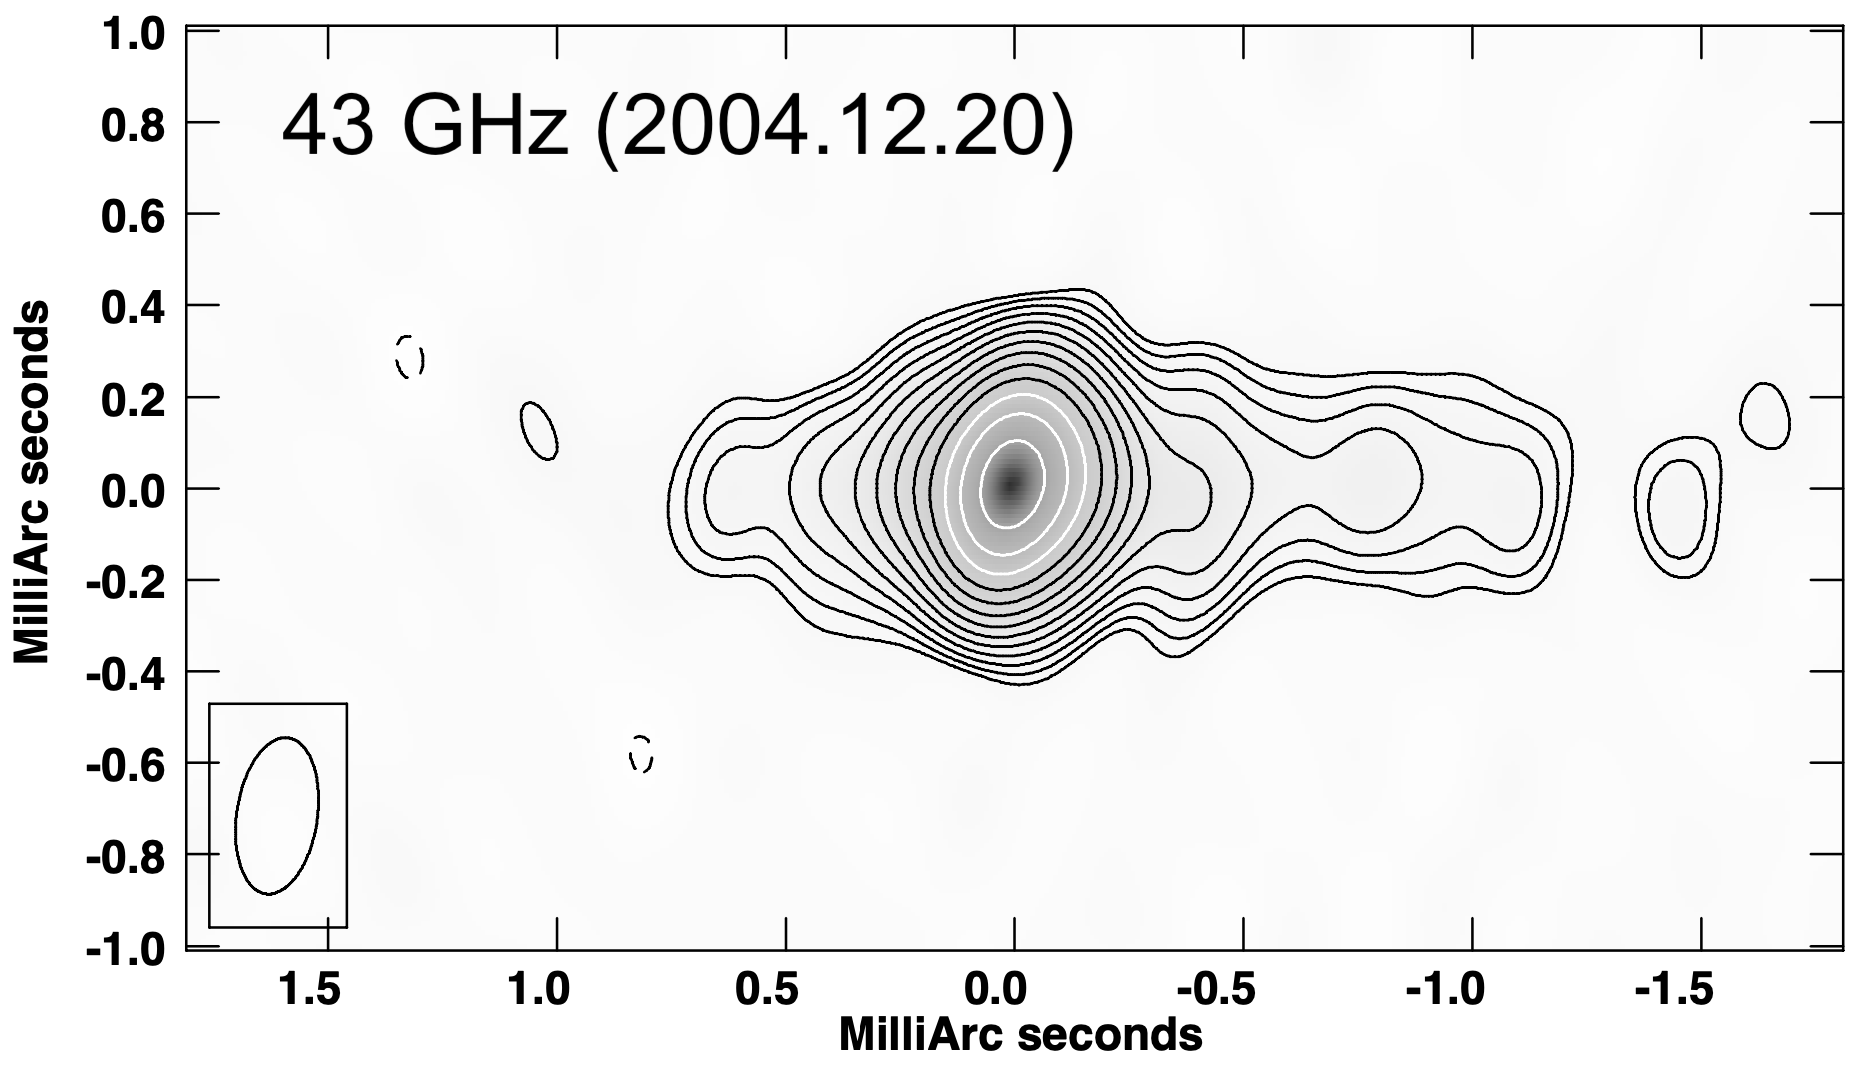
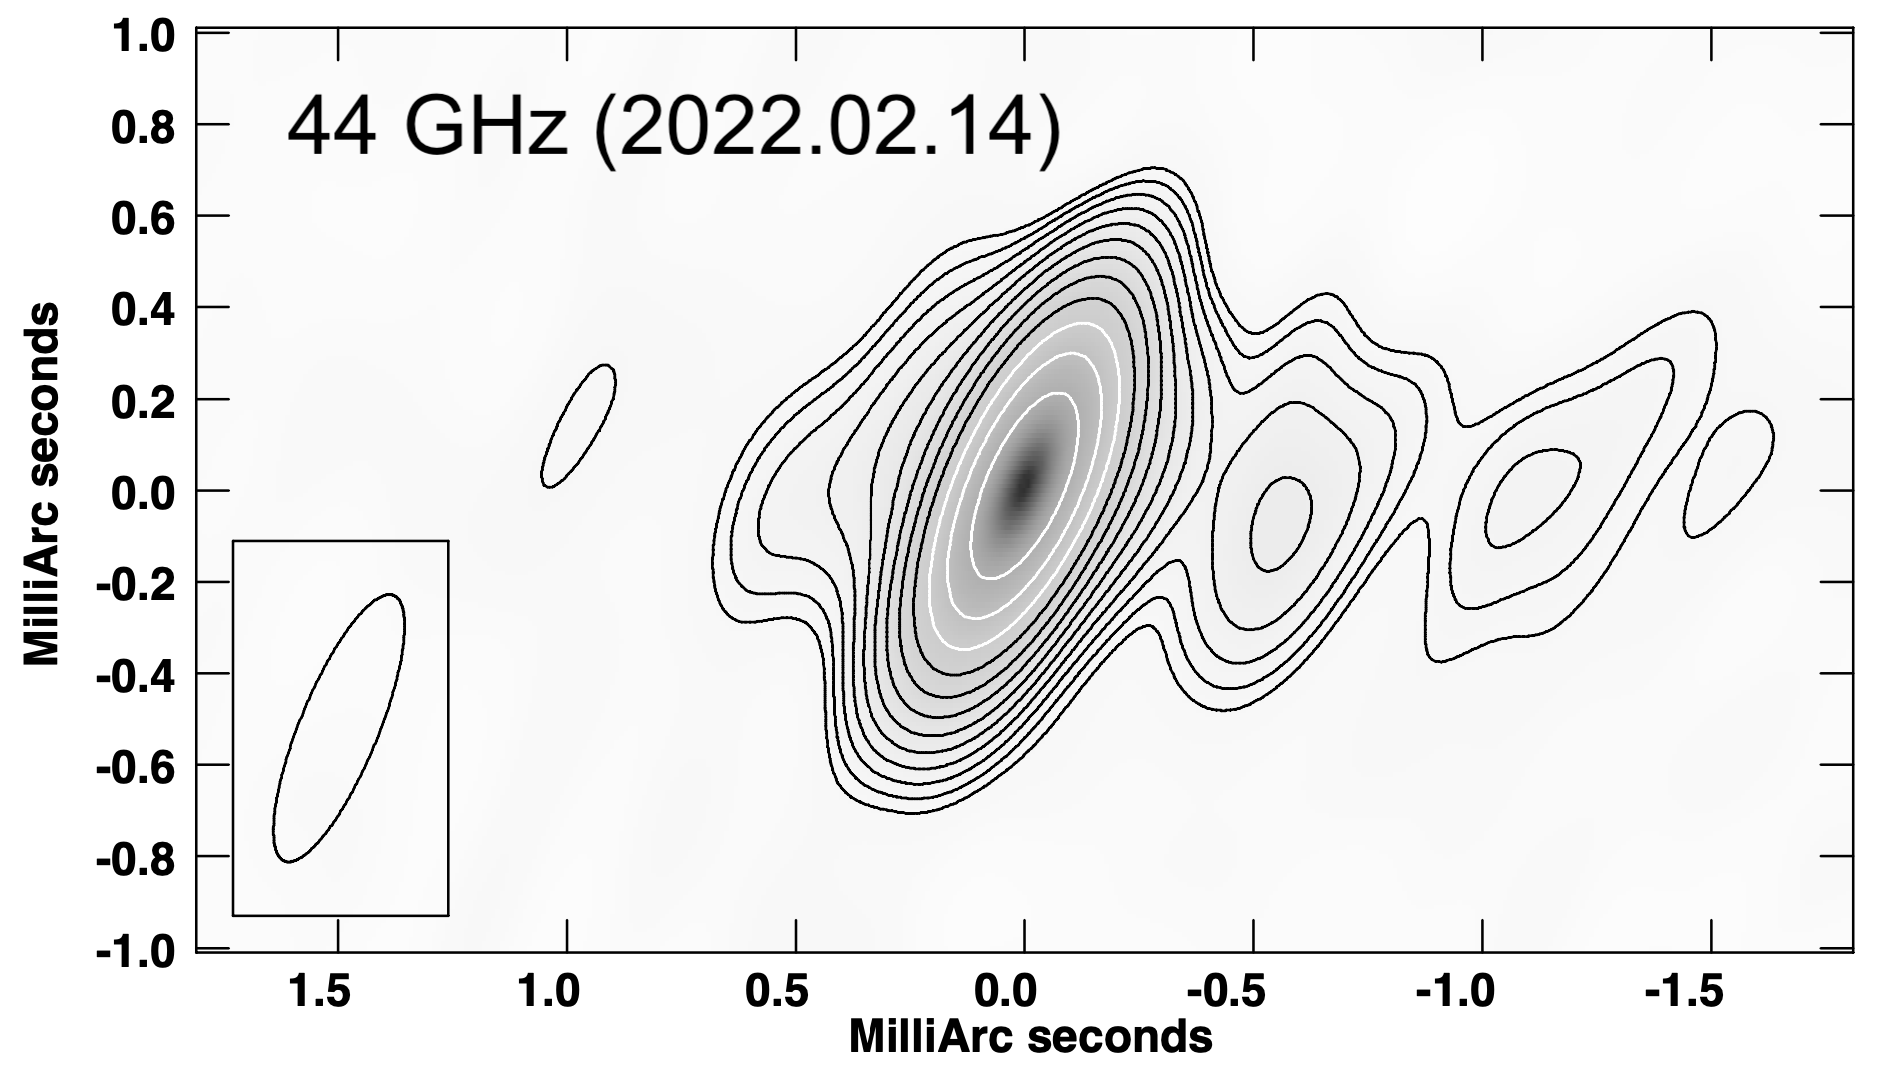
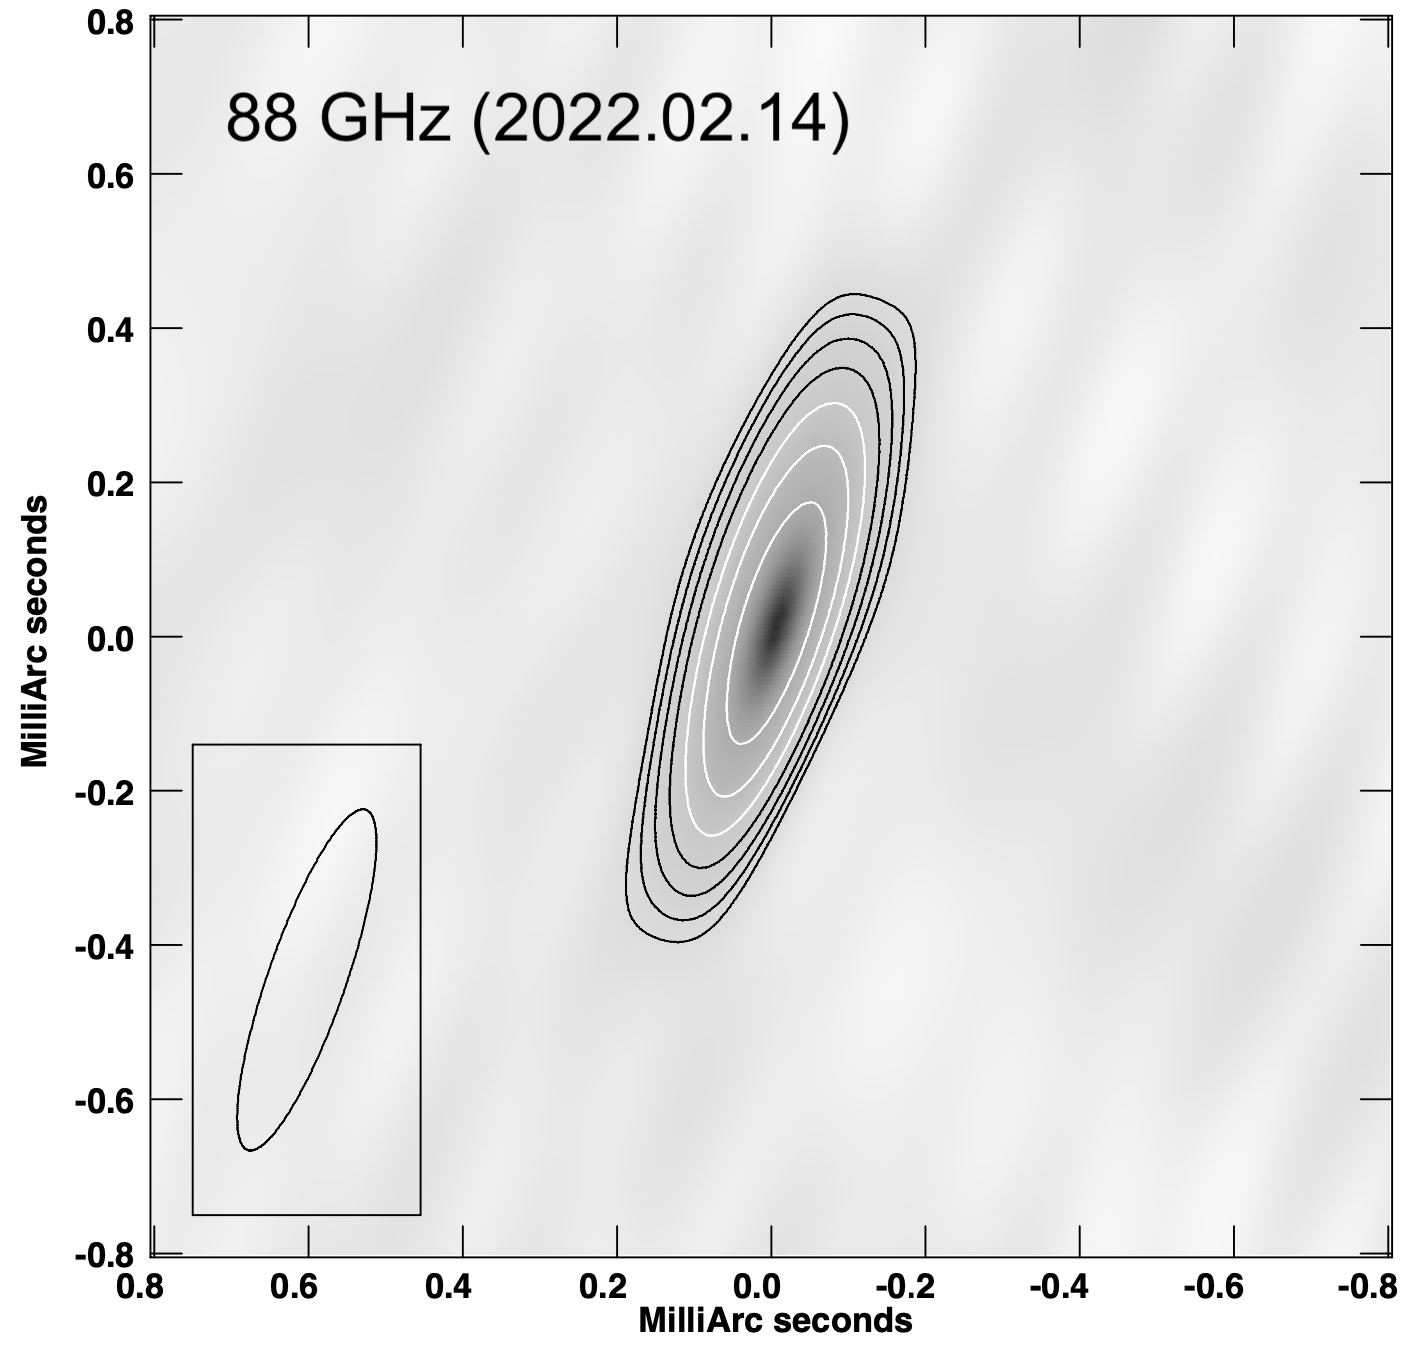
Figures 1 and 2 show the uniformly weighted CLEAN images of NGC 4261 jet observed at 15, 43, 44 and 88 GHz. Clearly two-sided jets were detected at 15, 43 and 44 GHz, with the western side representing the approaching jet and the eastern side representing the receding jet.
At 43 and 44 GHz, we observe a more extended structure compared to previous studies (Jones et al., 2000; Middelberg et al., 2005), although the apparent structure are slightly different due to the different beam shape. At 88 GHz, with an angular resolution of 0.4670.101 mas, we obtain a clear image of the nuclear structure on a scale as small as 100 . The derived size of the core is 0.09 mas, from which we estimate a brightness temperature () of K.
4.2 Jet kinematics
Figure 1 displays the measured proper motions of the NGC 4261 jet. We note that a new component (W5) was ejected between September 2002 and July 2003. By conducting linear fits to the radial distances from the core over time, we determined the apparent speeds of these features (see Figure 3 and Table 2). The measured apparent speeds in the approaching jet range from to and in the counter-jet is .
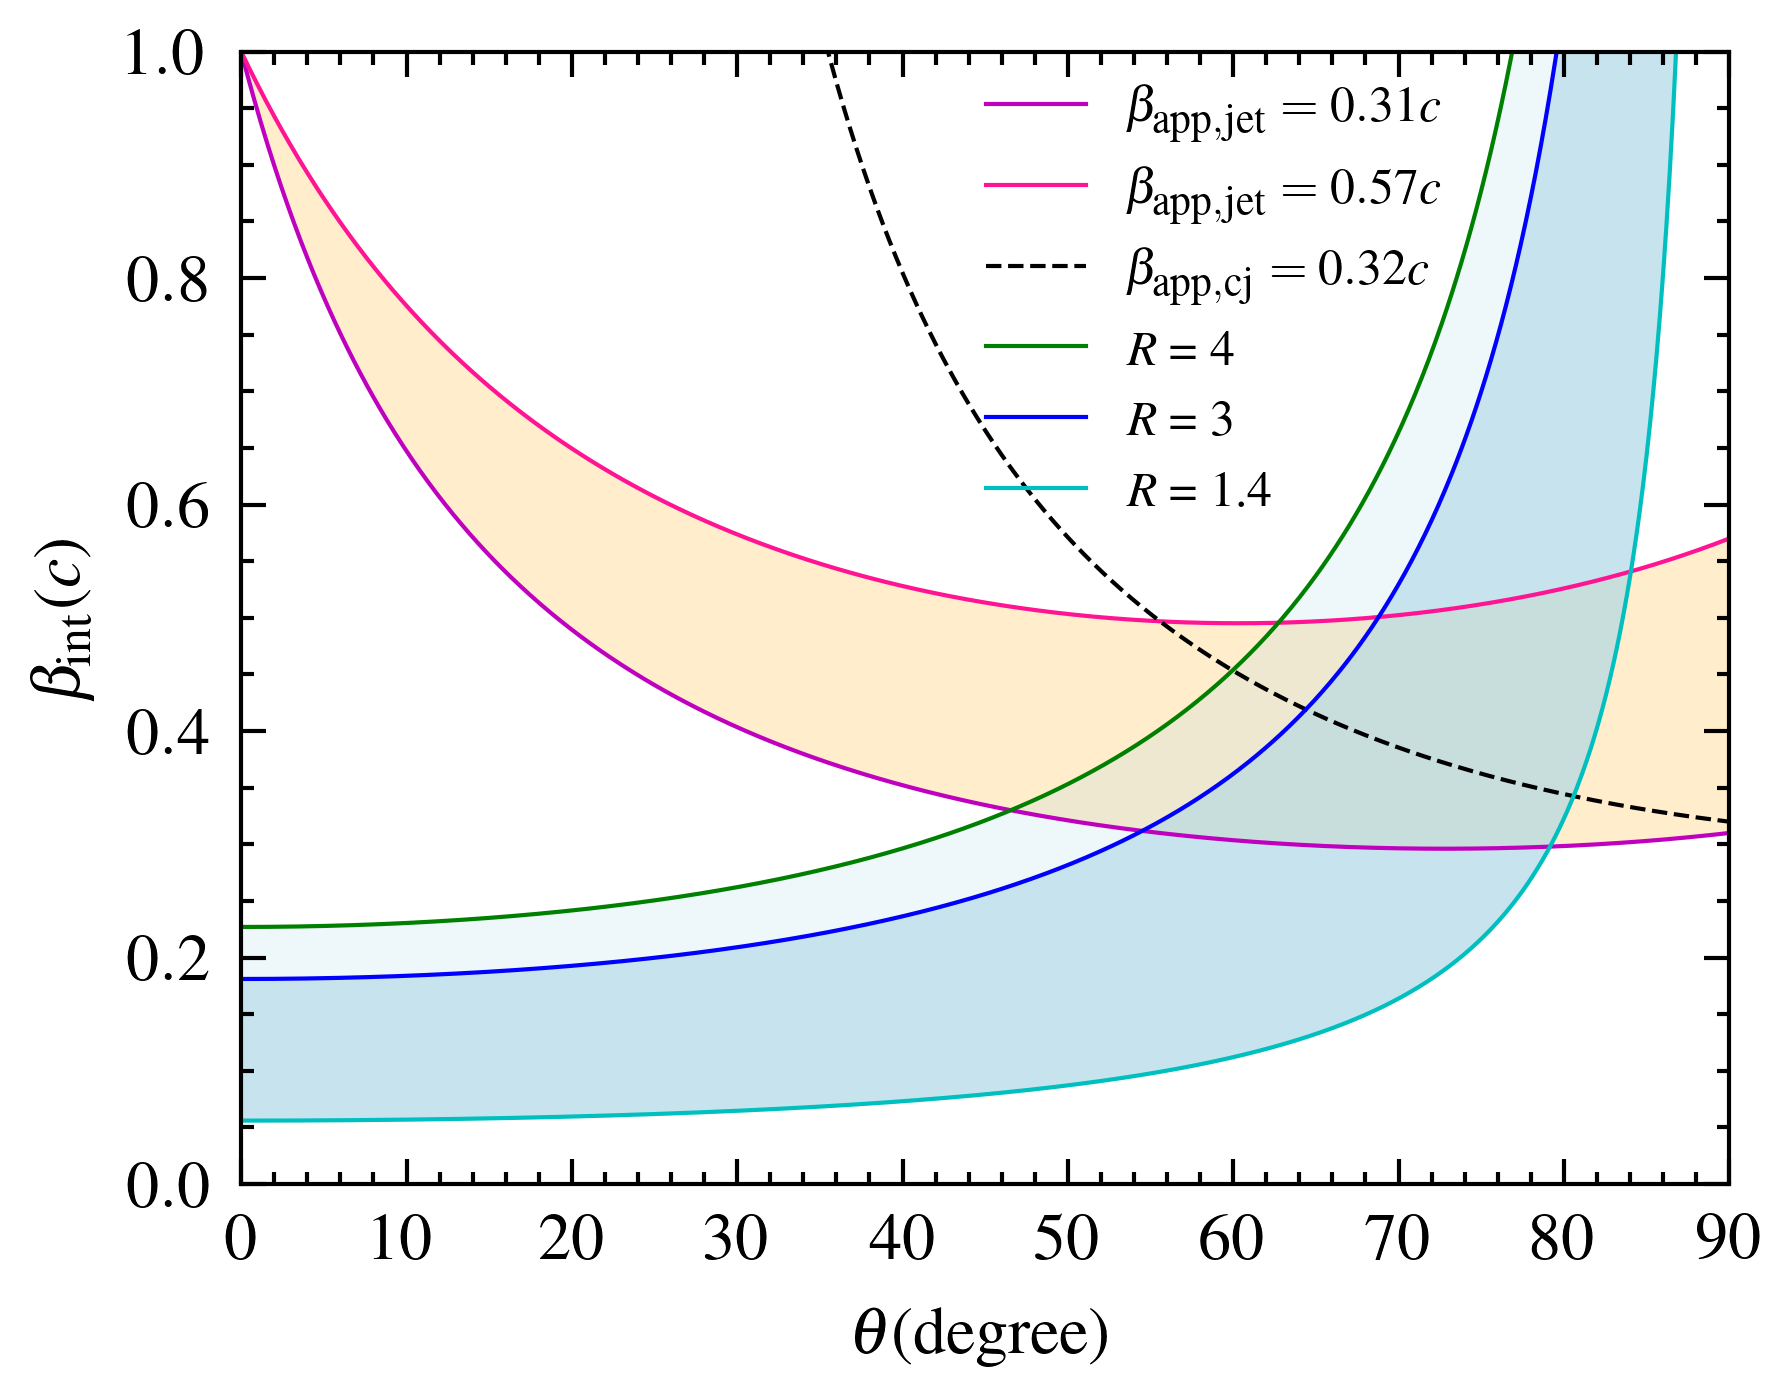
The intrinsic velocity () and the viewing angle () of the jet can be constrained using the apparent velocity () and the jet-to-counter-jet brightness ratio (). These relationships can be expressed by the following equations:
| (1) |
and
| (2) |
where and are in units of , and represents the spectral index of the jet (). We adopted based on the spectral index map from Haga et al. (2015).
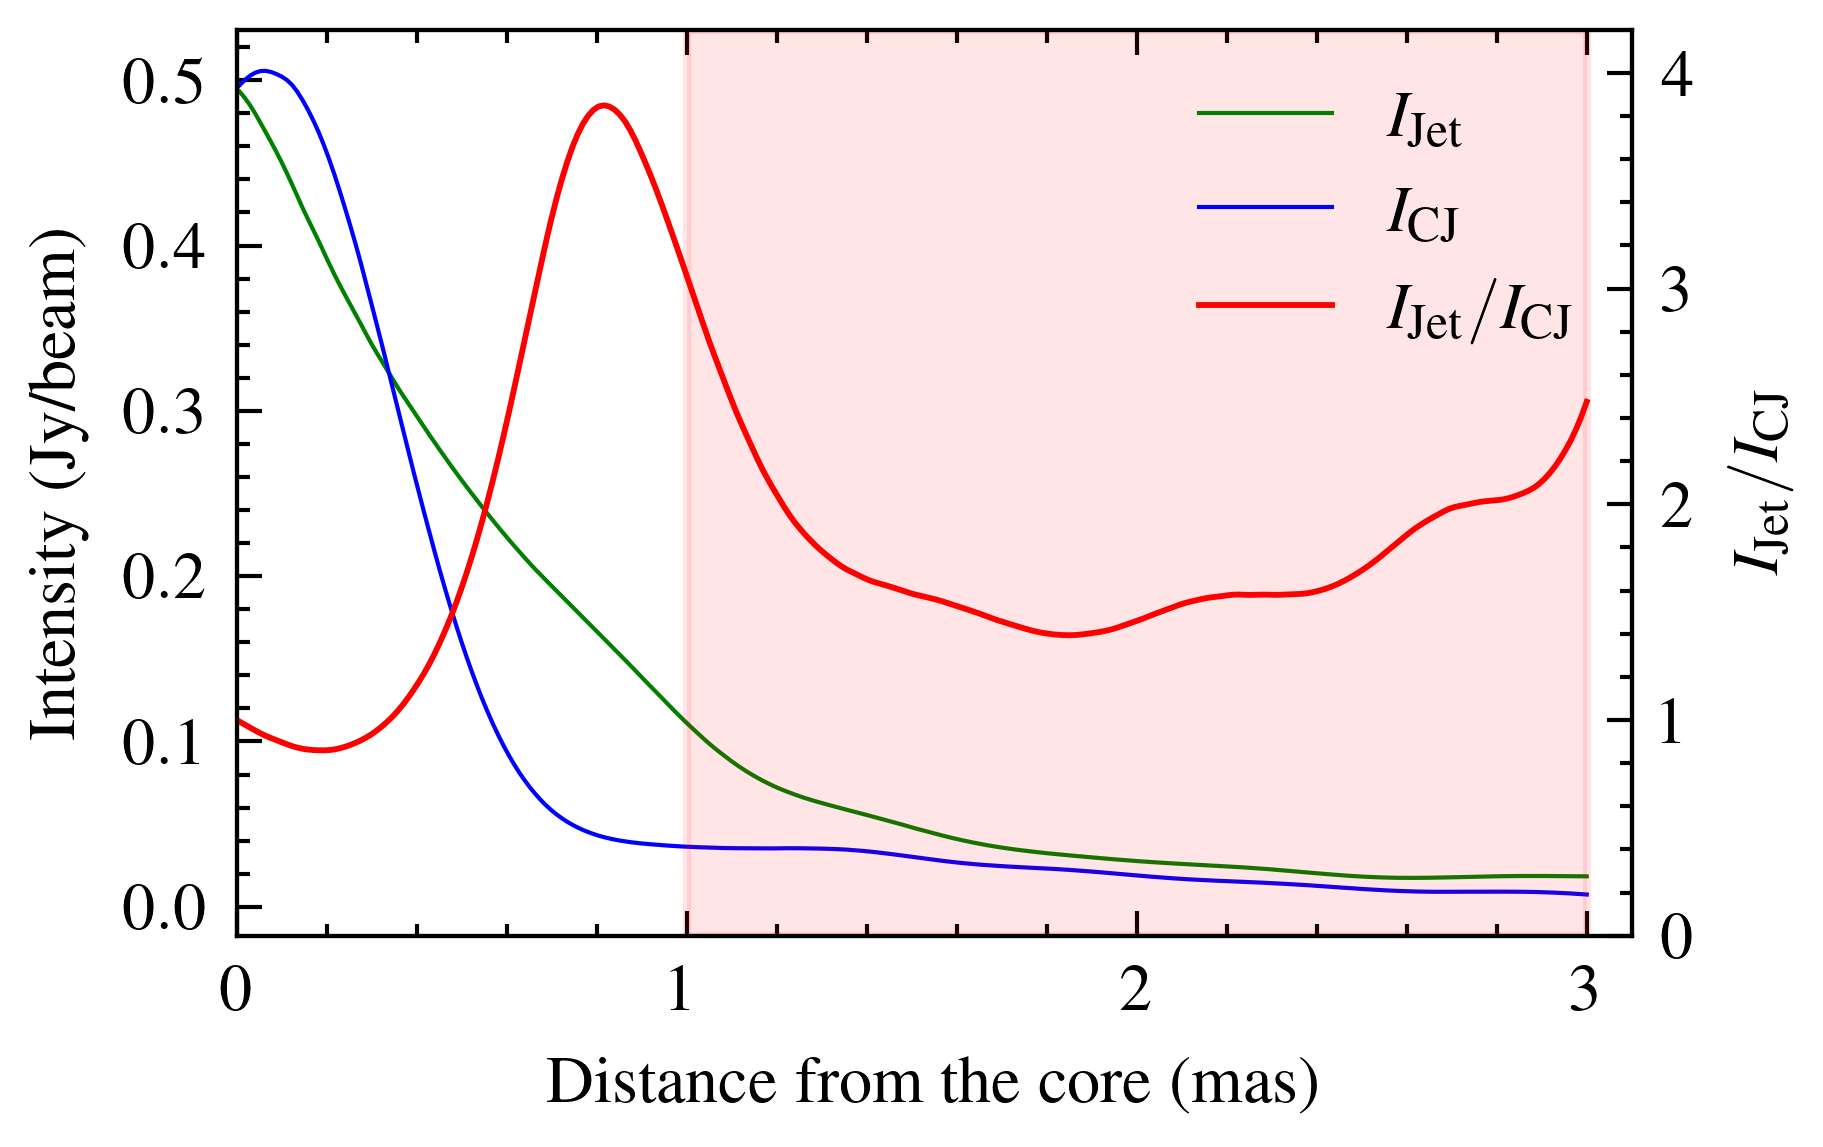
We determined the longitudinal intensity profile along the jet within 3 mas from the core in the stacked 15 GHz image for both the approaching and receding jet. As shown in the top panel of Figure 4, the brightness ratio varies from 1 to 4. In the same region, we measured the apparent speeds of the approaching jet, which range from 0.31 to 0.57 . By combining these values with the brightness ratios, we were able to constrain the viewing angle to be (Figure 4, bottom).
To measure the brightness ratio of the approaching jet to the receding jet, we excluded the core region to avoid possible biases. This is because the observed central bright core may suffer from blending effects between the base of the approaching and the receding jet, and the emission from the receding jet may also be absorbed by the accretion flow. In doing so, we employed two approaches. First, we excluded the innermost 1 mas region of the flow, which corresponds to twice the minor axis size of the restoring beam (see, e.g., Mertens et al., 2016). With this exclusion, the brightness ratio is between 1.4 and 3 (Figure 4, top). This range provides an estimate for the viewing angle of about to (Figure 4, bottom).
Alternatively, we calculated the brightness ratio by considering the clean components in each individual 15 GHz map. By placing two rectangular boxes of the same size and distance from the core on both sides of the jet, we obtained a brightness ratio ranging from 1.6 to 2. Additionally, both the 43 and 44 GHz maps also provided a brightness ratio of about . Overall, these results are all within the range of and point toward a very similar viewing angle range.
Notably, we also measured an apparent speed of 0.32 for the counter-jet at separations from 1 mas to 3 mas. As shown in the bottom panel of Figure 4, this apparent speed intersects with the lines given by the measured brightness ratio. These intersections provide a viewing angle range as well: from (for ) to (for ). This is highly consistent with the above analysis using the apparent speeds of the approaching jet. Considering all the above results, we obtain a conservative range of viewing angles from to and an intrinsic speed range from 0.30 to 0.55 .
4.3 The inner collimation profile
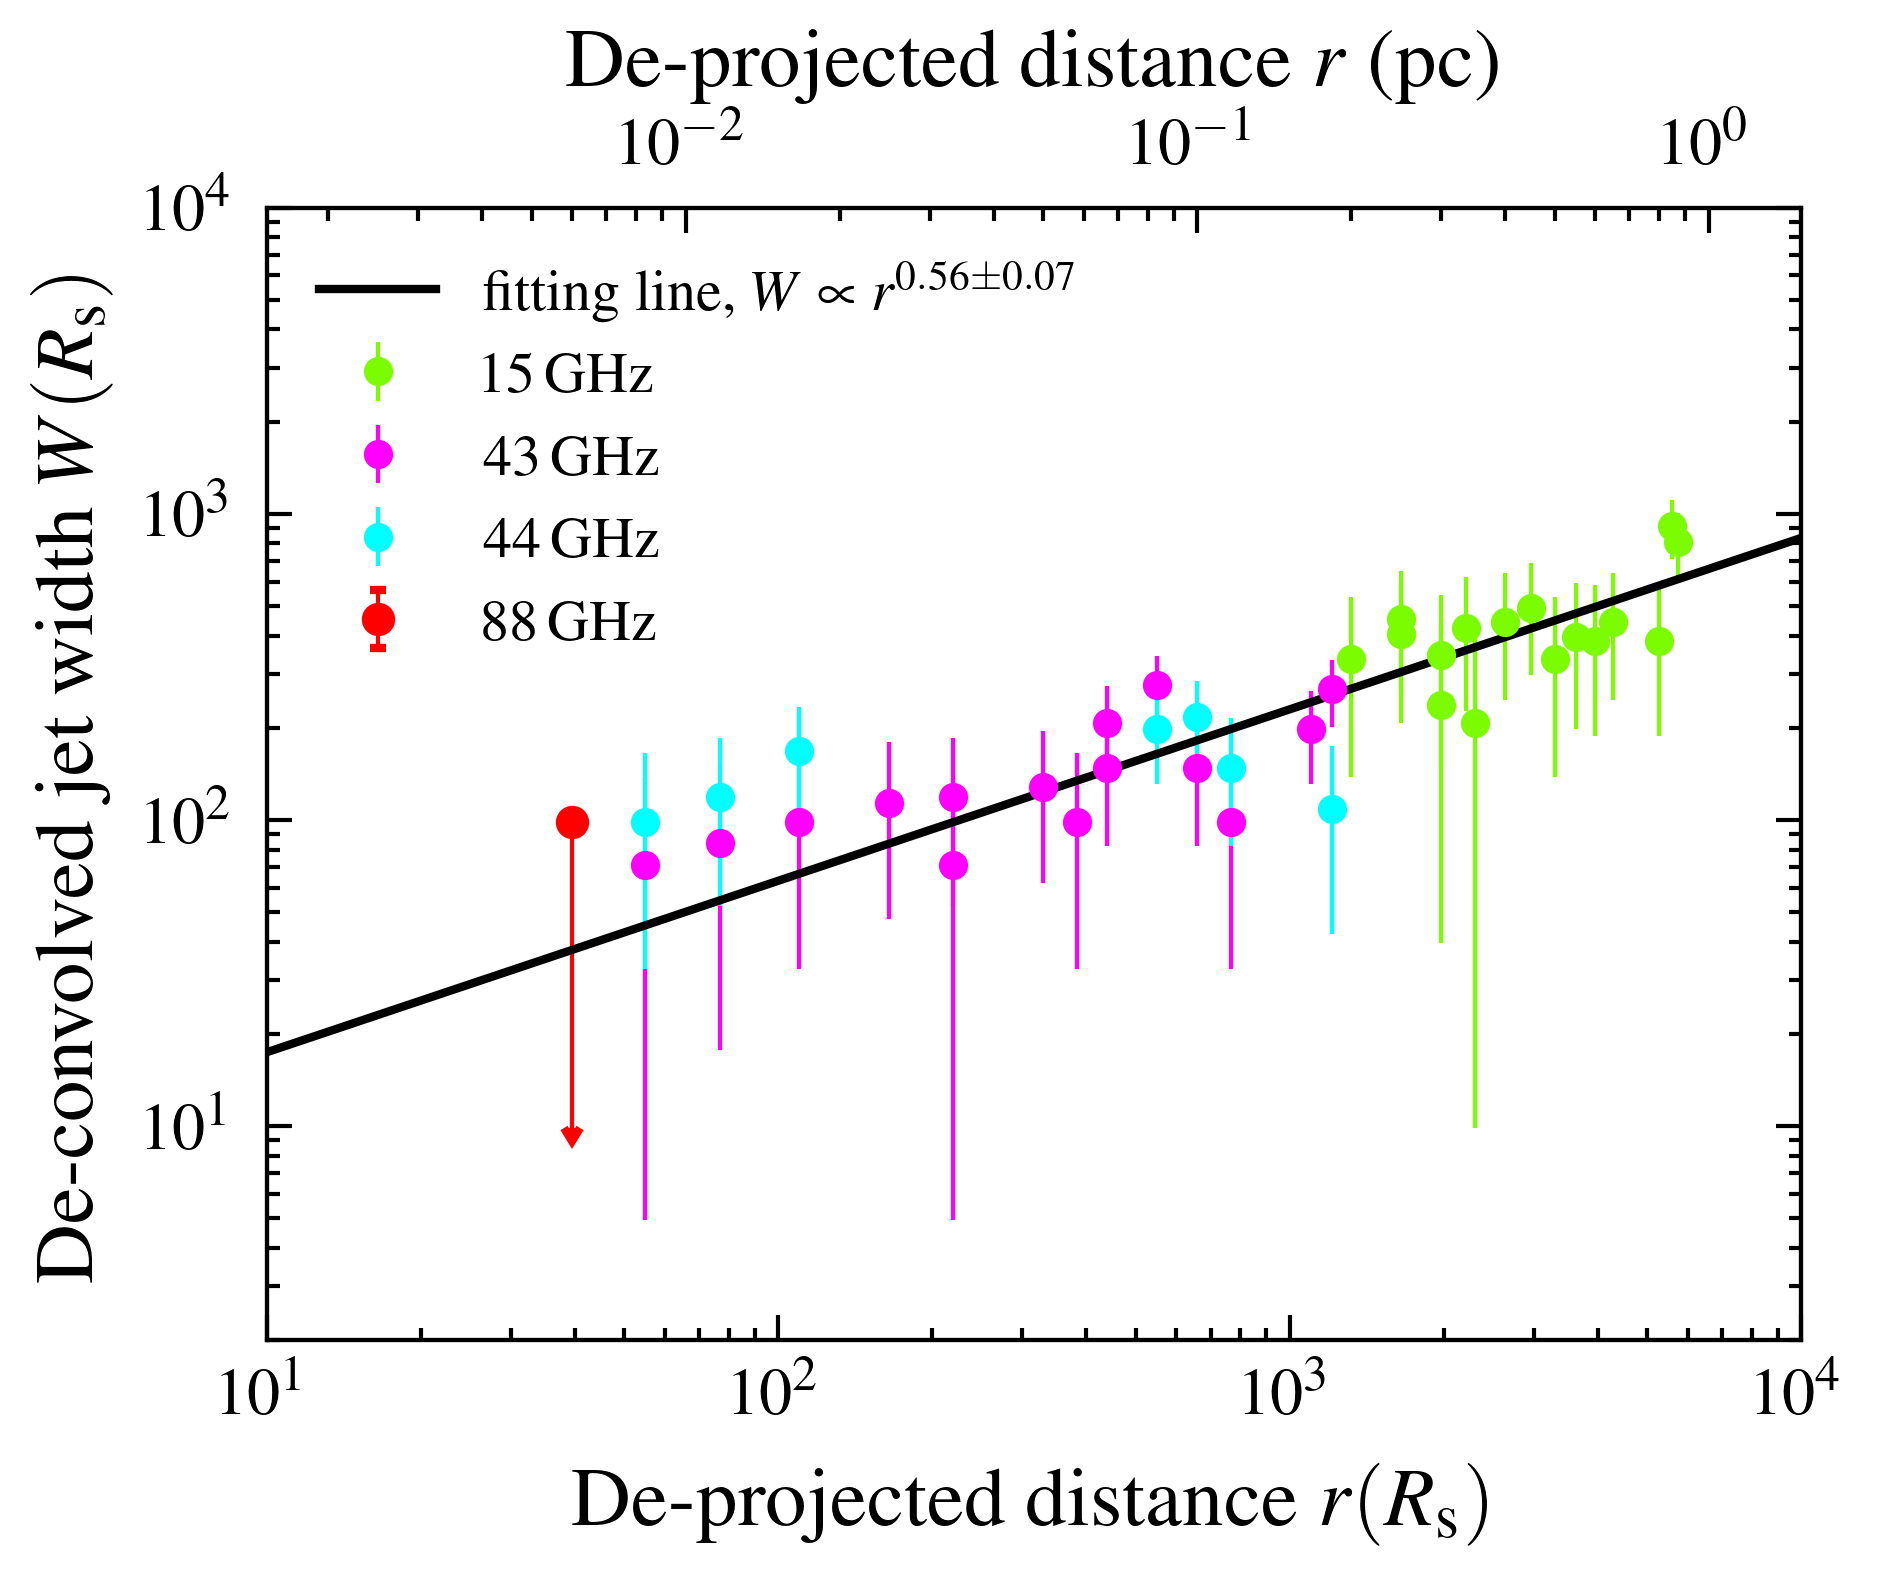
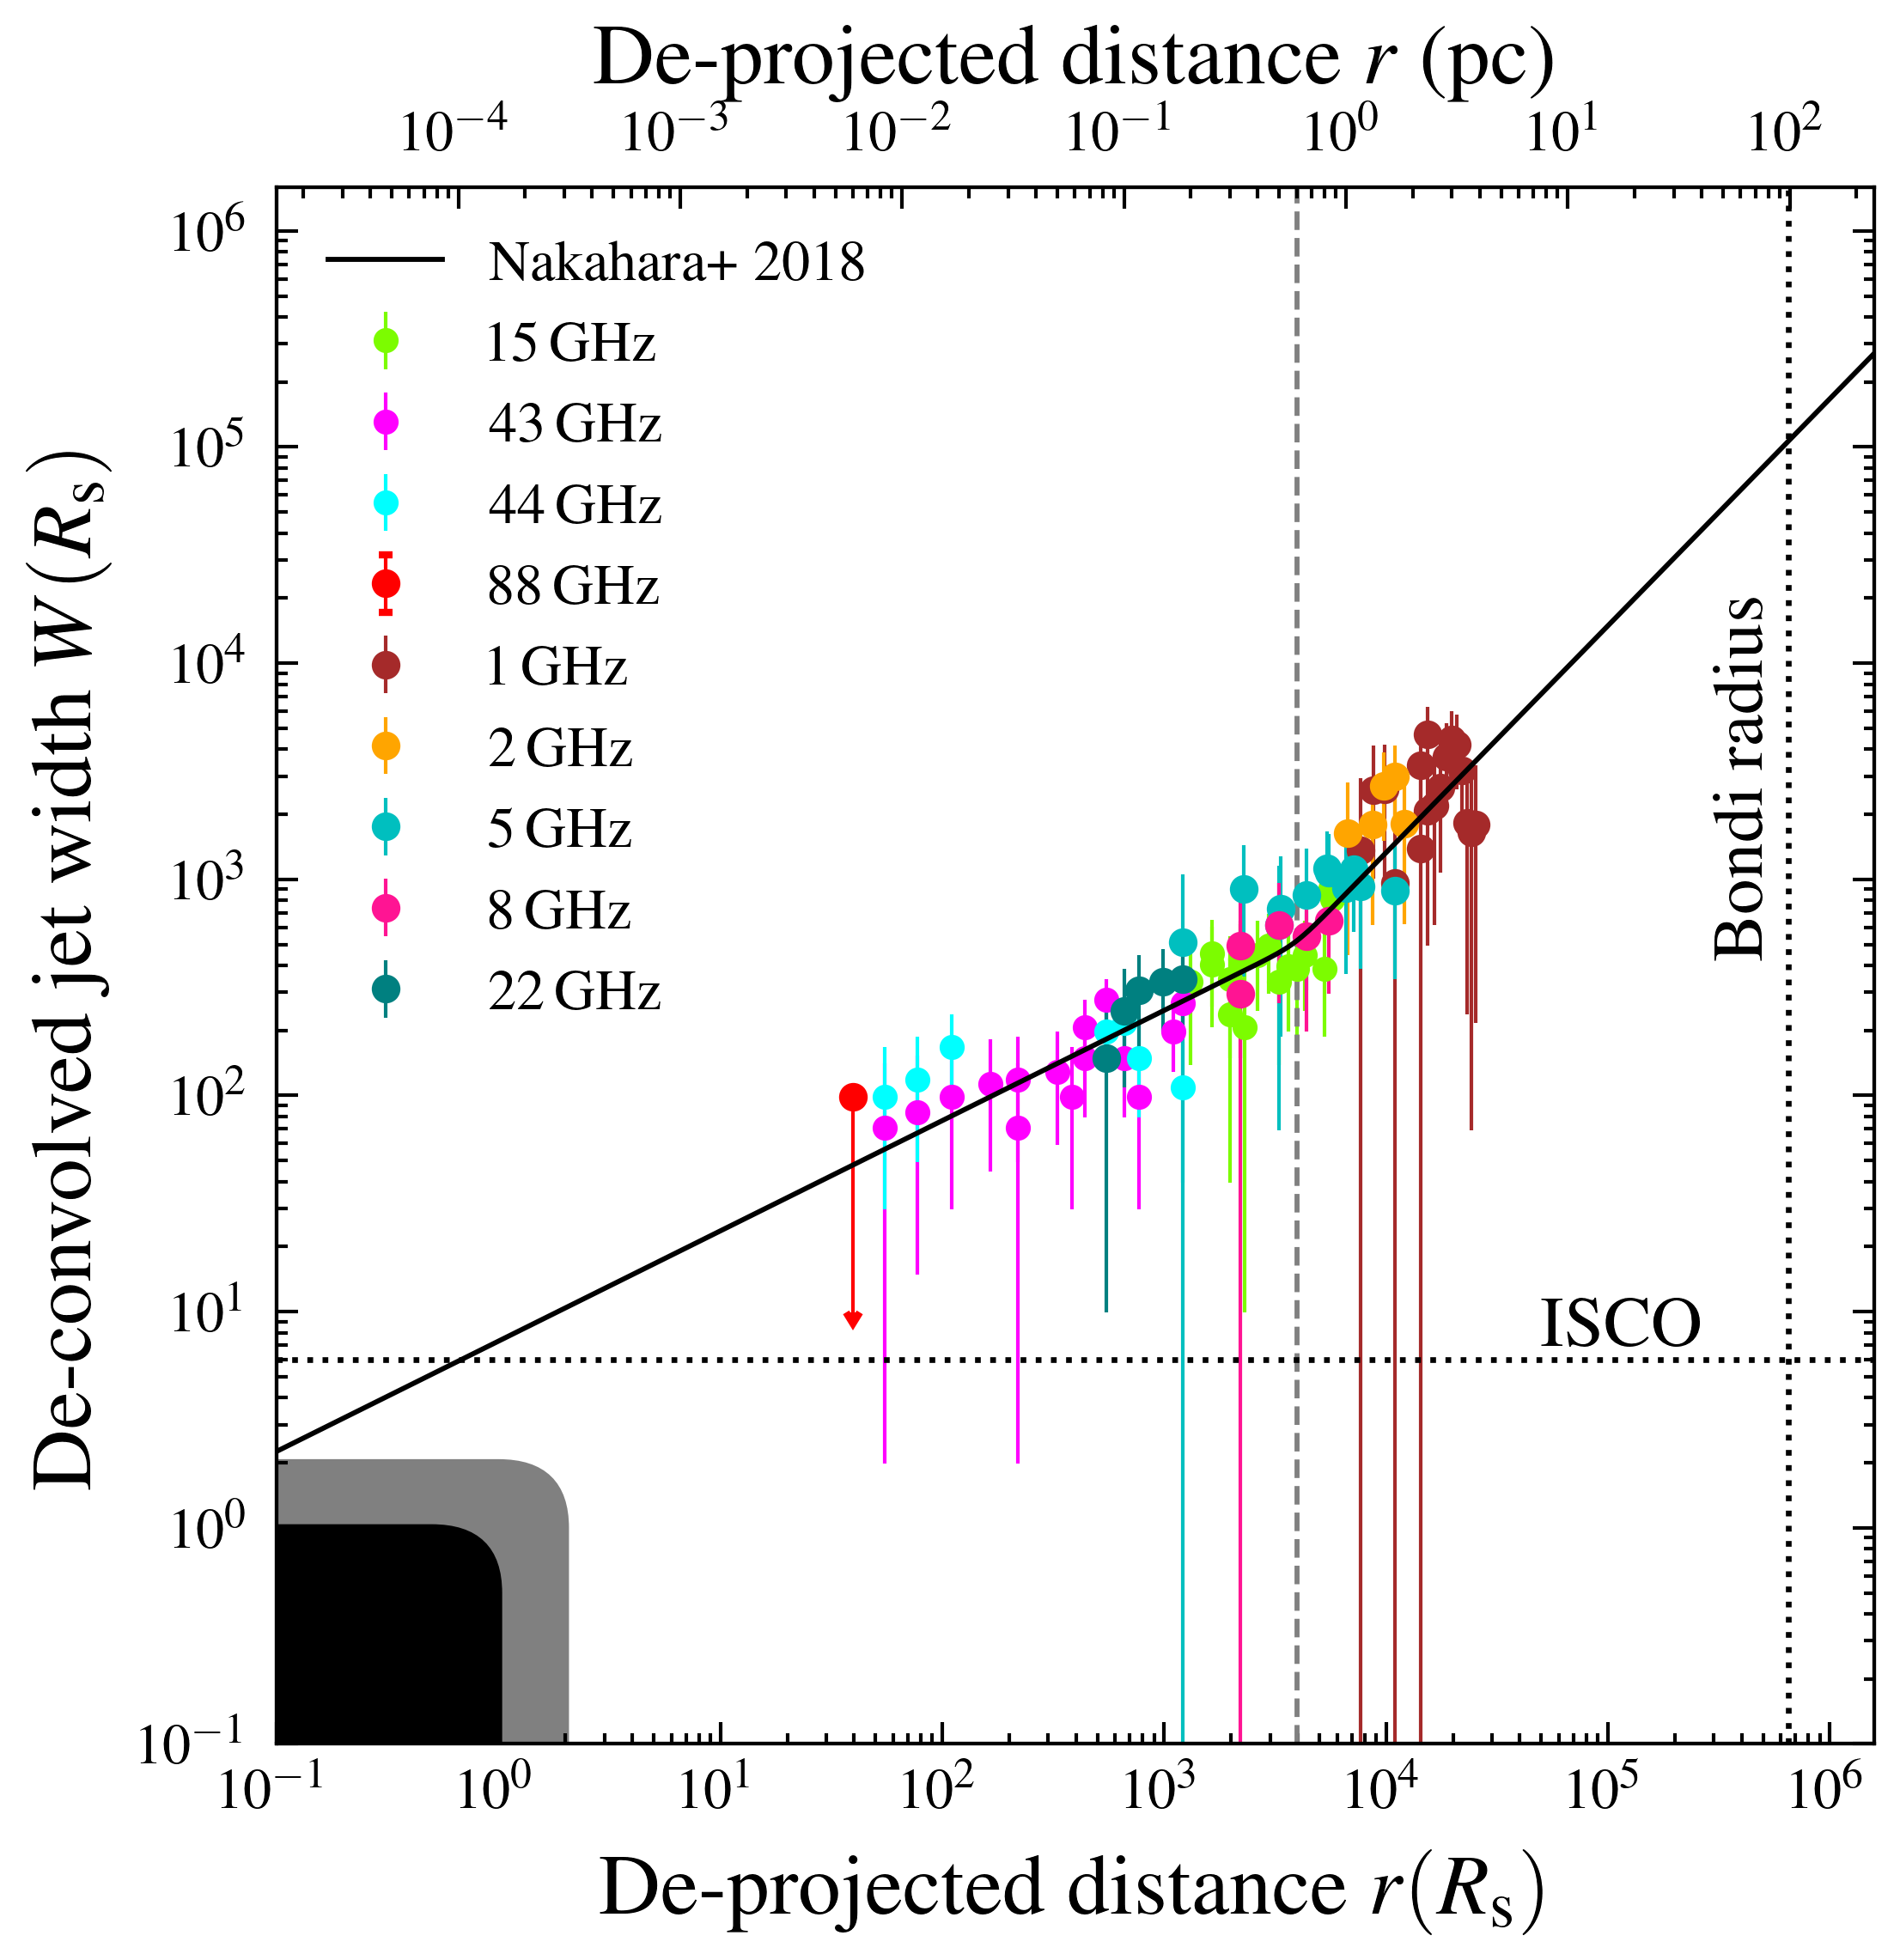
We analyzed the radial width profile of the upstream jet, including measurements at 15, 43 and 44 GHz (Section 3.2). We also considered the 88 GHz core size as an upper limit for the jet width and estimated its distance to the SMBH to be 0.036 mas based on the core-shift relation (Haga et al., 2015). All measurements were converted to the de-projected physical scales in units of .
In the top panel of Figure 5, we present the combined results obtained from both the approaching and the receding jet. The inner width profile exhibits a simple power-law relationship, with the form , where is the de-convolved jet width and denotes the de-projected distance from the black hole. This power-law relationship corresponds to a parabolic jet shape.
We also measured the width of the downstream jet based on previous multi-frequency (1.4, 2.3, 5.0, 8.4, and 22 GHz) VLBA observations Nakahara et al. (2018). We re-imaged the source and determined the jet width as in Section 3.2. The results are shown in the bottom panel of Figure 5. With these multi-frequency jet width measurements, the width profile clearly show a transition from parabolic to conical shape. We note that this transition is in good agreement with the broken power-law function fitted by Nakahara et al. (2018) (see their Eq.(1) and Table 2) 111We shifted the fitting line to account for the different black hole masses used in their study () and our study ().. We emphasize that the jet collimation is already completed at sub-parsec scales, with the transition location of 0.61 pc or being significantly smaller than the Bondi radius (99.2 pc or , Balmaverde et al., 2008) 222In their original paper, the calculated Bondi radius was 32 pc, based on a black hole mass of , which is 3.1 times smaller than the mass we used. Therefore, we adopted a Bondi radius of 99.2 pc (.).
5 Discussion
In this study, we presented the first multi-epoch kinematic analysis of the NGC 4261 jet. Previous studies by Piner et al. (2001) reported an apparent speed of mas/year at about 5–6 mas from the core based on two-epoch observations. By combining this value with the jet/counter-jet brightness ratio and the spectral index, they derived a jet viewing angle of . We found that the apparent jet speeds in our study are consistent with the previous results. The derived viewing angle by Piner et al. (2001) also falls within our constrained range. In addition, with the caveat that the measured proper motions should not be over-interpreted, the increase in the apparent speeds from 0.31 to 0.59 suggests that the jet may be undergoing acceleration. We note that this acceleration is observed on the sub-parsec scale (de-projected), largely coinciding with the jet collimation region. Future high-resolution and high-cadence observations will allow a more detailed study of this jet acceleration.
Compared to previous studies (Nakahara et al., 2018), we provide a more comprehensive examination of the innermost jet structure using the high-sensitivity data. We confirm that the innermost jet exhibits a parabolic shape. Notably, we found that the transition location of the width profile (0.61 pc or ) is significantly smaller than the corresponding Bondi radius (99.2 pc or ). Interestingly, this behavior is similar to that observed in the nearby radio source, NGC 315, where the jet transition location is also at a significantly smaller distance from the core than the Bondi radius (Boccardi et al., 2021; Park et al., 2021).
Similar to NGC 315, we propose that the shape transition in NGC 4261 is influenced by external pressure from the surrounding medium. Following the discussions on NGC 315 by Boccardi et al. (2021), we investigate potential sources of the external pressure in NGC 4261. One possibility is the ADAF itself. Previous observations and theoretical models have shown that the ADAF model is crucial in explaining the X-ray emission in NGC 4261 (Gliozzi et al., 2003; Nemmen et al., 2014). And it is also suggested that the ADAF is truncated by an outer thin disk at a location of (Gliozzi et al., 2003; Nemmen et al., 2014). Notably, this truncation location is comparable to the location of the jet shape transition. Therefore, the parabolic jet profile may be initially collimated by the thick ADAF itself.
Alternatively, the external pressure may be provided by a non-relativistic disk wind rather than the ADAF (e.g., Blandford & Globus, 2022). The disk wind is believed to originate from the ADAF, and its role in shaping the parabolic geometry has been studied in M 87 (e.g., Globus & Levinson, 2016; Nakamura et al., 2018). In the case of NGC 4261, considering reasonable conditions (Boccardi et al., 2021; Globus & Levinson, 2016), the wind may efficiently collimate and confine the jet.
On the other hand, the transition in the internal flow, from a magnetically dominated to a particle-dominated regime, could also account for the observed jet profile transition. A recent semi-analytical model proposed by Kovalev et al. (2020) supports this idea. According to their model, the jet profile transition can occur under the influence of a single power-law external pressure profile. Importantly, the location of the transition point in the profile is closely tied to the initial magnetization of the jet and can lie within the region well below the Bondi radius (see Figure 8 in Kovalev et al., 2020). Based on these, we propose that the initial confinement of the jet is also possibly due to the magnetic pressure that is dominated in a region far below the Bondi radius.
Lastly, it is interesting to note that the jet width in NGC 4261 appears to be comparable to that in M 87 on the same physical scales. This contradicts the previous findings by Nakahara et al. (2018), who found that jet width in NGC 4261 is much larger than that in M 87. However, this can be attributed to the use of a smaller black hole mass in their study.
6 Summary
In this paper, we presented multi-frequency VLBI studies of the kinematics and collimation of the two-sided jets in NGC 4261 on sub-parsec scales. Our findings are summarized as follows:
-
1.
We obtained VLBI images of NGC 4261 at 15, 43, 44 and 88 GHz. At 43 and 44 GHz, we observed a more extended double-sided structure compared to previous studies. At 88 GHz, we obtained a clear image of the nuclear structure at a scale as small as 100 . We found the core size at 88 GHz is 0.09 mas and the brightness temperature is K.
-
2.
We measured proper motions in both the approaching and receding jets on sub-parsec scales. The measured apparent speeds in the approaching jet range from to . The increase in apparent speeds with distance from the core suggests an acceleration of the jet, which will need to be confirmed by future observations. Furthermore, we also observed a jet speed of in the counter-jet.
-
3.
Using the measured apparent velocity and the jet-to-counter-jet brightness ratio, we constrained the jet viewing angle to between and . We also found that the intrinsic speed is between and . Combining these results with the jet collimation profile suggests that the jet acceleration region possibly coincides with the jet collimation region.
-
4.
We found a parabolic shape for the upstream jet on both sides, described by . We emphasize that the jet collimation is already completed at sub-parsec scales. Combining our findings with previous studies, we found that the transition location of the jet structure (0.61 pc or ) is significantly smaller than the corresponding Bondi radius (99.2 pc or ). This behavior is similar to what has been observed in NGC 315. Like NGC 315, we interpret this behavior as the initial confinement of the jet by the external pressure exerted by either the geometrically thick, optically thin ADAF or the disk wind launched from it. Alternatively, the shape transition may also be explained by the internal flow transition from a magnetically dominated to a particle-dominated regime.
References
- Asada & Nakamura (2012) Asada, K., & Nakamura, M. 2012, ApJ, 745, L28, doi: 10.1088/2041-8205/745/2/L28
- Balmaverde et al. (2008) Balmaverde, B., Baldi, R. D., & Capetti, A. 2008, A&A, 486, 119, doi: 10.1051/0004-6361:200809810
- Blandford & Globus (2022) Blandford, R., & Globus, N. 2022, MNRAS, 514, 5141, doi: 10.1093/mnras/stac1682
- Blandford & Payne (1982) Blandford, R. D., & Payne, D. G. 1982, MNRAS, 199, 883, doi: 10.1093/mnras/199.4.883
- Blandford & Znajek (1977) Blandford, R. D., & Znajek, R. L. 1977, MNRAS, 179, 433, doi: 10.1093/mnras/179.3.433
- Boccardi et al. (2021) Boccardi, B., Perucho, M., Casadio, C., et al. 2021, A&A, 647, A67, doi: 10.1051/0004-6361/202039612
- Boizelle et al. (2021) Boizelle, B. D., Walsh, J. L., Barth, A. J., et al. 2021, ApJ, 908, 19, doi: 10.3847/1538-4357/abd24d
- Gliozzi et al. (2003) Gliozzi, M., Sambruna, R. M., & Brandt, W. N. 2003, A&A, 408, 949, doi: 10.1051/0004-6361:20031050
- Globus & Levinson (2016) Globus, N., & Levinson, A. 2016, MNRAS, 461, 2605, doi: 10.1093/mnras/stw1474
- Greisen (2003) Greisen, E. W. 2003, in Astrophysics and Space Science Library, Vol. 285, Information Handling in Astronomy - Historical Vistas, ed. A. Heck, 109, doi: 10.1007/0-306-48080-8_7
- Haga et al. (2015) Haga, T., Doi, A., Murata, Y., et al. 2015, ApJ, 807, 15, doi: 10.1088/0004-637X/807/1/15
- Jiang et al. (2021) Jiang, W., Shen, Z., Martí-Vidal, I., et al. 2021, ApJ, 922, L16, doi: 10.3847/2041-8213/ac375c
- Jones & Wehrle (1997) Jones, D. L., & Wehrle, A. E. 1997, ApJ, 484, 186, doi: 10.1086/304320
- Jones et al. (2000) Jones, D. L., Wehrle, A. E., Meier, D. L., & Piner, B. G. 2000, ApJ, 534, 165, doi: 10.1086/308751
- Kovalev et al. (2020) Kovalev, Y. Y., Pushkarev, A. B., Nokhrina, E. E., et al. 2020, MNRAS, 495, 3576, doi: 10.1093/mnras/staa1121
- Lee et al. (2008) Lee, S.-S., Lobanov, A. P., Krichbaum, T. P., et al. 2008, AJ, 136, 159, doi: 10.1088/0004-6256/136/1/159
- Lu et al. (2023) Lu, R.-S., Asada, K., Krichbaum, T. P., et al. 2023, Nature, 616, 686, doi: 10.1038/s41586-023-05843-w
- McKinney (2006) McKinney, J. C. 2006, MNRAS, 368, 1561, doi: 10.1111/j.1365-2966.2006.10256.x
- McKinney et al. (2012) McKinney, J. C., Tchekhovskoy, A., & Blandford, R. D. 2012, MNRAS, 423, 3083, doi: 10.1111/j.1365-2966.2012.21074.x
- Mertens et al. (2016) Mertens, F., Lobanov, A. P., Walker, R. C., & Hardee, P. E. 2016, A&A, 595, A54, doi: 10.1051/0004-6361/201628829
- Middelberg (2004) Middelberg, E. 2004, Gas Around Active Galactic Nuclei and New Phase Calibration Strategies for High-Frequency VLBI. https://arxiv.org/abs/astro-ph/0404583
- Middelberg et al. (2005) Middelberg, E., Roy, A. L., Walker, R. C., & Falcke, H. 2005, A&A, 433, 897, doi: 10.1051/0004-6361:20042078
- Nakahara et al. (2018) Nakahara, S., Doi, A., Murata, Y., et al. 2018, ApJ, 854, 148, doi: 10.3847/1538-4357/aaa45e
- Nakahara et al. (2020) —. 2020, AJ, 159, 14, doi: 10.3847/1538-3881/ab465b
- Nakamura et al. (2018) Nakamura, M., Asada, K., Hada, K., et al. 2018, ApJ, 868, 146, doi: 10.3847/1538-4357/aaeb2d
- Nemmen et al. (2014) Nemmen, R. S., Storchi-Bergmann, T., & Eracleous, M. 2014, MNRAS, 438, 2804, doi: 10.1093/mnras/stt2388
- Park et al. (2021) Park, J., Hada, K., Nakamura, M., et al. 2021, ApJ, 909, 76, doi: 10.3847/1538-4357/abd6ee
- Piner et al. (2001) Piner, B. G., Jones, D. L., & Wehrle, A. E. 2001, AJ, 122, 2954, doi: 10.1086/323927
- Rioja & Dodson (2011) Rioja, M., & Dodson, R. 2011, AJ, 141, 114, doi: 10.1088/0004-6256/141/4/114
- Ruffa et al. (2023) Ruffa, I., Davis, T. A., Cappellari, M., et al. 2023, MNRAS, 522, 6170, doi: 10.1093/mnras/stad1119
- Shepherd (1997) Shepherd, M. C. 1997, in Astronomical Society of the Pacific Conference Series, Vol. 125, Astronomical Data Analysis Software and Systems VI, ed. G. Hunt & H. Payne, 77
- Tchekhovskoy et al. (2011) Tchekhovskoy, A., Narayan, R., & McKinney, J. C. 2011, MNRAS, 418, L79, doi: 10.1111/j.1745-3933.2011.01147.x
- Tonry et al. (2001) Tonry, J. L., Dressler, A., Blakeslee, J. P., et al. 2001, ApJ, 546, 681, doi: 10.1086/318301
- Tseng et al. (2016) Tseng, C.-Y., Asada, K., Nakamura, M., et al. 2016, ApJ, 833, 288, doi: 10.3847/1538-4357/833/2/288