Statistics of the cuprate pairon states on a square lattice
Résumé
In this paper the fundamental parameters of high- superconductivity are shown to be connected to the statistics of pairons (hole pairs in their antiferromagnetic environment) on a square lattice. In particular, we study the density fluctuations and the distribution of the area surrounding each pairon on the scale of the antiferromagnetic correlation length , for the complete range of hole concentration. We show that the key parameters of the phase diagram, the dome, and the pseudogap temperature , emerge from the statistical properties of the pairon disordered state. In this approach, the superconducting and the pseudogap states appear as inseparable phenomena. The condensation energy, which fixes the critical temperature, is directly proportional to the correlation energy between pairons and not to the energy gap, contrary to conventional superconductors.
When the correlation energy between pairons is suppressed by fluctuations, either thermally, by disorder, or in the vortex core, the pseudogap state of disordered pairons is obtained. We attribute the unique features of cuprate superconductivity to this order-disorder transition in real space, which clearly differs from the BCS mechanism. Our predictions are in quantitative agreement with low-temperature tunneling and photoemission spectroscopy experiments.
pacs:
74.72.h,74.20.Mn,74.20.Fgpacs:
74.72.h,74.20.Mn,74.20.FgI Introduction
Discovered more than 30 years ago by Bednorz and Müller [1], high- superconductivity arises in the cuprate family with critical temperatures going up to 135 K. The large variety of compounds have in common the CuO square lattice which is now accepted to be the active layer where superconductivity takes place. Despite the wide range of [2], there is a striking universality in the phase diagram of the various materials. Indeed, as first noted by Tahir-Kheli et al. [3], the characteristic doping points of the -dome are essentially material independent. This fact strongly suggests that a simple mechanism, directly related to the properties of the CuO planes, governs the superconducting phase transition and the key aspects of the physics of cuprates.
In a previous article, using a statistical approach, we showed that the phase diagram of cuprates is dictated by the topological constraints of the 2D antiferromagnetic (AF) square lattice on the doped holes [4]. These constraints give rise to two quantum entities: simplons, which are individual holes and pairons, pairs of holes on neighboring sites, in their local AF environment [4]. Consequently, a simple explanation for the superconducting dome and its connection to the pseudogap state emerges, wherein both appear as inseparable phenomena.
In the present work, in addition to the study of the density fluctuations, we extend the statistical approach to the distribution of the Voronoi cell areas surrounding each pairon. Let us recall that the Voronoi cell associated with a given pairon i consists of every point in the plane whose distance to the pairon i is less than or equal to its distance to any other pairon. The parameters of the superconducting state, the condensation energy, and the pairing energy, emerge directly from this analysis. We propose a phenomenological energy functional, written in terms of the local density, in which the pairon correlation defines the condensation energy, and hence the . The same energy functional allows to deduce a novel pairon correlation length, , written in terms of the condensate density, revealing a simple critical exponent.

The fundamental parameters of the model are deduced quantitatively from the single energy scale, , the effective AF exchange energy. The estimate of leads to both the dome and the line as a function of carrier concentration, consistent with tunneling and photoemission spectroscopy experiments (see [5] and references therein). Finally, in this work, the unconventional cuprate quasiparticle spectrum deduced from the model is shown to be in quantitative agreement with the experimental tunneling spectra.
Our work sheds a new light on the nature of the transition in cuprates, namely a disorder to order transition of preformed pairons, which occurs on a characteristic length scale , being the length scale of the pairon-pairon interaction. We assume that ( being the lattice constant) is on the order of the pairon-pairon distance at the onset of the superconducting dome.
II The phase diagram of cuprates:
a critical review
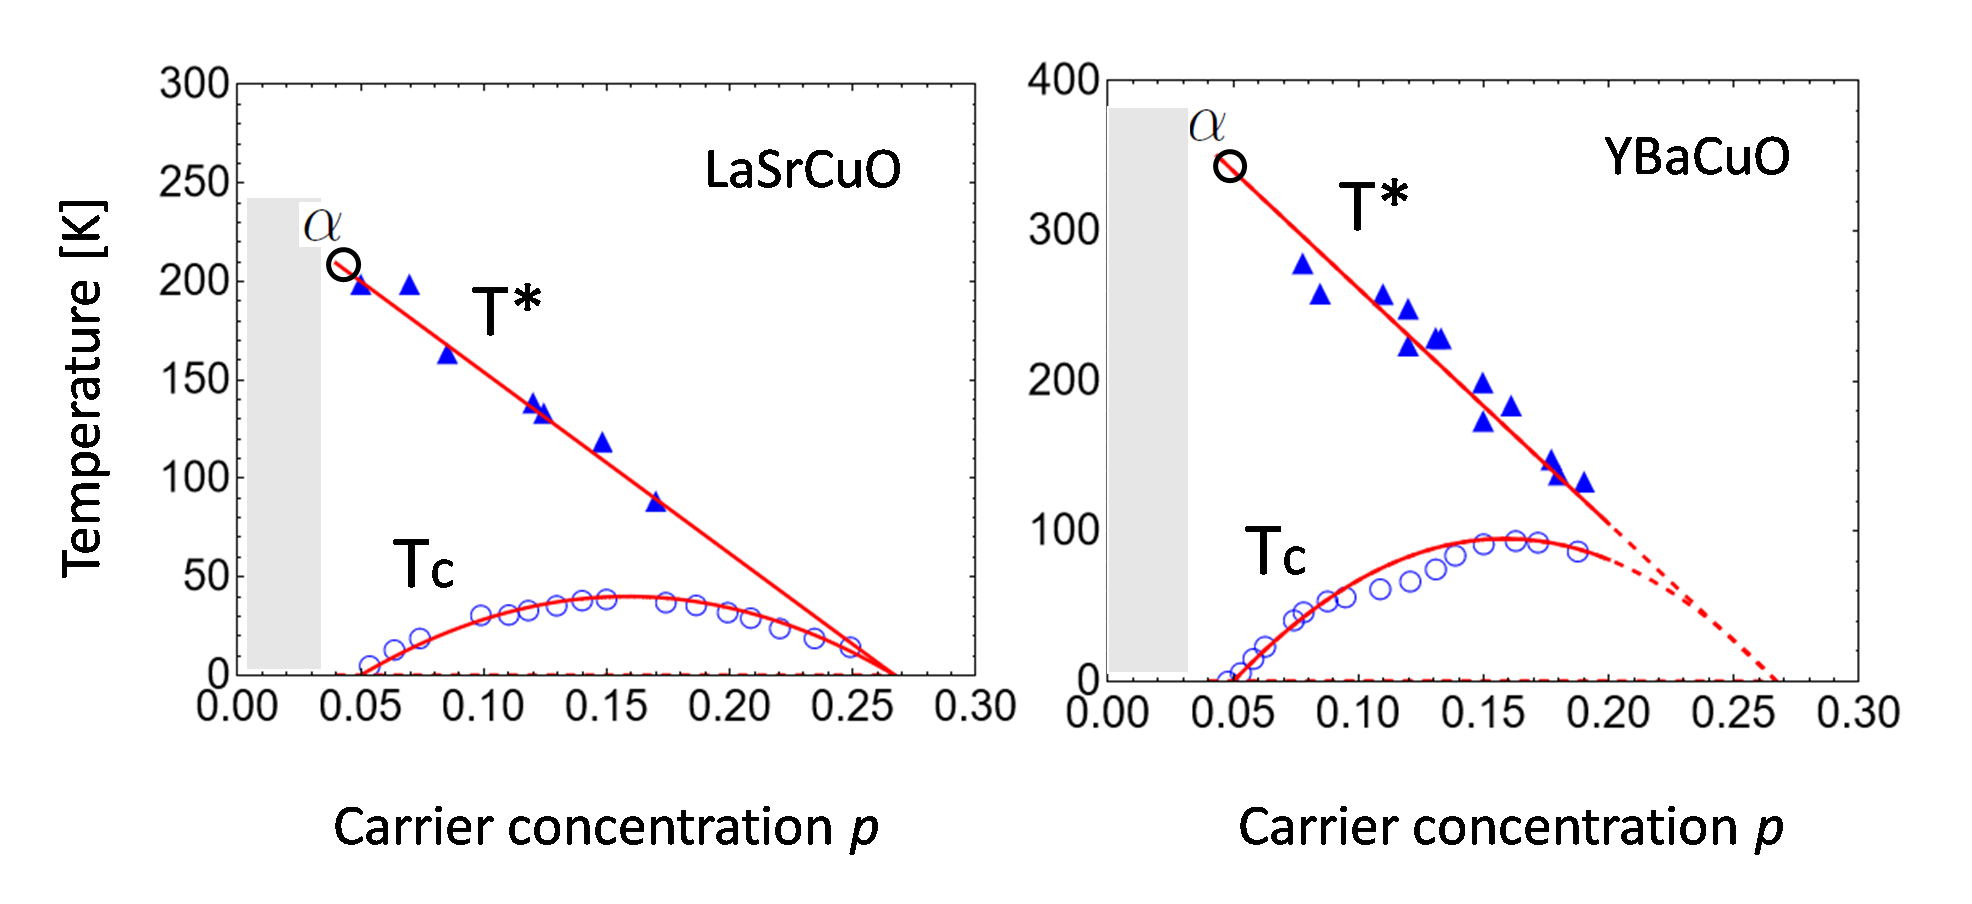
The phase diagram of cuprates is characterized by several characteristic lines (see Fig. 1). At zero carrier concentration (hole doping level ), the system is an antiferromagnetic insulator. The Néel temperature decreases with and vanishes at a characteristic value 0.02 [6]. For 0.05, the system becomes metallic and a superconductor. As is well known, the critical temperature follows a parabola [7]: it first increases with doping up to an optimum value for =0.16. It then decreases for larger doping values and vanishes at the maximum 0.27, corresponding to the limit of superconductivity. This dome, firmly established in a wide variety of experiments [8, 9, 7, 10], is one of the most fundamental unanswered properties of cuprates. Surprisingly, its physical origin has been discussed in relatively few theoretical works, for example [3, 11, 12].
In the Bardeen-Cooper-Schrieffer (BCS) theory describing conventional superconductors [13], superconductivity emerges from the metallic state. The formation of the collective quantum state, a superposition of Cooper pair states [14], gives rise to a gap in the single particle excitation spectrum, which was first evidenced in the tunneling spectrum by I. Giaever in the 1960s [15]. The spectral gap is the order parameter; it decreases with temperature due to fermionic quasiparticle excitations and finally vanishes at the critical temperature.
Superconductivity in cuprates is unconventional (see Ref. [16] and references therein) and deviates from the BCS theory in many aspects such as : the precise shape of the low-temperature tunneling spectra [17], the unconventional temperature dependence of the specific heat [18, 19, 20], the anomalous Nernst effect [21, 22], diamagnetism [23] and shot noise above [24], and finally the non Fermi-liquid normal resistivity [25, 26, 10].
Contrary to conventional superconductors, in cuprate superconductors the metallic state is not recovered above . Instead, one finds the well-known pseudogap (PG) state [27, 28] whose origin and link to the SC state is still highly debated. The PG state is characterized by a gap which persists above in the quasiparticle excitation spectrum up to the higher temperature [29, 30], while the Josephson signature of the superconducting coherence still vanishes at the critical temperature [31, 32]. Above one recovers the ‘normal’ metallic state, albeit strongly correlated.
The onset of a gap in the antinodal direction, as measured by Angle-Resolved Photoemission Spectroscopy (ARPES) [33, 34, 36, 35, 37] defines the pseudogap temperature . The latter follows a straight line as a function of doping [38, 5, 34, 39, 40] (see Fig. 1). As also noted by [41], seems to extrapolate to the Néel temperature at zero doping and to vanish at the end of the dome, i.e. for .
On the other hand, lines deduced from a variety of experiments (resistivity [42, 43, 44], specific heat [45], magnetic susceptibility [46]) have been found to contradict the above scenario. These lines are suggested to cross the dome and vanish at a critical point [47]. This conundrum, still debated, was answered in our previous work in connection to simplons [48] and will be further substantiated below.
The magnetic susceptibility of cuprates has been extensively studied and exhibits a broad peak as a function of temperature [49, 50, 51, 52, 53]. The position of the peak, defined as , reveals the characteristic temperature of magnetic correlations [54]. Well above , the magnetic susceptibility follows a Curie-Weiss law of quasi-independent spins, while for , the magnetic susceptibility decreases upon cooling due to growing magnetic correlations. So represents the crossover between these two regimes.
In the hole doping phase diagram, decreases linearly as a function of doping and then changes slope or even saturates in the overdoped regime [53, 48], as illustrated in the inset of Fig. 1. One remarks that , for a wide range of , is notably larger than , indicating that the two phenomena are distinct. Indeed, at the SC onset (), for Bi2Sr2CaCu2O8+δ (BSCCO2212), the two temperatures are roughly in a 2 to 1 ratio.
II.1 Simplons and pairons
In our approach, the phase diagram of cuprates can be understood quantitatively by considering two quantum entities, simplons and pairons, which directly result from hole doping of the CuO square lattice [48].
The simplon is a hole surrounded by four ‘frozen’ spins (see Fig. 1, upper right panel), which we introduced in a previous work in order to understand the behavior of the line deduced from the magnetic susceptibility [48]. A hole in the CuO lattice evidently suppresses one spin, but when magnetic correlations are strong enough a ‘simplon’ is formed. The latter has the property of one central spin plus 4 frozen spins on nearest neighbor sites, thus the suppression of fluctuations of 5 spins per hole. The necessary condition for simplon formation is that the correlation length satisfies , where is the lattice parameter, which is true for temperatures such that .
A simplon is related to a skyrmion but with a finite correlation length, since a skyrmion also freezes the 4 spins in the CuO plane around the hole. At very low doping (), before metallicity is established, a simple picture is that one hole creates a simplon below which evolves into a skyrmion at lower temperature when magnetic correlations extend to a much larger scale such that . Moreover, the formation of skyrmions is a realistic scenario to explain the disappearance of long range AF order at low doping [55].
In the metallic region, i.e. for , we proposed that holes (simplons) combine to form hole pairs or pairons [56] below the characteristic temperature . This temperature defines the pseudogap phase by the onset of the spectral gap in the antinodal direction, which can be precisely measured by ARPES [37, 35, 39]. In our approach, the binding energy of a pairon is determined by the surface area of the local AF island surrounding the two holes on the characteristic length scale [56], which was found to vary as the inverse distance between holes [57]. Consequently, it is natural that decreases with increasing hole doping and vanishes at , a critical value which is determined by the minimum area of a pairon [56]:
| (1) |
with .
As we will see in a later section, this linear dependence of the antinodal gap is remarkably well satisfied. Here is conveniently defined as the effective exchange energy at the value , about meV for BSCCO2212. Moreover, the fact that indicates that the pairing mechanism is linked to the local magnetism in a static, and not retarded, interaction of coherent spins on the scale of , the AF coherence length.
II.2 Magnetic temperature scale
In the early days of high-, the magnetic susceptibility, , was studied for a wide range of carrier concentrations in several materials. Moreover, theoretical calculations were successful to describe many of the magnetic properties [58], in contrast to the SC issues.
As mentioned previously, the position of the peak in the susceptibility, , decreases with hole doping in a reproducible fashion (see Fig. 1) [53, 48]. For decades, many authors confused with (see Ref. [48] for further details). This led to contradicting definitions of the pseudogap region in the phase diagram. Recently, we reexamined the susceptibility data for different materials and found that the two temperature scales and are clearly distinct, allowing to resolve this paradox [48]. In agreement with early work by Nakano et al. [53], first decreases linearly with increasing over a wide range, but then softens in slope in the overdoped regime [48] (inset of Fig.1).
The formation of simplons provides a very simple explanation for the linear behavior of . In this picture, a hole freezes completely the four nearest neighboring spins. Consequently, a total of 5 spins per hole no longer contributes to the magnetic susceptibility. It follows that :
| (2) |
where is the intrinsic exchange interaction of the CuO plane (for BSCCO2212, ).
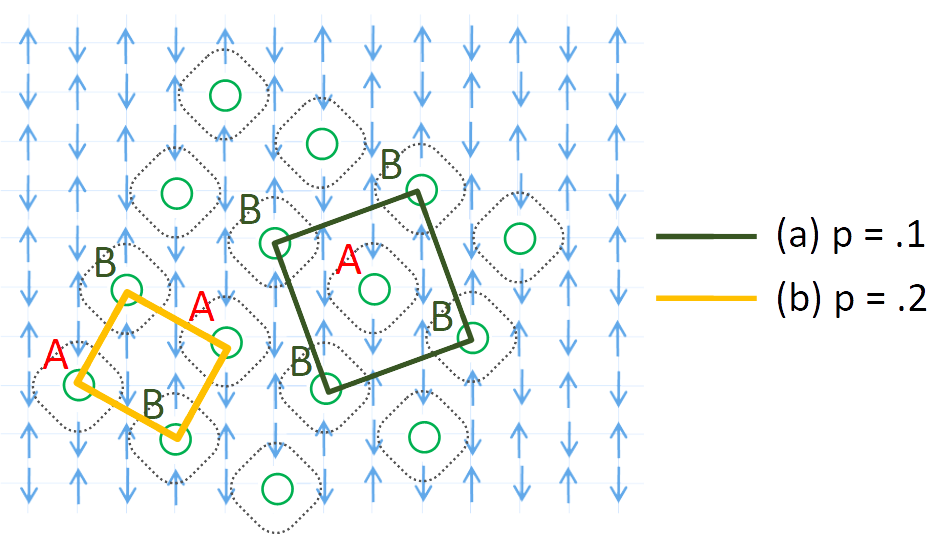
Consequently, the linear part of extrapolates down to zero at the characteristic value 0.2, which is close to a possible quantum critical point [59]. As discussed in our previous paper [4], the linear extrapolation to is a consequence of simplons in the high density limit. Indeed, the concentration corresponds to the perfect compact simplon lattice, as illustrated in Fig. 2. At the extrapolated density of this compact simplon lattice, all spins of the system are frozen.
.
It is worth noting that the values of vary slightly from one compound to the other [48]. A possible explanation is the influence of interlayer coupling which reduces spin fluctuations and enhances the Néel temperature at zero doping [60]. The interlayer coupling is stronger for Bi2Sr2CaCu2O8+δ (BSCCO2212) than for La2-xSrxCuO4 (LSCO), the latter being more 2-dimensional with a lower . As a result, the four neighboring spins could be only partially frozen in LSCO, thus giving a smaller slope and a larger than for Y1-xCaxBa2Cu3O7+δ (YBCO) or BSCCO2212 for which .
As seen in the phase diagram, the two characteristic temperatures approach each other in the overdoped regime. This might explain why line deviates from linearity. Indeed, below , holes bind together to form pairons, which affects the magnetic correlations in a different way than simplons. As seen in the phase diagram the smooth evolution of extends to the limit of the dome, suggesting that magnetic correlations survive up to [61, 62] or even beyond, as seen in some experiments [63].
III Statistics of pairon states
III.1 Fluctuation of the density
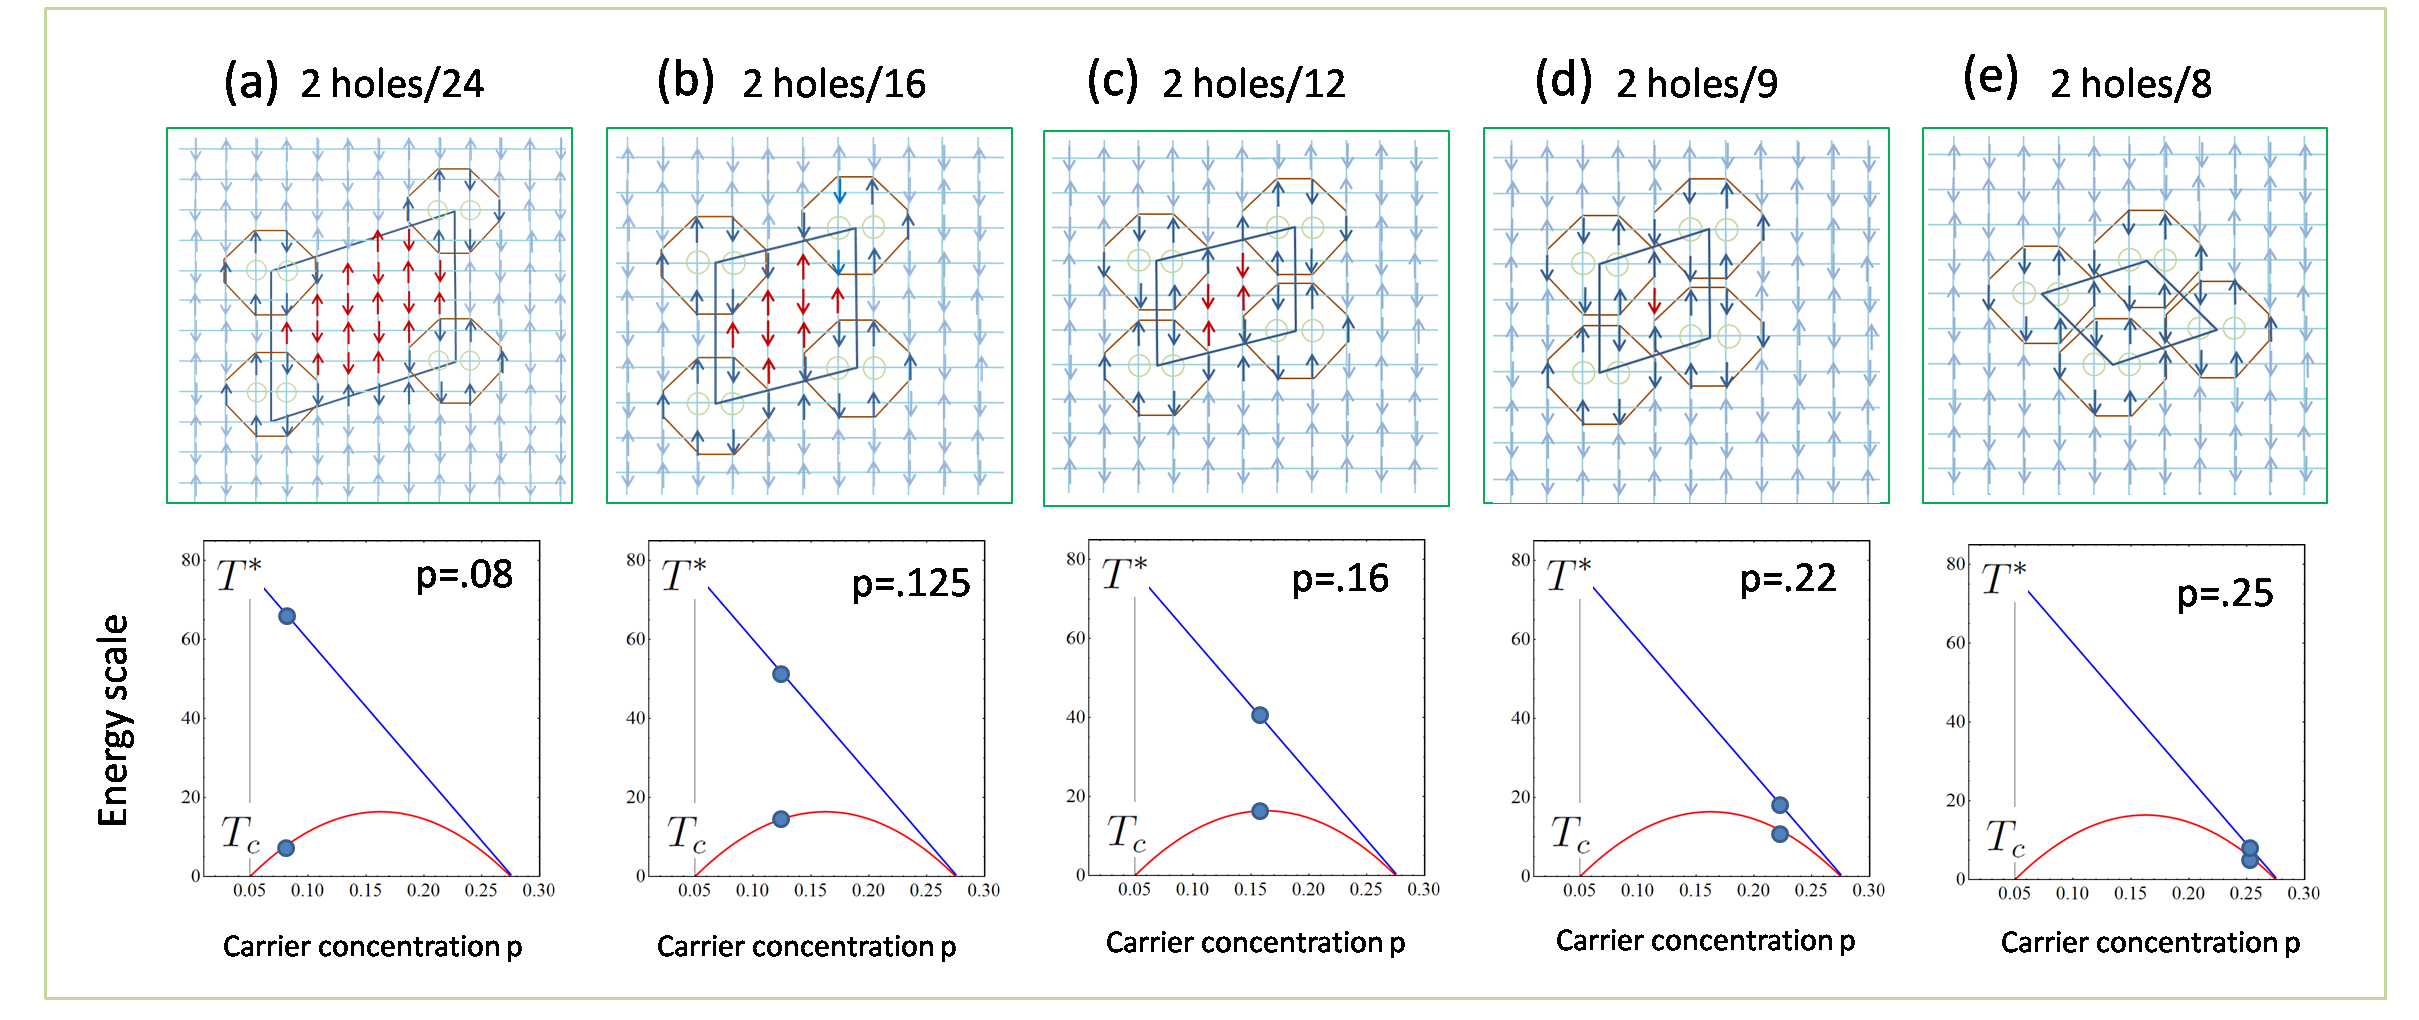
We now study the statistical properties of pairons randomly distributed on a 2D square lattice. As described below, this state can be characterized either by studying the local density or by the distribution of the Voronoi cell areas. We recall that the Voronoi cell is the generalization of the Wigner-Seitz cell for a non periodic distribution of points. We make the linear transformation for the doping in such a way that corresponds to the onset of superconductivity and that corresponds to the compact pairon lattice [4], which is obtained for 0.25 (see Fig. 3). The latter value is very close to the end of the SC dome (i.e. ) :
| (3) |
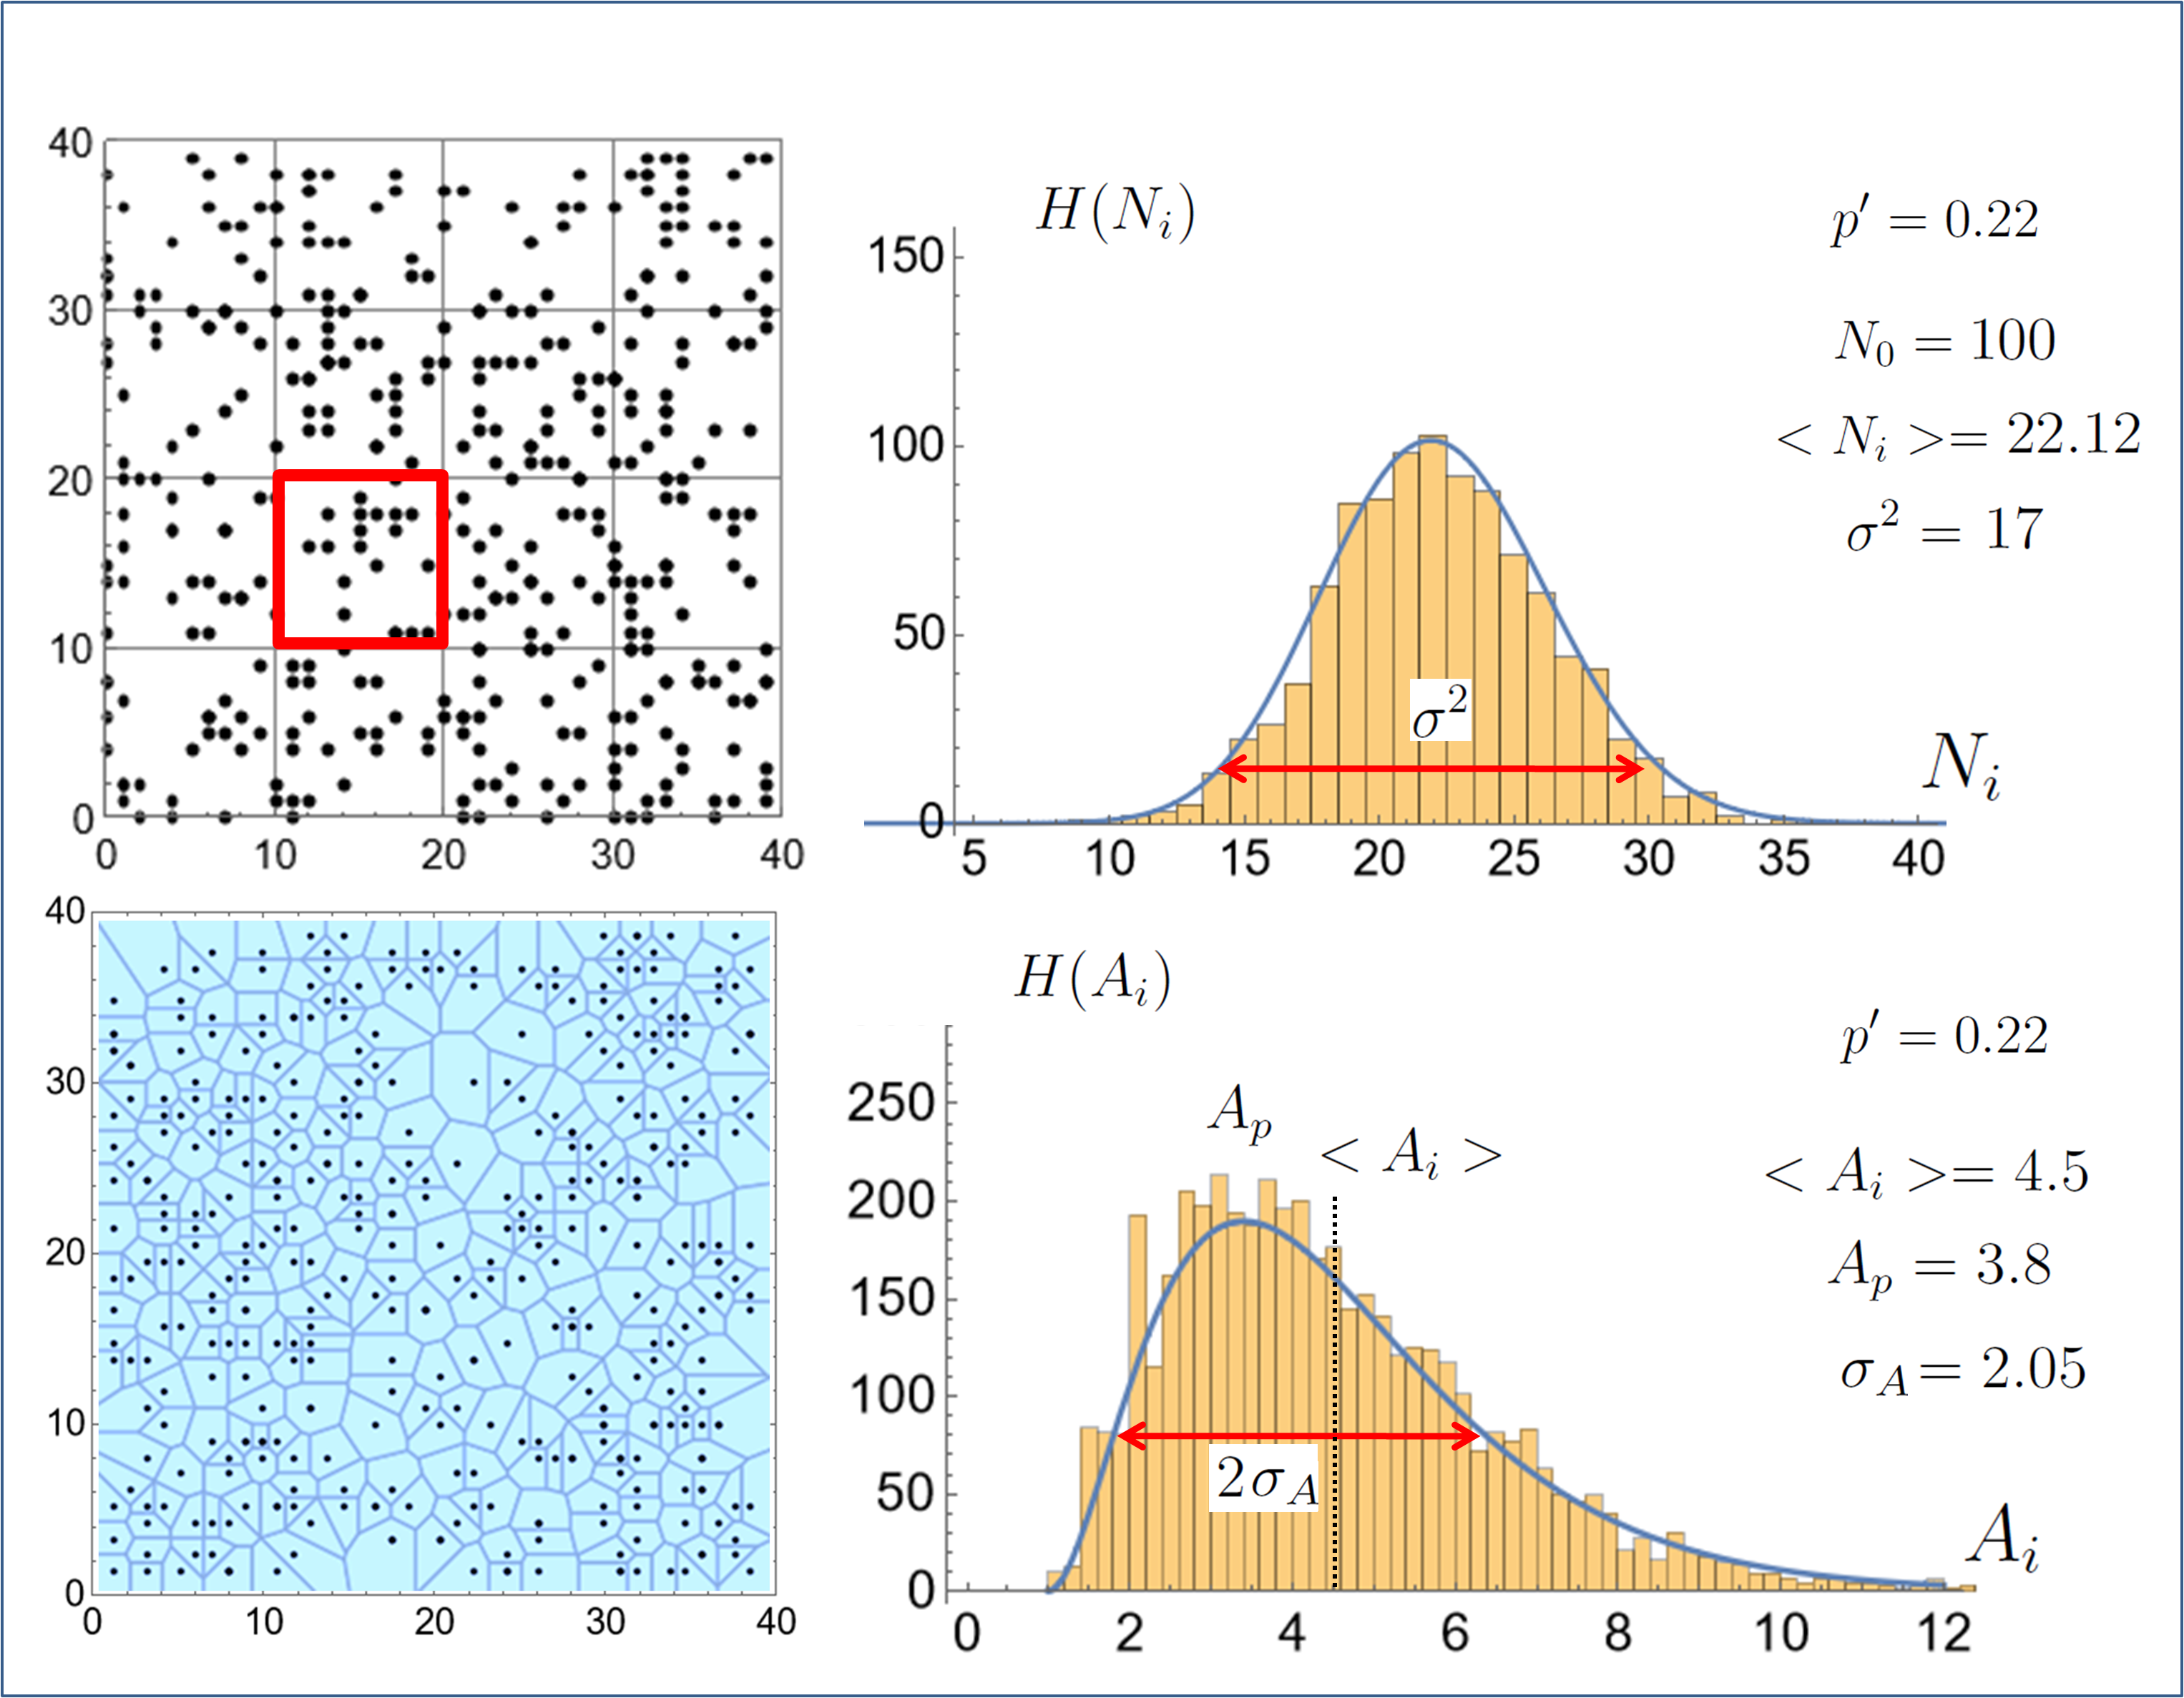
The numerical simulation proceeds as follows. We consider a discrete square lattice of pairon sites of size , where in practice = 40 (Fig. 4). Then, we distribute randomly a fixed number of pairons on the sites, with the only constraint that two pairons cannot occupy the same site. By construct, a given site has the probability of being occupied and of being vacant.
The statistics of the pairons is then calculated in a smaller cell within the larger square : a cell of area , containing sites, to avoid edge effects (see Fig. 4 upper panel). For convenience, we chose , and define the number of pairons in such a square in the th configuration. We then consider successive random configurations to study their statistical distribution, keeping constant the total number of pairons in the larger square of size . After a sufficiently large number of trials, we check that the average number of the is independent of to the desired accuracy.
By the previous definitions, is the local pairon density of the th configuration and is obviously proportional to the filling factor :
| (4) |
The variance follows the binomial law:
| (5) |
The result is illustrated in Fig. 4, upper panel. The distribution is calculated for a 4040 lattice for and doping 0.22 and compared to the theoretical binomial distribution curve for the corresponding density (blue line).
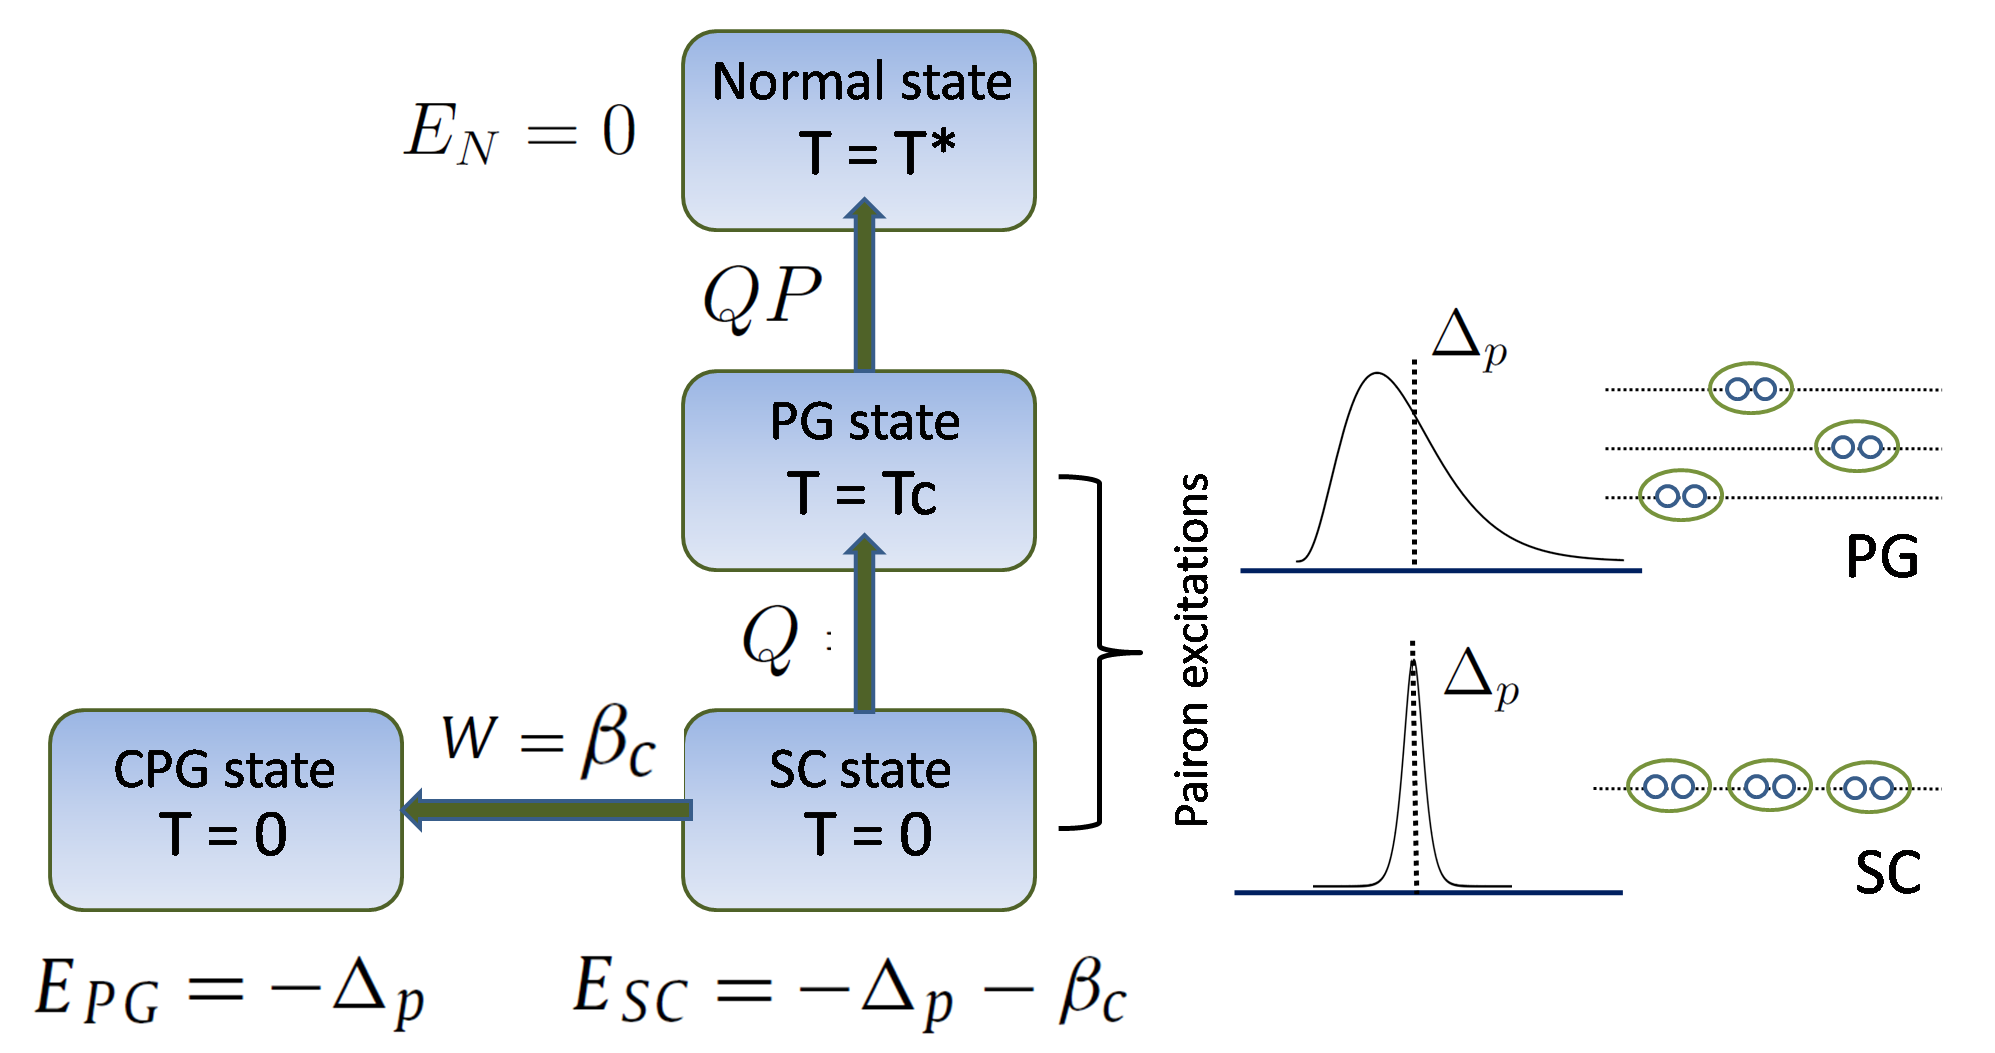
These results confirm that characterizes the strength of the disorder and follows the expected binomial law. We proposed in a previous article [4] that the variance is proportional to the work needed to disorder the system at zero temperature, starting from the (ordered) SC state, to reach the disordered Cooper Glass State (CPG). The latter is an incoherent non-SC state, wherein the system is totally disordered, the variance is a maximum, reaching the binomial value (Eq. 5). Therefore, by definition, no more correlations between pairons exist. The work needed to go from the SC state to the CPG state represents the coherence energy of the system which, in our view, is directly proportional to the critical temperature [64, 56].
The SC to CPG transformation explains the origin of the -dome. Since
it is exactly an inverted parabola, as dictated by the binomial law. The critical temperature is maximum at the optimum doping =0.5 (equivalent to ), for which the disorder strength is maximum. For , on the overdoped side, the number of vacant sites decreases with so the disorder strength becomes progressively lower and finally, for , all pairon sites are occupied (see Fig.3), there is no energy gain at all, and . At this critical density, the mean gap also vanishes (see Eq.1) so the two important energy scales, and , are both zero at the end of the SC dome.
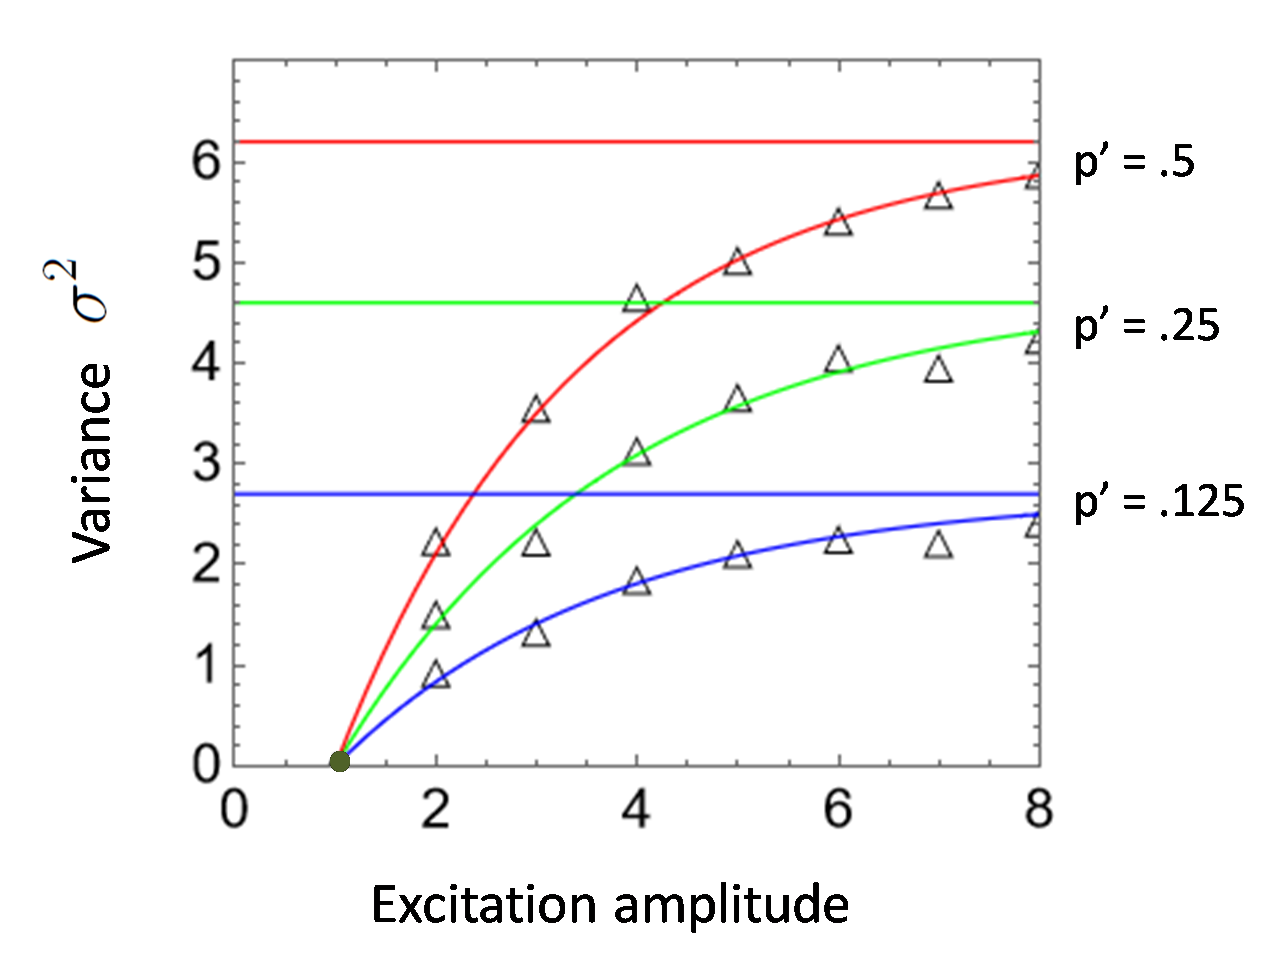
To illustrate the adiabatic transformation from ordered to disordered states, we consider a classical model wherein the initial ordered state is a perfect lattice of pairons, analogous to the Wigner crystal of classical interacting charged beads [65]. The lattice is then subject to a stochastic noise of increasing amplitude. The results for () are plotted in Fig. 5 for three different pairon densities. One can see clearly that the variance increases monotonically with noise amplitude, until reaching the completely disordered state verifying the binomial law . This simulation confirms the essential role of the variance in the disordering process.
Note that in this section, we focus on the transformation which drives the system from the SC state to the CPG state at zero temperature, which is obtained by applying an adiabatic work . It should be distinguished from the transformation with increasing temperature, where the pseudogap state is obtained at . Since the condensation energy is defined as the work needed to destroy the correlations, an additional amount of energy has to be furnished in order to destroy the coherent state (see Fig. 6) by heating, in agreement with the second law of thermodynamics. While the CPG state is an incoherent state at zero temperature, the pseudogap state at involves both pairon and quasiparticle excitations [66, 67]. This dual aspect of the thermal excitations is a determining factor in the shape of the specific heat, for example, as shown in Ref. [67]. Nevertheless, both the CPG and PG states are essentially the same : a non-superconducting state of uncorrelated pairons.
III.2 Phenomenological expression for the energy of the system
In the BCS scenario the system gains energy by an ordering of Cooper pairs in -space, giving rise to the well-known spectral gap at the Fermi level. However, in our mechanism, the energy gain is due to pairon correlations in real space, on a length scale . This aspect can be understood by a phenomenological expression for the energy as a function of the local density of pairons within a square box of side , where is the number of pairon lattice sites inside the box, i.e. =.
First, we note that the local exchange energy in the box, , is reduced compared to due to the presence of pairons. It reads:
| (6) |
As in the previous subsection, the total energy is found by the statistical average over configurations. In a given configuration we write as the sum of 2 terms:
| (7) |
where the first term is the pairon self-energy (equivalent to the magnetic energy) and the second term is the correlation energy. Taking the statistical average of , we then obtain:
| (8) |
with
| (9) |
and
| (10) |
The third term in Eq. 8 is a fluctuation term, proportional to the variance defined in Eq. 5. With , this third term takes the form:
| (11) |
In the SC state where , , so that:
| (12) |
while in the CPG state where pairon correlations are absent, , , so that
| (13) |
Since the condensation energy is by definition the energy difference between the CPG and the SC states, we find :
| (14) |
To describe intermediate states, it is useful to introduce an effective correlation energy . Taking Eq. 11 into account, Eq. 8 can be written:
| (15) |
with
| (16) |
In such a way, the effective correlation energy varies from 1 (SC state) to 0 (CPG state) and can thus be considered as the order parameter between the ordered and disordered states. Since applying virtual work at zero temperature (by an applied magnetic field) or thermally (by contact with a heat bath) the condensate number density will decrease monotonically (where is the relevant intensive variable) until reaching a critical value , i.e. the phase transition. Indeed, in our previous work, we have shown that behaves as the order parameter wherein the distribution of pairon excited states is governed by Bose-Einstein statistics [64] (the role of quasiparticle excitations was given a full treatment in [66, 67]).
The following general formula can then be proposed:
| (17) |
Taking Eq. 11 into account, we find the relation between the pairon correlation length and :
| (18) |
This equation represents a new critical length describing the transition with a simple critical exponent . Moreover, is interpreted as the correlation length of excited pairons in the presence of the condensate. As shown in Fig. 7, diverges for () and is equal to 1, its minimal value, when () . As the inset of the Fig. 7 shows, the derivative of is discontinuous at the critical point.

Finally, the result for the condensation energy derived in this work, , captures a novel mechanism of the transition. In the model, the condensate is a many-body quantum state of pairons governed by the single energy scale and the pairon-pairon interaction distance . The former replaces the traditional phonon energy scale of the BCS theory [13], while the latter is the new length scale of the mean-field interaction in real space. Once the condensate is destroyed by fluctuations, in the CPG state pairons behave classically and are governed by the binomial law with variance .
The unconventional nature of the transition is striking: if this were conventional SC, the condensation energy should be proportional to the spectral gap at the Fermi level, . However, in this approach, the condensation energy, , is interpreted as the correlation energy between pairons, which is maximum in the SC state and vanishing in the CPG state. The fact that is not the order parameter remains one of the most intriguing aspects of cuprate SC. Indeed, the average spectral gap at the Fermi level is invariant from the ordered state to the CPG state (see Fig. 6, right panel).

III.3 Comparison with experiments for different materials
As we have discussed, the pseudogap temperature decreases with hole concentration while the critical temperature is nearly a perfect dome. We then hypothesize that both and emerge from the proposed energy functional and statistical approach described above. This is a continuation of our previous work [4] wherein the superconducting state and the pseudogap state are not independent phenomena. On the contrary, they are intimately coupled, so that and follow the relations:
| (19) |
where and depend on the the same energy scale parameter .
We then compare the robustness of the model for BSCCO2212 to the experimental values of the gap and measured by photoemission (Fig. 8) as well as the dome. The agreement is remarkable for a value of the two parameters 390 K and 380 K. The values found for and are very close. Indeed, we found in our previous article [4] that for BSCCO2212 and can be taken as equal to the experimental uncertainty. (Note that .)
From the
value for a certain doping, we can deduce the expected value
for the pseudogap temperature, proving their intimate link.
We also examine the case of LSCO and YBCO (see Fig. 9). Taking the values of the pseudogap temperature
found from Nernst experiments [41], we
obtain the values for the two adjustable parameters. For LSCO, we
find, 200 K and 160 K. For YBCO we find
340 K and 380 K. The results are
summarized in Table 1.
| (K) | (K) | ||
|---|---|---|---|
| BSCCO2212 | 390 | 380 | 1.02 |
| LSCO | 200 | 160 | 1.25 |
| YBCO | 340 | 380 | 0.89 |
We find that YBCO is quite similar to BSCCO2212 although is slightly smaller than expected. On the other hand, for LSCO is significantly smaller and . The differences in the ratio are most likely due to the structure of the different materials and the fact that LSCO has a single CuO plane and weak interlayer coupling compared to BSCCO2212.
Since from ARPES and tunneling (see Fig. 8), we get numerically 74 meV BSCCO2212. This yields the value of the spectral gap at optimal doping (, ) : meV. Using the expression for , the SC condensation energy at optimal doping is meV, a very reasonable value.
Finally, the Ginzburg-Landau coherence length associated with is written:
| (20) |
Using the numerical value of , we obtain nm, which is typically the length scale of the vortex core in cuprates [73].
III.4 Statistics of the Voronoi cell areas
An equally important geometrical property of random points on a square lattice is the Voronoi cell area distribution. Such a mathematical analysis is used to study real physical systems such as confined charged beads in 2D [70]. In this paragraph we connect their statistics to the physical properties of pairons, which extends the previous analysis of density fluctuations. The distribution of the Voronoi cell areas surrounding each pairon is calculated as a function of concentration.
A typical result is shown in Fig.4, lower panel. We find an asymmetric distribution in agreement with previous mathematical studies [71, 72]. As a consequence, the mean value is larger than the maximum of the distribution which is the most probable value. Qualitatively, we see that the distribution is much broader than the binomial distribution and extends to very large areas. We find that a relatively simple skewed distribution function matches the numerical simulation satisfactorily at all concentrations. It reads:
| (21) |
where , are free fitting parameters, and is the minimum area of a pairon.
For a given density, the average of and the average of are linked by the constraint:
| (22) |
where is the sampling area of the density.
Following our previous work [56], we assume that each pairon binding energy is determined by the surface area of the Voronoi cell:
| (23) |
This hypothesis means that the binding energy of a given pairon is proportional to the number of coherent spins in a given Voronoi cell, on the scale of .Since [57], where the additional comes from the formation of hole pairs below , varies from for to for along the superconducting dome.
Taking the average value of , one obtains:
| (24) |
so that Eq.9 is recovered. We find that the mean binding energy decreases linearly with as expressed in the energy functional and verified in the density fluctuation simulation. Note that this binding energy corresponds to the spectral gap at the Fermi level as measured by ARPES and tunneling [64].
We then calculate the variance of the Voronoi cell areas . For comparaison to physical quantities, we convert to the same energy scale using the relation :
Similarly, the average binding energy is calculated from the Voronoi statistics using equation 23. The calculations were then done systematically as a function of doping throughout the phase diagram, independently of the density fluctuation approach. The combined results for and are summarized in the plots of Fig. 10.
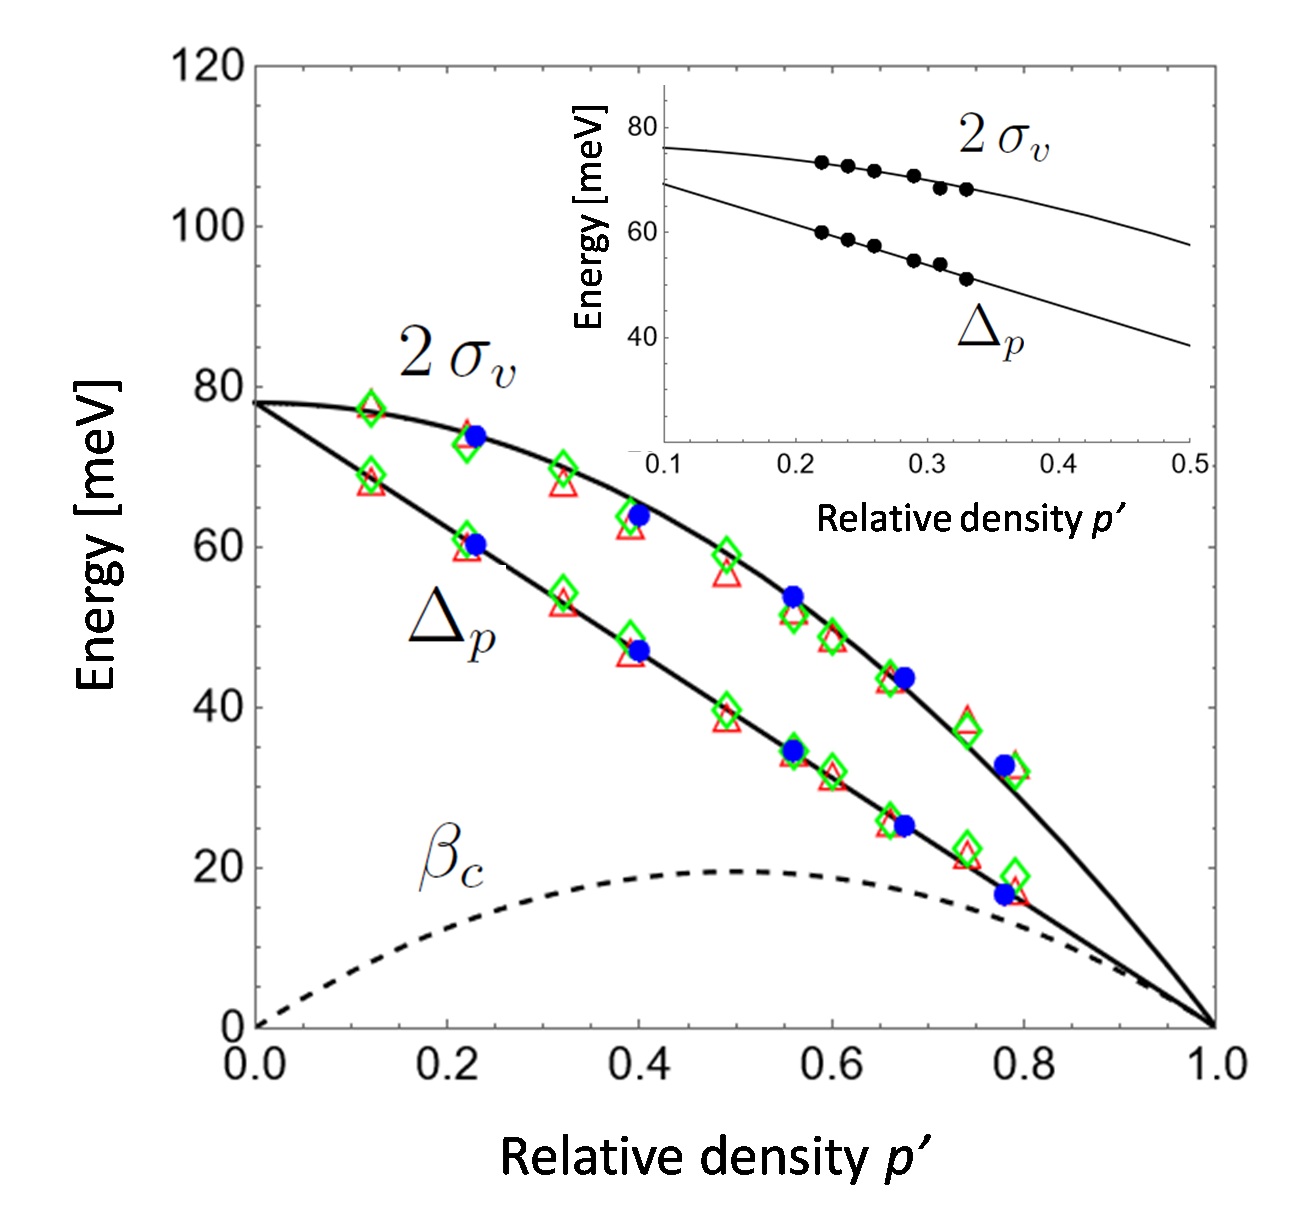
Significantly, we find that has an important physical meaning. From the calculated Voronoi distribution in the disordered CPG state, is found to be very close to the sum . More precisely, as can be seen in Fig. 10 :
| (25) |
for a wide range of . (A typical fit is : , which is quite satisfactory.) In fact the quantity appears naturally in the energy functional as described previously (see Eq. 12); it corresponds to the total energy of the system in the SC state :
| (26) |
i.e. the sum of the binding energy and the correlation energy. Thus, we expect to be revealed in experiments probing the cuprate superconducting state.
In summary, the physical quantities can be understood from Fig. 6 showing that the CPG is obtained by the adiabatic transformation at zero temperature by applying a work to the SC state. The examination of Fig. 10 reveals unequivocally that the fundamental SC/PG parameters also appear in the Voronoi distribution. Remarkably, the statistics of the cell areas contains the same information as the density fluctuations.
Another key point is revealed by the distribution of Voronoi cells of the CPG state : in a given configuration there is a relatively wide distribution of areas (the ) over a width (see Fig.4, lower right panel). This implies that in the CPG state, there exists an equivalent distribution of pairon energies with a width equal to the total energy of the system, . Therefore, a key characteristic of the pseudogap state is the energy distribution of ‘pre-formed pairs’ of width .
In our previous work, we extended this idea of pair energy distribution to the pair excited states in the calculation of the ARPES quasiparticle spectral function [66] and the tunneling density of states [64]. For the excited states, we assumed a Lorentzian distribution :
| (27) |
whose physical interpretation is the energy spread over a width of a system of pairons of total energy . The conclusion of this subsection is that can now be identified as , and thus it is no longer an independent parameter of the problem.
In conclusion, the fundamental parameters characterizing the SC state and the PG state, namely the condensation energy and the pseudogap , both emerge from the statistical properties of the disordered state. The only free parameter of the problem left is therefore the exchange energy, .
IV Quasiparticle density of states
In this final section we show that the fundamental parameters of the model are seen in the low-temperature tunneling spectra. In the previous section, we have seen that the pairon binding energies , calculated from the Voronoi cell areas in the disordered CPG state, represent the available pairon states once SC coherence is destroyed (see Fig. 6). Such a state, obtained in a gedanken experiment by applying an adiabatic work to the system, is realized in a bona fide STM/STS experiment in a vortex core, where SC coherence is broken, Fig. 11. This is commonly referred to as the low-temperature pseudogap in the quasiparticle density of sates (DOS).
The theoretical quasiparticle spectrum in the CPG state can be obtained from the pairon binding energies deduced from the previously determined Voronoi distribution . The latter distribution has a width and average gap , as previously described. These two parameters are known for any value of the carrier concentration, , with the choice meV. We use the simple formula :
| (28) |
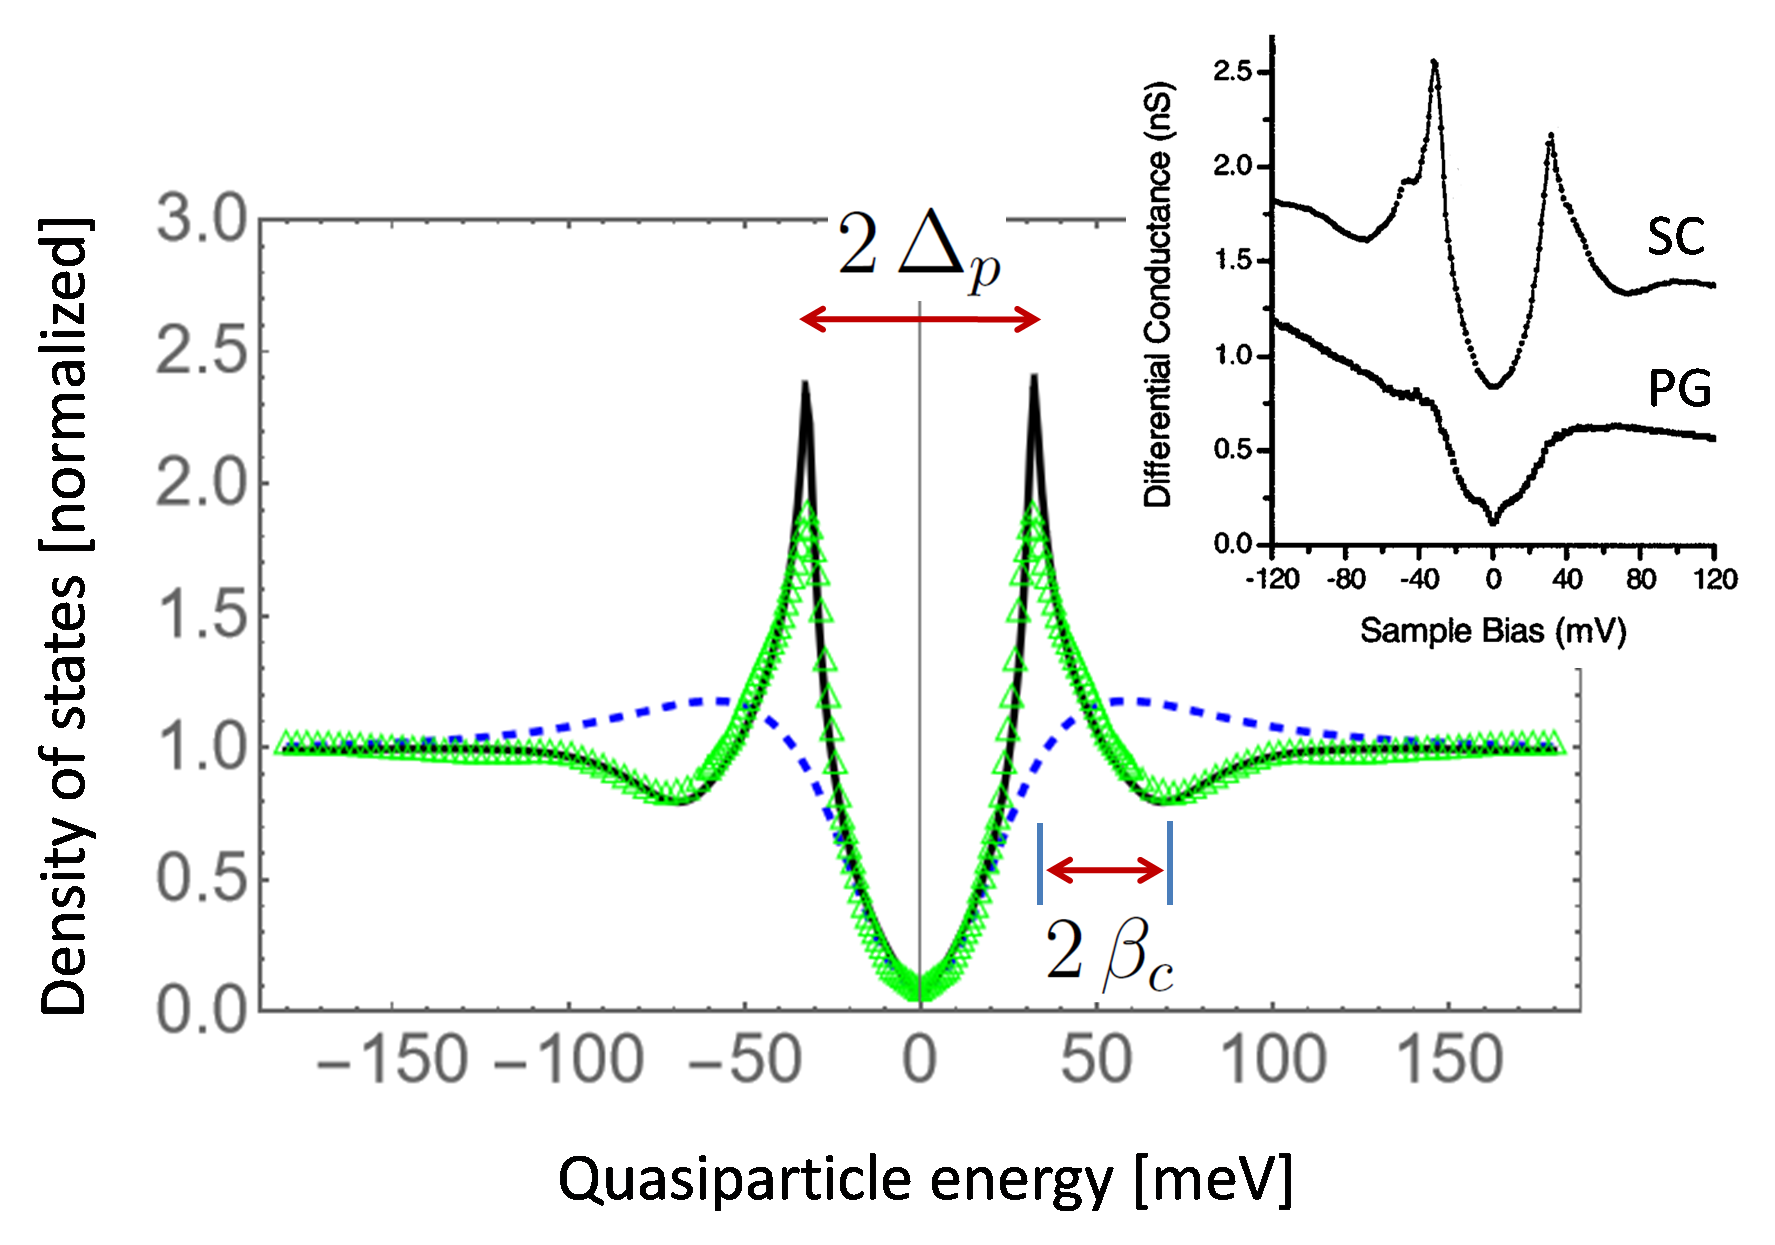
where is a constant, and the integrand is the quasiparticle DOS associated with the pairon energy level . The resulting PG-like DOS is plotted in Fig. 11 (dashed line) and compared to the experimental one found in the vortex core (inset of Fig. 11) obtained by Pan et al. [73].
The quasiparticle DOS in the SC state is more involved to calculate and was given full treatments in [74, 64, 75]. Indeed, in the coherent state, the self-consistent -wave gap function was shown to be :
| (29) |
where is the quasiparticle energy, with the kinetic energy with respect to the Fermi energy. The above gap function has a complex pole at the value [76, 74] giving rise to the characteristic sharp dip structure in the quasiparticle DOS at the position . A similar pole gives the dip for negative energies.
The experimental quasiparticle spectrum is shown in Fig. 11, green triangles, compared to the theoretical curve using the gap function of Eq. 29, solid black line. It exhibits the very sharp, but characteristically wide, coherence peaks, as well as the aforementioned dip-hump structure. We recall that, in the model, the two basic parameters and are known as a function of the carrier density, and the effective exchange interaction . Since the latter is fixed, the fit in Fig. 11 can be done with essentially one free parameter, in this instance . In practice, we do include some quasiparticle damping (Dynes broadening [77]) to achieve the best fit [74].
In the disordered CPG state, the shape of the QP spectrum is very different: the coherence peaks are almost completely smeared out, as found in the real experimental spectrum (Fig. 11, right inset). Note that a very similar spectrum is also observed in a highly disordered region [78, 79]. The QP spectrum inside a vortex core thus reflects the CPG state where pairs occupy randomly the available pair states of the distribution, without global phase coherence.
In conclusion, the essential parameters of the model, the low- temperature gap and the condensation energy , can be directly extracted from tunneling experiments, either in the SC state, or in the CPG state, realized outside or within the vortex core, respectively.
V Conclusion
We have studied the statistics of pairons randomly distributed on a square lattice. We have shown that the fundamental aspects of the phase diagram, the dome, the pseudogap temperature , emerge from the statistical analysis of the disordered state of pairons.
The SC transition appears as a disorder to order transition, resulting in a correlated state of pairons in real space, the condensate. A novel expression for the pairon critical correlation length is derived as a function of the consensate density. The coherence energy is the adiabatic work needed to drive the system from the ordered SC state to an incoherent state of pairons, the Cooper pair glass state, to which it is intimately connected. It is shown that SC coherence is achieved through correlations of pairons following a binomial law, explaining the superconducting dome.
The study of two quantum entities, the simplons and pairons, and their condensation, allows to gain insight on the temperature scales of the phase diagram, , , and and why they can be unified amongst the cuprates. In particular, the statistical analysis of pairon states on a square lattice proves that the key energy parameters, the spectral gap and the condensation energy , are proportional to only one energy scale .
The inevitable conclusion is that the superconducting and the pseudogap states emerge from the same interaction. This interaction is no doubt the local antiferromagnetic interaction, which accounts for the binding energy of pairons, in addition to the correlation energy between them. It appears that the pairon condensate is the ground state of a system where superconductivity and magnetism would otherwise be antagonistic. The total energy of the ground state is shown to be , i.e. the sum of the pairon self-energy, and the correlation energy, respectively. Contrary to conventional superconductivity, it is the latter energy that is tied to the SC coherence.
Finally, the essential parameters of the energy states, together with the numerical value of , allows to predict quantitatively tunneling spectroscopy experiments at low temperature.
Acknowledgements
We gratefully acknowledge Takao Morinari, Jeff Tallon and Atsushi
Fujimori for interesting and useful discussions.
Références
- [1] J. G. Bednorz, K. A. Müller, Possible high superconductivity in the Ba–La–Cu–O system , Zeitschrift für Physik B Condensed Matter 64, 189 (1986).
- [2] Roland Hott, Reinhold Kleiner, Thomas Wolf and Gertrud Zwicknag, Superconducting Materials – A Topical Overview, in Frontiers in Superconducting Materials, Ed. Anant V. Narlikar, Springer Verlag, Berlin, pp 1-69 (2004).
- [3] Jamil Tahir-Kheli and William A. Goddard III, Universal Properties of Cuprate Superconductors: Tc Phase Diagram, Room-Temperature Thermopower, Neutron Spin Resonance, and STM Incommensurability Explained in Terms of Chiral Plaquette Pairing, J. Phys. Chem. Lett. 1, 1290–1295 (2010).
- [4] Yves Noat, Alain Mauger, William Sacks. Superconductivity in cuprates governed by topological constraints. Physics Letters A 444, 128227 (2022).
- [5] S. Hüfner, M. A. Hossain, A Damascelli, and G. A. Sawatzky,Two gaps make a high-temperature superconductor?, Rep. Prog. Phys., 71, 062501 (2008).
- [6] B. Keimer, N. Belk, R. J. Birgeneau, A. Cassanho, C. Y. Chen, M. Greven, M. A. Kastner, A. Aharony, Y. Endoh, R. W. Erwin, and G. Shirane, Magnetic excitations in pure, lightly doped, and weakly metallic La2CuO4, Phys. Rev. B 46, 14034 (1992).
- [7] M.R. Presland, J.L. Tallon, R.G. Buckley, R.S. Liu and N.E. Flower, General trends in oxygen stoichiometry effects on Tc in Bi and Tl superconductors, Physica C, PhysicaC 176, 95–105 (1991).
- [8] J. B. Torrance, Y. Tokura, A. I. Nazzal, A. Bezinge, T. C. Huang, and S. S. P. Parkin Anomalous Disappearance of High-Tc Superconductivity at High Hole Concentration in Metallic La2-xSrxCu04, Phys. Rev. Lett. 61, 1127 (1988).
- [9] H. Takagi, T. Ido, S. Ishibashi, M. Uota, S. Uchida, and Y. Tokura, Superconductor-to-nonsuperconductor transition in (La1-xSrx)2CuO4 as investigated by transport and magnetic measurements, Phys. Rev. B 40, 2254 (1989).
- [10] Yoichi Ando, Seiki Komiya, Kouji Segawa, S. Ono, and Y. Kurita, Electronic Phase Diagram of High-Tc Cuprate Superconductors from a Mapping of the In-Plane Resistivity Curvature, Phys. Rev. Lett. 93, 267001 (2004).
- [11] Shiping Feng, Huaisong Zhao, and Zheyu Huang, Two gaps with one energy scale in cuprate superconductors, Phys. Rev. B 85, 054509 (2012).
- [12] E. C. Marino, Reginaldo C. , Corréa Jr, Lizardo H. C. M. Nunes,Van Sérgio Alves, Superconducting and pseudogap transition temperatures in high-Tc cuprates and the Tc dependence on pressure, Supercond. Sci. Technol. 33, 035009 (2020).
- [13] J. Bardeen, L. Cooper, J. Schrieffer, Theory of Superconductivity, Phys. Rev. 108 1175 (1957).
- [14] Leon N. Cooper, Bound electron pairs in a degenerate Fermi gas, Physical Review 104, 1189-1190 (1956).
- [15] I. Giaever, H. R. Hart, Jr., and K. Megerle, Tunneling into Superconductors at Temperatures below 1∘ K, Phys. Rev. 126, 941 (1962).
- [16] Božović, J. Wu, X. He, A.T. Bollinger, What is really extraordinary in cuprate superconductors?, Physica C 558, 30–37 (2019).
- [17] Ø. Fischer, M. Kugler, I. Maggio-Aprile, C. Berthod and C. Renner, Scanning tunneling spectroscopy of the cuprates, Rev. Mod. Phys. 79, 353 (2007).
- [18] J.W. Loram, K.A. Mirza, J.M. Wade, J.R. Cooper, W.Y. Liang The electronic specific heat of cuprate superconductors Physica C 235–240, 134-137 (1994).
- [19] Toshiaki Matsuzaki, Naoki Momono, Migaku Oda, and Masayuki Ido, Electronic Specific Heat of La2-xSrxCuO4: Pseudogap Formation and Reduction of the Superconducting Condensation Energy, J. Phys. Soc. Jpn. 73, 2232 (2004).
- [20] Hai–Hu Wen, Gang Mu, Huiqian Luo, Huan Yang, Lei Shan, Cong Ren, Peng Cheng, Jing Yan, and Lei Fang,Specific–Heat Measurement of a Residual Superconducting State in the Normal State of Underdoped Bi2Sr2-xLaxCuO6+δ Cuprate Superconductors, Phys. Rev. Lett. 103, 067002 (2009).
- [21] Z. A. Xu, N. P. Ong, Y. Wang, T. Kakeshita and S. Uchida, Vortex-like excitations and the onset of superconducting phase fluctuation in underdoped La2-xSrxCuO4, Nature 406, 486 - 488 (2000).
- [22] Yayu Wang, Lu Li, and N. P. Ong, Nernst effect in high- superconductors, Phys. Rev. B 73, 024510 (2006).
- [23] Lu Li, Yayu Wang, Seiki Komiya, Shimpei Ono, Yoichi Ando, G. D. Gu, and N. P. Ong, Diamagnetism and Cooper pairing above in cuprates, Phys. Rev. B 81, 054510 (2010).
- [24] Panpan Zhou, Liyang Chen, Yue Liu, Ilya Sochnikov, Anthony T. Bollinger, Myung-Geun Han, Yimei Zhu, Xi He, Ivan Božović and Douglas Natelson Electron pairing in the pseudogap state revealed by shot noise in copper oxide junctions, Nature 572, 493–496 (2019).
- [25] H. Takagi, B. Batlogg, H. L. Kao, J. Kwo, R. J. Cava, J. J. Krajewski, and W. F. Peck, Jr. Systematic evolution of temperature-dependent resistivity in La2-xSrxCuO4, Phys. Rev. Lett. 69, 2975 (1992).
- [26] T. Ito, K. Takenaka, and S. Uchida, Systematic deviation from T-linear behavior in the in-plane resistivity of YBa2Cu3O7-y: Evidence for dominant spin scattering, Phys. Rev. Lett. 70, 3995 (1993).
- [27] T. Timusk and B. Statt, The pseudogap in high–temperature superconductors: An experimental survey. Rep. Prog. Phys. 62, 61-122 (1999).
- [28] A. A. Kordyuk, Pseudogap from ARPES experiment: Three gaps in cuprates and topological superconductivity, Low Temp. Phys. 41, 319 (2015).
- [29] Ch. Renner,B. Revaz, J.-Y. Genoud, K. Kadowaki,and Ø. Fischer, Pseudogap precursor of the superconducting gap in under- and overdoped Bi2Sr2CaCu2O8+δ, Phys. Rev. Lett., 80 149 (1998).
- [30] R. Sekine, S. J. Denholme, A. Tsukada, S. Kawashima, M. Minematsu,T. Inose, S. Mikusu, K. Tokiwa, T. Watanabe, and N. Miyakawa, Characteristic features of the mode energy estimated from tunneling conductance on TlBa2Ca2Cu3O8.5+δ, J. Phys. Soc. Jpn. 85, 024702 (2016).
- [31] N. Miyakawa, J. F. Zasadzinski, L. Ozyuzer, P. Guptasarma, D. G. Hinks, C. Kendziora, and K. E. Gray, Predominantly Superconducting Origin of Large Energy Gaps in Underdoped Bi2Sr2CaCu2O8+δ from Tunneling Spectroscopy, Phys. Rev. Lett. 83, 1018 (1999).
- [32] Akira Sugimoto, Hironori Ohtsubo, Kaito Matsumoto, Satoru Ishimitsu, Masatoshi Iwano, Toshikazu Ekino, and A M Gabovic, Tunneling STM/STS and break-junction spectroscopy of the Pb-doped Bi2223 superconductor, J. Phys.: Conf. Ser. 1975, 012005 (2021).
- [33] Andrea Damascelli, Zahid Hussain, and Zhi-Xun Shen, Angle-resolved photoemission studies of the cuprate superconductors, Rev. Mod. Phys. 75, 473 (2003).
- [34] Utpal Chatterjee, Dingfei Ai, Junjing Zhao, Stephan Rosenkranz, Adam Kaminski, Helene Raffy, Zhizhong Li, Kazuo Kadowaki, Mohit Randeria, Michael R. Norman, and J. C. Campuzano, Electronic phase diagram of high-temperature copper oxide superconductors, PNAS 108, 9346-9349 (2011).
- [35] H. Anzai, A. Ino, M. Arita, H. Namatame, M. Taniguchi, M. Ishikado, K. Fujita, S. Ishida and S. Uchida, Relation between the nodal and antinodal gap and critical temperature in superconducting Bi2212, Nature Communications 4, 1815 (2013).
- [36] Teppei Yoshida, Makoto Hashimoto, Inna M. Vishik, Zhi-Xun Shen, and Atsushi Fujimori, Pseudogap, Superconducting Gap, and Fermi Arc in High-Tc Cuprates Revealed by Angle-Resolved Photoemission Spectroscopy, J. Phys. Soc. Jpn. 81, 011006 (2012).
- [37] Makoto Hashimoto, Inna M. Vishik, Rui-Hua He, Thomas P. Devereaux and Zhi-Xun Shen, Energy gaps in high-transition-temperature cuprate superconductors, Nature Physics 10, 483 (2014).
- [38] Tohru Nakano, Naoki Momono, Migaku Oda, and Masayuki Ido, Correlation between the Doping Dependences of Superconducting Gap Magnitude and Pseudogap Temperature in High-Tc Cuprates , J. Phys. Soc. Jpn. 67, 2622-2625 (1998).
- [39] I.M. Vishik, Photoemission perspective on pseudogap, superconducting fluctuations, and charge order in cuprates: a review of recent progress. Reports On Progress in Physics. Physical Society (Great Britain) 81, 062501 (2018).
- [40] Y.-G. Zhong, J.-Y. Guan, X. Shi, J. Zhao, Z.-C. Rao, C.-Y. Tang, H.-J. Liu, Z. Y. Weng, Z. Q. Wang, G. D. Gu, T. Qian, Y.-J. Sun, and H. Ding, Continuous doping of a cuprate surface: Insights from in situ angle-resolved photoemission Phys. Rev. B 98, 140507(R) (2018).
- [41] J. Chang, B. J. Ramshaw, D. A. Bonn, W. N. Hardy, R. Liang, J.–Q. Yan, J.-G. Cheng, J.–S. Zhou, J. B. Goodenough, S. Pyon, T. Takayama, H. Takagi, N. Doiron-Leyraud, and Louis Taillefer, Pseudogap temperature of cuprate superconductors from the Nernst effect O. Cyr-Choinir̀e, R. Daou, F. Laliberté, C. Collignon, S. Badoux, D. LeBoeuf, Phys. Rev. B 97, 064502 (2018).
- [42] S. H. Naqib, J. R. Cooper, J. L. Tallon, C. Panagopoulos, Temperature dependence of electrical resistivity of high– cuprates–from pseudogap to overdoped regions, Physica C 387,365 (2003).
- [43] Neven Barisic, Mun K Chan, Yuan Li, Guichuan Yu, Xudong Zhao, Martin Dressel, Ana Smontara, Martin Greven, Universal sheet resistance and revised phase diagram of the cuprate high-temperature superconductors, Proc Natl Acad Sci 110, 12235-40 (2013).
- [44] E. Sterpetti, J. Biscaras, A. Erb and A. Shukla, Comprehensive phase diagram of two-dimensional space charge doped Bi2Sr2CaCu2O8+x, Nat. Commun. 8, 2060 (2017).
- [45] J. L. Tallon and J.W. Loram, The doping dependence of - what is the real high- phase diagram?, Physica C 349, 53 (2001).
- [46] S. H. Naqib and R. S. Islam, Extraction of the pseudogap energy scale from the static magnetic susceptibility of single and double CuO2 plane high-Tc cuprates,Supercond. Sci. Technol. 21, 105017 (2008).
- [47] J. L. Tallon, J. W. Loram, G. V. M. Williams, J. R. Cooper, I. R. Fisher, J.D. Johnson, M.P. Staines and C Bernhard, Critical Doping in Overdoped High-Tc Superconductors: a Quantum Critical Point?, phys. stat. sol. (b) 215, 531 (1999).
- [48] Y. Noat, A. Mauger, M. Nohara, H. Eisaki, W. Sacks, Cuprates phase diagram deduced from magnetic susceptibility: what is the ’true’ pseudogap line?, Solid State Communications 348–349, 114689 (2022).
- [49] David C. Johnston, Magnetic Susceptibility Scaling in La2-xSrxCuO4-y, Phys. Rev. Lett. 62, 957 (1989).
- [50] J. B. Torrance, A. Bezinge, A. I. Nazzal, T. C. Huang, S. S. P. Parkin, D. T. Keane, S. J. LaPlaca, P. M. Horn, and G. A. Held, Properties that change as superconductivity disappears at high-doping concentrations in La2-xSrxCuO4, Phys. Rev. B 40, 8872 (1989).
- [51] R. Yoshizaki, N. Ishikawa, H. Sawada, E. Kita, A. Tasaki, Magnetic susceptibility of normal state and superconductivity of La2-xSrxCuO4, Physica C 166, 417 (1990).
- [52] M. Oda, T. Nakano, Y. Kamada, M. Ido, Electronic states of doped holes and magnetic properties in La2-xMxCuO4 (M = Sr, Ba), Physica C 183, 234 (1991).
- [53] T. Nakano, M. Oda, C. Manabe, N. Momono, Y. Miura, and M. Ido, Magnetic properties and electronic conduction of superconducting La2-xSrxCuO4, Phys. Rev. B 49, 16000 (1994).
- [54] M. E. Lines, The quadratic-layer antiferromagnet, J. Phys. Chem. Solids . 31, 101 (1970).
- [55] Tomoharu Suda and Takao Morinari, Destruction of Magnetic Long–Range Order by Hole-Induced Skyrmions in Two-Dimensional Heisenberg Model, J. Phys. Soc. Jpn. 85, 114702 (2016).
- [56] W. Sacks, A. Mauger and Y. Noat, Cooper pairs without glue in high- superconductors: A universal phase diagram, Euro. Phys. Lett 119, 17001 (2017).
- [57] R. J. Birgeneau, D. R. Gabbe, H. P. Jenssen, M. A. Kastner, P. J. Picone, T. R. Thurston, G. Shirane, Y. Endoh, M. Sato, K. Yamada, Y. Hidaka, M. Oda, Y. Enomoto, M. Suzuki, and T. Murakami, Antiferromagnetic spin correlations in insulating, metallic, and superconducting La2-xSrxCuO4, Phys. Rev. B 38, 6614 (1988).
- [58] Efstratios Manousakis, The spin-1/2 Heisenberg antiferromagnet on a square lattice and its application to the cuprous oxides, Rev. Mod. Phys. 63, 1 (1991).
- [59] C. Proust and L. Taillefer, The Remarkable Underlying Ground States of Cuprate, Annual Review of Condensed Matter Physics 10, 409 (2019).
- [60] Ravi P. Singh, Z. C. Tao, and M. SinghRavi P. Singh, Z. C. Tao, and M. Singh, Role of antiferromagnetic interlayer coupling on magnetic properties of YBa2Cu3O6+x, Phys. Rev. B 46, 1244 (1992).
- [61] M. Le Tacon, M. Minola, D. C. Peets, M. Moretti Sala, S. Blanco-Canosa, V. Hinkov, R. Liang, D. A. Bonn, W. N. Hardy, C. T. Lin, T. Schmitt, L. Braicovich, G. Ghiringhelli, and B. Keimer, Dispersive spin excitations in highly overdoped cuprates revealed by resonant inelastic x-ray scattering, Phys. Rev. B 88, 020501(R) (2013).
- [62] Y. Y. Peng, E. W. Huang, R. Fumagalli, M. Minola, Y. Wang, X. Sun, Y. Ding, K. Kummer, X. J. Zhou, N. B. Brookes, B. Moritz, L. Braicovich, T. P. Devereaux, and G. Ghiringhelli, Dispersion, damping, and intensity of spin excitations in the monolayer (Bi,Pb)2(Sr,La)2CuO6+δ cuprate superconductor family, Phys. Rev. B 98, 144507 (2018).
- [63] M. P. M. Dean, G. Dellea, R. S. Springell, F. Yakhou-Harris, K. Kummer, N. B. Brookes, X. Liu, Y-J. Sun, J. Strle, T. Schmitt, L. Braicovich, G. Ghiringhelli, I. Bovžović and J. P. Hill, Persistence of magnetic excitations in La2-xSrxCuO4 from the undoped insulator to the heavily overdoped non-superconducting metal, Nature Materials 12, 1019 (2013).
- [64] W. Sacks, A. Mauger, Y. Noat, Pair – pair interactions as a mechanism for high-Tc superconductivity, Superconduct. Sci. Technol., 28 105014 (2015).
- [65] M. Saint Jean, C. Even and C. Guthmann, Macroscopic 2D Wigner islands, Eur. Phys. Lett., 55, 45 (2001).
- [66] W. Sacks, A. Mauger and Y. Noat, Origin of the Fermi arcs in cuprates: a dual role of quasiparticle and pair excitations, Journal of Physics: Condensed Matter, 30, 475703 (2018).
- [67] Y. Noat, A. Mauger, M. Nohara, H. Eisaki, W. Sacks , How ‘pairons’ are revealed in the electronic specific heat of cuprates, Solid State Communications 323, 114109 (2021).
- [68] I. M. Vishik, M. Hashimoto, R.-H. He, W.-S. Lee, F. Schmitt, D. Lu, R. G. Moore, C. Zhang, W. Meevasana, T. Sasagawa, S. Uchida, Kazuhiro Fujita, S. Ishida, M. Ishikado, Y. Yoshida, H. Eisaki, Z. Hussain, T. P. Devereaux, and Z.-X. Shen, Phase competition in trisected superconducting dome, PNAS 109, 18332 (2012).
- [69] R. Liang, D. A. Bonn, and W. N. Hardy, Evaluation of CuO2 plane hole doping in YBa2Cu3O6+x single crystalsPhys. Rev. B 73, 180505 (2006).
- [70] M. Saint Jean, C. Guthmann and G. Coupier, Relaxation and ordering processes in“macroscopic Wigner crystals”, Eur. Phys. J. B 39, 61-68 (2004).
- [71] M. Tanemura, Statistical distributions of Poisson Voronoi cells in two and three dimensions, Forma 18, 221 (2003).
- [72] Járai-Szabó Ferenc, Zoltán Néda, On the size–distribution of Poisson Voronoi cells, Physica A, 385, pp 518-526 (2007).
- [73] S. H. Pan, E. W. Hudson, A. K. Gupta, K.-W. Ng, H. Eisaki, S. Uchida, and J. C. Davis, STM Studies of the Electronic Structure of Vortex Cores in Bi2Sr2CaCu2O8+δ, Phys. Rev. Lett. 85, 1536 (2000).
- [74] W. Sacks, T. Cren, D. Roditchev, and B. Douçot, Quasiparticle spectrum of the cuprate Bi2Sr2CaCu2O8+δ: Possible connection to the phase diagram, Phys. Rev. B 74, 174517(2006).
- [75] William Sacks, Alain Mauger and Yves Noat, Universal spectral signatures in pnictides and cuprates: the role of quasiparticle-pair coupling, J. Phys.: Condens. Matter 29, 445601 (2017).
- [76] T. Cren, D. Roditchev, W. Sacks and J. Klein, Constraints on the quasiparticle density of states in high-Tc superconductors, , Europhys. Lett. 52, 203 (2000).
- [77] R. C. Dynes, V. Narayanamurti, and J. P. Garno, Direct Measurement of Quasiparticle-Lifetime Broadening in a Strong-Coupled Superconductor,, Phys. Rev. Lett. 41, 1509 (1978).
- [78] T. Cren, D. Roditchev, W. Sacks, J. Klein, J.-B. Moussy, C. Deville-Cavellin, and M. Lagués, Influence of Disorder on the Local Density of States in High- Superconducting Thin Films, Phys. Rev. Lett. 84, 147 (2000).
- [79] C. Howald, P. Fournier, and A. Kapitulnik, Inherent inhomogeneities in tunneling spectra of Bi2Sr2CaCu2O8-x crystals in the superconducting state, Phys. Rev. B 64, 100504(R) (2001).
-
[80]
∗ Corresponding author.
E-mail address: yves.noat@insp.jussieu.fr (Y. Noat).