First-Principles Screening of Metal-Organic Frameworks for Entangled Photon Pair Generation
Abstract
The transmission of strong laser light in nonlinear optical materials can generate output photons sources that carry quantum entanglement in multiple degrees of freedom, making this process a fundamentally important tool in optical quantum technology. However, the availability of efficient optical crystals for entangled light generation is severely limited in terms of diversity, thus reducing the prospects for the implementation of next-generation protocols in quantum sensing, communication and computing. To overcome this, we developed and implemented a multi-scale first-principles modeling technique for the computational discovery of novel nonlinear optical devices based on metal-organic framework (MOF) materials that can efficiently generate entangled light via spontaneous parametric down-conversion(SPDC). Using collinear degenerate type-I SPDC as a case study, we computationally screen a database of 114,373 synthesized MOF materials to establish correlations between the structure and chemical composition of MOFs with the brightness and coherence properties of entangled photon pairs. We identify a subset of 49 non-centrosymmetric mono-ligand MOF crystals with high chemical and optical stability that produce entangled photon pairs with intrinsic correlation times fs and pair generation rates in the range s-1mW-1mm-1 at 1064 nm. Conditions for optimal type-I phase matching are given for each MOF and relationships between pair brightness, crystal band gap and optical birefringence are discussed. Correlations between the optical properties of crystals and their constituent molecular ligands are also given. Our work paves the way for the computational design of MOF-based devices for optical quantum technology.
Keywords: Metal-Organic Frameworks, Spontaneous Parametric Down Conversion, Entangled Photons, Energy-Time Entanglement
1 Introduction
Entangled photon pair generation is a fundamental technique in quantum optics and quantum information science [1, 2, 3, 4, 5]. Correlations between entangled photons can be exploited in various applications, such as quantum teleportation [2], quantum computing, quantum cryptography [6, 7, 8, 9], and quantum imaging [10, 11, 12]. Spontaneous parametric down-conversion (SPDC) is a widely used method for generating entangled photon pairs. SPDC occurs when a high intensity laser pump () interacts with a nonlinear crystal and, as a result of the interaction, pairs of low energy photons are spontaneously generated. The pair components are denoted signal() and idler() [13]. The output photons must obey conservation relationship in terms of their angular frequencies and wave vectors ( = + , = + ) [13, 14]. The SPDC process can be divided into types, degeneracy and direction. In type-I SPDC, the generated photons have the same polarization while in type-II, the output photons have orthogonal polarization. The system is collinear if the photons have the same propagation direction as the pump and non-collinear if they propagate in different directions. Figure 1 shows a schematic diagram of the SPDC process, highlighting energy and momentum conservation. SPDC ( ) and second harmonic generation ( ) are conjugate processes in nonlinear optics which differ on how they are experimentally implemented [13]. For a material to be SPDC efficient and have high performance over a wide range of bandwidths, it should have high nonlinear susceptibility, suitable phase matching, group velocity mismatch (GVM) for spectral purity [15], optical transparency (high band gap), thermal stability and be suitable for practical operation (low cost, availability, ease of use).

The ability of nonlinear optical materials to be phase matchable depends on whether they belong to non-cubic crystal classes or not. Birefringence phase matching (BPM depends on the difference of refractive indices at specific wavelengths and is only possible for anisotropic crystal systems (non-cubic). The non-cubic crystal class is divided into groups: biaxial and uniaxial [13]. Triclinic, monoclinic and orthorhombic crystal systems are biaxial, and trigonal, tetragonal and hexagonal are uniaxial. In terms of refractive indices, uniaxial crystals have = and biaxial crystals have . For non-linear optical (NLO) applications it is important that the crystal is non-centrosymmetric (NCS) as they have non-zero second order non-linear susceptibility tensor () which defines the efficiency of the process [13]. Uniaxial and biaxial crystals can be further divided into crystal class and the list of all the crystal classes which are NCS is known.
The effective non-linearity, , obtained by contracting the with the field polarization of suitable birefringence phase matching condition, is an intrinsic property of materials and plays a crucial role in developing modern optical devices as well as entangled photon sources with high brightness (number of entangled photons) [16]. The brightness of the signal scales as the square of , linearly with the pump power, and linearly with propagation length () [17, 18] when crystals have a random orientation (powder) and scales as for a single crystals. The effective non-linearity is affected by several material factors such as the electronic structure, chemical composition, optical properties, microstructure, temperature and pressure [19, 9, 20, 21, 22, 23, 24, 25, 26, 27].
BBO, LiNbO3, KDP and other leading materials [28, 29, 30], have been experimentally realized for nonlinear optical process but have relative disadvantages such as absence of electron delocalization, and the inability to adjust their structures [31]. Organic materials have been proposed to resolve these deficiencies but they lack good mechanical strength and thermal stability. Metal-organic frameworks (MOFs) are hybrid materials consisting of metal ions or clusters coordinated to organic ligands to form 1D, 2D or 3D structures, which have shown promise for nonlinear optical process as they can combine the benefits of inorganic and organic compounds [32, 33]. MOFs offer interesting possibilities in terms of synthesis of new structures with high flexibility and tunability, which allows for the optimization of their optical properties. The organic linkers in MOFs can be tuned to achieve a large nonlinear optical response and the metal centers can provide high degree of anharmonicity, which can significantly enhance the nonlinear optical response [19, 31]. MOFs offer high surface area, and are stable under various conditions and can be synthesized with a high degree of control over their size, shape and functionality. Several MOF structures have been experimentally synthesized and some of them have already shown potential to be used in nonlinear optics [34, 35, 36, 37, 38, 39, 40, 41]. A recent publication reports the experimental demonstration of three-wave and four-wave mixing processes using millimeter-scale MOF single crystal with well-defined phase matching properties [42]. The competitive optical nonlinearities of several polycrystaline MOF samples have stimulated the need to develop a robust computational methodology to screen the MOF databases to understand the structure-property relationship to identify and design potential MOF crystals that are promising.
In previous work, we developed a multi-scale methodology to compute entangled photon pair properties for uniaxial MOF crystals [16]. We have also shown that the types of ligand and their arrangement can significantly affect the entangled photon pair properties [43]. In this work, we extend our methodology to take into account the calculation of for biaxial crystals with appropriate phase matching condition, GVM, spectral acceptance bandwidth, photon correlation () function and counting rate of entangled photon pairs for the collinear type-I degenerate SPDC. We have carried out high-throughput screening of MOFs with zinc as a metal and one-type of ligand to understand how different structures affect the properties of the entangled photon source. We have selected mono-ligand MOFs with d10 metals, specifically Zn, because of its abundance within the MOF structure database. Also, Based on our results, we provide design rules which can be used to develop new materials which are highly SPDC efficient.
2 Methods
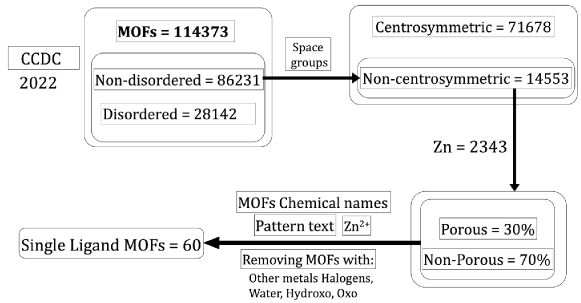
MOF selection criteria and computational details: Figure 2 shows the flowchart of the MOF filter. After applying the selection criteria, we obtained a database of mono-ligand MOFs with Zn as a metal. All the MOFs in our database are experimentally synthesized and they come the Cambridge Crystallographic Data Center (CCDC).
We used VESTA [44] to manipulate and clean the original cif file, which was obtained from the CCDC. The software suite ISOTROPY [45] was used to identify the space group of MOF crystals. All the crystal structures were optimized using POB-DZVPP basis set with shrink points 3 3 and TOLINTEG 12 12 12 12 18. We also added DFT-D version 4 for the dispersion correction. We used solid-state DFT within the Coupled Perturbed Hartree-Fock/Kohn-Sham method (CPHF/KS) [46, 47] with a PBE functional to compute the dynamical dielectric tensor and the dynamical second-order susceptibility tensor of the optimized structures. We have used CRYSTAL17 [48] package to carry out all the DFT calculations. We benchmarked these methods in previous work [16]. We also used available KDP and BBO data to compare as an additional benchmark. The TOLINTEG and SHRINK points sampling were also done to check the energy convergence. Also, the same DFT method was used in previous works for optical measurement of MIRO-101 single crystal [41] and to study the affect of arrangement of ligands and temperature on entangled photon pair properties [43].
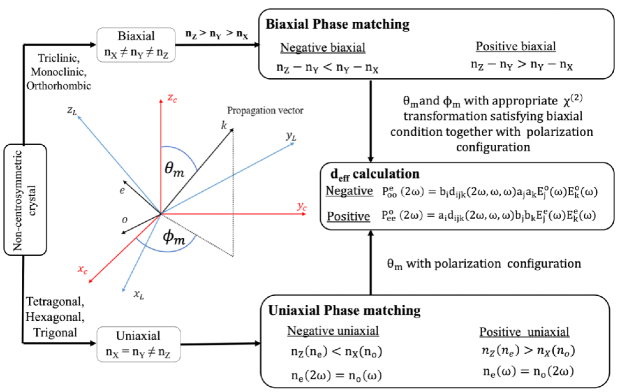
Effective nonlinearity estimation: The estimation of the effective non-linearity () of a given crystal is carried out in the orthogonal coordinate system X Y Z in which the dielectric tensor is diagonal. A crystal is considered uniaxial (with optic axis Z) if = , and biaxial (with the optic axis in the plane XZ) if , and one of two relations being fulfilled: , or , where = , = , = are the principal values of the refractive indices. For some biaxial crystals (crystal class 1, 2 and m), the dielectric matrix is not diagonalizable [13]. In those cases, the trace of dielectric matrix gives the refractive indices.
Uniaxial and biaxial crystals can be further divided into positive or negative as discussed in the Supporting Information (SI) section 1. For biaxial crystals, it is possible that the principal values of refractive indices in the crystallographic frame () are different than the crystallophysical frame (). Crystallophysical, optical and dielectric frame represent the same concept. Among many widely used crystals such as KTP, KNbO3, LBO [49], BiBO [50] and -HIO3, the coordinate system and can coincide or misconcide. In KTP, the coordinate systems coincide and we can designate the coincidence as whereas for LBO, the assignment is commonly used [49]. It is important to do the necessary transformation of the crystallographic frame () to satisfy the biaxial condition [49, 51] ( ) and then calculate the for different polarization configurations after doing the necessary transformation of the tensor. was estimated using a specific configuration by contracting the full second-order polarizability tensor at the phase matching angles for different crystal structures. Figure 3 shows the flowchart for calculating of any given crystal. Detailed description for calculating birefringence, phase matching angles, , , and number of entangled photons can be found in SI section 1. Data and code are available on GitHub (Codes and data) for reproducibility. Although we have explored birefringence phase matching in our study, the MOF crystals used in our study can be explored for periodic pooling during crystal growth or using other techniques which can achieve quasi-phase matching and can much more efficient. Other types of phase matching can be used for efficient SPDC where materials lack birefringence and are non-linear or domain-disordered [52].
GVM between signal and pump is important for the spectral purity which is important for heralded single photon sources and entangled photon sources [15]. We have estimate GVM = for all our MOF crystals [53, 54], where is the group velocity of the signal and is the group velocity of pump. More details on calculating GVM can be found in SI section 5.
An important feature for applications of entangled photon pairs is the correlation time between the two generated photons (). This parameter can be defined as the full width at half maximum (FWHM) of the correlation function. This correlation function not only depends on the crystal properties, but also on the properties of the experimental set-up such as the bandwidth of the detector [55, 53]. For type-I SPDC the function can be written as
| (1) |
where correspond to a small detuning frequency from the perfect phase matching, is the group velocity dispersion (GVD), is the crystal length and is the bandwidth of the detector. We have used single crystal length of 1 mm for our calculations. We chose to normalize the correlation function because the correlation time of the two generated photons does not depend on the amplitude of the function; instead, it relies solely on the full-width at half maximum (FWHM) of the function. In that way we can directly compare plots to determine which crystal exhibits a wider correlation function, indicating a longer correlation time.
We also assume a Gaussian model for the transverse field profile of the pump and the two generated photons (signal and idler), collecting the down-converted light into single-mode fibers such that the transverse width of the two generated photons is the same . The single-mode counting rate for photon pairs generated by type-I SPDC is given by [56]
| (2) |
where and are the transverse width of the Gaussian profiles associated with the pump and signal or idler photon respectively. and are the signal and idler refractive indices, and correspond to the group indices of the signal and idler frequency. is the velocity of the light, is proportional to the monochromatic pump beam peak magnitude , and is the amount of power delivered by a Gaussian pump beam. The phase mismatch is given by
| (3) |
where correspond to the frequency of the signal and idler photon and is the fixed pump frequency.
We have used the pump wavelength of 532 nm for our study and MOFs whose band gap is greater than 2.33 eV. This is to ensure that there is no absorbance at 532 and 1064 nm. After applying the selection criteria on the band gap, we found 49 MOFs that are suitable for this study with exception of ECIWAO whose band gap is 2.28 eV.
3 Results and discussions
Birefringence ( = - ) plays a crucial role in achieving phase-matching conditions for nonlinear materials. The variations in for all the crystals used in our study are depicted in Fig. 4A. The MOF crystal AQOROP has the highest and ONOCOL01 has the smallest value. Details about crystal class, band gap and birefringence are shown in SI section 2.
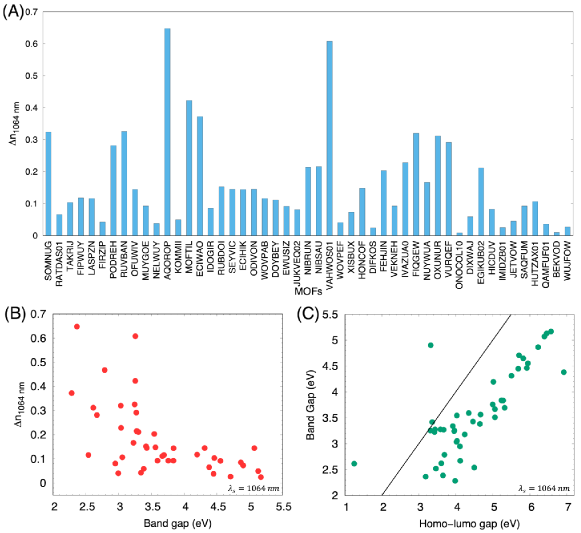
Figure 4B illustrates the relationship between and the band gap for different crystals. We find that decreases with increased band gap. Furthermore, Fig. 4C displays the correlation between the HOMO-LUMO gap of the ligand monomers and the band gap the crystals that contain these ligands. A strong correlation is evident, indicating that HOMO-LUMO gap influences the band gap of the crystal, including a red shift that results from interactions within the crystal. This observation serves as a valuable design criterion for crystals and provides the ability to control the band gap. The ability to control the band gap is very important, particularly in getting transparent crystals. Moreover, holds a key role in achieving phase matching over a wider bandwidth. These features are critical for the advancement of efficient nonlinear optical materials. The careful selection of ligands emerges as a powerful tool to fine-tune these optical properties for desired specifications.
The observations discussed above can be explained by considering the polarizability (). Polarizability refers to the ease with which the electron cloud of a material can be distorted by an external electric field and is directly linked to the refractive index. A material with higher polarizability, indicating a greater ability for charge separation, will have a higher refractive index and higher [57]. Charge separation and delocalization of electrons are closely related to each other. Highly delocalized electrons lead to higher polarizability which affects the refractive index and . Furthermore, electron delocalization affects the HOMO-LUMO gap for ligand molecules and the crystal band gap. Higher delocalization of electrons, gives smaller band gaps [58]. Therefore, the energy gap and birefringence are inversely related to each other.
Birefringence and phase-matching are related with each other. An increase in birefringence increases the phase-matching wavelength range which can significantly affect the nonlinear efficiency. It should be noted that if birefringence is too large, serious walk-off effect can occur and nonlinear efficiency can significantly decrease even if the nonlinear coefficients are higher [59, 14]. If the birefringence is too small, phase-matching will not occur. We have calculated the phase-matching angles of all the crystals depending on whether a crystal is uniaxial or biaxial at 1064 nm (see Method section). We benchmarked our method by reproducing phase-matching angles calculations for KTP [60] and BiBO [50, 61] as shown in SI section 3.
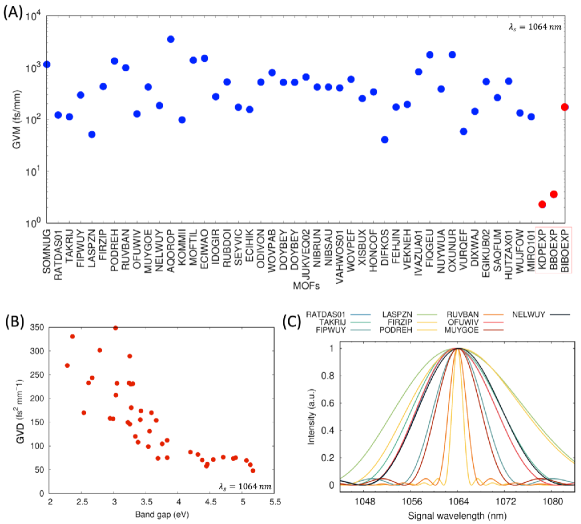
Dispersive properties of nonlinear crystals: Nonlinear crystals dispersive properties are of great importance in the femtosecond pumping regime. This is due to their effects on the pulse width, the effective interaction length of the pump pulses, and the conversion efficiency. Temporal walk-off given by GVM and temporal broadening given by GVD impose limits on the applicability of crystal length [62]. We have estimated the GVM [54, 63] and Group velocity dispersion (GVD) for the crystals used in our study. Figure 5A shows the GVM of all the crystals at a signal wavelength of 1064 nm. We have also included GVM of KDP, BBO, and BiBO using the experimental data [64, 65, 66] and are shown in Fig. 5A as KDPEXP, BBOEXP, and BiBOEXP. Figure 5B shows the GVD of all the MOFs as a function of the band gap. We observe that the GVD decreases with an increasing band gap. Figure 5C shows the spectral acceptance bandwidth of the phenomenon at a signal wavelength ( = 1064 nm) using the joint spectral function for crystals belonging to crystal class 2. Details about calculating GVM, GVD, and spectral acceptance bandwidth are discussed in SI section 5. We have also included the spectral acceptance bandwidth plots of different crystal classes and GVM as a function of signal wavelength using the experimental refractive indices data of KDP, BBO, and BiBO, including the calculated BiBO GVM, in SI section 5.
For NLO materials to be technologically useful, it is not enough for a material to be highly efficient at a given wavelength but also should be phase matchable. The phase matching angle together with the tensor determine the of the crystal. Figure 6A shows the overlay of possible phase matching angles, shown with black lines, with the 2D map of for all the and for a WOVPAB crystal belonging to crystal class 222. It is important to note that although some combination of and can give high , those angles may not be accessible due to phase-matching conditions. Figure 6B shows the phase matching angles ( and ) of biaxial crystals belonging to crystal class 222. We observe that although the crystals belong to the same crystal class, they have very different phase-matching angular profiles.
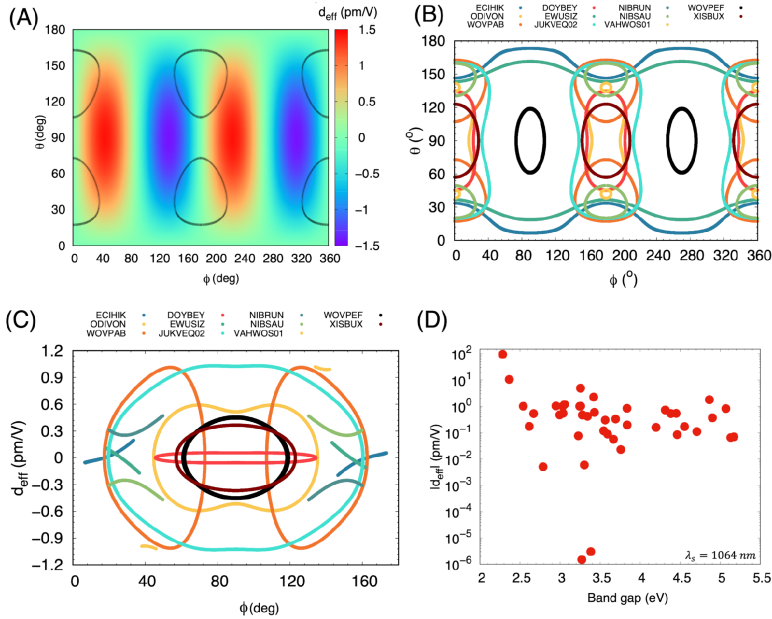
The effective non-linearity is an intrinsic property of a materials and plays a crucial role in developing modern optical devices as well as entangled photon sources with high brightness (number of entangled photons). The source brightness scales with , and is used to parameterize the effective Hamiltonian for the SPDC process. In order to calculate at 1064 nm for different crystals, we have divided MOFs into uniaxial and biaxial classes. We have used the phase matching condition to find phase matching angles, for uniaxial, and and for biaxial at 1064 nm, and used the appropriate polarization configuration to find the (see Method Section and SI Section 2 for transformation between crystallophysical and crystallographic frame to satisfy biaxial condition). The calculated for all the MOFs used in our study are given in SI Section 4. Figure 6C shows as function of ( is not shown for clarity) for MOF crystals belonging to crystal class 222. The sign of is unimportant and it is the profile of that dictates the conversion efficiency along a given phase matching direction. Phase matching angles () of all the uniaxial crystals are shown in SI Section 2 and phase matching angles ( and ) of all the biaxial crystals used in our study are shown in the SI Section 3.
Figure 6D shows the absolute maximum value of of all the crystal as a function of their band gaps. We observe that decreases with increasing band gap. This is because materials with smaller band gaps enable greater degree of overlap between the wavefunctions of electrons and holes and leads to a higher probability on nonlinear optical interactions which can significantly affect the efficiency of the non-linear process. Materials with smaller band gaps lead to higher nonlinearities as compared to higher band gap because their electronic structures enable a greater degree of optical mixing and frequency conversion. We also observe that MOF crystals belonging to crystal class (uniaxial crystal) have = 0 pm/V (see Fig. 6D) although it has small as shown in Fig. S2. This agrees well with the literature as crystals belonging to the 422 crystal class will have vanishing if Kleinman’s symmetry is valid [67, 68].
Entangled photon pair properties: The () intensity correlation function gives the probability of detecting two-photon pairs at different time and (see Method section for more details). Figure 7A shows the schematic of coincidence setup for measuring the two-time correlation function . Figure 7B shows for some of the MOFs used in this study (see SI Section 4 all the MOFs ). The FWHM of gives the pair correlation time (). Figure 7C shows as function of band gap for all the crystals. We observe that decreases with increasing band gap. This is due to higher and smaller degrees of overlap between the wavefunctions of electrons and holes for smaller and larger band gaps. The degree of correlation between the generated photons is relevant in applications such as quantum computing, quantum key distribution, quantum teleportation, and quantum cryptography [6, 7, 9, 2]. The calculated correlation time for all the MOF crystals are in femtosecond range which is extremely challenging to measure them using photodetectors as they have resolution in picosecond regime. The fiber optics play a key role in making correlation time larger to nanoseconds from femtoseconds [69, 55]. We find that AQOROP ( fs), ECIWAO ( fs) and MOFTIL ( fs) have the largest autocorrelation times.
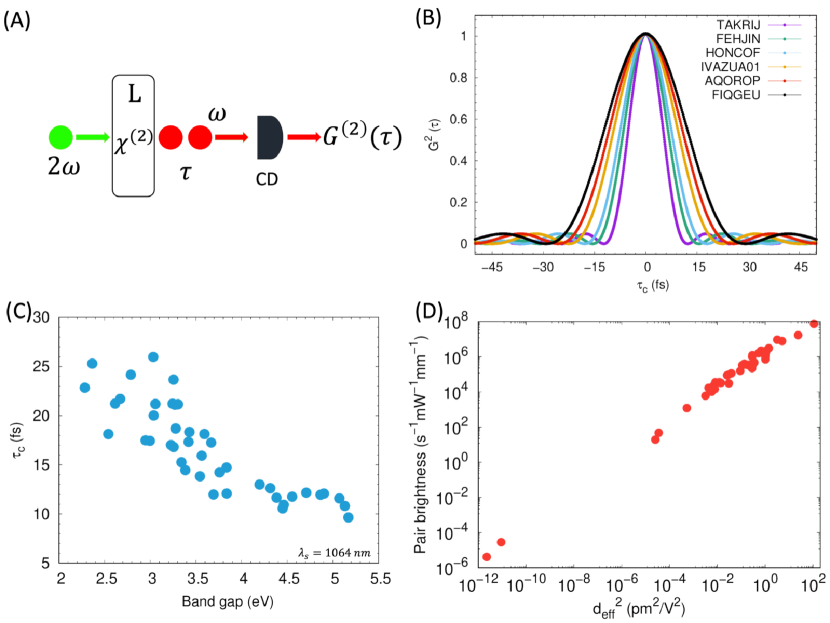
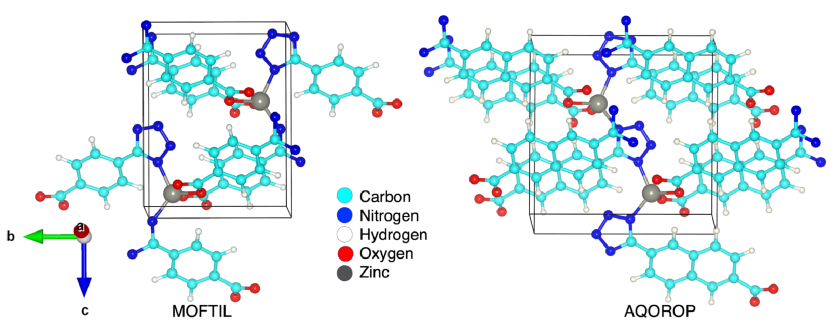
The number of entangled photon pairs generated in SPDC is an important parameter for entanglement-based applications [53]. Figure 7D shows the number of entangled photon pairs generated by all the crystals as function of their . We found that AQOROP ( s-1 mW-1 mm-1), ECIWAO ( s-1 mW-1 mm-1) and MOFTIL ( s-1 mW-1 mm-1) have the largest photon conversion rates. Figure 8 shows the components of AQOROP and MOFTIL MOF crystals.
All the results discussed above are with signal wavelength of 1064 nm. From all the crystals we have used in our study, we could not estimate for QAMFUF01 and BEKVOD crystals although they have high as shown in Figs. S3 and S4, because we were not able to find any phase matching angle at 1064 nm.
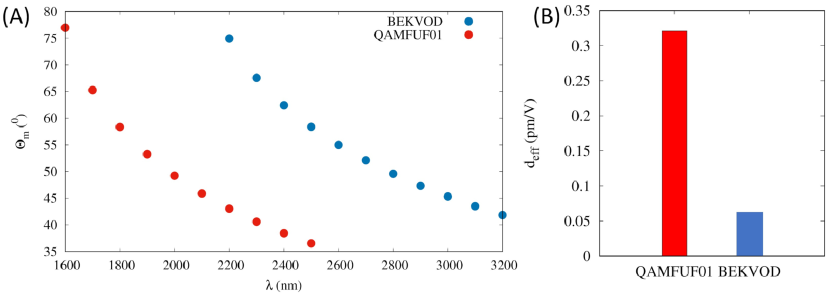
In order for these crystals to be phase-matchable, we plotted the phase-matching angle as a function of wavelength. Figure 9A shows how changes with signal wavelength for QAMFUF01 (1600 - 2500 nm) and BEKVOD (2200 - 3200 nm). We then calculated for QAMFUF01 and BEKVOD crystals at 1600 and 2200 nm. Figure 9B shows the of these two crystals at 1600 and 2200 nm.
Having nonlinear optical materials to be operational over wider bandwidth is an important requirement for photonics application. We have shown in Table LABEL:table1 how the photon conversion rate is affected as a function of pump wavelength. We chose MOFTIL because it is the best crystal for entangled photon sources with pair conversion rate of s-1 mW-1 mm-1, and birefringence of 0.42 at 1064 nm and band gap of 3.2 eV. We observe that and entangled photon pairs decrease with increasing pump wavelength (decreasing photon energy).
| MOF | (nm) (=/2) | (pm/V) | R (s-1mW-1mm-1) | (fs) | GVM (fs/mm) |
| MOFTIL | 909 | 6.24 | 31.36 | 26.63 | 2615.67 |
| 1064 | 4.88 | 16.13 | 23.66 | 1410.07 | |
| 1100 | 4.70 | 14.32 | 23.11 | 1269.64 | |
| 1546 | 3.61 | 5.42 | 18.61 | 480.95 |
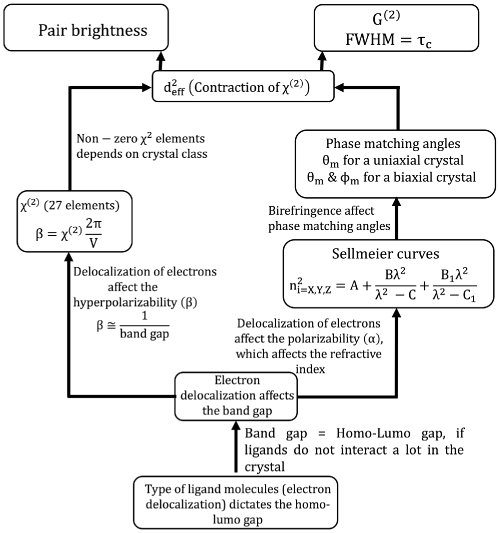
In summary, the band gap, birefringence, signal wavelength, phase matching angles, effective non-linearity (contracted form of tensor), number of entangled photons are correlated with each other. Figure 10 shows how all of these quantities are interrelated and how these correlation can be exploited for designing new materials which will be SPDC efficient.
4 Conclusion
We have successfully explored MOF database for mono-ligand MOFs with Zn as a metal center for generating entangled light via collinear degenerate Type-I SPDC. All the MOFs in our database is experimentally synthesized and come from CCDC after applying MOF filter as discussed in the method section. We have systematically developed and implemented a multiscale computational technique to the selected MOFs (uniaxial or biaxial) to identify the features that are important for high brightness and large photon correlation times. We found MOFTIL crystal to be the best candidate entangled photon source with photon conversion rates of pairs s-1 mW-1 mm-1, and birefringence of 0.42 at 1064 nm and band gap of 3.2 eV. We observe that the band gap of the crystals is related to the properties such as birefringence (an important parameter for angle phase matching), effective nonlinearity and the entangled photon pair properties. Band gap can be related to the HOMO-LUMO gap of the ligand, assuming that the ligands do not interact significantly in the crystal, which can be a design criteria for preparing new MOF crystals with desired band gaps. Advanced entangled photon sources are crucial for photonic quantum technology and MOF nonlinear materials show great promise for modern nonlinear applications.
Acknowledgments
YJC thanks the University of Notre Dame for financial support through start-up funds. SP, RAF and FH are supported by ANID through ANID Fondecyt Postdoctoral 3220857, Fondecyt Regular 1221420 and Millennium Science Initiative Program ICN170_12. We thank center for research computing (CRC) at University of Notre Dame (UND) for computing resources.
5 Data and Codes Availability
All the data for Sellmeier curves and second-order susceptibility tensor obtained with CRYSTAL17 are available on GitHub. Codes to calculate phase-matching angles, effective nonlinearity, correlation function and number of entangled photon pairs for Type-I SPDC are available on GitHub. Link to GitHub page is GitHub-Data-Codes.
6 References
References
- [1] Pittman T B, Jacobs B C and Franson J D 2002 Phys. Rev. A 66(4) 042303 URL https://link.aps.org/doi/10.1103/PhysRevA.66.042303
- [2] Bouwmeester D, Pan J W, Mattle K, Eibl M, Weinfurter H and Zeilinger A 1997 Nature 390 575–579 ISSN 1476-4687
- [3] Walther P, Resch K J, Rudolph T, Schenck E, Weinfurter H, Vedral V, Aspelmeyer M and Zeilinger A 2005 Nature 434 169–176 ISSN 1476-4687
- [4] Wolfgang T and Gregor W 2001 Quantum Information & Computation 1 3–56 ISSN 1749-4893
- [5] Irvine W T M, Lamas Linares A, de Dood M J A and Bouwmeester D 2004 Phys. Rev. Lett. 92(4) 047902 URL https://link.aps.org/doi/10.1103/PhysRevLett.92.047902
- [6] Tittel W, Brendel J, Zbinden H and Gisin N 2000 Phys. Rev. Lett. 84(20) 4737–4740
- [7] Jennewein T, Simon C, Weihs G, Weinfurter H and Zeilinger A 2000 Phys. Rev. Lett. 84(20) 4729–4732 URL https://link.aps.org/doi/10.1103/PhysRevLett.84.4729
- [8] Sergienko A V, Atature M, Walton Z, Jaeger G, Saleh B E A and Teich M C 1999 Phys. Rev. A 60(4) R2622–R2625 URL https://link.aps.org/doi/10.1103/PhysRevA.60.R2622
- [9] Arrazola J M, Bergholm V, Bradler K, Bromley T R, Collins M J, Dhand I, Fumagalli A, Gerrits T and Goussev A 2021 Nature 591 54–60 ISSN 1476-4687
- [10] Pittman T B, Shih Y H, Strekalov D V and Sergienko A V 1995 Phys. Rev. A 52(5) R3429–R3432 URL https://link.aps.org/doi/10.1103/PhysRevA.52.R3429
- [11] D’Angelo M, Kim Y H, Kulik S P and Shih Y 2004 Phys. Rev. Lett. 92(23) 233601 URL https://link.aps.org/doi/10.1103/PhysRevLett.92.233601
- [12] Strekalov D V, Sergienko A V, Klyshko D N and Shih Y H 1995 Phys. Rev. Lett. 74(18) 3600–3603 URL https://link.aps.org/doi/10.1103/PhysRevLett.74.3600
- [13] Boyd R 2008 Nonlinear Optics (Elsevier, Burlington, MA USA)
- [14] Zhang W, Yu H, Wu H and Halasyamani P S 2017 Chemistry of Materials 29 2655–2668
- [15] Jin R B, Shimizu R, Wakui K, Benichi H and Sasaki M 2013 Opt. Express 21 10659–10666 URL https://opg.optica.org/oe/abstract.cfm?URI=oe-21-9-10659
- [16] Fritz R A, Colón Y J and Herrera F 2021 Chem. Sci. 12(10) 3475–3482 URL http://dx.doi.org/10.1039/D0SC05572G
- [17] Aramburu I, Ortega J, Folcia C L and Etxebarria J 2014 Applied Physics B 116 211–233 ISSN 1432-0649
- [18] Kurtz S K and Perry T T 1968 Journal of Applied Physics 39 3798–3813 (Preprint https://doi.org/10.1063/1.1656857) URL https://doi.org/10.1063/1.1656857
- [19] Zuo Z, Wang R, Dong Y and Wu B 2022 Crystal Growth & Design 22 7331–7338 (Preprint https://doi.org/10.1021/acs.cgd.2c00961) URL https://doi.org/10.1021/acs.cgd.2c00961
- [20] Wang R, Guo Y, Zhang X, Xiao Y, Yao J and Huang F 2020 Inorganic Chemistry 59 9944–9950
- [21] Zhang J, Abudoureheman M, Lian Z, Liu J, Wu Q and Xuan X 2022 Inorganic Chemistry 61 3716–3722 pMID: 35175049 (Preprint https://doi.org/10.1021/acs.inorgchem.1c03950)
- [22] Liang M L, Lacroix M, Tao C, Waters M J, Rondinelli J M and Halasyamani P S 2023 Inorganic Chemistry 62 2942–2950
- [23] Liu H, Song Z, Wu H, Hu Z, Wang J, Wu Y and Yu H 2022 ACS Materials Letters 4 1593–1598 (Preprint https://doi.org/10.1021/acsmaterialslett.2c00485)
- [24] Li S F, Hu L, Ma Y, Mao F F, Zheng J, Zhang X D and Yan D 2022 Inorganic Chemistry 61 10182–10189
- [25] Nikogosyan D N 1991 Applied Physics A 52 359–368 ISSN 1432-0630
- [26] Barnes N P, Gettemy D J and Adhav R S 1982 J. Opt. Soc. Am. 72 895–898 URL https://opg.optica.org/abstract.cfm?URI=josa-72-7-895
- [27] Schlarb U and Betzler K 1993 Phys. Rev. B 48(21) 15613–15620 URL https://link.aps.org/doi/10.1103/PhysRevB.48.15613
- [28] Jin R B, Zhao P, Deng P and Wu Q L 2016 Phys. Rev. Appl. 6(6) 064017 URL https://link.aps.org/doi/10.1103/PhysRevApplied.6.064017
- [29] Jin R B, Cai N, Huang Y, Hao X Y, Wang S, Li F, Song H Z, Zhou Q and Shimizu R 2019 Phys. Rev. Appl. 11(3) 034067 URL https://link.aps.org/doi/10.1103/PhysRevApplied.11.034067
- [30] Sheng Y, Cai W H, Tian Y and Jin R B 2023 Quantum Engineering 2023 6929253 URL https://doi.org/10.1155/2023/6929253
- [31] Mingabudinova L R, Vinogradov V V, Milichko V A, Hey-Hawkins E and Vinogradov A V 2016 Chem. Soc. Rev. 45(19) 5408–5431 URL http://dx.doi.org/10.1039/C6CS00395H
- [32] Furukawa H, Cordova K E, O’Keeffe M and Yaghi O M 2013 Science 341 6149 ISSN 0036-8075 (Preprint https://science.sciencemag.org/content/341/6149/1230444.full.pdf) URL https://science.sciencemag.org/content/341/6149/1230444
- [33] Colón Y J and Snurr R Q 2014 Chem. Soc. Rev. 43(16) 5735–5749 URL http://dx.doi.org/10.1039/C4CS00070F
- [34] Van Cleuvenbergen S, Stassen I, Gobechiya E, Zhang Y, Markey K, De Vos D E, Kirschhock C, Champagne B, Verbiest T and van der Veen M A 2016 Chemistry of Materials 28 3203–3209 (Preprint https://doi.org/10.1021/acs.chemmater.6b01087) URL https://doi.org/10.1021/acs.chemmater.6b01087
- [35] Zhang Y X, Li B X, Lin H, Ma Z, Wu X T and Zhu Q L 2019 J. Mater. Chem. C 7(21) 6217–6221 URL http://dx.doi.org/10.1039/C9TC01867K
- [36] Chen Z, Gallo G, Sawant V A, Zhang T, Zhu M, Liang L, Chanthapally A, Bolla G, Quah H S, Liu X, Loh K P, Dinnebier R E, Xu Q H and Vittal J J 2020 Angewandte Chemie International Edition 59 833–838 (Preprint https://onlinelibrary.wiley.com/doi/pdf/10.1002/anie.201911632) URL https://onlinelibrary.wiley.com/doi/abs/10.1002/anie.201911632
- [37] Liu M, Quah H S, Wen S, Yu Z, Vittal J J and Ji W 2016 Chemistry of Materials 28 3385–3390 ISSN 15205002
- [38] Chi-Durán I, Enríquez J, Manquian C, Wrighton-Araneda K, Cañon-Mancisidor W, Venegas-Yazigi D, Herrera F and Singh D P 2018 ACS Omega 3 801–807 URL https://doi.org/10.1021/acsomega.7b01792
- [39] Enríquez J, Manquian C, Chi-Duran I, Herrera F and Singh D P 2019 ACS Omega 4 7411–7419 (Preprint https://doi.org/10.1021/acsomega.9b00236) URL https://doi.org/10.1021/acsomega.9b00236
- [40] Garcia Garfido J M, enriquez j, Chi-Duran I, Jara I, Vivas L, Hernandez F J, Herrera F and Singh D P 2020 Millimeter-sized metal-organic framework single crystals without inversion symmetry: Controlled growth and self-assembly mechanism URL DOI:10.26434/chemrxiv.13002950.v1
- [41] Chi-Durán I, Fritz R A, Urzúa-Leiva R, Cárdenas-Jirón G, Singh D P and Herrera F 2022 ACS Omega 7 24432–24437 (Preprint https://doi.org/10.1021/acsomega.2c01856) URL https://doi.org/10.1021/acsomega.2c01856
- [42] Hidalgo-Rojas D, García-Garfido J, Enríquez J, Rojas-Aedo R, Wheatley R A, Fritz R A, Singh D P, Herrera F and Seifert B 2023 Advanced Optical Materials n/a 2300142 (Preprint https://onlinelibrary.wiley.com/doi/pdf/10.1002/adom.202300142) URL https://onlinelibrary.wiley.com/doi/abs/10.1002/adom.202300142
- [43] Raj S, Fritz R A, Herrera F and Colón Y J 2023 The Journal of Physical Chemistry C XX XXXX
- [44] Momma K and Izumi F 2011 J. Appl. Cryst. 44 1272–1276 URL https://doi.org/10.1107/S0021889811038970
- [45] Stokes H T and Hatch D M 2005 J. Appl. Cryst. 38 237–238 URL https://doi.org/10.1107/S0021889804031528
- [46] Ferrero M, Rérat M, Kirtman B and Dovesi R 2008 J. Chem. Phys. 129 244110 (Preprint https://doi.org/10.1063/1.3043366) URL https://doi.org/10.1063/1.3043366
- [47] Ferrero M, Rérat M, Orlando R and Dovesi R 2008 Journal of Computational Chemistry 29 1450–1459 (Preprint https://onlinelibrary.wiley.com/doi/pdf/10.1002/jcc.20905) URL https://onlinelibrary.wiley.com/doi/abs/10.1002/jcc.20905
- [48] Dovesi R, Erba A, Orlando R, Zicovich-Wilson C M, Civalleri B, Maschio L, Rérat M, Casassa S, Baima J, Salustro S and et al 2018 WIREs Comput Mol Sci. 8 e1360 URL https://wires.onlinelibrary.wiley.com/doi/abs/10.1002/wcms.1360
- [49] Kato K 1990 IEEE Journal of Quantum Electronics 26 1173–1175
- [50] Hellwig H, Liebertz J and Bohatý L 2000 Journal of Applied Physics 88 240–244 ISSN 0021-8979 (Preprint https://pubs.aip.org/aip/jap/article-pdf/88/1/240/10607738/240_1_online.pdf) URL https://doi.org/10.1063/1.373647
- [51] Lin S, Sun Z, Wu B and Chen C 1990 Journal of Applied Physics 67 634–638
- [52] Helmy A, Abolghasem P, Stewart Aitchison J, Bijlani B, Han J, Holmes B, Hutchings D, Younis U and Wagner S 2011 Laser & Photonics Reviews 5 272–286 (Preprint https://onlinelibrary.wiley.com/doi/pdf/10.1002/lpor.201000008) URL https://onlinelibrary.wiley.com/doi/abs/10.1002/lpor.201000008
- [53] Shih Y 2003 Reports on Progress in Physics 66 1009 URL https://dx.doi.org/10.1088/0034-4885/66/6/203
- [54] Keller T E and Rubin M H 1997 Phys. Rev. A 56(2) 1534–1541 URL https://link.aps.org/doi/10.1103/PhysRevA.56.1534
- [55] Valencia A, Chekhova M V, Trifonov A and Shih Y 2002 Phys. Rev. Lett. 88(18) 183601 URL https://link.aps.org/doi/10.1103/PhysRevLett.88.183601
- [56] Schneeloch J, Knarr S H, Bogorin D F, Levangie M L, Tison C C, Frank R, Howland G A, Fanto M L and Alsing P M 2019 Journal of Optics 21 043501
- [57] Cai W, Chen J, Pan S and Yang Z 2022 Inorg. Chem. Front. 9(6) 1224–1232 URL http://dx.doi.org/10.1039/D1QI01270C
- [58] Yan Z, Guang S, Xu H and Liu X Y 2013 Dyes and Pigments 99 720–726 ISSN 0143-7208 URL https://www.sciencedirect.com/science/article/pii/S0143720813002581
- [59] Mori Y, Yap Y, Kamimura T, Yoshimura M and Sasaki T 2002 Optical Materials 19 1–5 ISSN 0925-3467 photonic Materials for the 21st Century. Proceedings of the 2nd International Symposium on Laser, Scintillator and Nonlinear Optical Materials URL https://www.sciencedirect.com/science/article/pii/S092534670100194X
- [60] Yao J Q and Fahlen T S 1984 Journal of Applied Physics 55 65–68 (Preprint https://doi.org/10.1063/1.332850) URL https://doi.org/10.1063/1.332850
- [61] Huo G, Wang Y and Zhang M 2015 Applied Physics B 120 239–246 URL https://doi.org/10.1007/s00340-015-6129-6
- [62] Akbari R and Major A 2013 Laser Physics 23 035401 URL https://dx.doi.org/10.1088/1054-660X/23/3/035401
- [63] Ghotbi M and Ebrahim-Zadeh M 2004 Opt. Express 12 6002–6019 URL https://opg.optica.org/oe/abstract.cfm?URI=oe-12-24-6002
- [64] Umemura N, Miyata K and Kato K 2007 Optical Materials 30 532–534 ISSN 0925-3467 URL https://www.sciencedirect.com/science/article/pii/S0925346707000249
- [65] Eimerl D, Davis L, Velsko S, Graham E K and Zalkin A 1987 Journal of Applied Physics 62 1968–1983 ISSN 0021-8979 (Preprint https://pubs.aip.org/aip/jap/article-pdf/62/5/1968/10571657/1968_1_online.pdf) URL https://doi.org/10.1063/1.339536
- [66] Zernike F 1964 J. Opt. Soc. Am. 54 1215–1220 URL https://opg.optica.org/abstract.cfm?URI=josa-54-10-1215
- [67] Zernike F and Midwinter J E 1973 Applied nonlinear optics (Wiley, New York)
- [68] Dmitriev V G, Gurzadyan G G and Nikogosyan D N 1999 Handbook of nonlinear optical crystals 3rd ed (Springer)
- [69] Hong K H, Baek S Y, Kwon O and Kim Y H 2018 Journal of the Korean Physical Society 73 1650–1656 ISSN 1976-8524 URL https://doi.org/10.3938/jkps.73.1650
7 Supplementary Information
See pages - of SI.pdf