EIGER V. Characterizing the Host Galaxies of Luminous Quasars at
Abstract
We report JWST/NIRCam measurements of quasar host galaxy emissions and supermassive black hole (SMBH) masses for six quasars at in the Emission-line galaxies and Intergalactic Gas in the Epoch of Reionization (EIGER) project. We obtain deep NIRCam imaging in the F115W, F200W, and F356W bands, as well as F356W grism spectroscopy of the quasars. We use bright unsaturated stars to construct models of the point spread function (PSF) and estimate the errors of these PSFs. We then measure or constrain the fluxes and morphology of the quasar host galaxies by fitting the quasar images as a point source plus an exponential disk. We successfully detect the host galaxy of three quasars, which have host-to-quasar flux ratios of . Spectral Energy Distribution (SED) fitting suggests that these quasar host galaxies have stellar masses of . For quasars with host galaxy non-detections, we estimate the upper limits of their stellar masses. We use the grism spectra to measure the H line profile and the continuum luminosity, then estimate the SMBH masses for the quasars. Our results indicate that the positive relation between SMBH masses and host galaxy stellar masses already exists at redshift . The quasars in our sample show a high black hole to stellar mass ratio of , which is about dex higher than the local relations. This result suggests that luminous quasars at form a biased sample with overmassive black holes, which might have experienced early SMBH growth compared to their host galaxies’ star formation.
1 Introduction
Supermassive black holes (SMBHs) are ubiquitously found in the centers of galaxies (e.g., Kormendy & Gebhardt, 2001; Tremaine et al., 2002; Heckman & Best, 2014). Observations of local galaxies have found tight correlations between SMBHs and the properties of their host galaxies, such as stellar masses or velocity dispersions, known as the and the relations (e.g., Kormendy & Ho, 2013). These relations suggest a strong co-evolution between SMBHs and their host galaxies, likely through feedback during the active galactic nuclei (AGN) phases (e.g., Merloni & Heinz, 2008; Ciotti & Ostriker, 2001; Ciotti et al., 2010; Fiore et al., 2017). Specifically, AGN activities can produce strong outflows and expel the cold gas content in their host galaxies, quenching the star formation and also exhausting the gas supply to the SMBH (e.g., Fabian, 2012; Cicone et al., 2014; King & Pounds, 2015). Another important feedback mechanism is that AGNs can inject energy into the galaxy haloes through radio jets, which prevents halo gas from cooling and thereby shutting down both star-formation and BH accretion (e.g., Fabian, 2012; Heckman & Best, 2014).
Meanwhile, other mechanisms might also contribute to these observed relations. For example, SMBH accretion and galaxy star formation can be triggered by the same process (e.g., galaxy mergers; Di Matteo et al., 2005; Hopkins et al., 2008), producing a correlated growth of the SMBH and its host galaxy (e.g., Croton, 2006; Storchi-Bergmann & Schnorr-Müller, 2019). It has also been proposed that the SMBH-host correlation is a statistical effect resulting from the central limit theorem (e.g., Peng, 2007; Jahnke & Macciò, 2011). Given the debate of the possible scenarios, the exact origins of the and the are still unclear. One critical unresolved question is whether these correlations are already established in the early universe at very high redshifts or if they gradually take shape throughout cosmic time.
In the past two decades, about 300 quasars at have been discovered, which indicates that SMBHs with already exist when the universe is less than 1 Gyr old (e.g., Mortlock et al., 2011; Jiang et al., 2016; Matsuoka et al., 2018; Wang et al., 2019b; Yang et al., 2020; Wang et al., 2021; Bañados et al., 2023). This quasar sample enables studies of SMBH-host co-evolution in the early universe. By measuring the properties of these quasar host galaxies, we can characterize the and the relations at . So far, most of our knowledge about quasar host galaxies at comes from sub-millimeter (sub-mm) wavelengths. Recent observations with the Atacama Large Millimeter Array (ALMA) have shown that quasars at are hosted by massive starburst galaxies (e.g., Venemans et al., 2016; Decarli et al., 2018; Izumi et al., 2019; Yue et al., 2021). These quasar host galaxies have sizes of kpc in the sub-mm and show a variety of morphologies and kinematics, ranging from rotation-dominated disks to dispersion-dominated irregular mergers (e.g., Venemans et al., 2020; Neeleman et al., 2021).
Nevertheless, one important missing piece in our knowledge is the stellar component of high-redshift quasar host galaxies. The and relations of local galaxies describe the connection between the black holes and the stellar components of their host galaxies; however, ALMA observations trace the emission from cold dust and gas, making it hard to make direct comparisons between the above mentioned ALMA observations and the local relations. As luminous quasars are usually several magnitudes brighter than their host galaxies in rest-frame optical, probing the stellar emission of quasar host galaxies at is extremely challenging. One viable way to measure the emission from quasar host galaxies is image decomposition, utilizing the fact that quasars appear to be point sources and their host galaxies are extended. This approach requires sharp point spread functions (PSFs) to disentangle the flux from the quasar and its host galaxy. Although image decomposition has been successful for quasars at (e.g., Mechtley et al., 2016; Chen et al., 2023), detecting quasar host galaxies at is much more challenging, given that the surface brightness of extended objects scales with redshift as . Even with the sharp PSF of the Hubble Space Telescope (HST), previous studies have only reached non-detections of quasar host galaxies at (e.g., Marshall et al., 2020).
This situation was completely changed, however, by the recent launch of the James Webb Space Telescope (JWST). With its meter aperture and infrared coverage, JWST provides even sharper PSF than the HST and is sensitive to the rest-frame optical emission of high-redshift quasar host galaxies. An early study by Ding et al. (2022) reported the first detection of two quasar host galaxies at using NIRCam imaging, indicating that the two quasar hosts are among the most massive galaxies at their redshifts . Marshall et al. (2023) characterized the H and [O iii] emission lines of two quasar host galaxies at using NIRSpec IFU, showing complicated structures and kinematics of these galaxies. These exciting results motivate us to increase the sample of high-redshift quasars with host galaxy measurements in rest-frame optical, which will set a critical step towards fully understanding the co-evolution between SMBHs and galaxies in the early universe.
In this paper, we report the measurement of the host galaxy emission and SMBH properties for six luminous quasars at , using deep NIRCam imaging and spectroscopy as part of the Emission-line galaxies and Intergalactic Gas in the Epoch of Reionization (EIGER) project. We use the images to measure the fluxes and morphologies of the quasar host galaxies, and use the grism spectra to measure the black hole masses for the quasars from the H emission line. Based on these measurements, we discuss the implication of the quasar host galaxies on the relation in the reionization era.
This paper is organized as follows. Section 2 describes the observations and data reduction. Section 3 describes the PSF modeling and the image fitting method we use to detect the rest-frame optical emission of the quasar host galaxies. We present the grism spectra and the SMBH mass measurements of these quasars in Section 4 and discuss the co-evolution between high-redshift SMBHs and their host galaxies in Section 5. We discuss our results in Section 6, and summarize this paper in Section 7. Throughout this paper, we assume a flat CDM cosmology with and . All magnitudes are AB magnitudes unless further specified.
2 Observations and Data Reduction
The EIGER project (Proposal ID: 1243, PI: Lilly) is a Guaranteed Time Observation (GTO) program targeting six quasars at redshift , delivering deep NIRCam imaging and wide-field slitless spectroscopy (WFSS) of these quasar fields. The information about these quasars is summarized in Table 1. This Section briefly describes the observations, and we refer the readers to Kashino et al. (2023a), Matthee et al. (2023a), Eilers et al. (2023), and Bordoloi et al. (2023) for more information about the EIGER project.
| Quasar | RA | Dec | Redshift | 11The absolute magnitude at rest-frame Å. | 22The SMBH masses calculated using the Mg ii broad emission line. The errors in the table only contain random errors; the systematic errors of the black hole mass is about 0.4 dex. | Reference33References for the quasar properties. |
|---|---|---|---|---|---|---|
| (hh:mm:ss.ss) | (dd:mm:ss.s) | (mag) | ||||
| J0100+2802 | 01:00:13.02 | +28:02:25.80 | 6.327 | -29.02 | D’Odorico et al. (2023), Mazzucchelli et al. (2023) | |
| J0148+0600 | 01:48:37.64 | +06:00:20.0 | 5.977 | -27.08 | D’Odorico et al. (2023), Mazzucchelli et al. (2023) | |
| J1030+0524 | 10:30:27.11 | +05:24:55.06 | 6.304 | -26.99 | D’Odorico et al. (2023), Mazzucchelli et al. (2023) | |
| J159–02 | 10:36:54.19 | -02:32:37.94 | 6.381 | -26.47 | Bañados et al. (2016), Farina et al. (2022) | |
| J1120+0641 | 11:20:01.48 | +06:41:24.3 | 7.085 | -26.44 | Yang et al. (2021) | |
| J1148+5251 | 11:48:16.64 | +52:51:50.3 | 6.422 | -27.62 | Bañados et al. (2016), Shen et al. (2019) |
We obtain NIRCam F115W, F200W, F356W imaging, and F356W grism spectroscopy of the quasars. The observations of each quasar contain four individual visits, forming a mosaic that covers a field of view (FoV) of around the quasar. See Kashino et al. (2023a) for more information about the mosaic configuration. The central around each quasar is covered by every visits. We adopt the INTRAMODULEX primary dither pattern and the 4-Point subpixel dither pattern to improve the PSF sampling, cover detector gaps, and remove bad pixels. By the time of writing this paper, the observation of four quasars are completed, while we only have two of the four visits yet for J159–02 and three visits for J1030+0524. Our work presented here is based on these observations described above. The exposure time per visit is 4,381s for the F115W imaging, 5,959s for the F200W imaging, 1,578s for the F356W imaging, and 8,760s for the grism spectroscopy.
2.1 NIRCam Imaging
The NIRCam images were reduced using the jwst pipeline version 1.8.4. We first run Detector1Pipeline to generate the rate files (*rate.fits), then run Image2Pipeline to obtain calibrated images (*cal.fits). For astrometry, we first align the calibrated images to each other using tweakwcs, then combine all the images and calibrate the absolute astrometry to the Gaia DR2 catalog (Gaia Collaboration et al., 2018). We correct the noise, mask snowballs, subtract the wisp patterns, and remove cosmic rays for the images using custom codes (see Kashino et al., 2023a, for more detailed description). We then run Image3Pipeline to stack images with the same visit and the same module. We use a pixel size of for the F356W images and for the F115W and the F200W images.
There are some noticeable differences between the image reduction of this work and that of previous EIGER papers. Previous EIGER papers presented JWST imaging by combining all exposures in each field to form a final co-added image per filter. In this work, we only combine images with the same filter, visit, and module. This approach reduces the systematic uncertainties in PSF modeling and image fitting (Section 3) introduced by imperfect astrometric alignment between the visits. Working on individual visits separately also allows us to estimate the systematic errors of the host galaxy measurements by comparing the results of different visits. In addition, previous EIGER papers used a pixel scale of for the stacked F115W and F200W images, while in this work, we use a pixel scale of to improve the sampling of the PSFs.
2.2 NIRCam WFSS
We obtain the NIRCam grism spectroscopy of the quasar fields using the grism “R” in the F356W filter. This configuration gives an observed wavelength range of , which covers the H emission line at . The data was reduced using jwst pipeline version 1.8.5. For each quasar, we first run the Detector1pipeline to obtain the *rate.fits files, then assign the world coordination system (WCS) information to the exposures using the AssignWcsStep and apply flat fielding using the FlatFieldStep. We remove noise and sky background variations by subtracting the median value in each column. We then trace and extract the 2D spectra of the quasar from individual exposures using custom scripts utilizing the grismconf module (see Kashino et al., 2023b, for more details). Finally, we extract the spectra from all exposures using optimal extraction (Horne, 1986), and combine the extracted 1D spectra using the coadd1d pipeline in the PypeIt package (Prochaska et al., 2020).
3 Measuring the Emission of Quasar Host Galaxies
We use the NIRCam images to measure the flux and morphology of the quasar host galaxies. To do this, we fit the images of a quasar as a point source for the AGN plus an exponential disk for the host galaxy, and use the best-fit parameters of the exponential disk to infer properties of the quasar host galaxy.
3.1 PSF Models and Errors
We construct PSF models using bright and unsaturated stars in the NIRCam images. This method has been found to provide accurate PSF models for quasar host galaxy detection and outperforms webbpsf (e.g., Ding et al., 2022; Zhuang & Shen, 2023). In this work, we use photutils111https://photutils.readthedocs.io/en/stable/index.html to build effective PSFs, which uses the algorithm described in Anderson & King (2000). The detailed approach is as follows.
For each image, we first perform a source detection using the DAOphot algorithm (Stetson, 1987), then select objects with magnitudes in each filter and full-width half maxima (FWHMs) consistent with point sources222The specific FWHM limits are for F115W, for F200W, and for the F356W filter. These values correspond to the limits as measured by Zhuang & Shen (2023) as PSF stars. The magnitude cut is determined to match the fluxes of the quasars and avoid saturation, as the PSF shapes of infrared detectors exhibit flux dependence (e.g., the brighter-fatter effect; Plazas et al., 2018). We visually inspect all the PSF stars and reject those with close companions or bad pixels. We then use the EPSFBuilder class in the photutils package to build the empirical PSFs. Since the PSF of NIRCam depends on the position on the focal plane (e.g., Zhuang & Shen, 2023), we construct the PSF models for module A and module B separately. We also notice that the number of suitable PSF stars in a single image is very limited (usually fewer than three), and some images do not have suitable PSF stars. We thus include PSF stars from all quasar fields and visits when fitting the PSF models. The typical number of PSF stars available for one filter and one module is .
It is worth noting that the PSF stars for the three bands are selected independently. Specifically, a PSF star in one band might be too bright or too faint to be selected as a PSF star in the other bands. As a result, the number of PSF stars available for the three bands are different.
The empirical PSF models described above represent the average PSF of all the images. Limited by the number of PSF stars available, we are not able to model the spatial and temporal variations of the PSFs. Instead, we calculate the error maps of the PSF models, which estimate the possible differences between the PSF model and the real PSF of the quasar image.
Specifically, we first compute the differences between the flux-normalized images of the PSF stars (denoted by ) and the PSF model (denoted by ), then calculate the PSF error at pixel as
| (1) |
where is the random noise (i.e., the ERR extension of the images) of the th PSF star. In practice, we perform sigma clipping with for each pixel in order to reduce the impact of outliers. The error map gives the standard deviation of the pixels in the PSF models and is added to the noise map in the image fitting (Section 3.2).
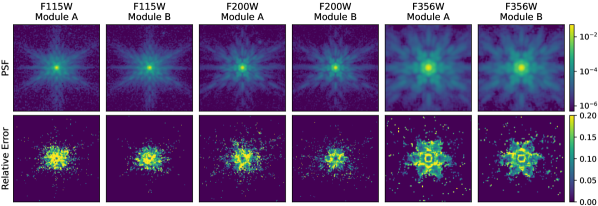
The final product of the PSF modeling step contains six PSFs (three filters times two modules). The PSFs have sizes of and have the same pixel size as the images. Figure 1 shows the PSF models and their relative error maps. There is a general trend that brighter pixels have larger relative errors; the central pixels of the PSFs have relative errors up to . All PSF models, the PSF star lists, and the code to construct the effective PSF with error maps will be made available online upon publication.
3.2 Image Fitting
We use a point source component to describe the quasar and an exponential profile (i.e., a Sérsic profile with index ) to describe the quasar host galaxy. We also add a constant background component to model imperfect background subtraction and add additional Sérsic profiles when there are other bright galaxies close to the quasar. We use psfMC (Mechtley et al., 2016) to perform image fitting, which is a Python-based package explicitly designed for quasar host galaxy detections utilizing the Markov chain Monte Carlo (MCMC) method. We assign flat priors to all the free parameters, namely the magnitudes and positions of the point sources and Sérsic profiles, the half-light major and minor radii and the position angle of the Sérsic profiles, the Sérsic index of the Sérsic profiles (except for the quasar host galaxy which is forced to have ), and the background level.
It is worth noting that psfMC incorporates PSF error maps when evaluating the likelihood of an image model. Specifically, the error of a pixel is calculated by combining the PSF error and the random noise of the image, i.e.,
| (2) |
where stands for the combined error at pixel , is the flux of the PSF, is the error map of the PSF model (described in Section 3.1), and is the random noise of the pixel. By including the PSF error map in the total error, we assign lower weights to pixels with large PSF uncertainties and reduce their impact on the fitting result. This combined error map also helps us to distinguish quasar host galaxy emissions from PSF inaccuracies in the PSF-subtracted images.
For each quasar, we first fit its F356W images to determine whether the host galaxy is detected and to measure the morphology of the host galaxy. This choice is made based on two considerations. First, long-wavelength NIRCam filters exhibit smaller spatial variation, as shown by Zhuang & Shen (2023), who suggested that PSF mismatches is the major source of uncertainties in quasar host galaxy measurements. Second, the flux ratio between the host galaxy and the quasar increases towards longer wavelength (Marshall et al., 2021). The reason is twofold: (1) quasars have blue continua in the rest-frame optical; (2) the F356W filter probes wavelengths longer than the 4000Å-break for galaxies. As we will later show in this Section, the quasars with host galaxy detections in our sample have .
We fit the F356W images from individual visits separately, and determine the best-fit parameters and their errors by computing the median and standard deviation of the MCMC samples from all the visits. A quasar host galaxy is considered to be detected if the fitting result meets the following criteria:
-
1.
The error of the quasar host galaxy’s magnitude is smaller than 0.3 (i.e., a detection with significance);
-
2.
The half-light radius satisfies and ;
-
3.
The axis ratio satisfies .
Here, criterion (1) ensures that the host galaxy is consistently detected in all visits; criterion (2) ensures that the best-fit host galaxy has a reasonable size and is unlikely to be confused with the PSF component or the background component; criterion (3) further excludes some false detections caused by PSF inaccuracies, as we will soon show in Section 3.2.1.
For quasars with successful host galaxy detections in the F356W band, we fit the F200W and the F115W image by fixing the position and the morphology of the host galaxy to the best-fit values from the F356W images. Again, we fit the images from different visits separately and estimate the best-fit parameters and their errors using the MCMC samples from all the visits. If we do not detect the quasar host galaxy, we fit the quasar images in all bands as a point source plus a background component to produce the PSF-subtracted images.
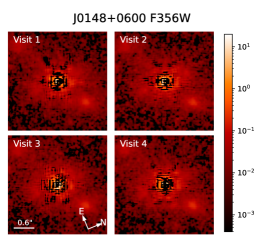
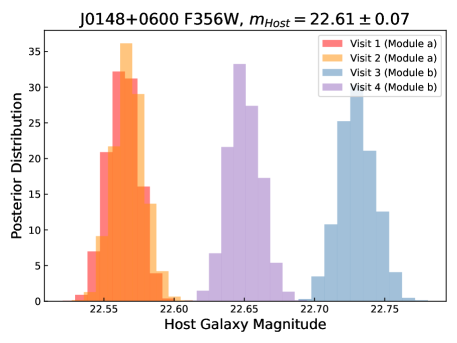
We demonstrate how we validate the host galaxy detections and estimate the uncertainties of host galaxy properties in Figure 2. The left panel of Figure 2 shows the PSF-subtracted F356W image of J0148+0600 from individual visits. We emphasize that the quasar is located in module A (B) in visits 1 and 2 (3 and 4), and we model the PSF of module A and module B independently. As such, the similar patterns in the PSF-subtracted images from individual visits strongly indicate that the host galaxy detection is reliable. The right panel of Figure 2 shows the host galaxy fluxes measured from the four visits. The histograms represent the posterior distributions from MCMC, and the inter-visit differences reflect the systematic errors of image fitting. We estimate the uncertainties of the host galaxy magnitude by computing the standard deviation of MCMC samples from all the visits, which takes into account both random errors and systematic errors. In this case, the standard deviation of the host galaxy magnitude is , and the host galaxy is successfully detected.
| Quasar | 11The F115W magnitudes of the host galaxies are tentative detections. See section 3.2 for more details. | 22The ellipticity is defined as . | PA33The position angle is defined as the angle between the major axis and the north vector, with counter-clockwise being positive. | ||||||
|---|---|---|---|---|---|---|---|---|---|
| (deg) | |||||||||
| J0148+0600 | |||||||||
| J159–02 | |||||||||
| J1120+0641 | |||||||||
| J0100+2802 | - | - | - | - | - | - | |||
| J1030+0524 | - | - | - | - | - | - | |||
| J1148+5251 | - | - | - | - | - | - |
Note. — The image fitting results of the quasars. The top three rows summarize the three quasars with host galaxy detections, and the bottom three rows give quasars with non-detections of the host galaxies. All errors are errors.
Our image fitting procedure takes advantage of the multi-band, multi-visit observations of the EIGER project. The uncertainties of quasar host galaxy measurements are dominated by systematic errors of the PSF model instead of random errors. Fitting the four visits individually allows us to validate the result and estimate the systematic uncertainties by comparing the output of all the visits.
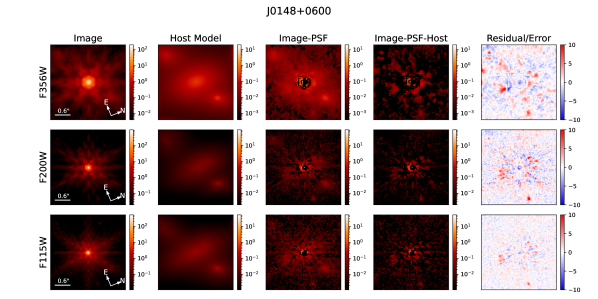
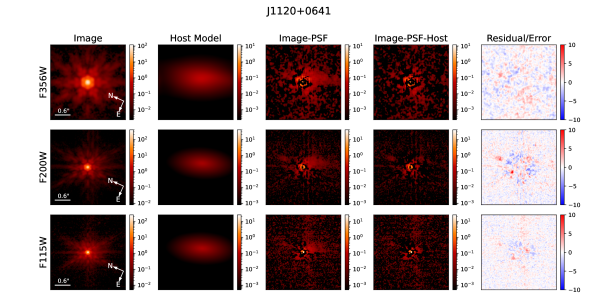
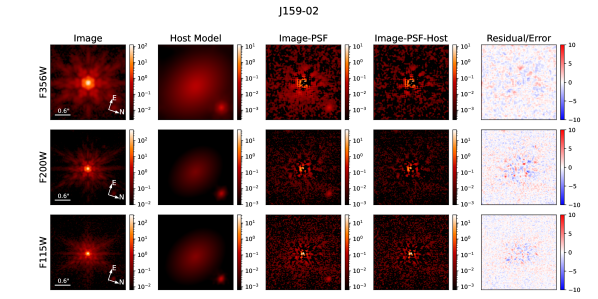
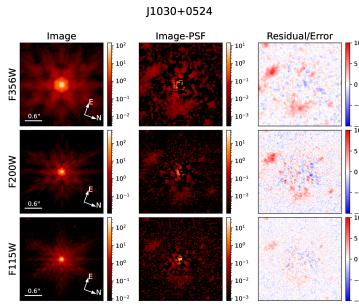
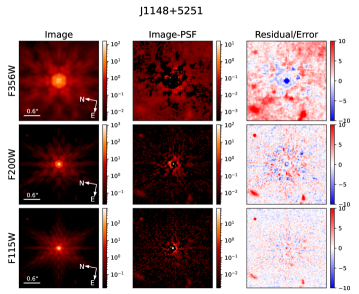
Figure 3 to 7 present the results of the image fitting. We summarize the best-fit parameters in Table 2. The PSF-subtracted images of these quasars exhibit a variety of features. We successfully detect the host galaxy of J0148+0600, J159–02, and J1120+0641. The PSF-subtracted images of these quasars exhibit similar shapes in all three bands, suggesting that the detections are reliable. The flux ratios between the host galaxies and the quasars range from . The host galaxies of J1030+0524 and J1148+5251 are not detected according to the detection criteria described above. However, the PSF-subtracted images of the two quasars clearly show extended emissions around the quasar, which might be tidal tails of a recent merger or the diffuse [O iii] emission from galactic-scale outflows. The analysis of J0100+2802 is already reported in Eilers et al. (2023), and we refer the readers to Eilers et al. (2023) for more details. As a quick summary, J0100+2802 is saturated in all the images due to its extreme brightness, and we do not detect the host galaxy or any extended emission in its PSF-subtracted images.
We also try to fit the images without fixing the Sérsic index of the host galaxy. We find that the Sérsic indices of the host galaxies are poorly constrained (with estimated errors ), while the best-fit host galaxy magnitudes are similar to the exponential disk models (with differences of mag). This systematic uncertainty is much smaller than the errors of the stellar mass estimates (Section 3.3) and has no influence on the main conclusions of this work.
We provide more information about individual quasars in Section 6.1.
3.2.1 Validating the Host Galaxy Detection
Given the small flux ratios between the detected host galaxies and the quasars, we need to ensure that the quasar host galaxy detections reported in this work are reliable and are not the results of PSF model inaccuracies. We perform this test by running the image fitting procedure for the PSF stars selected in Section 3.1. For each PSF star, we first build a new empirical PSF model by excluding the star from the PSF star list, then fit the star as a point source plus an exponential disk and a sky background. If the PSF models are accurate, we will get non-detections for the exponential disk components. In reality, we may get positive fluxes for the exponential disk components due to the inaccuracies of the PSF models, according to which we can estimate the flux limit where the quasar host galaxy detection is reliable.
The result of the experiment is shown in Figure 8. To match the magnitudes of the three quasars with host galaxy detections, we focus on stars with in the F356W images, in the F200W images, and for the F115W images. Again, we note that the three bands have different PSF stars, as described in Section 3.1. The open black circles mark stars where the exponential profile does not satisfy the radii-related criteria (criteria (2) and (3) in Section 2.1), for which our image fitting method would report non-detections of the host galaxies. The solid circles mark stars that satisfy the radii-related criteria and thus might give false-positive host galaxy detections. Note that we do not apply criterion (1) to the stars because most stars were only observed by one visit, meaning that we cannot estimate the inter-visit systematic uncertainties for the stars.
We find that all the PSF stars in the F356W band and most stars in the F200W band fail to pass the radii-related criteria and thus return non-detections of the host galaxy component. The only three stars in the F200W band that pass the criteria have . Meanwhile, some stars in the F115W band return an exponential disk component that is magnitudes fainter than the point source component. By visually inspecting their PSF-subtracted images, we find that these stars have strong PSF spikes, which mimic the extended exponential disk. This result is consistent with the finding of Zhuang & Shen (2023), who suggested that the PSF spatial variations are stronger in bluer bands.
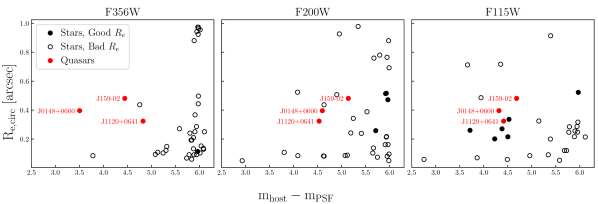
The red circles in Figure 8 represent the quasar host galaxies detected in Section 3.2, which have large effective radii and have . The comparison between the quasar hosts and the stars clearly shows that the host galaxy detections in the F200W and the F356W are real and cannot be explained by PSF inaccuracies. Another piece of evidence for the host galaxy detections is the consistent results from individual visits. Figure 2 presents the images of J0148+0600 as an example. For the other two quasars, we also find that the PSF-subtracted images from individual visits show similar patterns and that the best-fit host galaxy magnitudes from different visits are consistent within magnitudes.
The host galaxies of the three quasars have in the F115W band. Based on the results of the star test, it is possible that PSF inaccuracies contribute significantly to the F115W fluxes of the quasar hosts. However, we notice that the PSF-subtracted F115W images of the three quasars show similar features to their F356W and F200W images, and that the PSF-subtracted F115W images from different visits show similar shapes and flux levels. As such, we report the F115W band measurements of the quasar host galaxies as tentative detections.
To summarize, the quasar host galaxy detections for J0148+0600, J159-02, and J1120+0641 in the F356W and the F200W bands are reliable and are not the result of possible PSF inaccuracies. Some stars in the F115W image return an exponential disk component that is comparable to the quasar host galaxy detections, and we report tentative detections of these quasar host galaxies in the F115W band. We exclude the measurements in F115W in the SED fitting (Section 3.3) due to their potential contamination by PSF inaccuracies.
3.3 SED fitting
One of the main goals of this work is to characterize the position of luminous high-redshift quasars on the plot. To measure the stellar masses of the quasar host galaxies, we perform SED fitting for these galaxies using Prospector (Johnson et al., 2021), with nebular emission treatments based on Cloudy (see Byler et al., 2017, for details). Since the F115W band detection might be significantly affected by inaccuracies (Section 3.2.1), we only take the F356W and the F200W magnitudes as the input of the SED fitting.
We assume a delayed- model for the star formation history (SFH), i.e., . We use a Chabrier initial mass function (Chabrier, 2003) and assume a dust attenuation following the Calzetti et al. (2000) law. The free parameters and their priors of this SED model include: (1) the stellar mass with a log-uniform prior at ; (2) the stellar metallicity with a uniform prior at ; (3) the starting time of the star formation with a uniform prior at , where is the age of the universe at the quasar’s redshift; (4) the exponential decay timescale with a uniform prior at ; (5) the dust attenuation (quantified as the optical depth at 5500Å, ) with a uniform prior at ; (6) the gas-phase metallicity with a uniform prior at ; and (7) the ionization parameter with a uniform prior at .
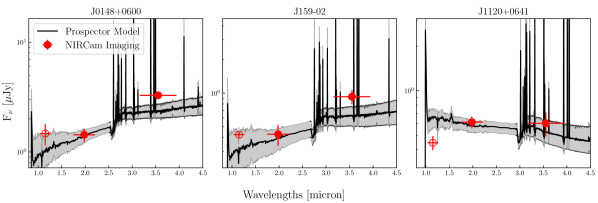
We first perform the SED fitting for the detected quasar host galaxies. Figure 9 shows the best-fit SEDs, and Table 3 summarizes the physical parameters of the quasar host galaxies. The quasar host galaxies detected in this work have stellar masses of , which are among the most massive galaxies at . Limited by the number of photometric points available for the SED fitting, we are not able to reliably constrain the other parameters. We also plot the tentative F115W detections of the host galaxies for reference, but do not include them in the SED fit. The F115W fluxes of J0148+0600 and J159-02 are consistent with the best-fit SED model, while the F115W flux of J1120+0641 is lower than the SED model.
For the quasars with only non-detections of their host galaxies, we estimate the upper limits of their host galaxy stellar masses. Specifically, we set the lower limit of the host galaxy magnitudes as in the F356W band, then scale the best-fit host galaxy SED model of J0148+0600 to match this magnitude and estimate the stellar masses. This upper limit is a conservative estimate, given that J0148+0600 has in the F356W band and has a significant detection of the host galaxy. The stellar mass upper limits of these quasar host galaxies are also listed in Table 3, which have .
| Quasar | 11The errors listed in the Table are random errors from MCMC. The systematic errors of is dex is dominated by the scatter of the empirical relation (Equation 3). | 22The errors are estimated from prospector posterior distributions. For quasars with non-detections, the upper limits correspond to (Section 3.3). | 33The absolute magnitude at rest-frame 1500Å from SED fitting. | ||||
|---|---|---|---|---|---|---|---|
| (mag) | (kpc) | ||||||
| J0148+0600 | 0.23 | ||||||
| J159–02 | 0.93 | ||||||
| J1120+0641 | 1.08 | ||||||
| J0100+2802 | 0.96 | - | - | ||||
| J1030+0524 | 0.94 | - | - | ||||
| J1148+5251 | 0.59 | - | - |
Note. — All errors are errors.
Since we only have two photometric points available, we are not able to adopt more complicated star formation histories (e.g., a non-parametric star formation history) in the SED fitting. We also notice that the F356W fluxes of the quasar host galaxies contain both stellar continuum and the H and [O iii] nebulae lines. Since we do not have the nebulae line fluxes, we keep the relevant parameters free when fitting the SEDs and marginalize all the parameters to estimate the stellar masses. Future observations with NIRSpec IFU will provide the fluxes of these nebulae lines, which will allow us to use more complicated star formation histories and improve the accuracy of the estimated stellar masses (e.g., Marshall et al., 2023).
Finally, we perform a sanity check of the stellar estimates by comparing our results with mock galaxies in UniverseMachine Data Release 1 (Behroozi et al., 2020). We select mock galaxies with redshifts and UV magnitudes , which roughly matches the redshift and luminosity range of the quasar host galaxies. These mock galaxies have stellar masses of ( confidence interval), with a median of . These numbers are close to the stellar mass estimates for the quasar host galaxies in this work.
4 Black Hole Mass Estimates for the Quasars
We calculate the black hole masses using the single-epoch virial estimator (e.g., Shen & Liu, 2012). This method uses the FWHM of broad emission lines to estimate the velocity of the broad line region (BLR) clouds, and uses the continuum luminosity as a proxy of the distance from the BLR to the SMBH based on the luminosity-radius relation (e.g., Kaspi et al., 2005). Specifically, the SMBH mass can be calculated using the following relation:
| (3) |
In this work, we use the NIRCam grism spectroscopy to measure the FWHM of their H emission lines and estimate the black hole masses accordingly. We use the empirical relation suggested by Vestergaard & Peterson (2006), which gives and .
4.1 Spectral Fitting
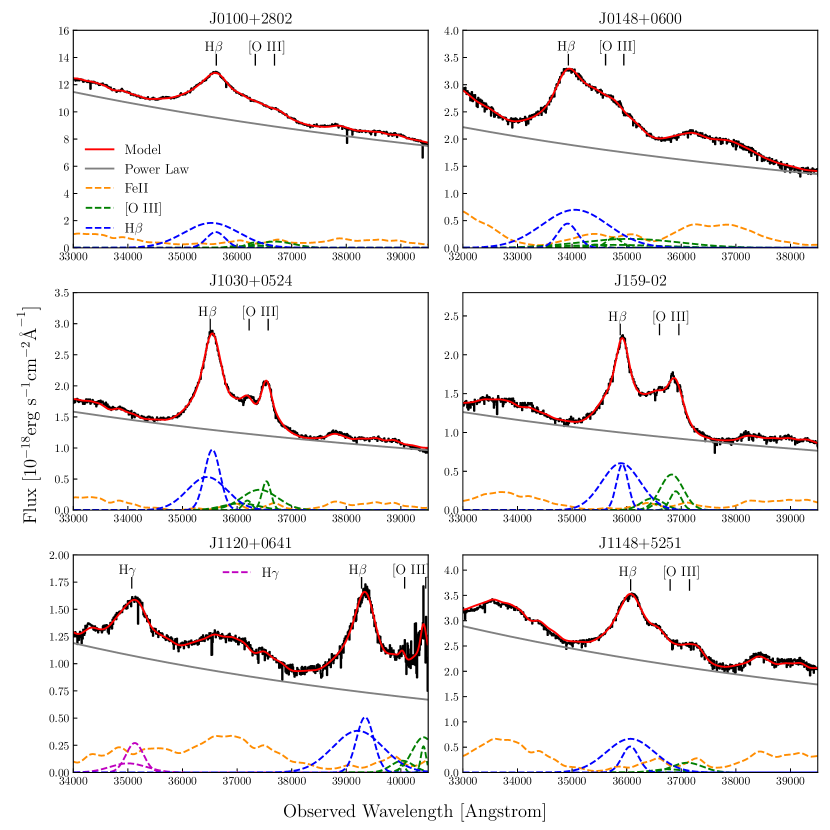
We run MCMC to fit the spectra of the quasars to measure the profile of the H lines. The flux model contains the following components: (1) a continuum described by a single power law; (2) the iron emission lines described using the template from Park et al. (2022); (3) the H and [O iii] emission lines. All the emission lines are fitted as two Gaussian components to model the complex broad line profiles seen in high-redshift quasars (e.g., Yang et al., 2023). The parameters of the spectral model include the amplitude and power-law index of the continuum, as well as the fluxes, redshifts, and widths of the emission lines. We adopt flat priors for all these parameters. We further fix the flux ratio between the [O iii]4959 and the [O iii]5007 lines to be (Storey & Zeippen, 2000) and require that the two lines have the same redshifts and widths for both Gaussian components. The wavelength ranges to be fitted depend on the redshift of the quasars; specifically, we fit the window for J0148+0600, for J1120+0641, and for all the other quasars. For J1120+0641, the H line is redshifted to the wavelength window, and the [O iii] lines fall on the edge of the transmission curve. We thus add the H line to the flux model and fix the [O iii] redshift to ensure a successful fit.
Figure 10 shows the spectra and the best-fit flux models of the quasars. We measure the FWHM of the H line and the continuum luminosity at rest-frame 5100Å , and calculate the SMBH masses using Equation 3. We also estimate the bolometric luminosities of the quasars using assuming a bolometric correction of 9.26 (Runnoe et al., 2012), and compute the Eddington ratios of the quasars. These results are listed in Table 3, and all the data will be available online after the paper is accepted for publication.
The [O iii] line profiles have been used to indicate possible outflows driven by the quasars (e.g., Yang et al., 2023). The quasars in the EIGER sample exhibit a variety of [O iii] line profiles. J0100+2802, J0148+0600, J1030+0524, and J159-02 exhibit two broad [O iii] components, while J1148+5251 only has one broad [O iii] component. The [O iii] lines of J1120+0641 are redshifted to the edge of the F356W filter and cannot be well-measured. This work focuses on the H-based black hole masses, and we leave more detailed analysis of the [O iii] emission lines to future studies.
4.2 Comparison of Different Black Hole Mass Indicators
Previous studies have suggested that H is a more reliable SMBH mass indicator compared to other broad emission lines (e.g., Shen & Liu, 2012). However, the H line of objects is not observable with ground-based facilities due to atmospheric absorption, and previous studies of quasars have been using the Mg ii line to measure the SMBH masses. The infrared coverage of JWST makes it possible to probe the rest-frame optical emission lines from high-redshift quasars. By analyzing the NIRCam grism spectroscopy of eight quasars at , Yang et al. (2023) showed that Mg ii-based SMBH masses are systematically higher than the H-based SMBH masses. It is thus important to investigate the differences between the SMBH mass estimates of high-redshift quasars indicated by different emission lines.
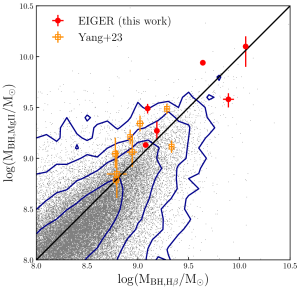
Figure 11 shows the comparison between the Mg ii-based and the H-based SMBH mass estimates for the six quasars in this work. We also include quasars from Yang et al. (2023) and SDSS quasars from Wu & Shen (2022) for comparison. Given the systematic uncertainties of the BH mass estimators , the Mg ii-based and the H-based SMBH masses agree with each other. The EIGER quasars have a mean value of ; this result is in line with Yang et al. (2023), who reported a mean value of for their quasar sample. These results suggest that the Mg ii-based BH masses of high-redshift quasars may be systematically larger by than their H-based BH masses.
5 The SMBH-Host Galaxy coevolution in the reionization era
With the host galaxy stellar masses measured in Section 3 and the black hole masses measured in Section 4, we now characterize the position of luminous quasars in the relation. Figure 12 illustrates the positions of the EIGER quasars on the plot. We also include other high-redshift quasar host galaxies and local galaxies from the literature in this Figure. For the high-redshift quasar sample, there is a clear trend that more massive galaxies host larger black holes, indicating that the correlation between SMBHs and their host galaxies already exists at . Meanwhile, the luminous quasars in the EIGER sample have , which is dex higher than the local relation. The quasars with only non-detections of their host galaxies also lie above the local relation according to the upper limits of their stellar masses. This comparison suggests that SMBHs in luminous quasars might have experienced early growth compared to their host galaxies’ star formation (e.g., Volonteri, 2012).
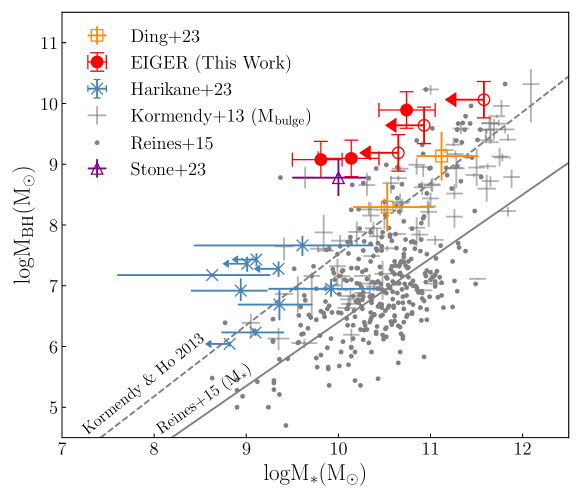
Several previous studies have also used JWST NIRCam imaging to measure the stellar masses of high-redshift quasars and AGNs. Stone et al. (2023) reported NIRCam observations of a sub-Eddington quasar at , which also has an overmassive black hole compared to local galaxies. Ding et al. (2022) measured the host galaxy fluxes of two low-luminosity quasars at , which have small black holes and massive host galaxies . Ding et al. (2022) argued that the two quasar host galaxies are consistent local after correcting for the selection effects.
Recent JWST observations have revealed a population of faint broad line AGNs at (also known as the “little red dots”, e.g., Kocevski et al., 2023; Matthee et al., 2023b; Maiolino et al., 2023). Harikane et al. (2023) analyzed a sample of low-luminosity AGNs at , which have relatively lower . The broad-line AGN at reported by Larson et al. (2023) have . However, Furtak et al. (2023) reported a low-luminosity AGN at with . These results show the large diversity of high-redshift SMBHs and their host galaxies, which might have experienced a variety of growth histories.
Some previous studies have used phenomenological approach to understand the redshift evolution of the relation. For example, Caplar et al. (2018) developed an analytical method to derive the relation that matches the observed star formation rate density and quasar luminosity function, who suggested that the BH-to-host mass ratio should be larger at higher redshift, following an evolution of . In contrast, Zhang et al. (2023) showed that the only evolves mildly at using the empirical model Trinity, which was designed to match observables including quasar luminosity functions, quasar probability distribution functions, active black hole mass functions, local SMBH mass–bulge mass relations, and the SMBH mass distributions of high-redshift bright quasars. This comparison again shows that it is not a trivial task to correctly characterize the high-redshift relation.
It is worth noticing that selection effects can lead to overmassive black holes in flux-limited samples of quasars (Lauer et al., 2007). Specifically, quasars with larger SMBHs are generally more luminous and are more likely to be detected in flux-limited surveys. Zhang et al. (2023) showed that, for luminous AGNs with and , this selection effect leads to a SMBH sample that is dex more massive than the true relation. However, it is still unclear how to quantify this selection effect and unveil the intrinsic redshift evolution of the relation. Following the method in Li et al. (2022), Ding et al. (2022) found that the two quasars in their sample are consistent with no redshift evolution of the relation. In contrast, Stone et al. (2023) argued that the large values of high-redshift quasars can only be partially explained by selection effects.
The EIGER quasars are among the most luminous quasars at (e.g., Fan et al., 2022) and are thus subject to significant selection bias. Quantifying the selection bias for the EIGER quasar sample is beyond the scope of this work. To accurately characterize the high-redshift relation, it is necessary to build a large sample of quasars with well-understood selection effects and measure their host galaxy properties.
The stellar masses of the high-redshift quasar host galaxies still have large uncertainties. One of the main reasons is that we only have the F200W and the F356W magnitudes for the SED fitting. By improving the PSF models for image fitting, it should be possible to obtain reliable F115W magnitudes for SED fitting and get more accurate measurements in the F200W and the F356W bands. Future observations with NIRSpec IFU will provide emission line fluxes (like the [O iii] line) of the quasar host galaxies (e.g., Marshall et al., 2023), which will put stronger constraints on the stellar masses and other properties of the quasar hosts.
6 Discussion
6.1 Notes on Individual Objects
6.1.1 J0100+2802
J0100+2802 is a hyperluminous quasar discovered by Wu et al. (2015). Due to its high luminosity, J0100+2802 is saturated in all three bands in EIGER imaging, and we are not able to detect its host galaxy. ALMA observations have suggested that the host galaxy of J0100+2802 is a starburst galaxy with a star formation rate of (Wang et al., 2019a), which exhibit clumpy structures (Fujimoto et al., 2020).
Eilers et al. (2023) reported the NIRCam observations and ground-based spectroscopy of J0100+2802, who showed that the images of this quasar are well-described by a point source, and the C iv, Mg ii, and H emission lines give consistent estimated BH masses. We note that the data used in this work was produced by a later version of the jwst pipeline compared to Eilers et al. (2023). The spectral fitting of this work is also slightly different from that of Eilers et al. (2023); we fix the line ratios and profiles of the [O iii] doublet in the spectral fitting, while Eilers et al. (2023) left all emission line parameters free. Consequently, the spectral properties reported in this work are slightly different from that in Eilers et al. (2023).
6.1.2 J0148+0600
J0148+0600 was initially discovered by Jiang et al. (2015). This quasar is known for the large Gunn-Peterson trough in its spectruum (e.g., Becker et al., 2015) The PSF-subtracted images of J0148+0600 (Figure 3) indicate that its host galaxy has a regular elliptical shape. J0148+0600 has two projected companions in the north and the south directions, and it is unclear whether these two objects are associated with the quasar.
6.1.3 J1030+0524
J1030+0524 was initially reported by Fan et al. (2001). The image fitting process returns a non-detection of the quasar host galaxy according to the criteria in Section 3.2. Nevertheless, the PSF-subtracted images clearly show extended emissions around the quasar, which have consistent shapes in all three bands. These features look like tidal tails and suggest a recent galaxy merging event. Note that we only got the data from three visits for J1030+0524 by the time of writing this paper.
6.1.4 J159–02
J159–02 was initially reported by Bañados et al. (2016). The best-fit image model suggests a regular-shaped host galaxy with large radii. The PSF-subtracted image shows a projected companion galaxy. By the time of writing this paper, J159–02 has only been observed by two visits, where the quasar is located on module A.
6.1.5 J1120+0641
J1120+0641 was initially reported in Mortlock et al. (2011). The PSF-subtracted images of J1120+0641 show irregular features, suggesting that the quasar might have experienced a recent galaxy merger. We also notice that the quasar is away from the center of the host galaxy.
Venemans et al. (2017) reported the high-resolution ALMA observation of J1120+0641. The sub-mm continuum of J1120+0641 has a deconvolved FWHM of , which is much smaller than the near-IR emission as revealed by NIRCam imaging. This result indicates that the sub-mm emission and the rest-frame optical emission come from different regions in the quasar host galaxy. Venemans et al. (2017) estimated the dynamical mass , dust mass , and gas mass of the quasar host. These numbers are in line with the SMBH mass and the stellar mass estimated in this work.
We notice that the Venemans et al. (2017) also reported an offset of between the quasar (measured by ground-based imaging) and the host galaxy (measured by ALMA); however, due to the limited spatial resolution and astrometric accuracy, the authors were not able to confirm this offset with sufficient significance.
Bosman et al. (2023) reported the JWST Mid-Infrared Instrument (MIRI) spectrum of J1120+0641, which covers observed wavelengths m. Bosman et al. (2023) reported an H-based BH mass of , consistent with the H-based results within scatters. Bosman et al. (2023) also found a redshifted H core component , which was interpreted as a possible sign of a recoiling black hole by the authors. This scenario is in accordance with the offset between the quasar and the host galaxy emission.
6.1.6 J1148+5251
J1148+5251 was initially reported by Fan et al. (2003). The image fitting procedure returns a non-detection of the host galaxy. Nevertheless, the PSF-subtracted image in the F356W band exhibit diffused emission extending from the northeast to the southwest of the quasar. We notice that this emission is absent in the F200W and the F115W images, which suggests that the emission might be dominated by H or [O iii] nebular lines.
6.2 Systematic Errors and Possible Improvements of the Image Fitting Method
Measuring the host galaxies of luminous quasars is a challenging task. Given the strong fluxes of the quasars, optimal PSF modeling and image fitting are needed to reveal the emission from the quasar host galaxies. In this Section, we discuss the PSF modeling and image fitting methods in previous studies and this work, as well as possible improvements to these methods.
We first consider the method to build PSF models. Although recent JWST observations of quasar host galaxies have been using bright stars to construct PSF models, the exact methods adopted by these studies have some noticeable differences. For example, Ding et al. (2022) identified bright stars in the quasar’s image, then chose the best five stars that give the smallest in the image fitting as PSFs. Stone et al. (2023) explicitly obtained images of a bright star and use the images as PSF, instead of using stars in the quasar’s image. Zhuang & Shen (2023) tested three tools for PSF modeling, including SWarp (Bertin et al., 2002), PSFEx (Bertin, 2011), and photutils. Zhuang & Shen (2023) suggested that PSFEx had the best performance, and that host galaxies with can be securely detected with sufficient imaging depth.
In this work, we use photutils to construct PSF models, where we gather stars from all quasar fields and all visits as PSF stars. The key feature of this work is that we estimate error maps of PSF models and add these errors into image fitting. We suggest that this step is critical and should be included in similar studies in the future. Specifically, if we only consider random noises when fitting the quasar images, the inaccuracies of the PSF models will have a substantial effect on the fitting result and will bias the estimated host galaxy fluxes. By including the PSF error maps in image fitting, we give lower weights to pixels that have larger PSF uncertainties and make the resulting host galaxy measurements less biased.
Another systematic error is the SED mismatch between the quasars and the PSF stars. Since quasars and stars have different SEDs in the near-IR, the broad-band PSF of these objects should have different shapes. To investigate this effect, we use webbpsf to generate two PSFs corresponding to two types of SEDs: (1) an M dwarf from the stellar spectrum library by Castelli & Kurucz (2003); (2) a quasar at with the Vanden Berk et al. (2001) spectral template. For both the F356W and the F200W band, the differences between the two PSFs have similar levels to the PSF error maps described in Section 3.1. We thus expect that the impact of SED differences should be comparable to that of PSF error maps. The uncertainties introduced by the PSF error maps can be estimated by the MCMC samples from a single visit, which introduces an error of for the host galaxy magnitude measurements. This value is much smaller than the magnitude errors we report in Table 2, which are dominated by the inter-visit systematic uncertainties.
It is still unclear what is the optimal way to model the PSF of NIRCam. In particular, the PSF of NIRCam depends on the position on the detector, the flux of the source, and the time of the observation. These effects are ignored in this work due to the limited number of PSF stars available, and we leave the detailed analysis of these effects to future studies.
We now consider the method for image fitting. Most studies of quasar host galaxies (including this work) uses a point source plus a Sérsic profile to describe the image of quasars. The specific setting for the Sérsic profiles varies between the studies. Ding et al. (2022) left all Sérsic parameters free, Zhuang & Shen (2023) fixed the center of the host galaxy to the quasar’s position, and this work fix the Sérsic index of the host galaxy to be (i.e., an exponential disk). Studies based on ground-based imaging have used one-dimensional profile fitting, which is a powerful tool for low-redshift quasar host galaxies (e.g., Matsuoka et al., 2014; Yue et al., 2018).
The result of this work demonstrates the limitation of the existing image fitting method. Several quasars in the EIGER sample show irregular emissions in their PSF-subtracted images. For these quasars, a regular Sérsic profile might not give the correct description of the host galaxy. It is thus desirable to develop image fitting methods that can describe irregular galaxy shapes. Additionally, we suggest that the position of the host galaxy should be left free instead of fixed to the quasar’s position since some quasars show large offsets from their host galaxies (like J1120+0641).
Using the bluetides simulation (Feng et al., 2016), Marshall et al. (2021) estimated that the detection limit of high-redshift quasar host galaxies is for NIRCam (assuming an exposure time of ks). This work successfully detects quasar host galaxies that have with exposure times of ks for the F356W imaging. With improved PSF models in the future, it is possible to achieve detection limits of , allowing us to measure quasars with fainter host galaxies.
7 Conclusion
We present NIRCam observations of six quasars at observed by the EIGER project. We use NIRCam imaging to measure the host galaxy emissions of the quasars, where we fit the quasar images as a point source plus an exponential disk. We construct PSF models and their error maps using bright stars in the images, and run MCMC to perform image fitting to estimate the fluxes of the quasar host galaxies. We use NIRCam grism spectra to measure the profile of the broad H emission lines and calculate the SMBH masses of the quasars. The main results of this work are as follows:
-
1.
We detect the host galaxies of three quasars, i.e., J0148+0600, J159-02 and J1120+0641, in the F200W and the F356W bands, and get tentative detections in the F115W band. These quasars have host-to-quasar flux ratios of . SED fitting shows that these quasar host galaxies have .
-
2.
We report non-detections for the host galaxies of J0100+2802, J1030+0524, and J1148+5251. We also estimate the upper limits of the fluxes and stellar masses of their host galaxies. The PSF-subtracted image of J1030+0524 and J1148+5251 show diffused emissions around the quasar, which might come from the tidal tails of the ongoing galaxy merger or extended [O iii] emissions around the quasar.
-
3.
We compute the black hole masses of the six quasars using their H emission lines. The H-based black hole masses of these quasars are slightly smaller than the Mg ii-based ones by , which is consistent with the results by Yang et al. (2023).
-
4.
The quasars in the EIGER sample have , which is dex larger than low-redshift galaxies with similar stellar masses. This comparison suggests that high-redshift quasars might have experienced early SMBH growth compared to the star formation of their host galaxies. However, high-redshift luminous quasars are subject to selection biases, which could also explain the overmassive black holes seen in these quasars.
The EIGER quasars are among the most luminous quasars at . The detection of their host galaxies illustrates the promising potential for JWST to build a large sample of high-redshift quasars with host galaxy detections in the near-IR. The PSF models of NIRCam will be improved by future observations and analyses, which will enable more accurate characterization of the high-redshift relation. Meanwhile, JWST observations have discovered several AGNs at even higher redshifts (e.g., Furtak et al., 2023; Goulding et al., 2023; Larson et al., 2023; Kokorev et al., 2023). Follow-up analysis of these AGNs will characterize the co-evolution of SMBHs and their host galaxies at even earlier cosmic times, approaching the origin of the relation that already has its shape at .
References
- Anderson & King (2000) Anderson, J., & King, I. R. 2000, PASP, 112, 1360, doi: 10.1086/316632
- Astropy Collaboration et al. (2013) Astropy Collaboration, Robitaille, T. P., Tollerud, E. J., et al. 2013, A&A, 558, A33, doi: 10.1051/0004-6361/201322068
- Astropy Collaboration et al. (2018) Astropy Collaboration, Price-Whelan, A. M., Sipőcz, B. M., et al. 2018, AJ, 156, 123, doi: 10.3847/1538-3881/aabc4f
- Bañados et al. (2016) Bañados, E., Venemans, B. P., Decarli, R., et al. 2016, ApJS, 227, 11, doi: 10.3847/0067-0049/227/1/11
- Bañados et al. (2023) Bañados, E., Schindler, J.-T., Venemans, B. P., et al. 2023, ApJS, 265, 29, doi: 10.3847/1538-4365/acb3c7
- Becker et al. (2015) Becker, G. D., Bolton, J. S., Madau, P., et al. 2015, MNRAS, 447, 3402, doi: 10.1093/mnras/stu2646
- Behroozi et al. (2020) Behroozi, P., Conroy, C., Wechsler, R. H., et al. 2020, MNRAS, 499, 5702, doi: 10.1093/mnras/staa3164
- Bertin (2011) Bertin, E. 2011, in Astronomical Society of the Pacific Conference Series, Vol. 442, Astronomical Data Analysis Software and Systems XX, ed. I. N. Evans, A. Accomazzi, D. J. Mink, & A. H. Rots, 435
- Bertin et al. (2002) Bertin, E., Mellier, Y., Radovich, M., et al. 2002, in Astronomical Society of the Pacific Conference Series, Vol. 281, Astronomical Data Analysis Software and Systems XI, ed. D. A. Bohlender, D. Durand, & T. H. Handley, 228
- Bordoloi et al. (2023) Bordoloi, R., Simcoe, R. A., Matthee, J., et al. 2023, arXiv e-prints, arXiv:2307.01273, doi: 10.48550/arXiv.2307.01273
- Bosman et al. (2023) Bosman, S. E. I., Álvarez-Márquez, J., Colina, L., et al. 2023, arXiv e-prints, arXiv:2307.14414, doi: 10.48550/arXiv.2307.14414
- Byler et al. (2017) Byler, N., Dalcanton, J. J., Conroy, C., & Johnson, B. D. 2017, ApJ, 840, 44, doi: 10.3847/1538-4357/aa6c66
- Calzetti et al. (2000) Calzetti, D., Armus, L., Bohlin, R. C., et al. 2000, ApJ, 533, 682, doi: 10.1086/308692
- Caplar et al. (2018) Caplar, N., Lilly, S. J., & Trakhtenbrot, B. 2018, ApJ, 867, 148, doi: 10.3847/1538-4357/aae691
- Castelli & Kurucz (2003) Castelli, F., & Kurucz, R. L. 2003, in Modelling of Stellar Atmospheres, ed. N. Piskunov, W. W. Weiss, & D. F. Gray, Vol. 210, A20, doi: 10.48550/arXiv.astro-ph/0405087
- Chabrier (2003) Chabrier, G. 2003, PASP, 115, 763, doi: 10.1086/376392
- Chen et al. (2023) Chen, Y.-C., Liu, X., Foord, A., et al. 2023, Nature, 616, 45, doi: 10.1038/s41586-023-05766-6
- Cicone et al. (2014) Cicone, C., Maiolino, R., Sturm, E., et al. 2014, A&A, 562, A21, doi: 10.1051/0004-6361/201322464
- Ciotti & Ostriker (2001) Ciotti, L., & Ostriker, J. P. 2001, ApJ, 551, 131, doi: 10.1086/320053
- Ciotti et al. (2010) Ciotti, L., Ostriker, J. P., & Proga, D. 2010, ApJ, 717, 708, doi: 10.1088/0004-637X/717/2/708
- Croton (2006) Croton, D. J. 2006, MNRAS, 369, 1808, doi: 10.1111/j.1365-2966.2006.10429.x
- Decarli et al. (2018) Decarli, R., Walter, F., Venemans, B. P., et al. 2018, ApJ, 854, 97, doi: 10.3847/1538-4357/aaa5aa
- Di Matteo et al. (2005) Di Matteo, T., Springel, V., & Hernquist, L. 2005, Nature, 433, 604, doi: 10.1038/nature03335
- Ding et al. (2022) Ding, X., Silverman, J. D., & Onoue, M. 2022, ApJ, 939, L28, doi: 10.3847/2041-8213/ac9c02
- D’Odorico et al. (2023) D’Odorico, V., Bañados, E., Becker, G. D., et al. 2023, MNRAS, 523, 1399, doi: 10.1093/mnras/stad1468
- Eilers et al. (2023) Eilers, A.-C., Simcoe, R. A., Yue, M., et al. 2023, ApJ, 950, 68, doi: 10.3847/1538-4357/acd776
- Fabian (2012) Fabian, A. C. 2012, ARA&A, 50, 455, doi: 10.1146/annurev-astro-081811-125521
- Fan et al. (2022) Fan, X., Banados, E., & Simcoe, R. A. 2022, arXiv e-prints, arXiv:2212.06907, doi: 10.48550/arXiv.2212.06907
- Fan et al. (2001) Fan, X., Narayanan, V. K., Lupton, R. H., et al. 2001, AJ, 122, 2833, doi: 10.1086/324111
- Fan et al. (2003) Fan, X., Strauss, M. A., Schneider, D. P., et al. 2003, AJ, 125, 1649, doi: 10.1086/368246
- Farina et al. (2022) Farina, E. P., Schindler, J.-T., Walter, F., et al. 2022, ApJ, 941, 106, doi: 10.3847/1538-4357/ac9626
- Feng et al. (2016) Feng, Y., Di-Matteo, T., Croft, R. A., et al. 2016, MNRAS, 455, 2778, doi: 10.1093/mnras/stv2484
- Fiore et al. (2017) Fiore, F., Feruglio, C., Shankar, F., et al. 2017, A&A, 601, A143, doi: 10.1051/0004-6361/201629478
- Fujimoto et al. (2020) Fujimoto, S., Oguri, M., Nagao, T., Izumi, T., & Ouchi, M. 2020, ApJ, 891, 64, doi: 10.3847/1538-4357/ab718c
- Furtak et al. (2023) Furtak, L. J., Labbé, I., Zitrin, A., et al. 2023, arXiv e-prints, arXiv:2308.05735, doi: 10.48550/arXiv.2308.05735
- Gaia Collaboration et al. (2018) Gaia Collaboration, Brown, A. G. A., Vallenari, A., et al. 2018, A&A, 616, A1, doi: 10.1051/0004-6361/201833051
- Goulding et al. (2023) Goulding, A. D., Greene, J. E., Setton, D. J., et al. 2023, arXiv e-prints, arXiv:2308.02750, doi: 10.48550/arXiv.2308.02750
- Harikane et al. (2023) Harikane, Y., Zhang, Y., Nakajima, K., et al. 2023, arXiv e-prints, arXiv:2303.11946, doi: 10.48550/arXiv.2303.11946
- Heckman & Best (2014) Heckman, T. M., & Best, P. N. 2014, ARA&A, 52, 589, doi: 10.1146/annurev-astro-081913-035722
- Hopkins et al. (2008) Hopkins, P. F., Hernquist, L., Cox, T. J., & Kereš, D. 2008, ApJS, 175, 356, doi: 10.1086/524362
- Horne (1986) Horne, K. 1986, PASP, 98, 609, doi: 10.1086/131801
- Izumi et al. (2019) Izumi, T., Onoue, M., Matsuoka, Y., et al. 2019, PASJ, 71, 111, doi: 10.1093/pasj/psz096
- Jahnke & Macciò (2011) Jahnke, K., & Macciò, A. V. 2011, ApJ, 734, 92, doi: 10.1088/0004-637X/734/2/92
- Jiang et al. (2015) Jiang, L., McGreer, I. D., Fan, X., et al. 2015, AJ, 149, 188, doi: 10.1088/0004-6256/149/6/188
- Jiang et al. (2016) —. 2016, ApJ, 833, 222, doi: 10.3847/1538-4357/833/2/222
- Johnson et al. (2021) Johnson, B. D., Leja, J., Conroy, C., & Speagle, J. S. 2021, ApJS, 254, 22, doi: 10.3847/1538-4365/abef67
- Kashino et al. (2023a) Kashino, D., Lilly, S. J., Matthee, J., et al. 2023a, ApJ, 950, 66, doi: 10.3847/1538-4357/acc588
- Kashino et al. (2023b) Kashino, D., Lilly, S. J., Simcoe, R. A., et al. 2023b, Nature, 617, 261, doi: 10.1038/s41586-023-05901-3
- Kaspi et al. (2005) Kaspi, S., Maoz, D., Netzer, H., et al. 2005, ApJ, 629, 61, doi: 10.1086/431275
- King & Pounds (2015) King, A., & Pounds, K. 2015, ARA&A, 53, 115, doi: 10.1146/annurev-astro-082214-122316
- Kocevski et al. (2023) Kocevski, D. D., Onoue, M., Inayoshi, K., et al. 2023, arXiv e-prints, arXiv:2302.00012, doi: 10.48550/arXiv.2302.00012
- Kokorev et al. (2023) Kokorev, V., Fujimoto, S., Labbe, I., et al. 2023, arXiv e-prints, arXiv:2308.11610, doi: 10.48550/arXiv.2308.11610
- Kormendy & Gebhardt (2001) Kormendy, J., & Gebhardt, K. 2001, in American Institute of Physics Conference Series, Vol. 586, 20th Texas Symposium on relativistic astrophysics, ed. J. C. Wheeler & H. Martel, 363–381, doi: 10.1063/1.1419581
- Kormendy & Ho (2013) Kormendy, J., & Ho, L. C. 2013, ARA&A, 51, 511, doi: 10.1146/annurev-astro-082708-101811
- Larson et al. (2023) Larson, R. L., Finkelstein, S. L., Kocevski, D. D., et al. 2023, arXiv e-prints, arXiv:2303.08918, doi: 10.48550/arXiv.2303.08918
- Lauer et al. (2007) Lauer, T. R., Tremaine, S., Richstone, D., & Faber, S. M. 2007, ApJ, 670, 249, doi: 10.1086/522083
- Li et al. (2022) Li, J., Silverman, J. D., Izumi, T., et al. 2022, ApJ, 931, L11, doi: 10.3847/2041-8213/ac6de8
- Maiolino et al. (2023) Maiolino, R., Scholtz, J., Curtis-Lake, E., et al. 2023, arXiv e-prints, arXiv:2308.01230, doi: 10.48550/arXiv.2308.01230
- Marshall et al. (2021) Marshall, M. A., Wyithe, J. S. B., Windhorst, R. A., et al. 2021, MNRAS, 506, 1209, doi: 10.1093/mnras/stab1763
- Marshall et al. (2020) Marshall, M. A., Mechtley, M., Windhorst, R. A., et al. 2020, ApJ, 900, 21, doi: 10.3847/1538-4357/abaa4c
- Marshall et al. (2023) Marshall, M. A., Perna, M., Willott, C. J., et al. 2023, arXiv e-prints, arXiv:2302.04795, doi: 10.48550/arXiv.2302.04795
- Matsuoka et al. (2014) Matsuoka, Y., Strauss, M. A., Price, Ted N., I., & DiDonato, M. S. 2014, ApJ, 780, 162, doi: 10.1088/0004-637X/780/2/162
- Matsuoka et al. (2018) Matsuoka, Y., Iwasawa, K., Onoue, M., et al. 2018, ApJS, 237, 5, doi: 10.3847/1538-4365/aac724
- Matthee et al. (2023a) Matthee, J., Mackenzie, R., Simcoe, R. A., et al. 2023a, ApJ, 950, 67, doi: 10.3847/1538-4357/acc846
- Matthee et al. (2023b) Matthee, J., Naidu, R. P., Brammer, G., et al. 2023b, arXiv e-prints, arXiv:2306.05448, doi: 10.48550/arXiv.2306.05448
- Mazzucchelli et al. (2023) Mazzucchelli, C., Bischetti, M., D’Odorico, V., et al. 2023, arXiv e-prints, arXiv:2306.16474. https://arxiv.org/abs/2306.16474
- Mechtley (2014) Mechtley, M. 2014, PhD thesis, Arizona State University
- Mechtley et al. (2016) Mechtley, M., Jahnke, K., Windhorst, R. A., et al. 2016, ApJ, 830, 156, doi: 10.3847/0004-637X/830/2/156
- Merloni & Heinz (2008) Merloni, A., & Heinz, S. 2008, MNRAS, 388, 1011, doi: 10.1111/j.1365-2966.2008.13472.x
- Mortlock et al. (2011) Mortlock, D. J., Warren, S. J., Venemans, B. P., et al. 2011, Nature, 474, 616, doi: 10.1038/nature10159
- Neeleman et al. (2021) Neeleman, M., Novak, M., Venemans, B. P., et al. 2021, ApJ, 911, 141, doi: 10.3847/1538-4357/abe70f
- Park et al. (2022) Park, D., Barth, A. J., Ho, L. C., & Laor, A. 2022, ApJS, 258, 38, doi: 10.3847/1538-4365/ac3f3e
- Peng (2007) Peng, C. Y. 2007, ApJ, 671, 1098, doi: 10.1086/522774
- Perrin et al. (2014) Perrin, M. D., Sivaramakrishnan, A., Lajoie, C.-P., et al. 2014, in Society of Photo-Optical Instrumentation Engineers (SPIE) Conference Series, Vol. 9143, Space Telescopes and Instrumentation 2014: Optical, Infrared, and Millimeter Wave, ed. J. Oschmann, Jacobus M., M. Clampin, G. G. Fazio, & H. A. MacEwen, 91433X, doi: 10.1117/12.2056689
- Plazas et al. (2018) Plazas, A. A., Shapiro, C., Smith, R., Huff, E., & Rhodes, J. 2018, PASP, 130, 065004, doi: 10.1088/1538-3873/aab820
- Prochaska et al. (2020) Prochaska, J. X., Hennawi, J. F., Westfall, K. B., et al. 2020, Journal of Open Source Software, 5, 2308, doi: 10.21105/joss.02308
- Reines & Volonteri (2015) Reines, A. E., & Volonteri, M. 2015, ApJ, 813, 82, doi: 10.1088/0004-637X/813/2/82
- Runnoe et al. (2012) Runnoe, J. C., Brotherton, M. S., & Shang, Z. 2012, MNRAS, 422, 478, doi: 10.1111/j.1365-2966.2012.20620.x
- Shen & Liu (2012) Shen, Y., & Liu, X. 2012, ApJ, 753, 125, doi: 10.1088/0004-637X/753/2/125
- Shen et al. (2019) Shen, Y., Wu, J., Jiang, L., et al. 2019, ApJ, 873, 35, doi: 10.3847/1538-4357/ab03d9
- Stetson (1987) Stetson, P. B. 1987, PASP, 99, 191, doi: 10.1086/131977
- Stone et al. (2023) Stone, M., Lyu, J., Rieke, G. H., & Alberts, S. 2023, arXiv e-prints, arXiv:2308.00047, doi: 10.48550/arXiv.2308.00047
- Storchi-Bergmann & Schnorr-Müller (2019) Storchi-Bergmann, T., & Schnorr-Müller, A. 2019, Nature Astronomy, 3, 48, doi: 10.1038/s41550-018-0611-0
- Storey & Zeippen (2000) Storey, P. J., & Zeippen, C. J. 2000, MNRAS, 312, 813, doi: 10.1046/j.1365-8711.2000.03184.x
- Tremaine et al. (2002) Tremaine, S., Gebhardt, K., Bender, R., et al. 2002, ApJ, 574, 740, doi: 10.1086/341002
- Vanden Berk et al. (2001) Vanden Berk, D. E., Richards, G. T., Bauer, A., et al. 2001, AJ, 122, 549, doi: 10.1086/321167
- Venemans et al. (2016) Venemans, B. P., Walter, F., Zschaechner, L., et al. 2016, ApJ, 816, 37, doi: 10.3847/0004-637X/816/1/37
- Venemans et al. (2017) Venemans, B. P., Walter, F., Decarli, R., et al. 2017, ApJ, 837, 146, doi: 10.3847/1538-4357/aa62ac
- Venemans et al. (2020) Venemans, B. P., Walter, F., Neeleman, M., et al. 2020, ApJ, 904, 130, doi: 10.3847/1538-4357/abc563
- Vestergaard & Peterson (2006) Vestergaard, M., & Peterson, B. M. 2006, ApJ, 641, 689, doi: 10.1086/500572
- Volonteri (2012) Volonteri, M. 2012, Science, 337, 544, doi: 10.1126/science.1220843
- Wang et al. (2019a) Wang, F., Wang, R., Fan, X., et al. 2019a, ApJ, 880, 2, doi: 10.3847/1538-4357/ab2717
- Wang et al. (2019b) Wang, F., Yang, J., Fan, X., et al. 2019b, ApJ, 884, 30, doi: 10.3847/1538-4357/ab2be5
- Wang et al. (2021) —. 2021, ApJ, 907, L1, doi: 10.3847/2041-8213/abd8c6
- Wu & Shen (2022) Wu, Q., & Shen, Y. 2022, ApJS, 263, 42, doi: 10.3847/1538-4365/ac9ead
- Wu et al. (2015) Wu, X.-B., Wang, F., Fan, X., et al. 2015, Nature, 518, 512, doi: 10.1038/nature14241
- Yang et al. (2020) Yang, J., Wang, F., Fan, X., et al. 2020, ApJ, 897, L14, doi: 10.3847/2041-8213/ab9c26
- Yang et al. (2021) —. 2021, ApJ, 923, 262, doi: 10.3847/1538-4357/ac2b32
- Yang et al. (2023) —. 2023, arXiv e-prints, arXiv:2304.09888, doi: 10.48550/arXiv.2304.09888
- Yue et al. (2018) Yue, M., Jiang, L., Shen, Y., et al. 2018, ApJ, 863, 21, doi: 10.3847/1538-4357/aacf04
- Yue et al. (2021) Yue, M., Yang, J., Fan, X., et al. 2021, ApJ, 917, 99, doi: 10.3847/1538-4357/ac0af4
- Zhang et al. (2023) Zhang, H., Behroozi, P., Volonteri, M., et al. 2023, MNRAS, 523, L69, doi: 10.1093/mnrasl/slad060
- Zhuang & Shen (2023) Zhuang, M.-Y., & Shen, Y. 2023, arXiv e-prints, arXiv:2304.13776, doi: 10.48550/arXiv.2304.13776