A search for the afterglows, kilonovae, and host galaxies of two short GRBs: GRB 211106A and GRB 211227A
Abstract
Context. GRB 211106A and GRB 211227A are two recent gamma-ray bursts (GRBs) whose initial X-ray position enabled us to possibly associate them with bright, low-redshift galaxies (¡0.7). The prompt emission properties suggest that GRB 211106A is a genuine short-duration GRB and GRB 211227A is a short GRB with extended emission. Therefore, they are likely to be produced by a compact binary merger. However, a classification based solely on the prompt emission properties can be misleading.
Aims. The possibility of having two short GRBs occurring in the local Universe makes them ideal targets for the search of associated kilonova (KN) emission and for detailed studies of the host galaxy properties.
Methods. We carried out deep optical and near-infrared (NIR) follow-up with the ESO-VLT FORS2, HAWK-I, and MUSE instruments for GRB 211106A and with ESO-VLT FORS2 and X-Shooter for GRB 211227A, starting from hours after the X-ray afterglow discovery up to days later. We performed photometric analysis to look for afterglow and KN emissions associated with the bursts, together with imaging and spectroscopic observations of the host galaxy candidates. We compared the results obtained from the optical/NIR observations with the available Swift X-Ray Telescope (XRT) and others high-energy data of both events.
Results. For both GRBs we placed deep limits to the optical/NIR afterglow and KN emission. We identified their associated host galaxies, GRB 211106A at a photometric redshift =0.64, GRB 211227A at a spectroscopic =0.228. From MUSE and X-Shooter spectra we derived the host galaxy properties, which turned out to be consistent with short GRBs typical hosts. We also compared the properties of GRB 211106A and GRB 211227A with those of the short GRBs belonging to the S-BAT4 sample, here extended up to December 2021, in order to further investigate the nature of these two bursts.
Conclusions. Our study of the prompt and afterglow phase of the two GRBs, together with the analysis of their associated host galaxies, allows us to confirm the classification of GRB 211106A as a short GRB, and GRB 211227A as a short GRB with extended emission. The absence of an optical/NIR counterpart down to deep magnitude limits is likely due to high local extinction for GRB 211106A and a peculiarly faint kilonova for GRB 211227A.
Key Words.:
gamma-rays:bursts - gamma-ray burst: individual: GRB 211106A - gamma-ray burst: individual: GRB 211227A1 Introduction
Two classes of gamma-ray bursts (GRBs), short and long, were identified based on the distribution of their prompt gamma-ray emission duration. Short GRBs (SGRBs) are those with duration shorter than about two seconds and with harder high-energy spectra with respect to long bursts (Kouveliotou et al., 1993). While it was firmly established that long GRBs (LGRBs) originate in core-collapse supernova (SN) explosions (Hjorth & Bloom, 2012), according to the most popular model, short GRBs are produced by the merger of compact objects, namely neutron stars (NSs) and black holes (BHs). The knowledge of short GRBs experienced an impressive boost in the past two decades. The discovery of short GRB afterglows in 2005 with the Neil Gehrels Swift Observatory (Swift) and the HETE-II satellites was a watershed moment in the study of these sources, providing the key to unravel their distance, energy scale, environments, and host galaxies (Gehrels et al., 2005; Fox et al., 2005; Villasenor et al., 2005; Hjorth et al., 2005; Barthelmy et al., 2005b; Berger et al., 2005; Covino et al., 2006).
To date, more than 150 short GRBs were found with Swift (/yr). A sizeable fraction of them have X-ray and optical afterglow detections, with a few having been detected also in radio (Fong et al., 2015, 2022). Short GRB afterglows are fainter on average than those of long GRBs and the great majority of short GRB redshifts are obtained through optical spectroscopy of their associated host galaxies. To this end, the precise localisation with Swift is a crucial asset to achieve a firm short GRB-host galaxy association (D’Avanzo et al., 2014). Properties like the absence of associated SNe, the afterglow faintness, the occurrence also in early-type galaxies, and the offset and redshift distribution definitely point towards a compact merger origin, at variance with what was observed for long GRBs (Berger, 2014; D’Avanzo, 2015). All these findings are in agreement with the compact object binary progenitor model (Eichler et al., 1989; Narayan et al., 1992; Nakar, 2007). These progenitors are also expected to be sources of high-frequency gravitational waves (GWs).
Another key signature of a NS-NS or NS-BH binary merger is the production of a so-called kilonova (KN), whose electromagnetic emission is powered by the decay of heavy radioactive species produced by rapid neutron capture (r-process) and ejected during the merger process (Li & Paczyński, 1998; Rosswog, 2005; Metzger et al., 2010). Excess infrared light seen in the light curves of several SGRBs between 3 and 10 days post-burst were argued as being likely due to such kilonova emission (e.g., Tanvir et al. 2013). The compact object binary progenitor model for short GRBs was spectacularly confirmed on August 17, 2017, when a GW event associated with a NS-NS merger, GW 170817, was detected for the first time by the Advanced Laser Interferometer Gravitational wave Observatory (aLIGO, Collaboration et al. 2015) and localized also thanks to Advanced Virgo (Acernese et al., 2014). The subsequent detections of the weak short GRB 170817A and the bright kilonova AT2017gfo (Abbott et al., 2017) were associated with the GW event. The emergence, weeks after the event, of an X-ray and radio counterpart, suggested the possibility of off-axis GRB afterglow emission (Hallinan et al., 2017; Troja et al., 2017). Besides providing the long-sought ”smoking gun” of short GRB progenitors, the case of GRB 170817A demonstrated that the GRB emission geometry differs (in this case, at least) from a simple uniform jet (Mooley et al. 2018; Ghirlanda et al. 2019, for a review, see Margutti & Chornock 2021).
The observations of GRB 060614 (Gehrels et al. 2006) and, more recently, of GRB 211211A (Rastinejad et al. 2022) suggested the existence of a subclass of short GRBs that mimic the behavior of long-duration GRBs, regarding the duration of their gamma-ray emission that largely exceeds the classical 2s separation threshold for GRB families. This fraction of short GRBs exhibits the presence of a prolonged -ray emission that is softer than the prompt spike (Lazzati et al., 2001), lasts tens of seconds, and may rise with a delayed onset (Norris & Bonnell, 2006; Norris et al., 2010). Such an emission component can dominate (in terms of fluence) the prompt spike emission (Perley et al., 2009).
Moreover, the short and long classification is further confused by the recent observation of peculiar GRBs of short duration associated with a supernova (e.g., GRB 200826A, Rossi et al. 2022), which was until then only associated with long GRBs. Besides the spectacular case of GRB 170817A and AT2017gfo, in recent years, other convincing evidence of KNe associated to short GRBs were reported (for a review, see Rossi et al., 2020). A peculiar case was the photometric detection of KN signatures in the optical and near-infrared (NIR) light curve of the long duration GRB 211211A, and more recently, the detection of heavy neutron capture elements associated with the long GRB 230307A (Levan et al., 2023). These events emphasised the need of caution in GRB classification, providing evidence that also long duration GRBs may orginate from compact binary merger progenitors. On the other hand, the characteristics of the prompt emission of GRB 2111211A may indicate that this event can be actually classified as a Short GRB with extended emission (Rastinejad et al., 2022; Troja et al., 2022; Gompertz et al., 2023).
In this work we present the results of an extensive multi-band study of two GRBs, possibly originating from the merger of compact objects, namely GRB 211106A (a short-duration GRB) and GRB 211227A (a short GRB with extended emission). The properties of the GRBs and host galaxies are compared to those of the short GRBs belonging to the S-BAT4 sample (D’Avanzo et al., 2014), for which we provide here an extension including events up to 2021. In §2 and §3 we present observations of the two GRBs. In §4 and §5 data analysis procedure and the first results are described, and in §6 a full discussion is presented. Our main conclusions are summarized in §7.
Throughout the paper, we adopt CDM model with cosmological parameters = 0.308, = 0.692, and = 67.8 km s-1 Mpc-1 (Planck Collaboration et al., 2016). All magnitudes presented in this work are given in AB system, unless otherwise specified. Errors are at the 68% confidence level (c.l.), unless stated otherwise. All filter curves considered in this work are taken from the the SVO Filter Profile Service (Rodrigo et al. 2012; Rodrigo & Solano 2020).
2 GRB 211106A
2.1 Prompt phase
GRB 211106A was first detected with the INTEGRAL gamma-ray satellite (Winkler et al., 2003) on 2021 Nov 6 at T0: 04:37:31.2 UTC. The INTEGRAL notice (#9504) was distributed in near real-time and triggered the Swift Mission Operations Center Gamma-ray Urgent Archiver for Novel Opportunities (GUANO, Tohuvavohu et al., 2020). Consequently, GUANO sent a command to the Swift Burst Alert Telescope (BAT, Barthelmy et al., 2005a) to save 90 seconds of BAT event-mode data from [-45,+45] s around the time of the burst. Then, the BAT likelihood search, NITRATES (DeLaunay & Tohuvavohu, 2021), confidently detected the burst with an estimated T90 equal to 1.75 0.05 s in the 15-350 keV energy band (Tohuvavohu et al., 2021), making it a candidate for the short GRB class. From the Swift/BAT data, it has also been possible to derive the GRB position with coordinates (J2000) R.A. = 22:54:34.32, Dec. = 53:14:0.9, with an uncertainty of 7 arcmin (radius, 90% c.l.; Tohuvavohu et al. 2021).
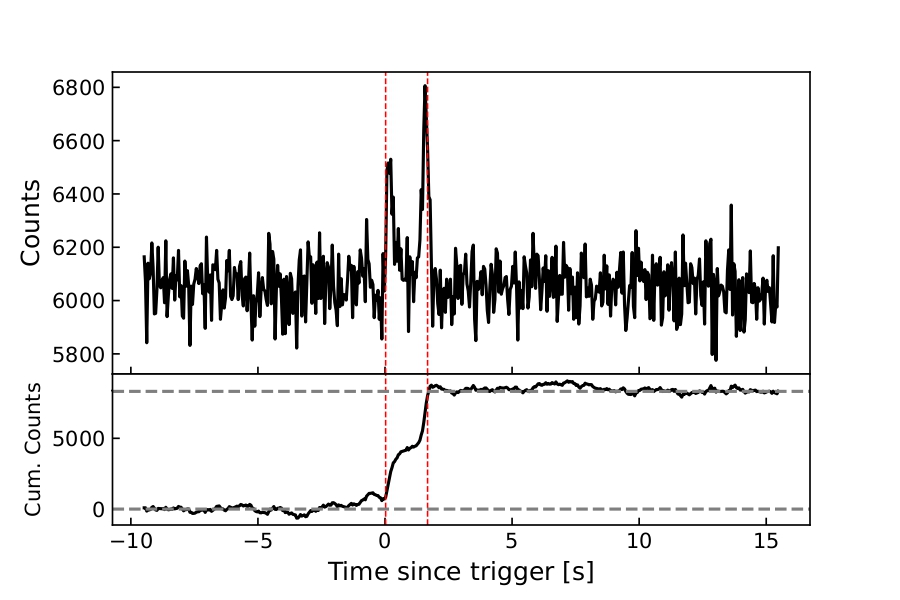
GRB 211106A also triggered the Konus-Wind satellite on 2021 Nov 6 at T: 04:37:32.485 UTC (Ridnaia et al., 2021). The burst light curve showed a single pulse starting at T0.3 s with a total duration of 0.5 s. The Konus-Wind trigger time is consistent with the time of the second peak in the INTEGRAL and BAT light curve (Laskar et al., 2022). The GRB prompt emission has also been detected at a sub-threshold level by Fermi/GBM, through a targeted search (Fletcher & Fermi-GBM Team, 2021).
The INTEGRAL light curve (Fig. 1) shows two pulses, with T s. The same shape and duration is also observed in the Swift/BAT and Fermi/GBM light curves (Laskar et al., 2022).
2.2 Afterglow phase
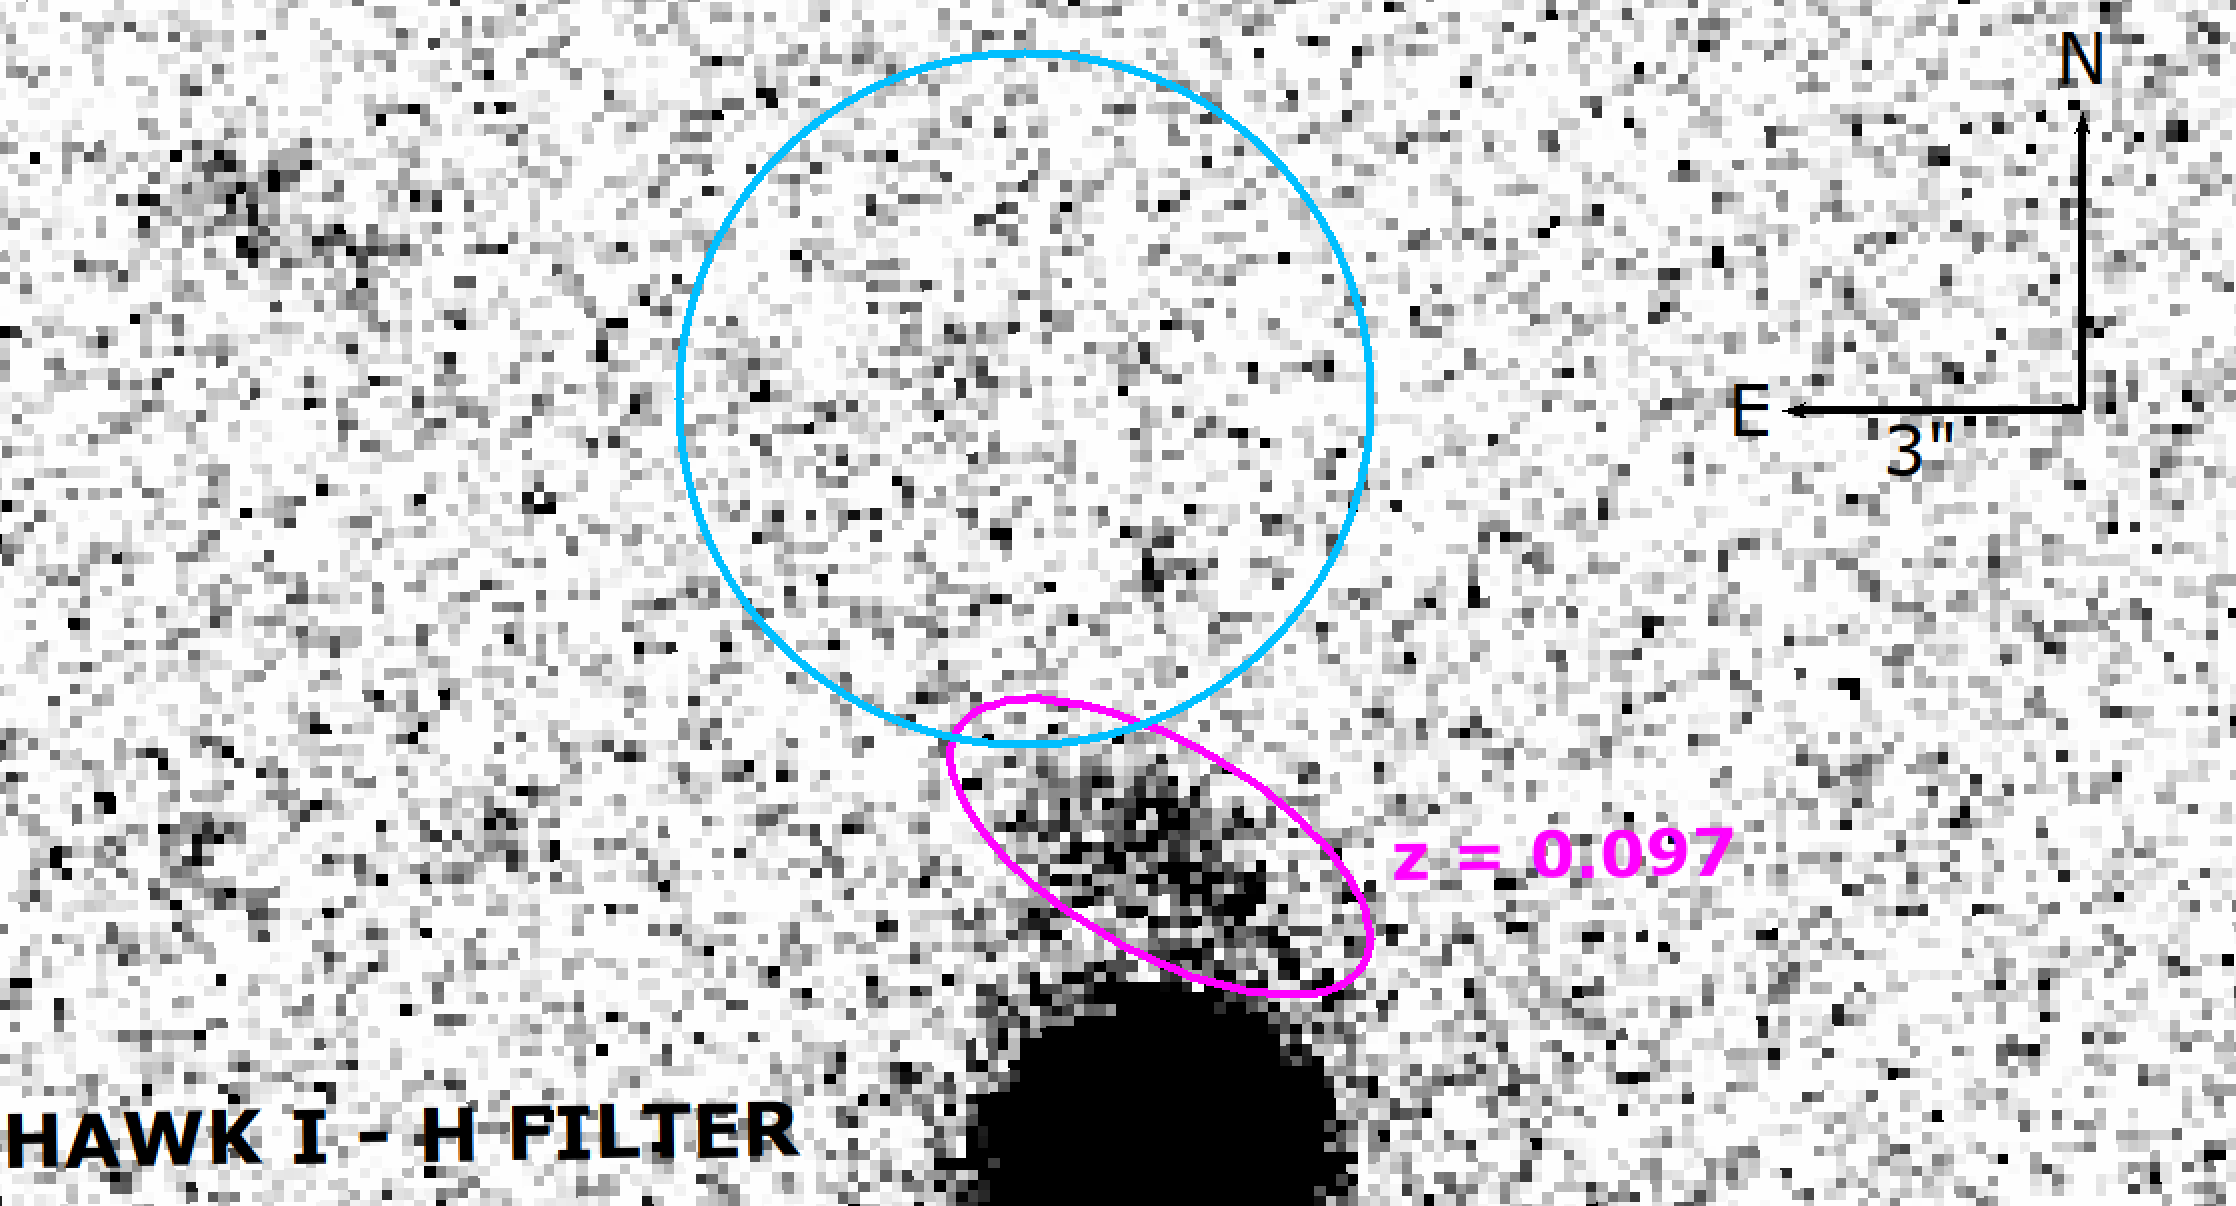
Following the Swift/BAT-GUANO detection of GRB 211106A, the Swift X-Ray Telescope (XRT, Burrows et al., 2005) performed follow-up observations, starting at T0+39.2 ks (D’Elia et al., 2021b). An uncatalogued, fading source was detected at the coordinates (J2000) R.A. = 22:54:20.45, Dec. = 53:13:49.0, with an uncertainty of (radius, 90% c.l.) and was proposed as the GRB X-ray afterglow (D’Elia et al., 2021a). The source was followed-up in the optical from the ground using the ESO-VLT UT1 equipped with the FORS2 camera, and two nearby galaxies were found (Malesani et al., 2021a). The closest (in projection) of them is 4.8′′ away from the center of the Swift/XRT error circle at a redshift = 0.097, as inferred by the detection of the [OIII] doublet and Hβ in the emission (Christensen et al., 2021).
Follow-up observations of the X-ray afterglow were also performed with the Chandra X-ray Observatory and with the XMM-Newton, between about 10.4 and 59.8 days after the burst (Berger et al., 2021; Rouco Escorial et al., 2021). These observations enabled a more precise localisation of the afterglow. In particular, the position obtained with Chandra is (J2000) R.A. = 22:54:20.518, Dec. = 53:13:50.59, with an uncertainty of and an angular offset of 3.76′′ with respect to the galaxy at = 0.097 (Berger et al., 2021).
Further optical/NIR observations were taken with the Hubble Space Telescope (HST) in three different epochs, at 19.2, 25.3 and 48.2 days after the trigger, respectively. A single, possibly extended, source within the Chandra error circle was detected at (J2000): R.A. = 22:54:20.54, Dec. = 53:13:50.6, with an uncertainty of 0.05′′. Photometry indicates magnitudes of 25.791 0.069 and 25.709 0.016 (Kilpatrick et al., 2021; Laskar et al., 2022), and no evidence for fading during the 29-day baseline.
Finally, GRB 211106A was followed-up in the millimeter (97.5 GHz) and radio (5.5, 9.0 and 18.0 GHz) bands with the Atacama Large Millimeter/Submillimeter Array (ALMA) and with the Australia Telescope Compact Array (ATCA), respectively. The observations were carried out between 13 and 117 days after the burst and led to a detection of mm and radio afterglows (Laskar et al., 2022) at the following (ALMA) position (J2000): R.A. = 22:54:20.53056 (0.011′′), Dec. = 53:13:50.525 (0.010′′). This position is consistent with the Chandra one and lies within the optical, non-variable, extended source detected with HST, making it a likely host galaxy candidate for GRB 211106A (Laskar et al., 2022).
3 GRB 211227A
3.1 Prompt phase
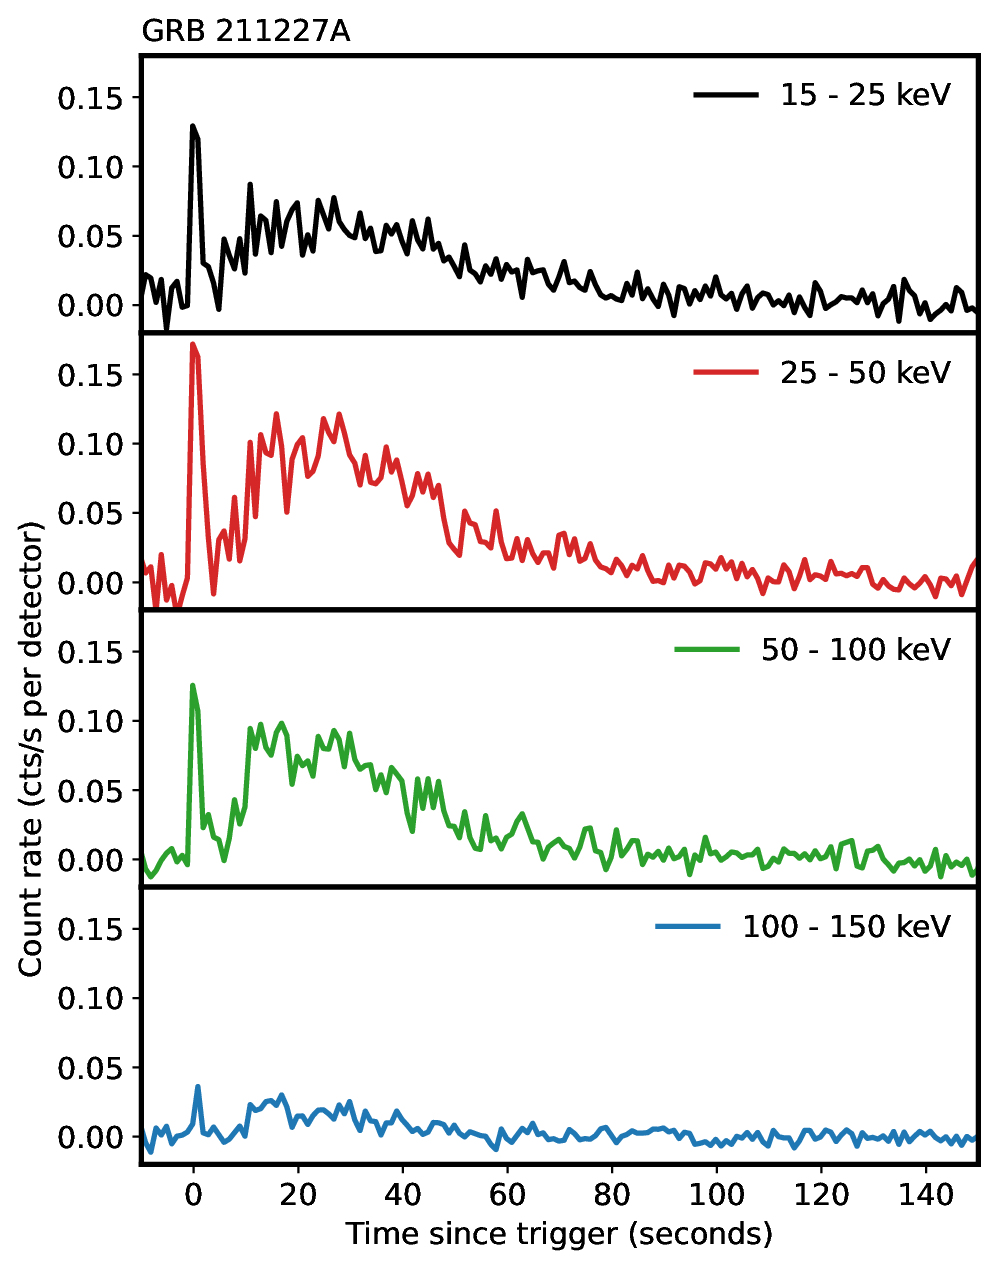
GRB 211227A was detected with Swift/BAT on 2021 Dec 27 at T0 = 23:32:06 UT (Beardmore et al., 2021), at the position (J2000) R.A. = 08:48:34.5, Dec. = 02:44:10.9, with an uncertainty of 1.4 arcmin (radius, 90% c.l.). T90 in the 15-150 keV band is 83.8 8.5 s. The GRB was detected with MAXI/GSC (Tominaga et al., 2021), CALET (Cherry et al., 2021) and Konus-Wind (Tsvetkova et al., 2022). A joint analysis of the prompt emission data collected with Konus-Wind and Swift/BAT revealed a light curve with two main episodes, a narrow pulse peaking at T0 and a second broader pulse peaking at T0+11 s (Tsvetkova et al., 2022). The Swift/BAT light curve morphology (Fig. 2) suggests that GRB 211227A is a short GRB with extended emission (Malesani et al., 2021b). Such a conclusion was reached also by Lü et al. (2022) and Zhu et al. (2022) from the joint analysis of the Konus-Wind and Swift/BAT prompt emission properties.
3.2 Afterglow phase
Following the Swift/BAT detection, the Swift/XRT began observing the field from T0+63 s and found a bright, uncatalogued fading source at the coordinates (J2000) R.A. = 08:48:35.73, Dec. = 02:44:07.1, with an uncertainty of 2.4′′ (radius, 90% c.l.).
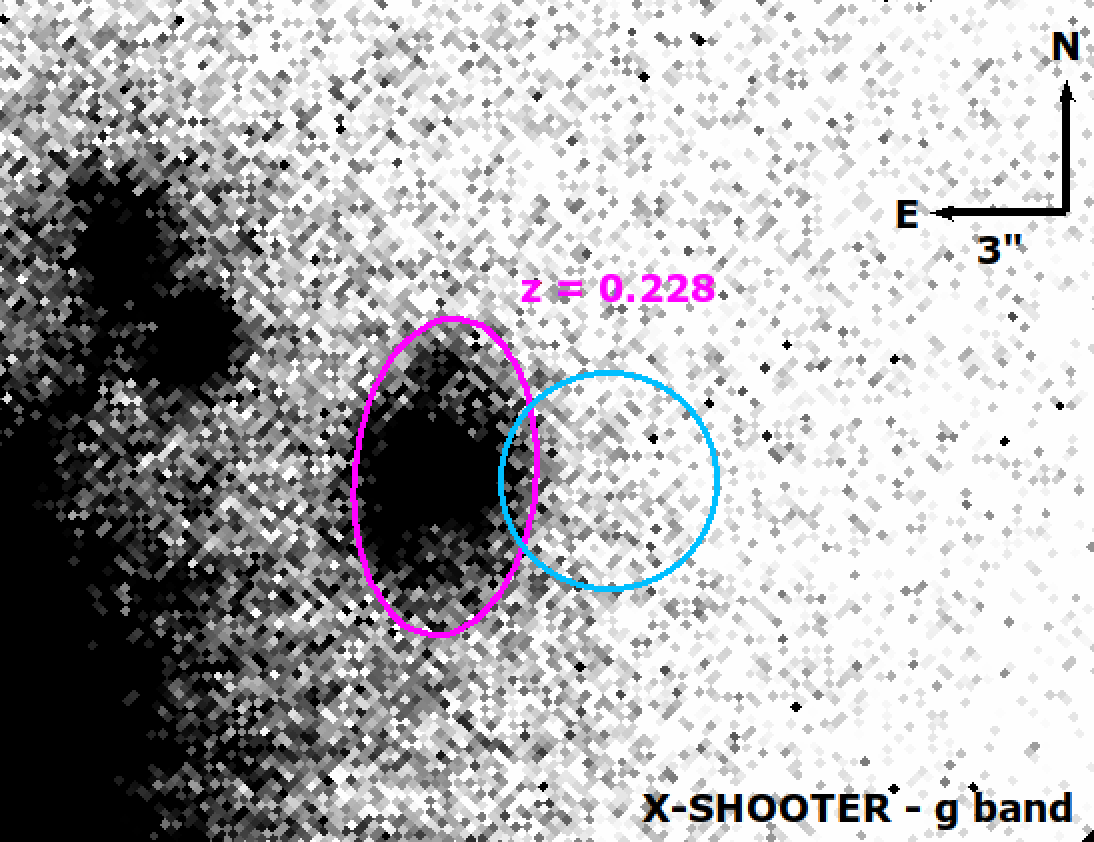
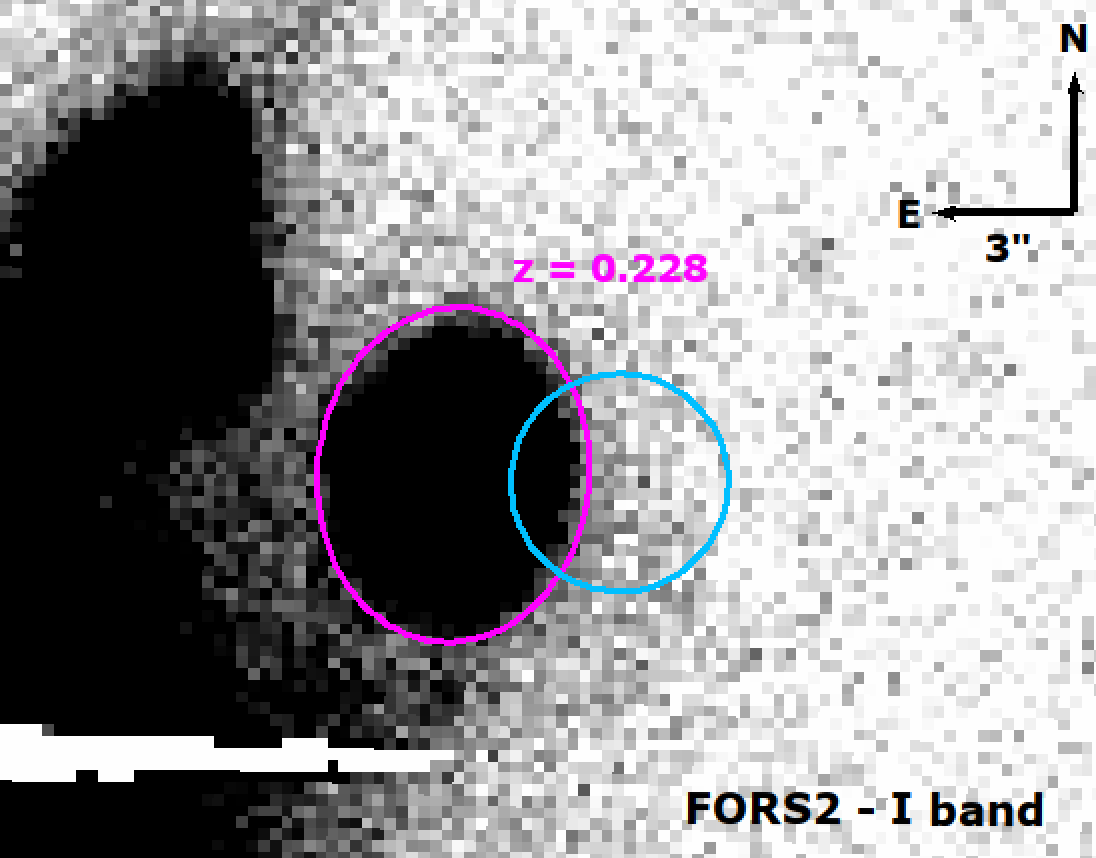
Ground-based observations were performed using the ESO-VLT UT3 equipped with the X-Shooter spectrograph (Vernet et al., 2011). No optical counterpart was detected within the XRT error circle in the images obtained with the acquisition camera, but a fairly bright galaxy ( 19.4 mag) was found 3.67′′ away from its center, with its light extending within the XRT error circle (Malesani et al., 2021b). X-Shooter spectroscopy of this galaxy revealed the presence of several emission lines ([O II], Hβ, [O III] 5007, Hα, [N II], [S II]), all at a common redshift = 0.228 (Malesani et al., 2021b). Further deep optical observations were performed with the Liverpool telescope (Perley, 2021), CAHA 2.2m telescope (Kann et al., 2021), and Gemini South telescope (O’Connor et al., 2022). No optical counterpart was detected within the XRT error circle in the three cases.
4 Observations and data analysis: GRB 211106A
| Date: (UT) | [d] | Instrument | [ x ] | Seeing [′′] | Filter |
|---|---|---|---|---|---|
| 2021-11-09 02:35:46.701 | 2.92 | FORS2 | 5 x 240 | 0.70 | |
| 2021-11-11 00:25:12.736 | 4.83 | HAWK-I | 20 x (6 x 10) | 0.86 | |
| 2021-11-12 00:36:16.074 | 5.85 | FORS2 | 16 x 180 | 0.83 | |
| 2021-12-04 00:45:50.842 | 27.85 | FORS2 | 8 x 300 | 0.69 | |
| 2021-11-10 00:15:43.829 | 3.88 | MUSE | 4 x 700 | 0.8-0.9 | - |
| [d] | Instrument / Filter | Magnitude | Mag. limit |
|---|---|---|---|
| 2.92 | FORS2 / | 26.37 0.23 | 26.7 (27.5)b |
| 5.85 | FORS2 / | 26.69 0.39a | 26.8 (27.5)b |
| 27.85 | FORS2 / | 26.51 0.23 | 26.6 |
| 4.83 | HAWK-I / | 23.6 | |
| 3.88 | MUSE / | 27.42 0.08 | |
| 3.88 | MUSE / | 26.45 0.10 | |
| 3.88 | MUSE / | 25.67 0.26 |
a In the second epoch the source is detected at more than 3 c.l. due to lower S/N.
b Limits found from photometry on the background, source-free, region.

4.1 Swift/XRT
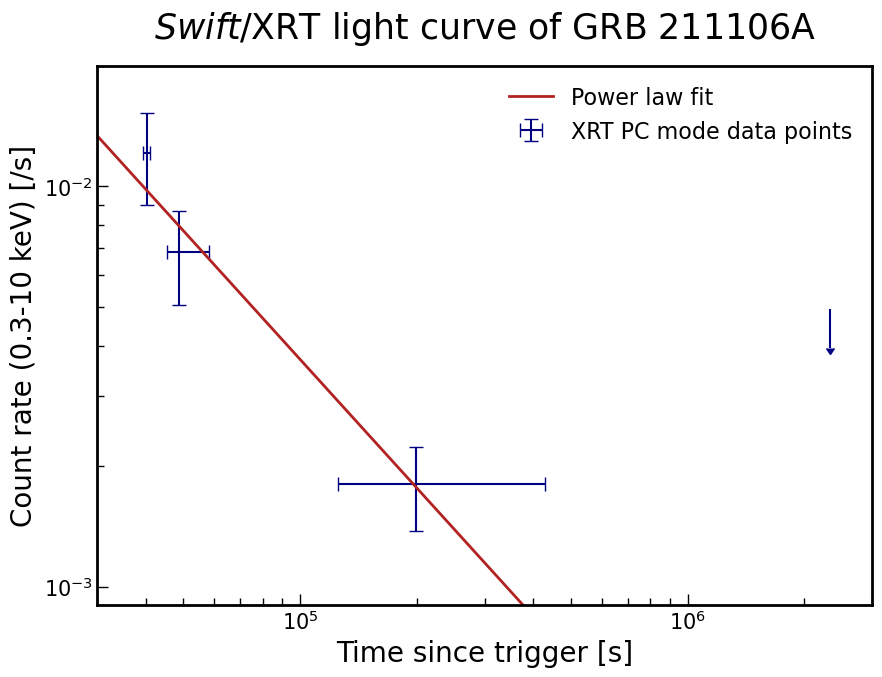
We retrieved the count-rate Swift/XRT light curve of GRB 211106A from the GRB XRT light curve repository222https://www.swift.ac.uk/xrt_curves/00021466/ (Evans et al., 2007, 2009). The light curve comprises 9.9 ks of Photon Counting (PC) mode data obtained between T0+39.2 ks and T0+428.8 ks. We found that the light curve can be satisfactorily fitted with a power-law (), with a slope = 1.07 0.21 (Fig. 3). The few photons collected, due to the late time pointing, prevented us from performing a useful spectral analysis.
4.2 Optical/NIR
We observed the field of GRB 211106A with ESO-VLT FORS2, HAWK-I and MUSE instruments. A complete log of the observations presented and analysed in this work is summarized in Table 1, and finding charts for the observations carried out with FORS2 and HAWK-I are shown in Fig. 4. The nights of observation were clear, with the seeing in the 0.7′′– 0.9′′ range.
4.2.1 VLT/FORS2
We obtained three epochs of observations with the ESO-VLT FORS2 instrument in the band at about 2.9, 5.9 and 27.9 days after the trigger. Data reduction was carried out following the standard procedures: after bias subtraction, non-uniformities were corrected using a normalized flat-field frame using the jitter tool under the ESO-Eclipse software package333https://www.eso.org/sci/software/eclipse/. The photometric calibration was achieved using Stetson field standard stars444https://www.canfar.net/storage/list/STETSON/Standards and by applying the computed offset for five more stars in the field. Astrometric solutions were computed against the USNO B-1 catalogue (Monet et al., 2003): the three images were found to have a manageable spatial offset 0.3′′. We performed aperture and point spread function (PSF) photometry using the DAOPHOT package (Stetson, 1987). We carried out image subtraction with the HOTPANTS (High Order Transform of Psf ANd Template Subtraction code, Becker, 2015) package to find and pinpoint variable sources in the field among the three FORS2 epochs, considering the latest epoch as the template image. The full width half maximum (FWHM) of each image is needed to properly model the PSF of both input images, and we computed average values of 3.34′′, 3.67′′, and 3.56′′ for the three epochs, respectively.
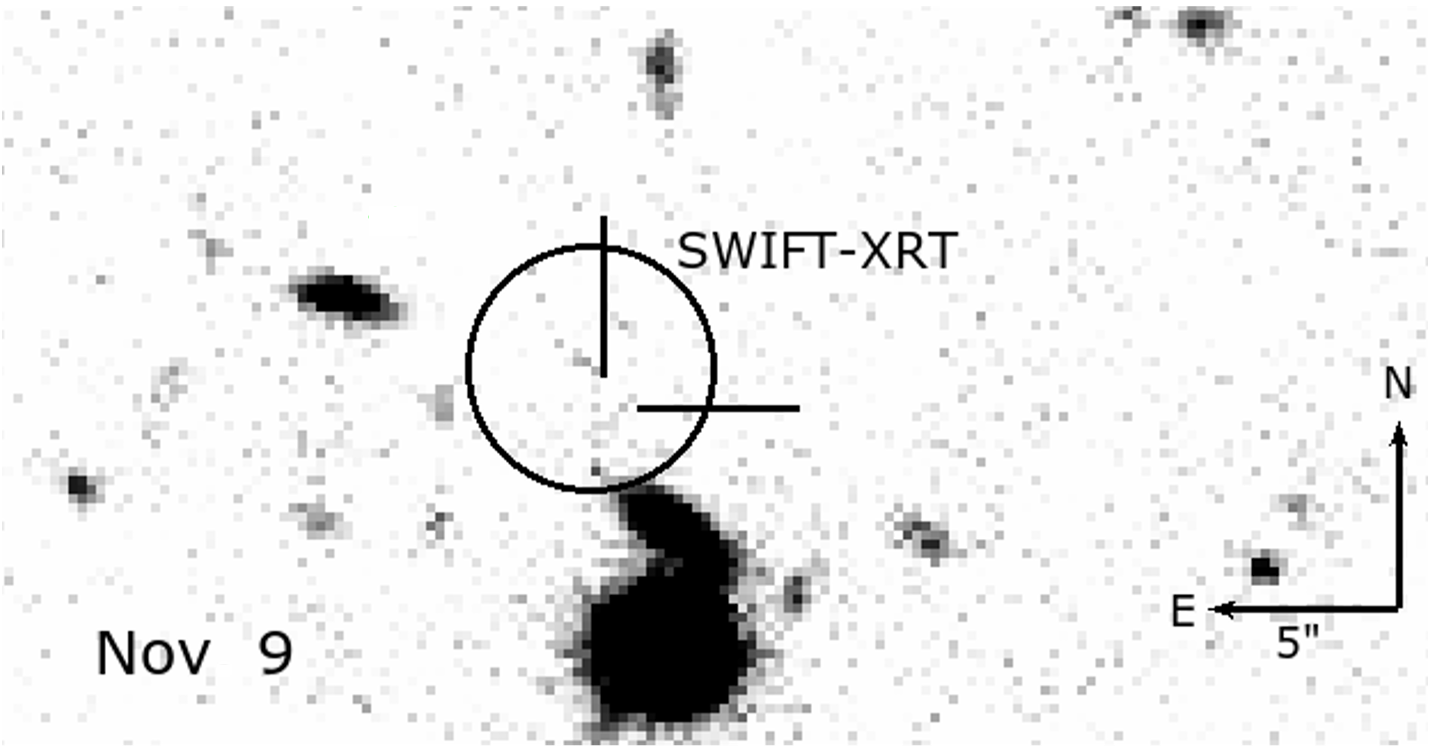
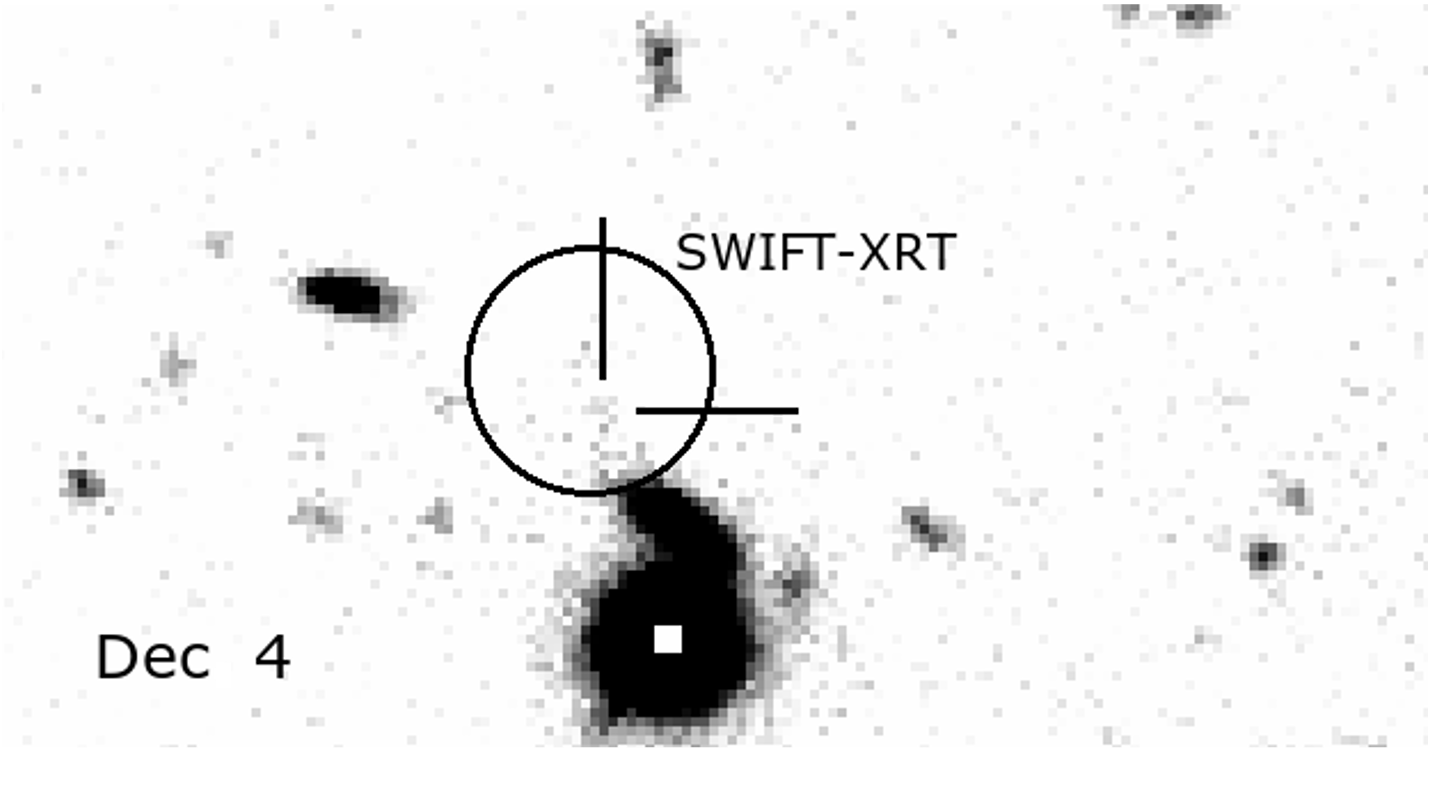
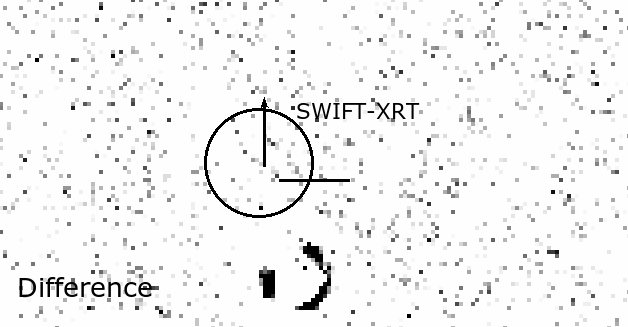
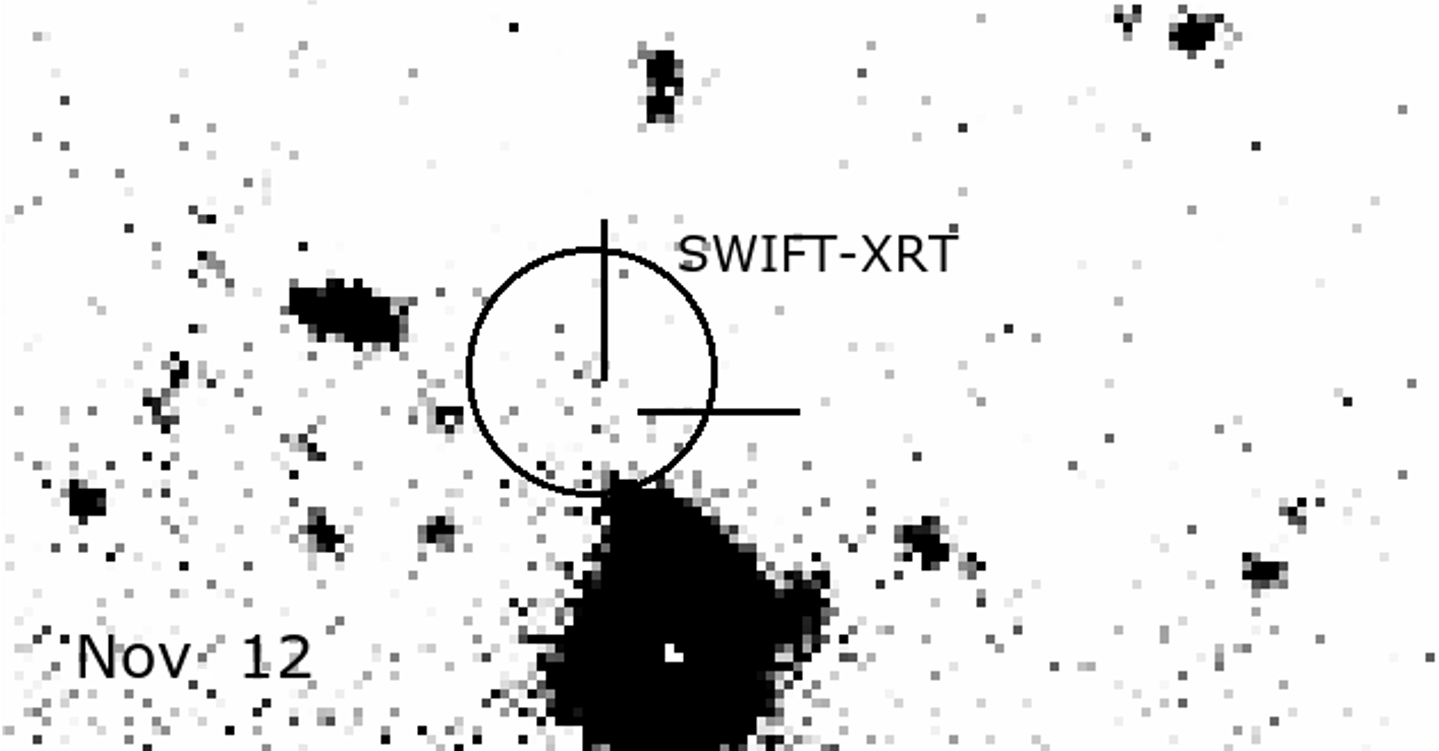
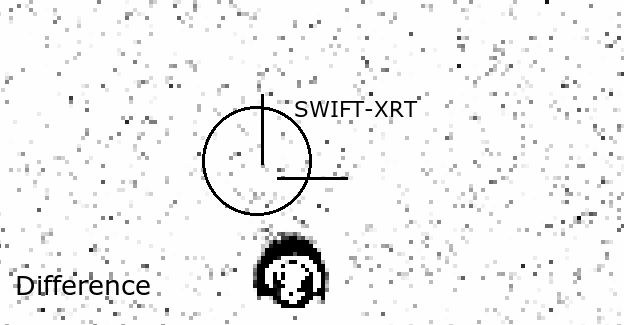
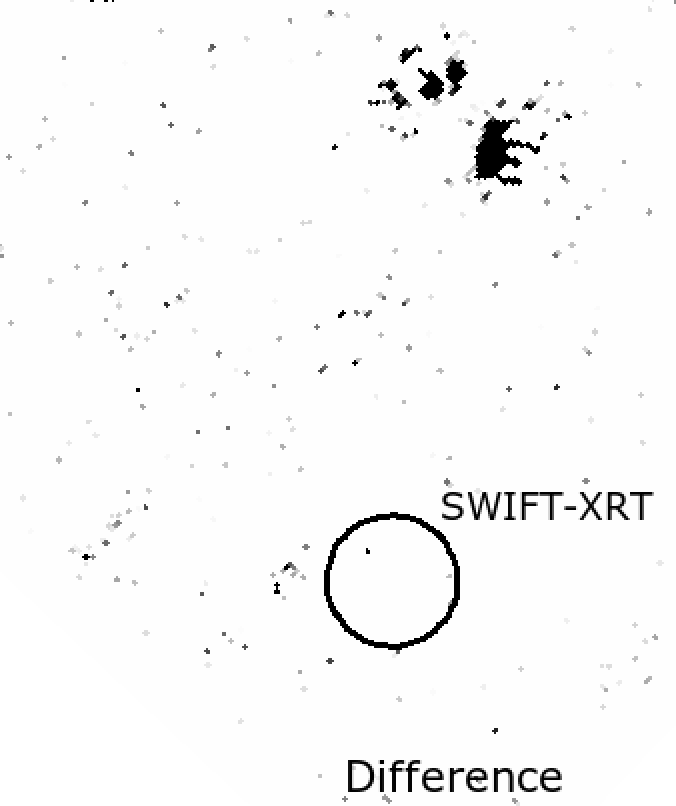
Top panels. Epoch 1 (Nov 9), 3 (Dec 4), and the corresponding subtraction. The circle represents the XRT 90% error region, while the position of the mm afterglow (Laskar et al., 2022) is indicated by the two black lines.
Bottom panels. Same as above with the comparison between epochs 2 (Nov 12) and 3 (Dec 4).
In our first band image, taken 2.9 days after the trigger, we found a source inside the Swift/XRT and Chandra error circles. For this source, we derived the following position (J2000): R.A. = 22:54:20.5, Dec. = 53:13:50.5, with an uncertainty of 0.3′′. This position is fully consistent with the one of the non-variable extended object detected in the HST images of the field (Kilpatrick et al., 2021) and proposed as the GRB 211106A host galaxy by Laskar et al. (2022). The first VLT/FORS2 observation was obtained with a CCD suffering fringing in the red part of the spectrum, while the second one showed the worst seeing among the three, therefore we considered the results obtained from the third epoch as the best value for the source: 26.51 0.23 mag. Lastly, the third epoch was taken sufficiently late to confidently rule out a significant possible contribution from the afterglow.
Image subtraction through the HOTPANTS software was performed to investigate the detectability of the optical afterglow. We placed in both epoch 1 and 2 images a dummy star of variable magnitude both at the position of the mm afterglow and in a nearby, source-free region, and we computed the difference with respect to the third epoch image. Then, we performed aperture photometry on the subtracted images at the two positions in order to find the deepest limit both for the afterglow detectability and the background at 3 confidence level. For the two subtractions in epoch 1 and 2 we found, within the candidate host galaxy region, limits of mag and mag, respectively; we also obtained mag for the background in both images.
For the third epoch, we computed = 26.6 as the minimum magnitude that the afterglow should have had, embedded in our detected source, in order to show a 3 variation. All images obtained for each epoch and the corresponding subtractions are shown in Fig. 5.
4.2.2 VLT/HAWK-I
We carried out NIR imaging observations of the field of GRB 211106A with the ESO-VLT HAWK-I instrument, in the band, at 4.8 d. Image reduction was carried out as above, while photometric calibration and astrometry were both performed against five 2MASS catalogue (Skrutskie et al., 2006) stars present in the field. A 0.2′′ spatial offset was found. Aperture and PSF Photometry were carried out with the DAOPHOT package; no credible source was detected within the XRT error circle down to a limiting magnitude of 23.6 mag.
4.2.3 VLT/MUSE
We obtained a single-epoch observation, 3.9 days after the trigger, with the MUSE integral field spectrograph, consisting of 4 exposures of 700 s each. Data reduction was carried out following standard procedures with a Python-based custom script. Given the faintness of the object detected in our FORS2 observations (§4.2.1), we were unable to retrieve a clean spectrum for this source from the MUSE datacube. Nevertheless, we obtained three images integrating the datacube for a wavelength coverage equivalent to , , and filter, respectively. We computed the corresponding magnitudes for the source using a circular aperture of 0.6′′. All our photometric results are reported in Table 1.
5 Observation and data analysis: GRB 211227A
| Date: (UT) | [d] | Instrument | [ x ] | Seeing [′′] | Filter |
|---|---|---|---|---|---|
| 2021-12-28 04:35:34.333 | 0.211 | X-Shooter | 3 x 30 | 0.70 | |
| 2021-12-28 04:38:09.773 | 0.213 | X-Shooter | 3 x 60 | 0.61 | |
| 2021-12-28 04:42:16.433 | 0.216 | X-Shooter | 3 x 40 | 0.76 | |
| 2021-12-29 03:51:11.544 | 1.193 | FORS2 | 8 x 240 | 0.93 | |
| 2021-12-29 05:08:40.348 | 1.235 | X-Shooter | 3 x 60 | 0.89 | |
| 2021-12-29 05:12:45.808 | 1.239 | X-Shooter | 6 x 60 | 0.73 | |
| 2021-12-27 04:45:24.139 | 0.233 | X-Shooter | 4 x 600 | - | - |
5.1 Swift/XRT
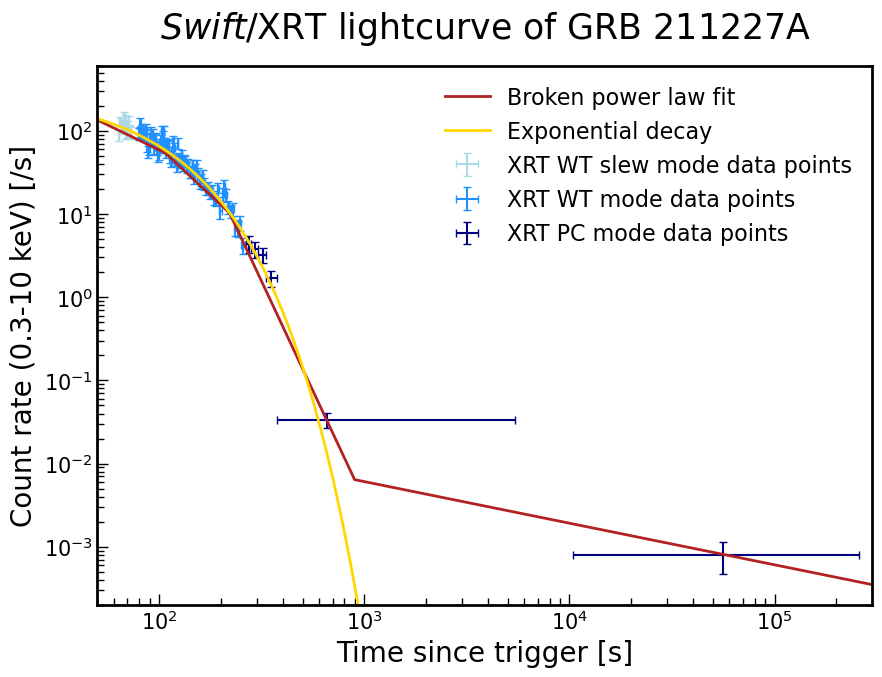
We retrieved the count-rate Swift/XRT light curve of GRB 211227A from the GRB XRT light curve repository555https://www.swift.ac.uk/xrt_curves/01091101/ (Evans et al., 2007, 2009). The light curve comprises 8.1 ks of data obtained between T0+63 s and T0+57.9 ks, 182 s of which in Windowed Timing (WT) mode, while the remainder in PC mode. We found that the light curve can be fitted with a broken power-law with three breaks (see Fig. 6). At early times, the curve decays with indices , (with a first break at T0+106.4 s), then, from T0+219.8 s to T0+895, it follows an extremely steep () decay, before ending with a shallower evolution, , suggesting a possible plateau (all errors are at 90% c.l.). However, the lack of additional data at later times prevented us from confirming this flattening. We also fit the light curve (excluding the last point) with an exponential decay, obtaining a good match: 126.4/96. This early exponential profile in the X-rays is consistent with previous extended emission GRBs (Gompertz et al., 2013) and with GRB 211211A (Gompertz et al., 2023).
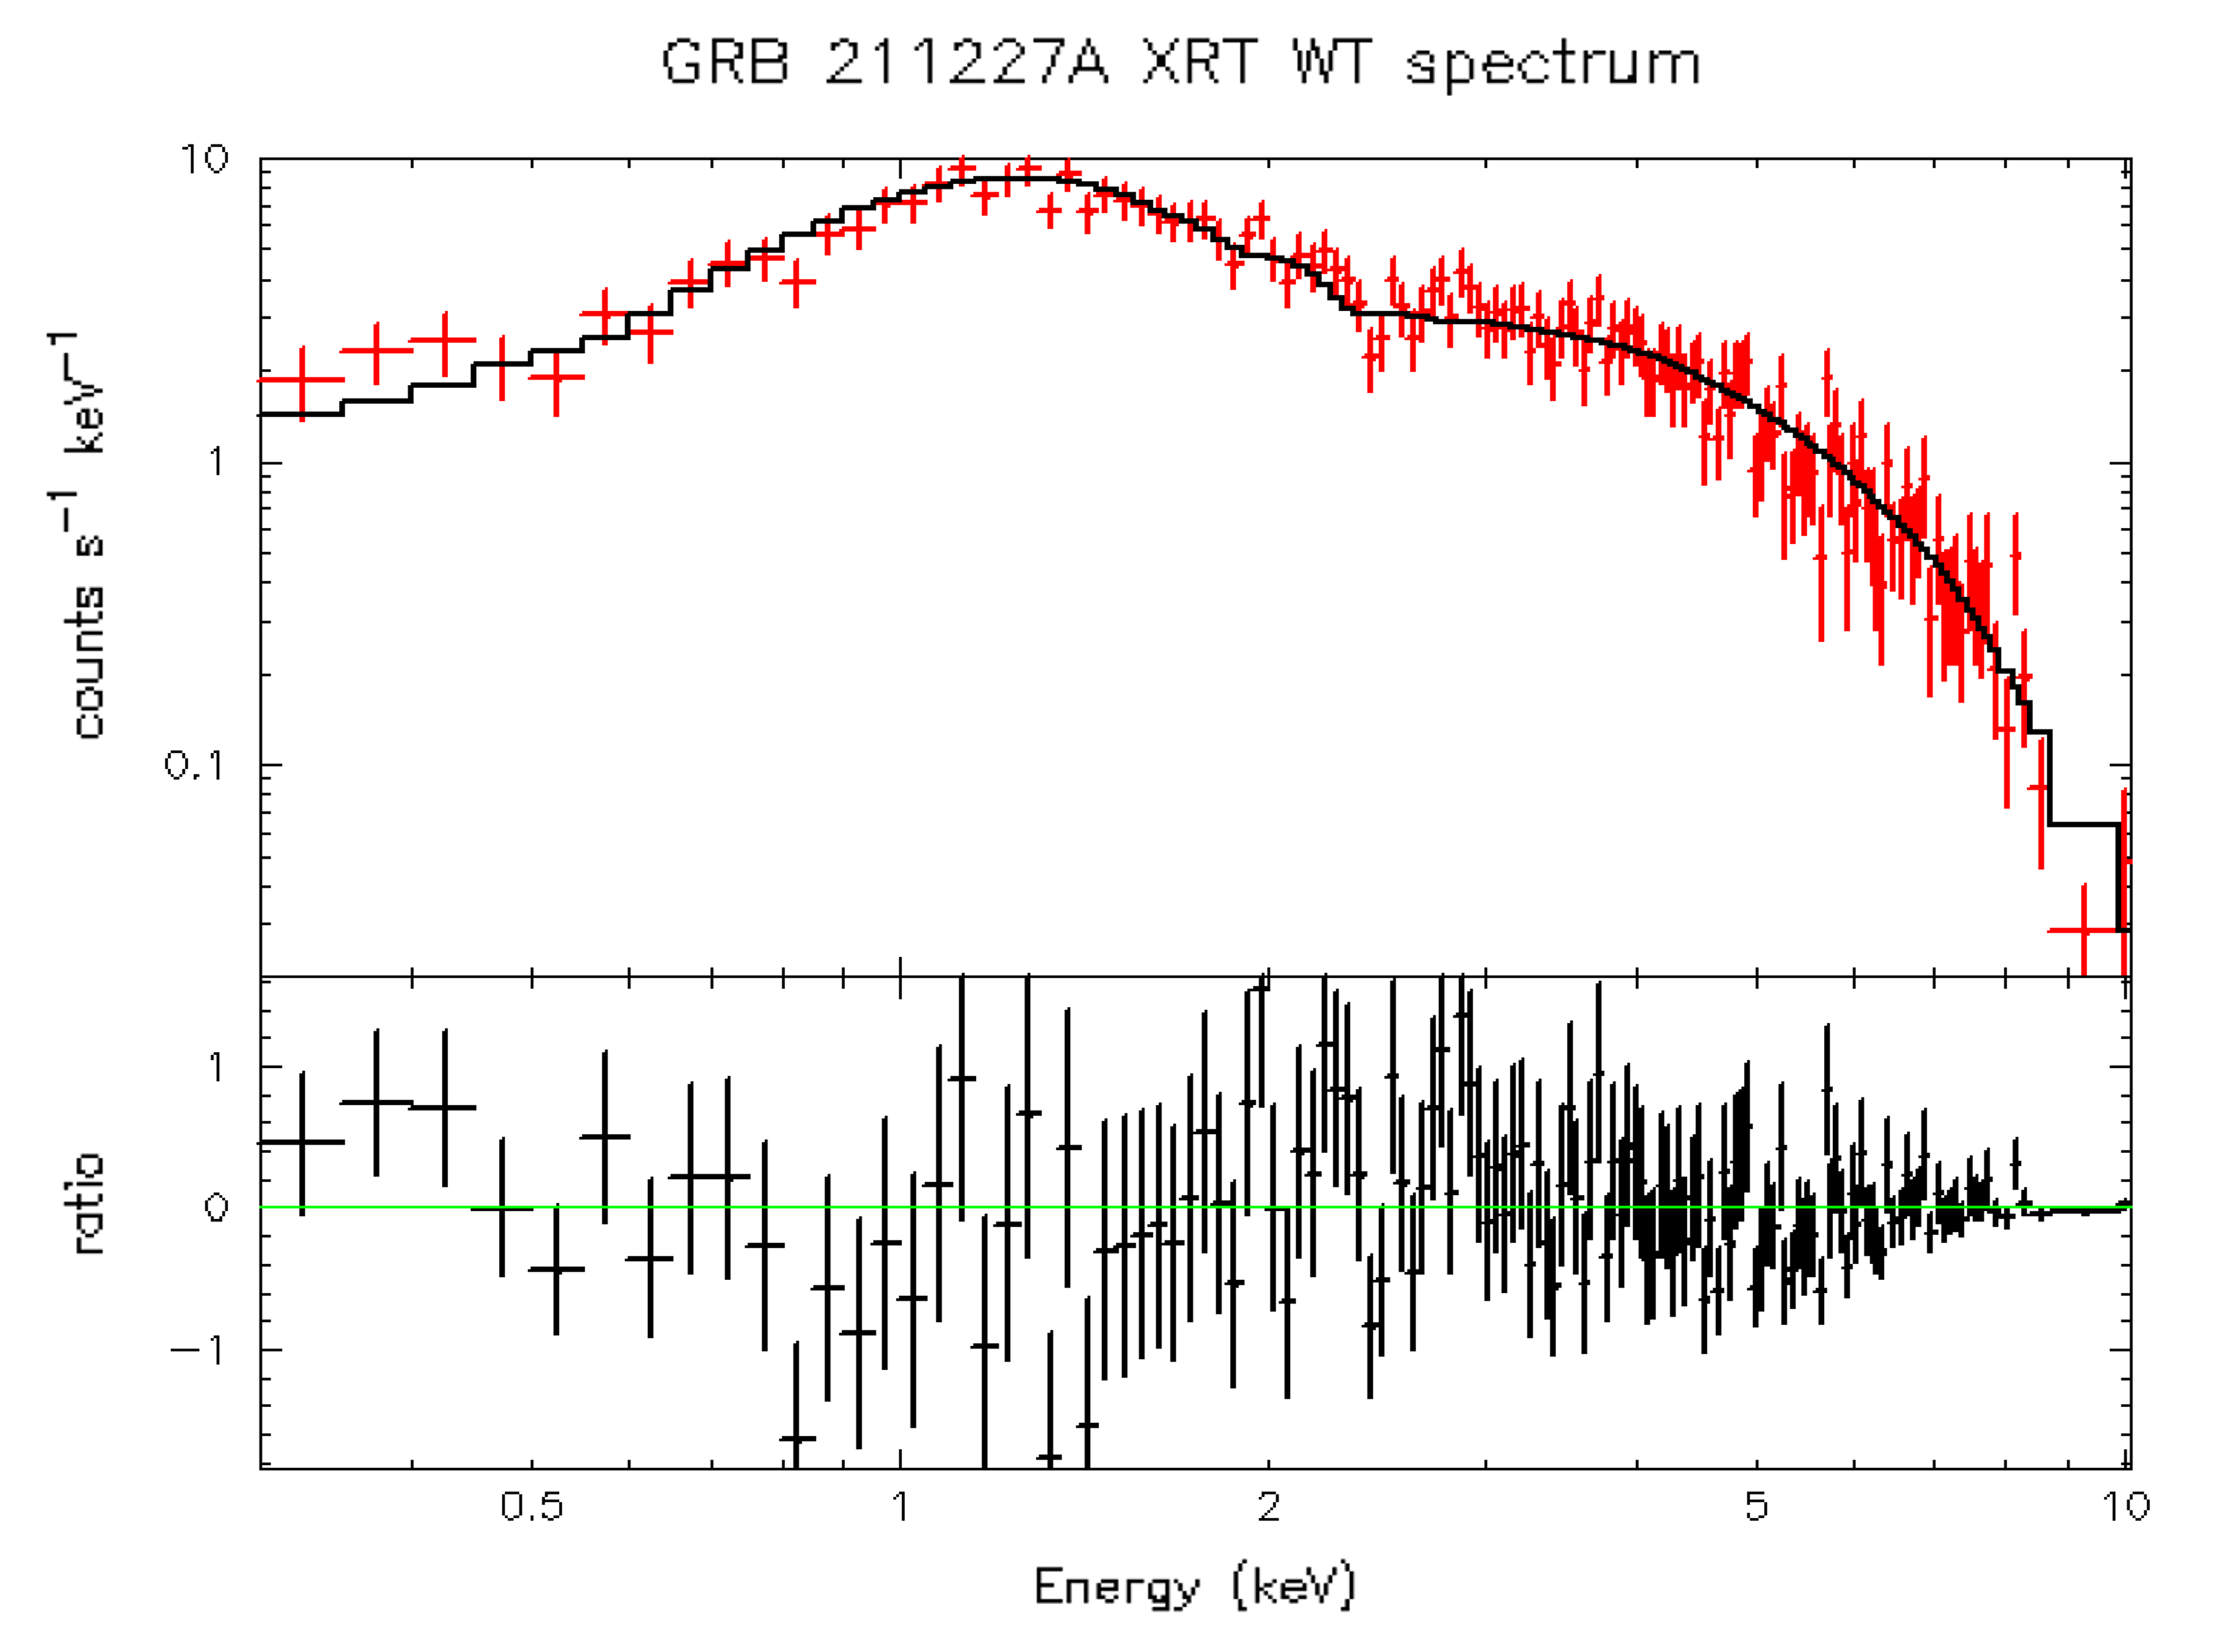
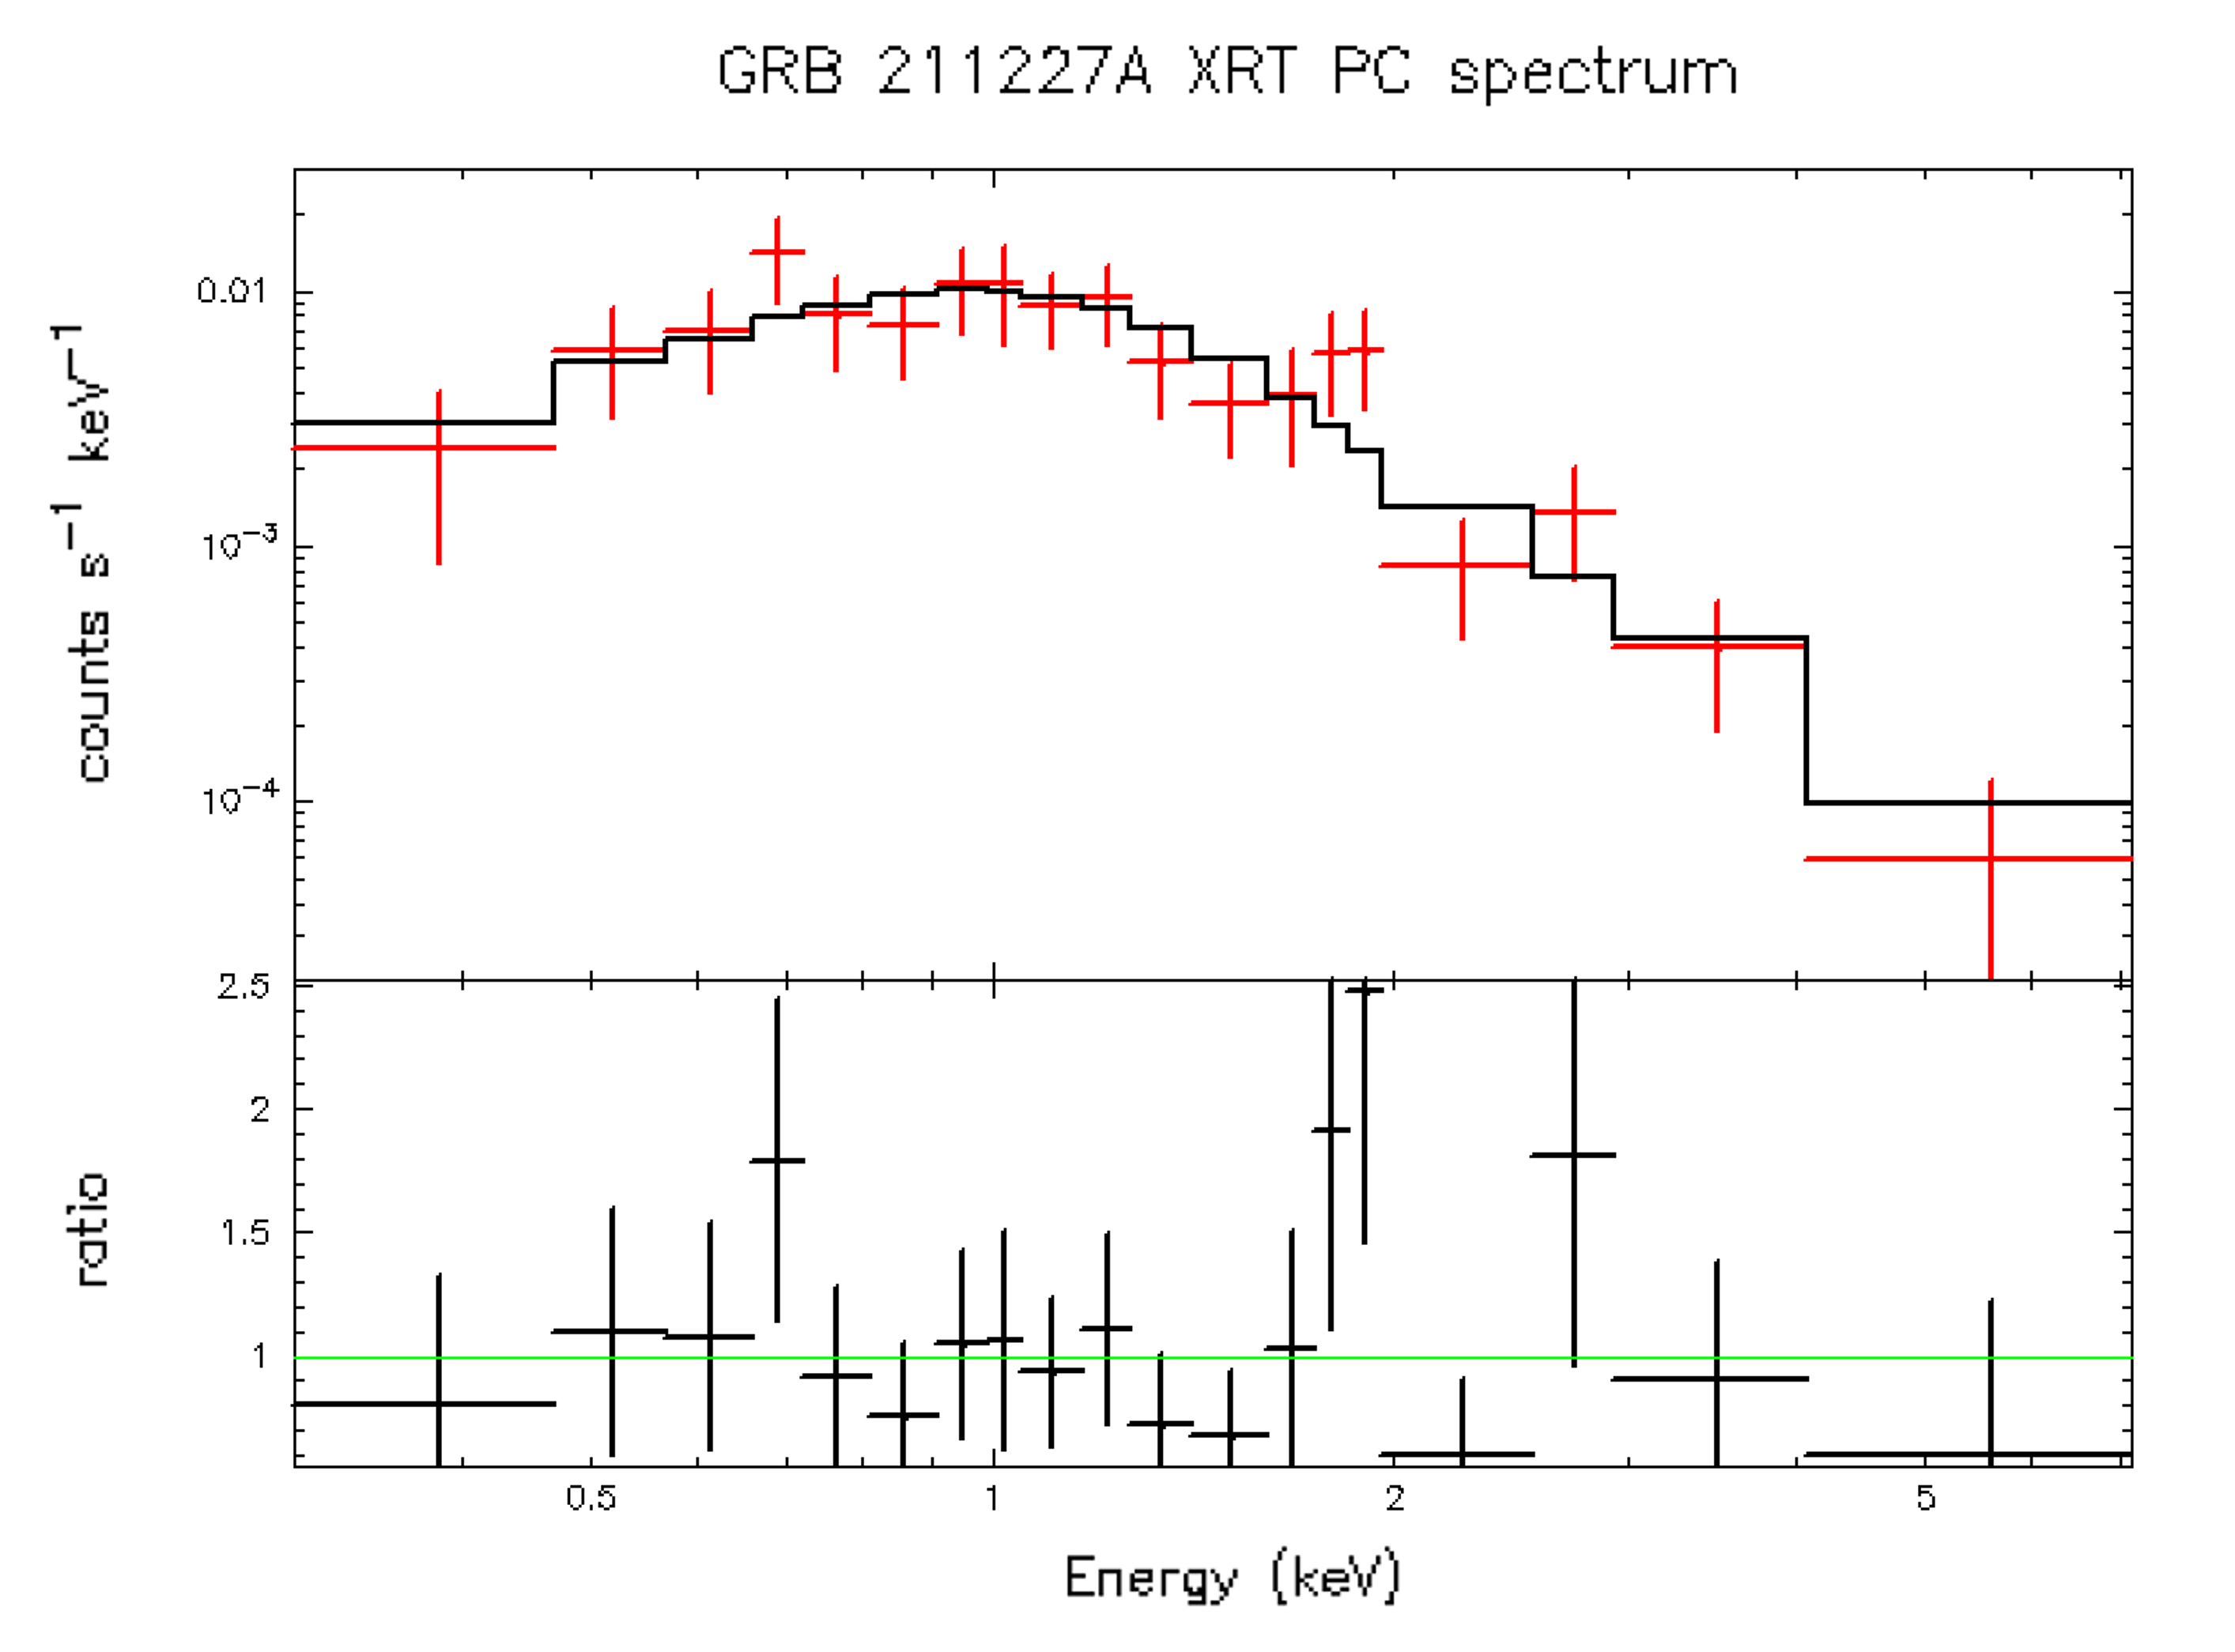
We retrieved spectral data from the Swift/XRT GRB spectrum repository666https://www.swift.ac.uk/xrt_spectra/, and we analysed the spectra from both the WT mode and the PC mode data (from T0+272.6 s). We fitted them with an absorbed power-law model within the XSpec package (Arnaud, 1996), keeping the Galactic contribution and the redshift fixed at 2.4 1020 cm-2 (Willingale et al., 2013) and 0.228, respectively. For the WT mode data, we obtained a photon spectral index and a best-fitting intrinsic column density 1021 cm-2 (errors at 90% c.l.), in excess with respect to the Galactic value. The resulting fit statistics is C-stat/dof = 630.97/697. The fit of the PC mode spectrum returned , and a best-fitting intrinsic column density 1021 cm-2 (errors at 90% c.l.), in excess with respect to the Galactic value. The resulting fit statistics is C-stat/dof = 64.3/90. The two spectra, along with their fit, are shown in Fig. 7.
5.2 Optical
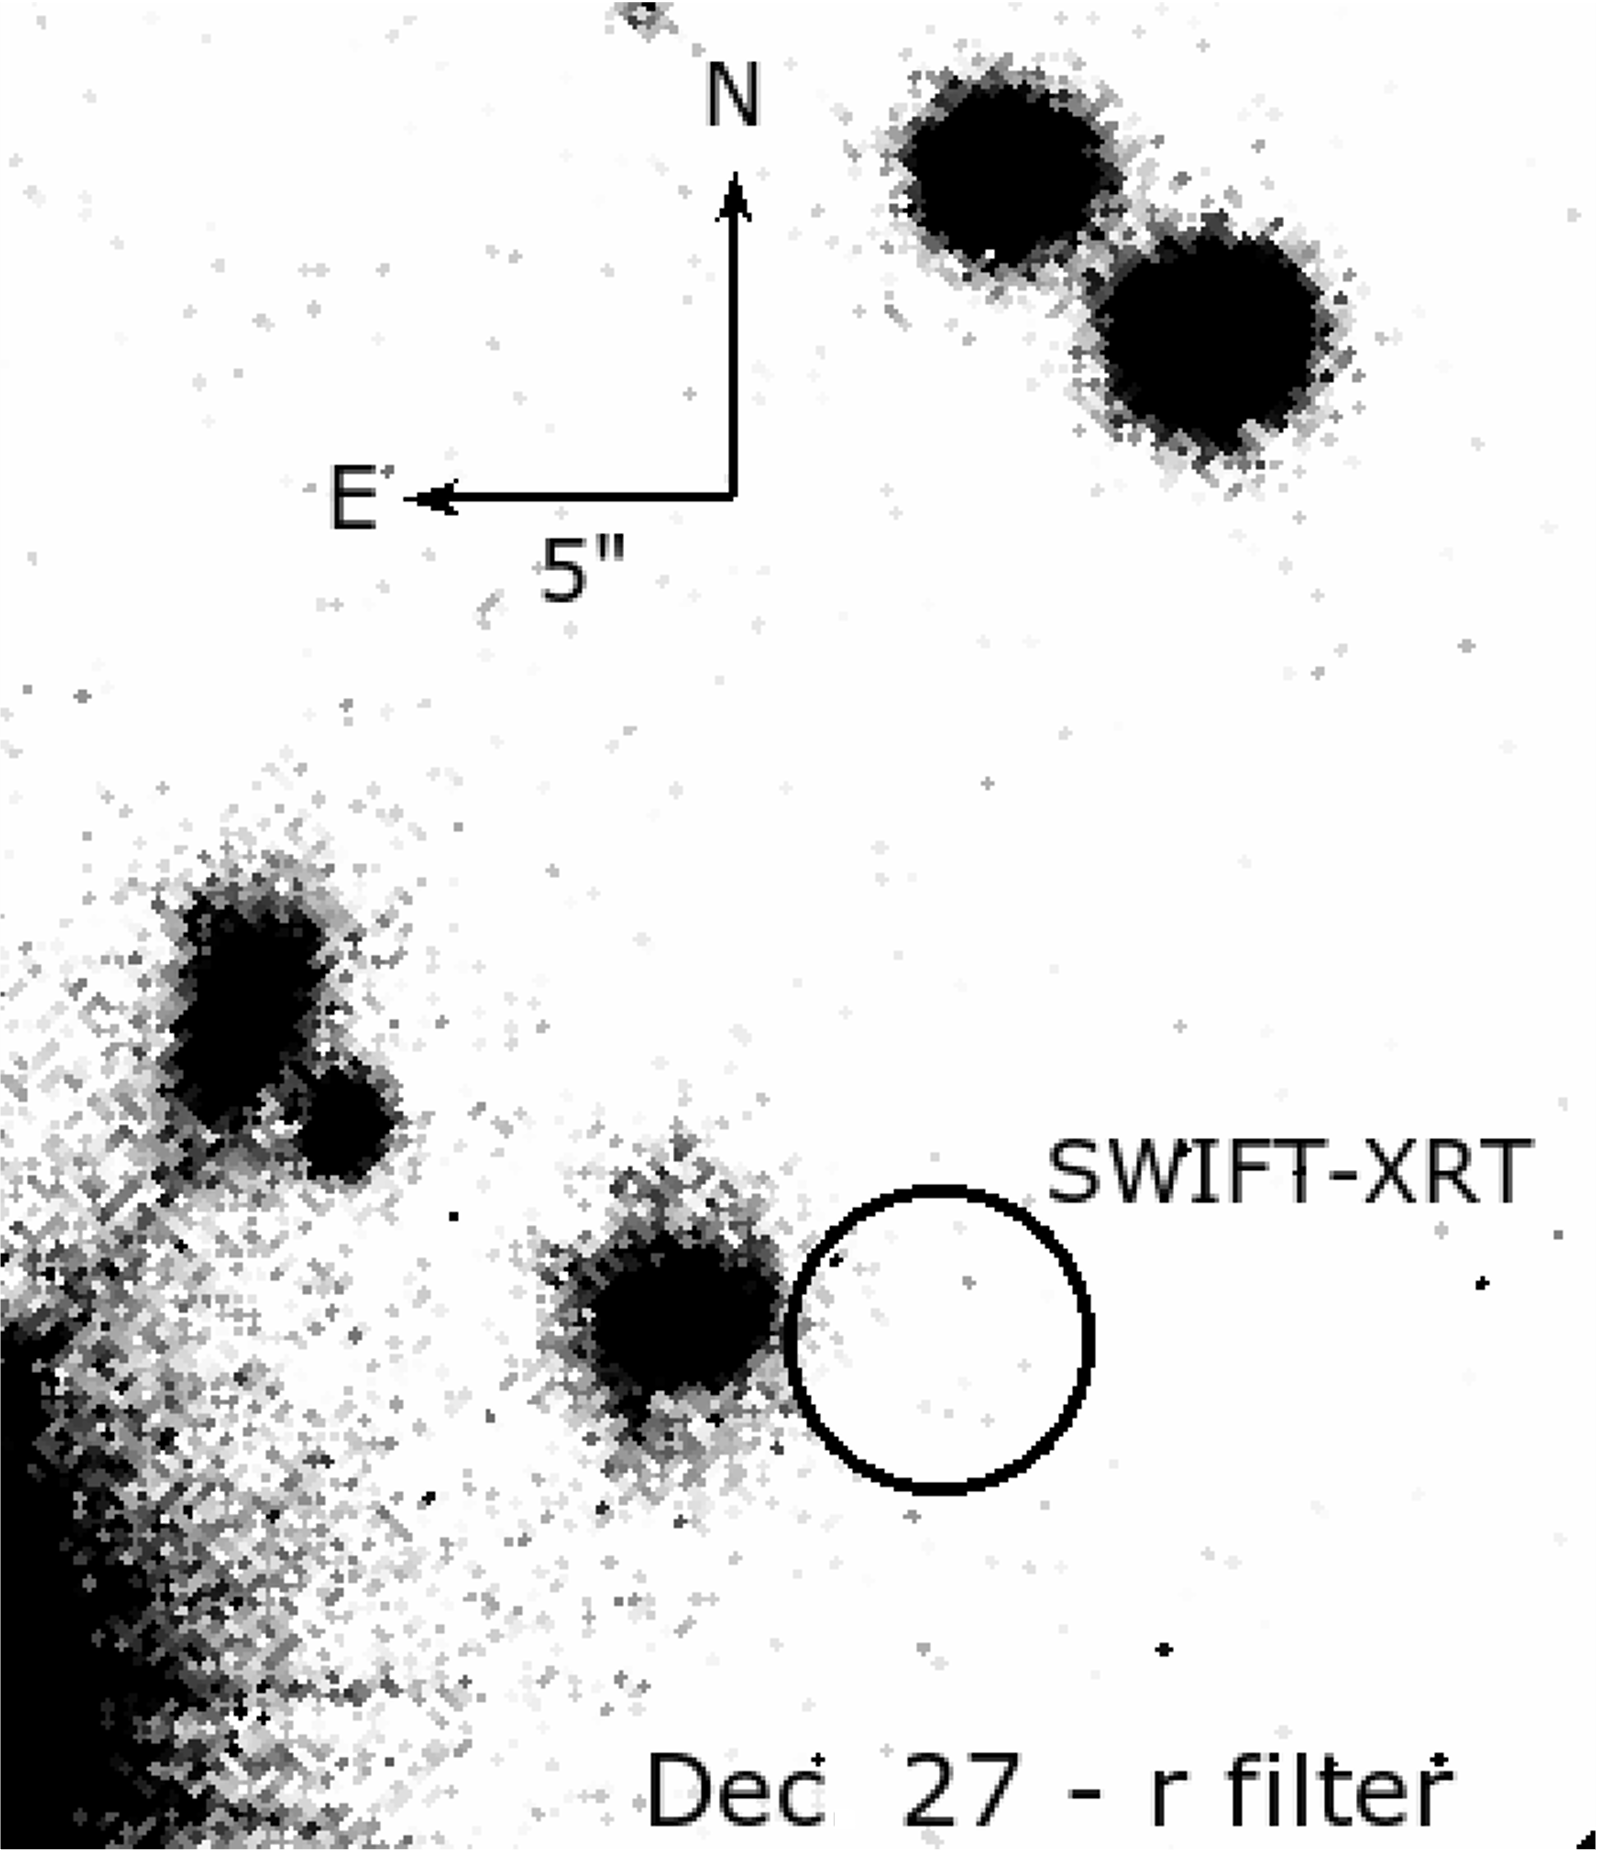
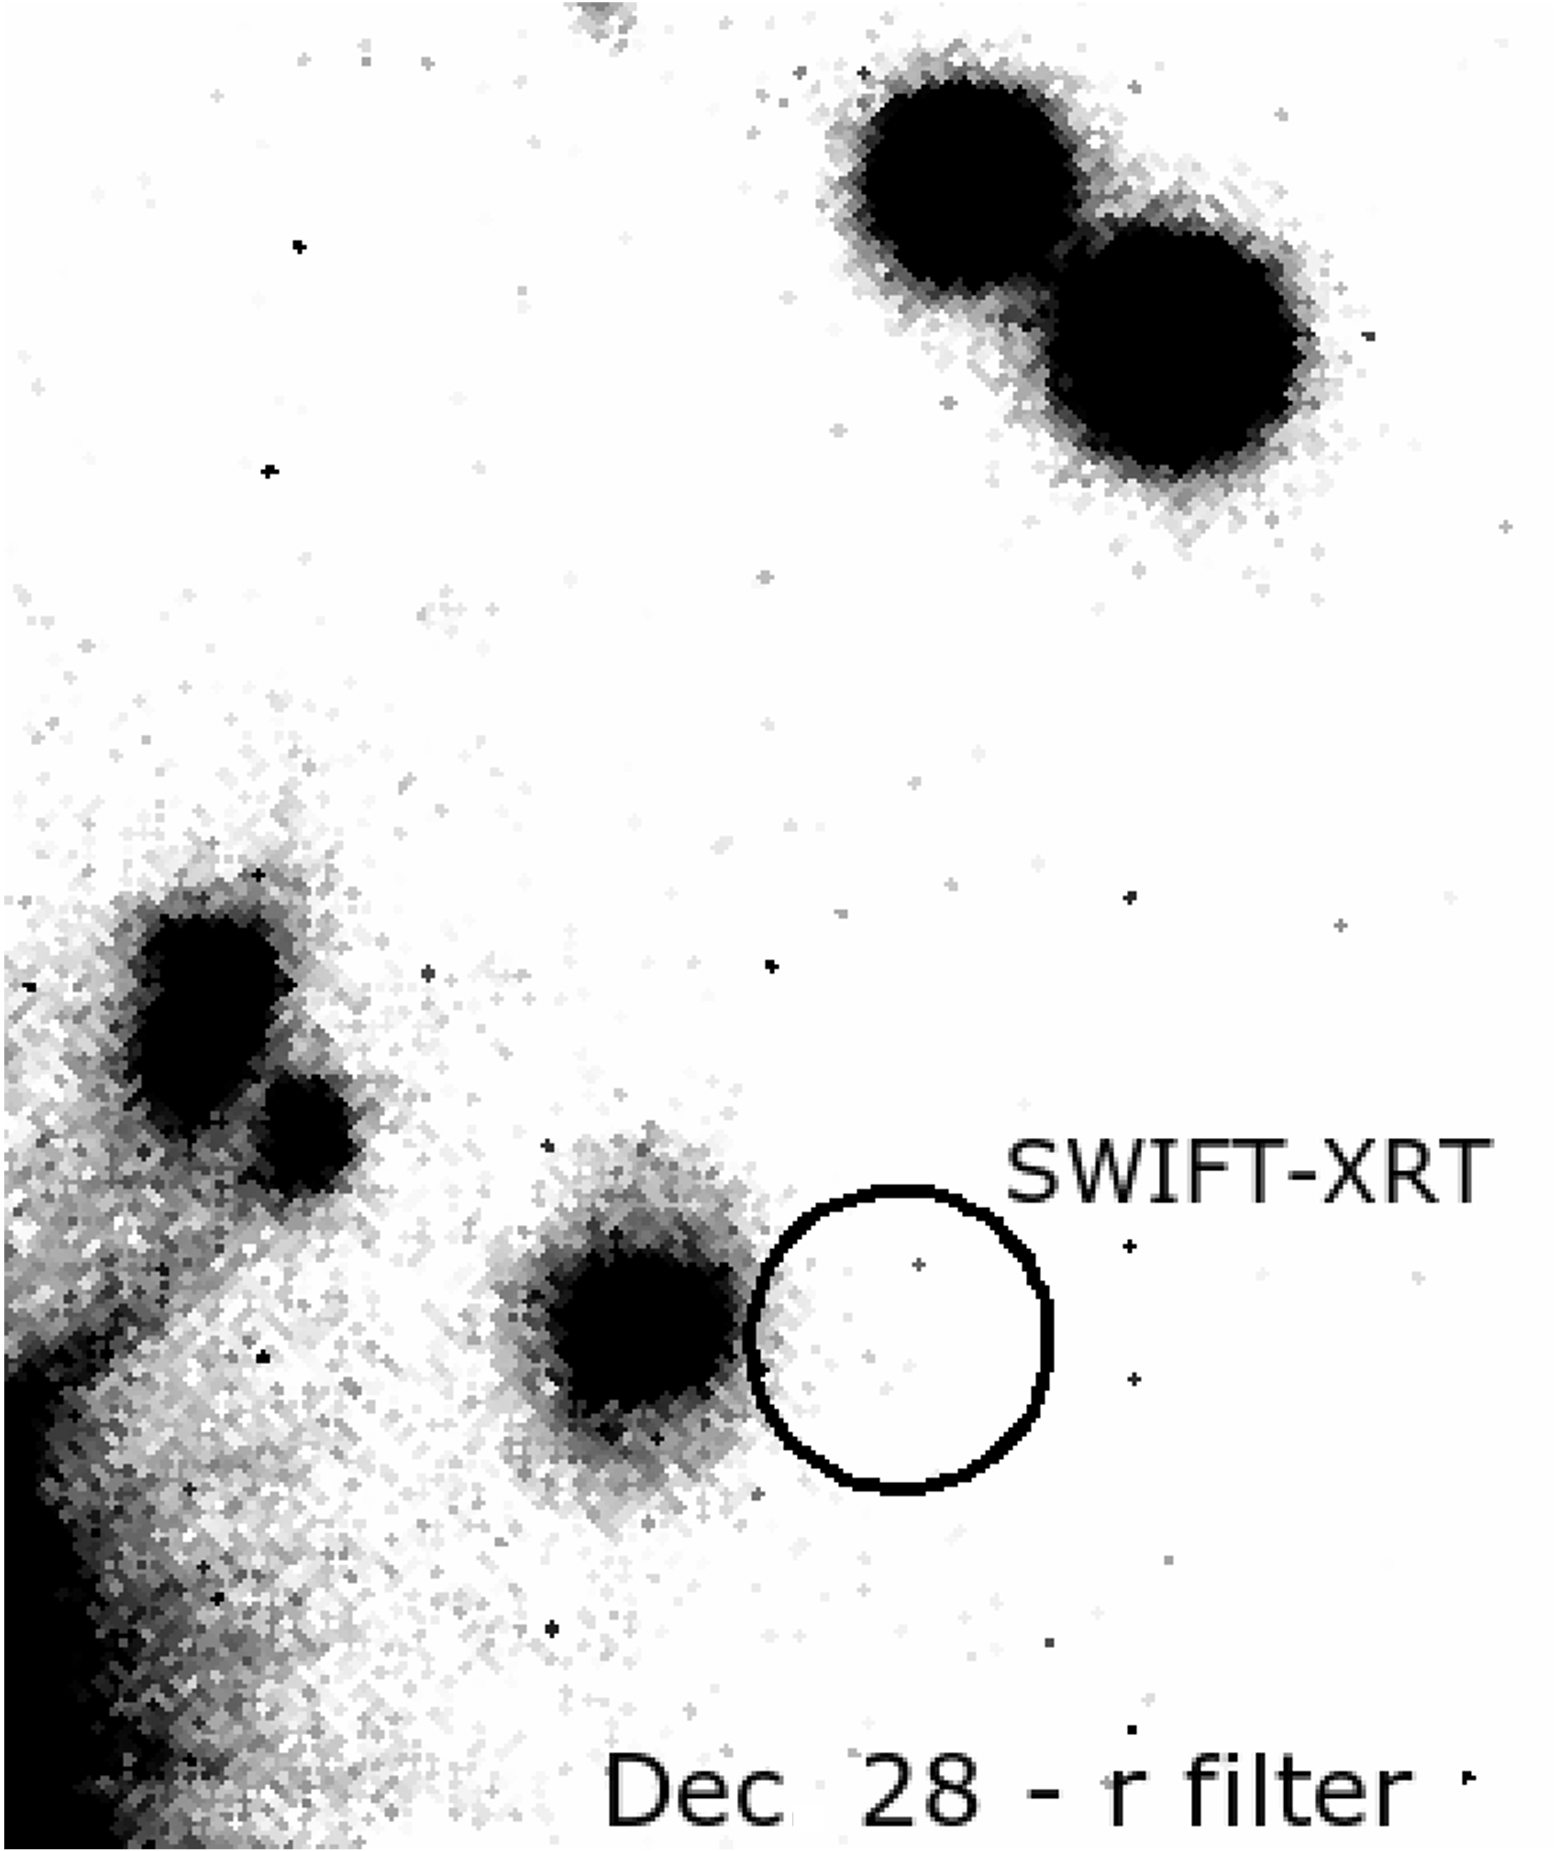
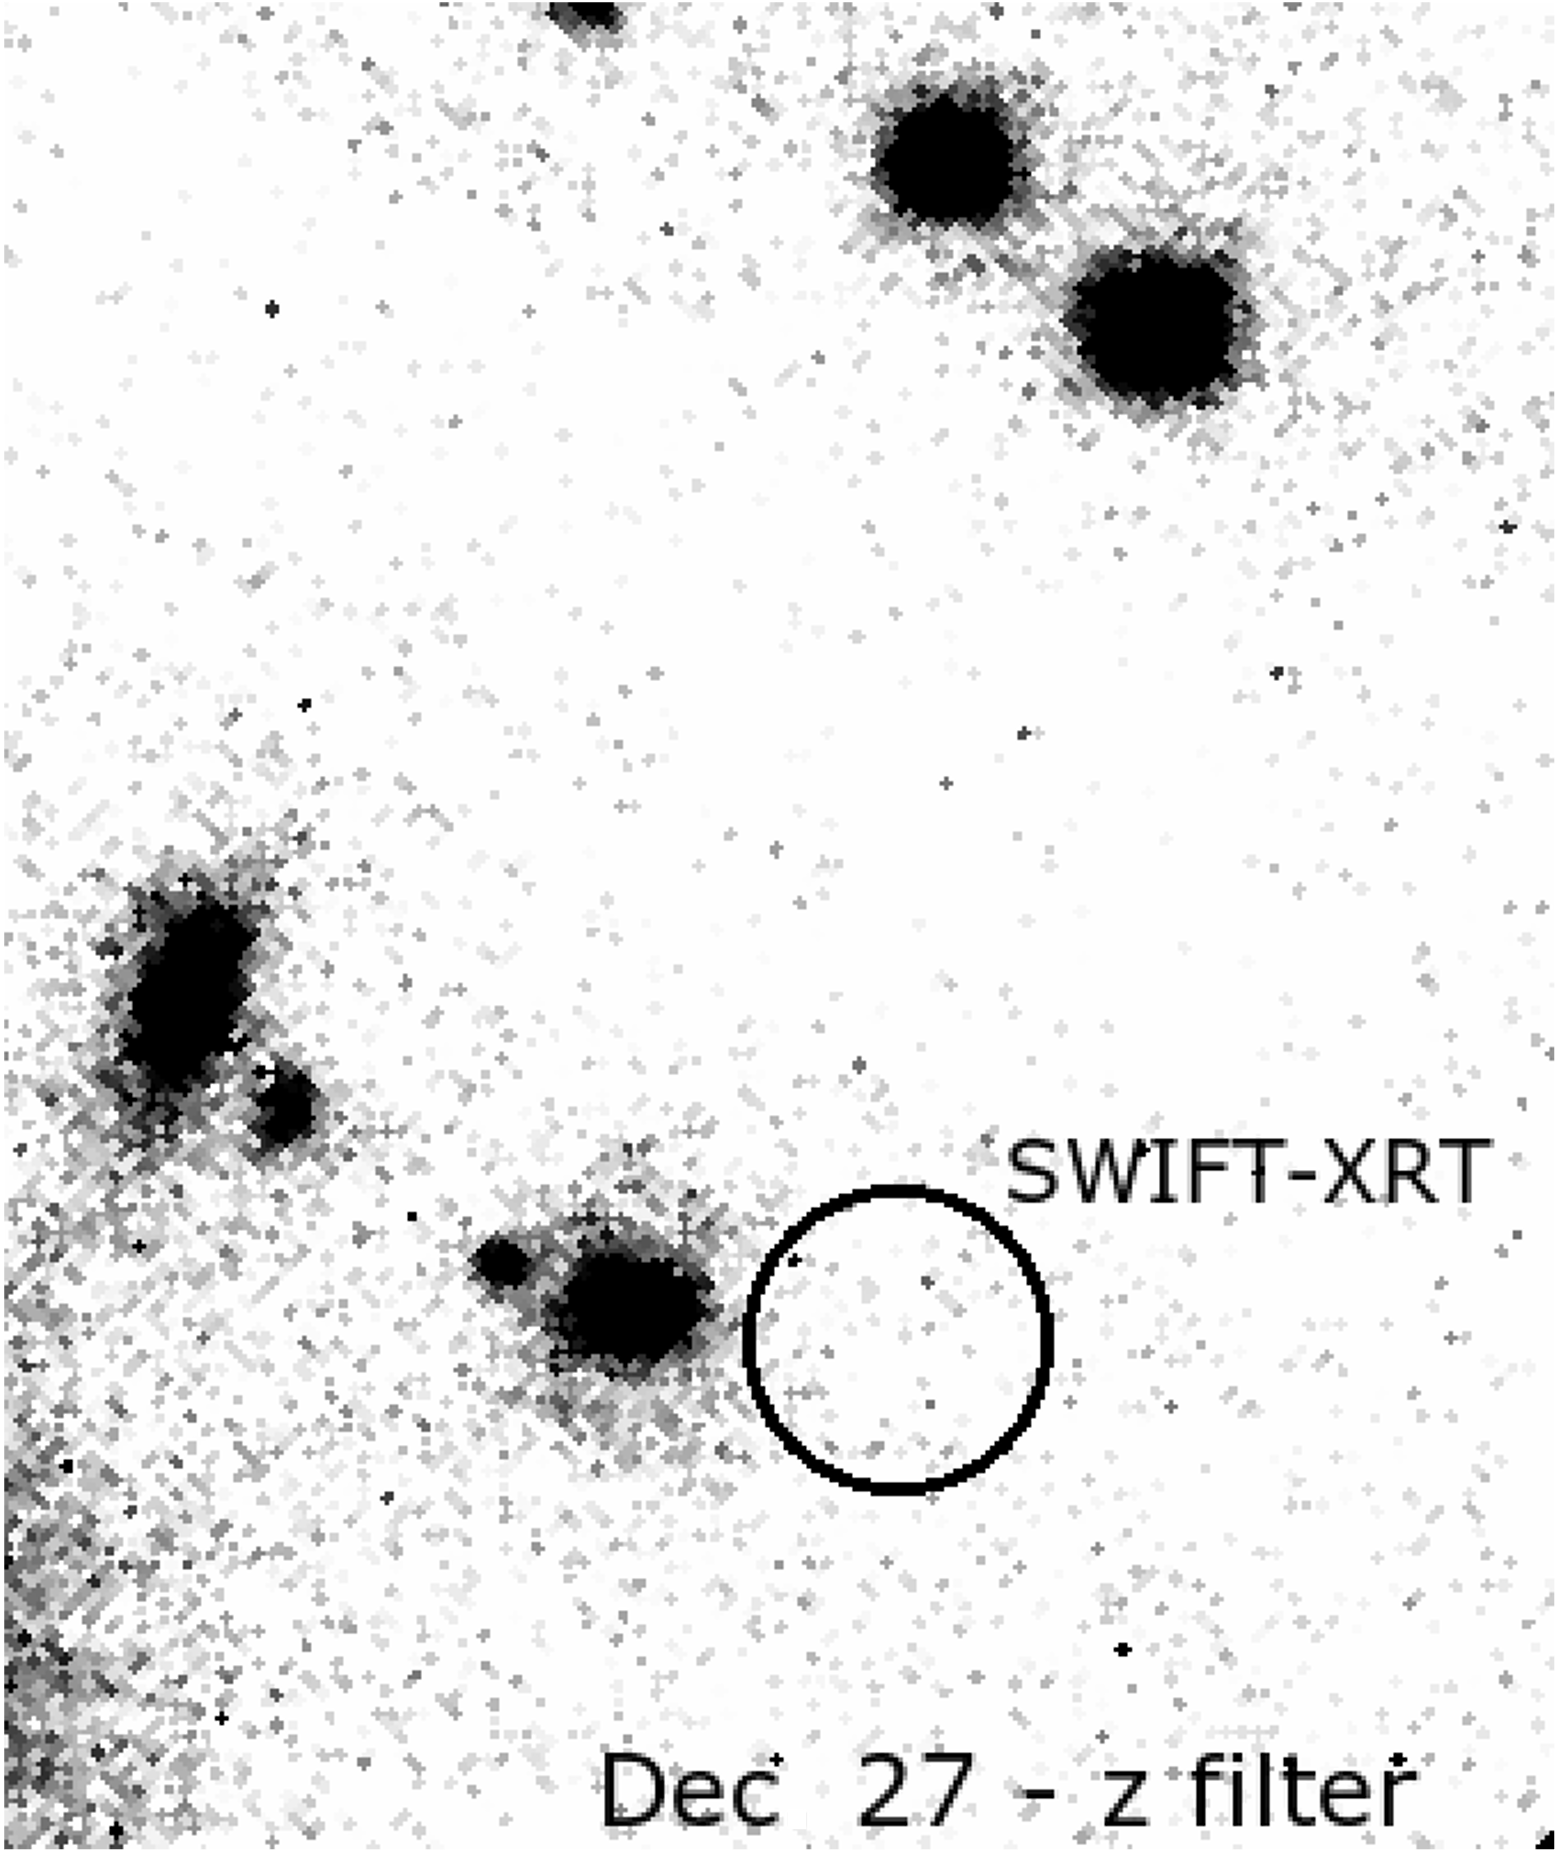
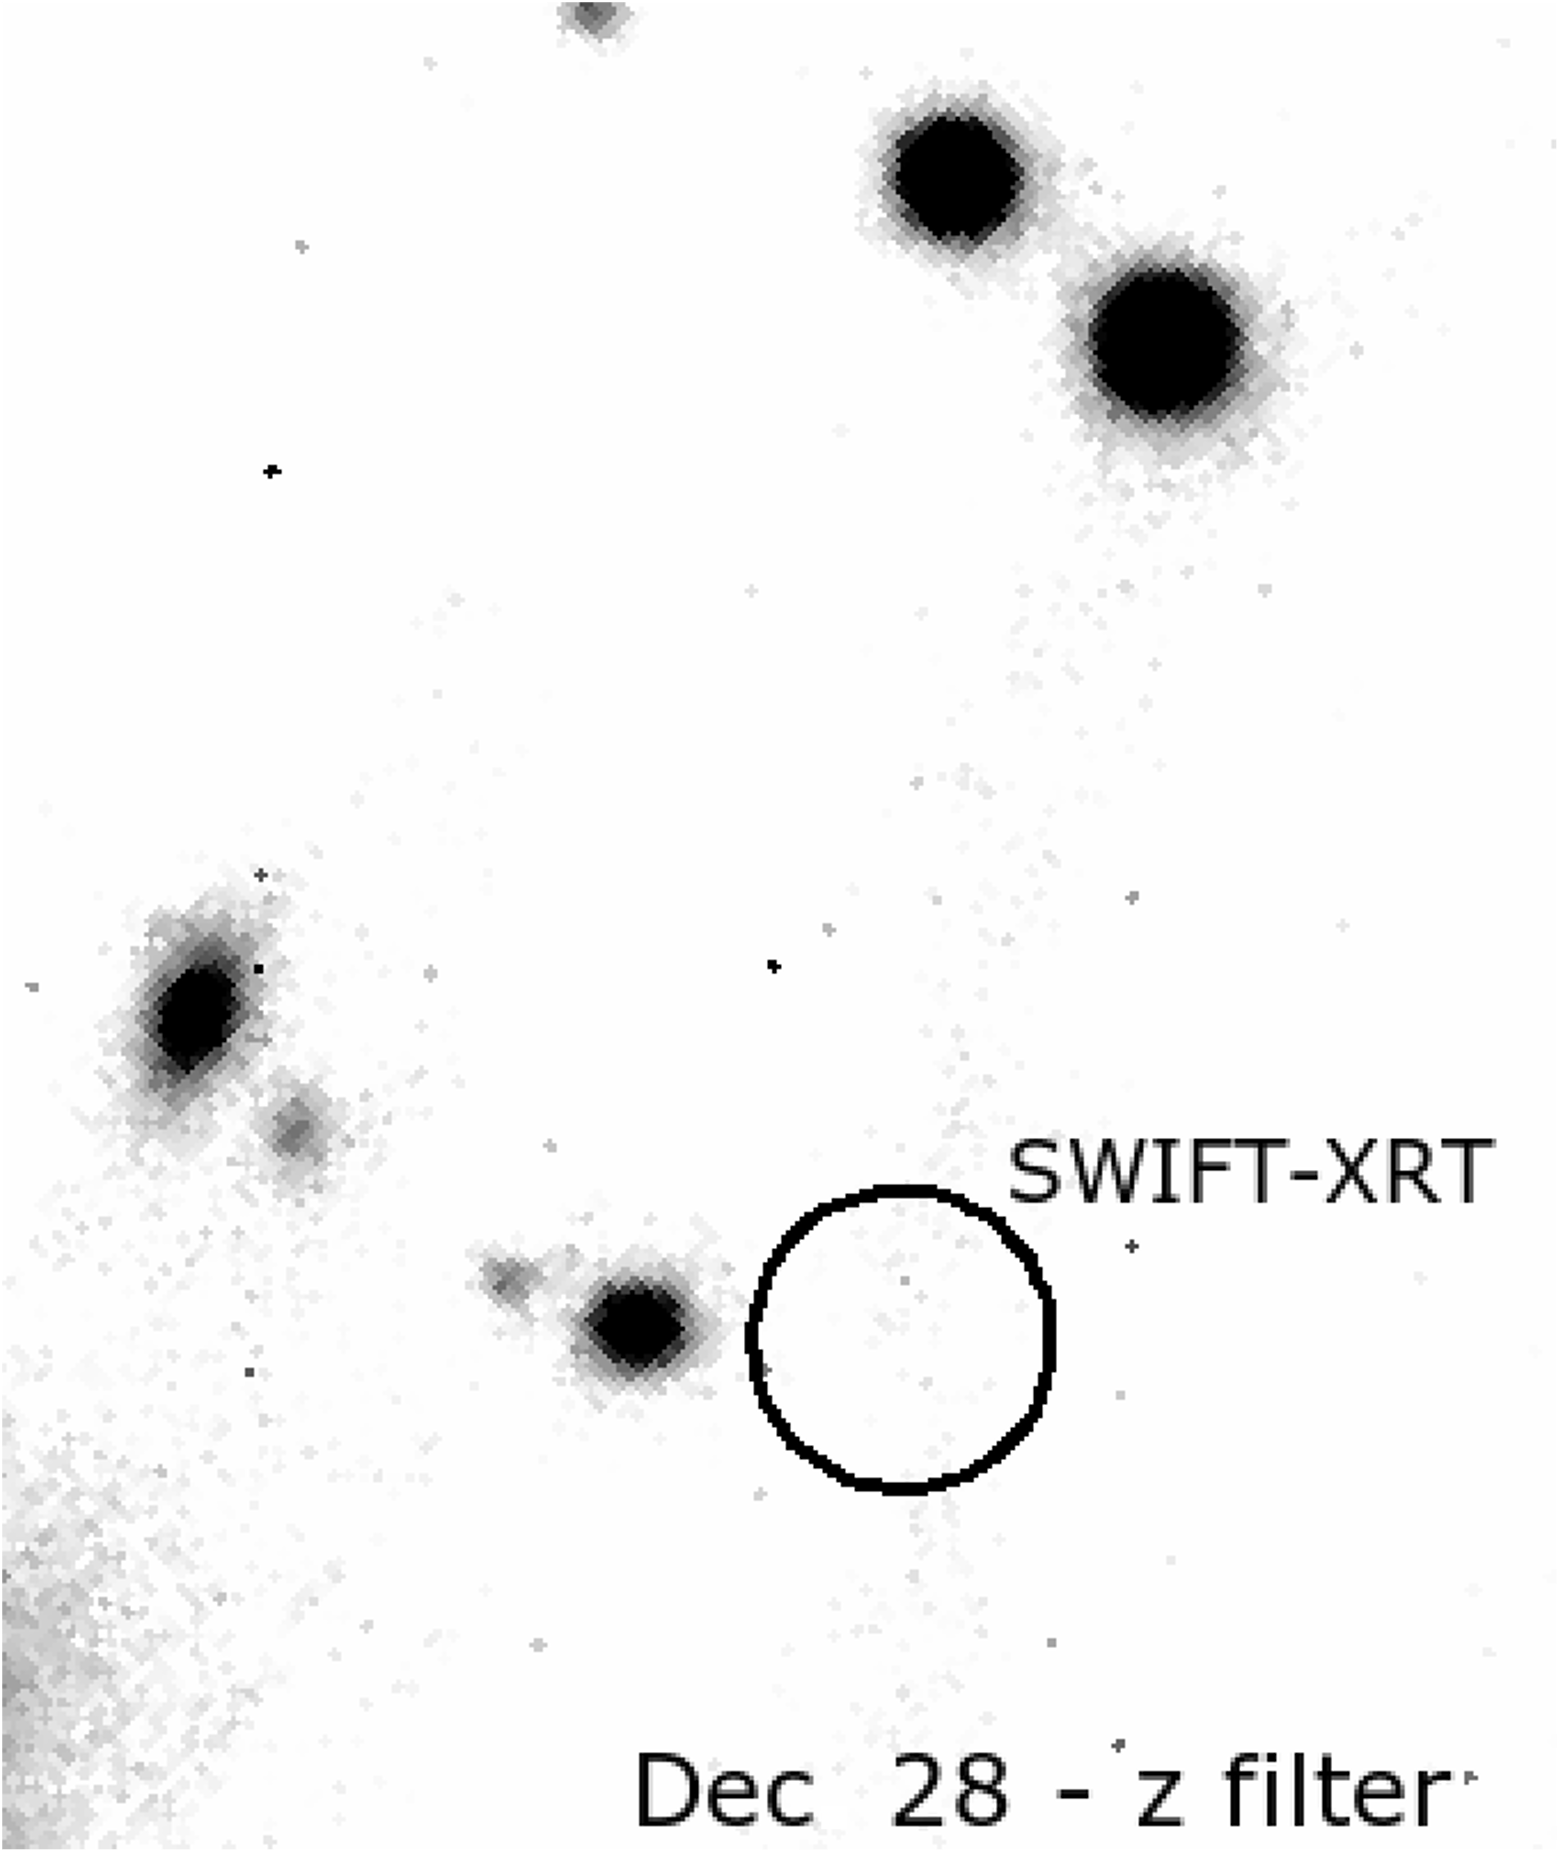
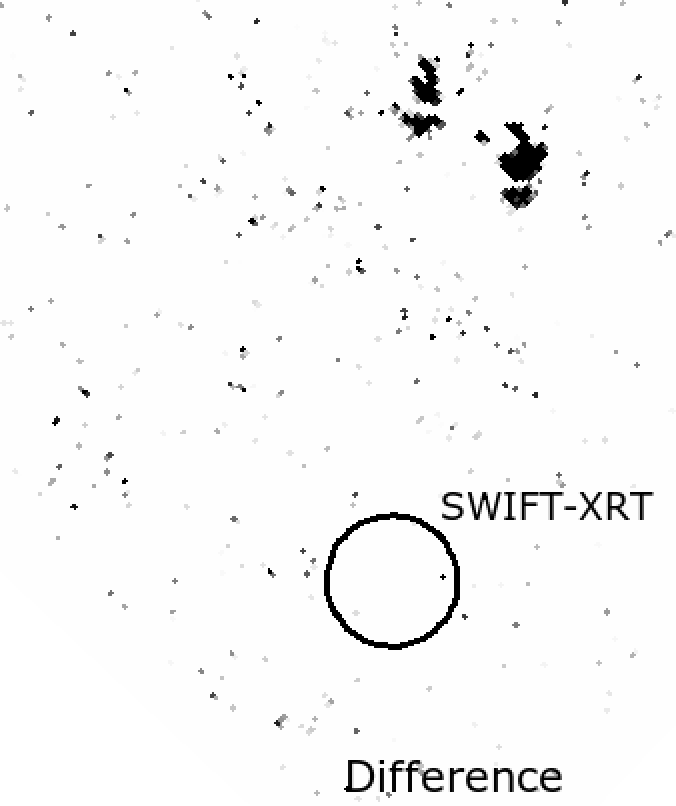
Top panels. -band images of the two epochs (Dec 27 and Dec 28) along with their subtraction. The circle represents the XRT 90% error region.
Bottom panels. Same as above for the -band observations.
We observed the field of GRB 211227A with ESO-VLT X-Shooter and FORS2 instruments, obtaining both imaging and spectroscopic data. The complete log of the observations is reported in Table 3, while finding charts for the observations with the two instruments are shown in Fig. 8 for X-Shooter and FORS2 observations. We had clear night of observations, with the seeing ranging from 0.6′′ to 0.9′′.
5.2.1 VLT/X-Shooter
X-Shooter observations were performed 0.2 (, band) and 1.2 (, , band) days after T0. We reduced raw acquisition images following the standard procedure already described for GRB 211106A, with astrometric solution and photometric calibration both performed against the PanSTARRS DR1 catalogue (Chambers et al., 2016). Aperture and PSF photometry were carried out with the DAOPHOT package. Furthermore, we performed image subtraction with HOTPANTS between the two epochs obtained with the X-Shooter acquisition camera with the and filters. For these two subtractions we computed an average FWHM of 3.85′′ and 4.66′′ for epoch 1 and 2 in the filter, and 3.01′′ and 3.90′′ for epoch 1 and 2 in the filter. From the analysis of the X-Shooter and FORS2 images we found no evidence for a GRB optical counterpart (Fig. 9). We report the 3 magnitude limits estimated through PSF photometry for both X-Shooter and FORS2 observations in Table 7.
| [d] | Mag. limit | Instrument / Filter |
|---|---|---|
| 0.211 | 25.4 | X-Shooter / |
| 0.213 | 24.8 | X-Shooter / |
| 0.216 | 25.4 | X-Shooter / |
| 1.193 | 25.8 | FORS2 / |
| 1.235 | 25.8 | X-Shooter / |
| 1.239 | 24.7 | X-Shooter / |
On Dec 26 we also carried out spectroscopic observations of the host galaxy of GRB 211227A. We obtained 4 exposures of 600 s each, covering a wavelength range of 3000-24800 (3000-5600, 5500-10200, and 10200-24800 for the UVB, VIS, and NIR arm, respectively). The slit width is 1′′ for the UVB arm and 0.9′′ for the others, giving a limit on the delivered resolving power of the spectra based on the tabulated values of the resolutions, which are 5400, 8900, and 5600 for the UVB, VIS, and NIR-arm, respectively888https://www.eso.org/sci/facilities/paranal/instruments/xshooter/inst.html. Data reduction was carried out with the ESO-Reflex pipeline (version 2.11.5, Freudling et al., 2013) for X-Shooter (Modigliani et al., 2010), then we analysed the reduced spectrum to investigate the host galaxy properties (see Fig. 10 and §.6.2). In Table 9 we show the identified features of the spectrum along with the redshift computed from the line centroids of their best Gaussian fit. We also computed their corresponding rest frame luminosity given a luminosity distance for the galaxy of 1170.6 Mpc at the average redshift of .


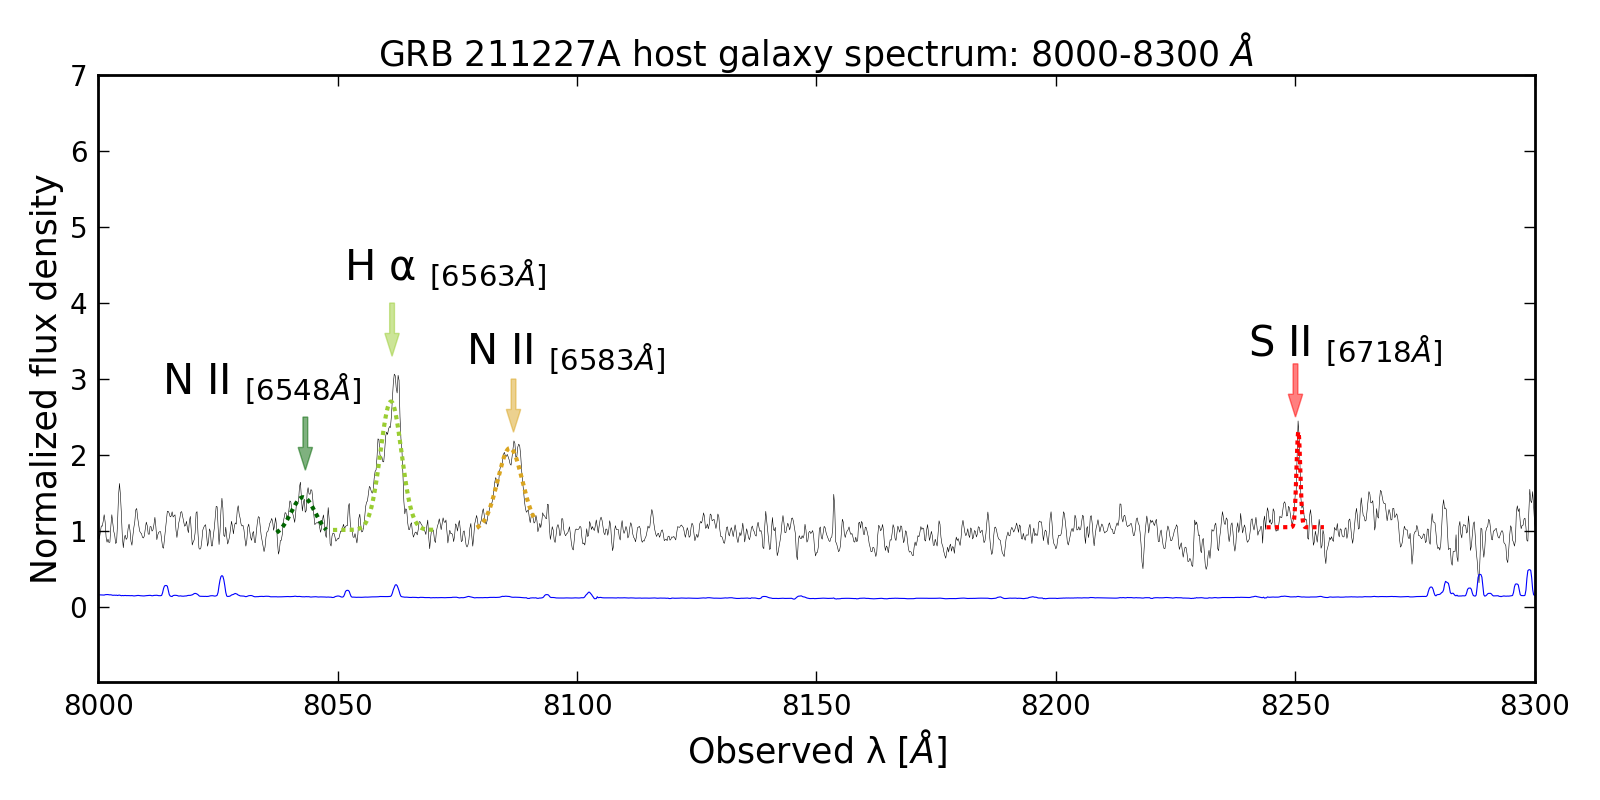
| Feature | Luminosity [erg/s] | ||
|---|---|---|---|
| 4577.95 | [O II]3727 | 0.2283 | 13.5851.190 |
| 5971.58 | Hβ | 0.2281 | 2.7680.592 |
| 6147.48 | [O III]5007 | 0.2278 | 1.1530.289 |
| 8042.68 | [N II]6548 | 0.2283 | 2.9700.384 |
| 8061.01 | Hα | 0.2280 | 8.4150.405 |
| 8085.86 | [N II]6583 | 0.2279 | 6.2160.287 |
| 8250.57 | [S II]6718 | 0.2281 | 0.9840.136 |
5.2.2 VLT/FORS2
We analysed the field of the burst for the single band FORS2 epoch, taken 1.2 days after the trigger. After standard data reduction, photometric calibration was achieved with Stetson field stars and astrometry was performed against the PanSTARRS DR1 catalogue. We carried out aperture and PSF photometry with the DAOPHOT package, but we did not find any candidate afterglow within the XRT error circle. We computed a 3 magnitude limit for the observation of 25.8 mag.
6 Discussion
6.1 Host galaxy identification for GRB 211106A
The association of GRB 211106A with a host galaxy is particularly complex: the field where the burst appeared shows two sources close to or inside the XRT error circle, neither of which can be safely associated with the X-ray afterglow. We first analysed the one located at the coordinates (J2000) R.A. = 22:54:20.29, Dec. = 53:13:53.6 and at a redshift = 0.097, whose corresponding luminosity distance is Mpc. We computed the probability of chance association () of this source with the best position of the afterglow - the mm-band one (see §2.2) - following Bloom et al. (2002). The projected separation of the two sources is 3.76′′, and the source has a magnitude 21.5 mag (Christensen et al., 2021). In order to obtain the effective radius of the galaxy for a better computation of , we performed surface photometry with the ellpro package under the Starlink software (Currie et al., 2014), then we fitted the obtained profile with a Sérsic model:
| (1) |
where n is the concentration parameter (n = 1 is equivalent to an exponential disk profile, while n = 4 is the de Vaucouleurs profile typical of elliptical galaxies), 2n 1/3 + 4/405n + 46/25515 (Ciotti & Bertin, 1999) is a constant that depends on n, is the effective radius, and is the effective surface brightness in flux units. The three parameters were left free to vary. The fit returned a value for the effective radius of 1.62′′, corresponding to 3 kpc at = 0.097 and leading to a normalized projected offset of the host galaxy from the afterglow position of 2.32. In the end, we obtained a probability of chance association 5.4%: no firm conclusion can be drawn about GRB 211106A host galaxy from this result.
Hence, we investigated the source detected in our FORS2 images. Given the compatibility of their positions and the lack of significant fading among the three FORS2/ band observations and the HST ones (§2.2), we can safely assume that they are the same source. By adopting = 26.51 mag (epoch 3 result, see §4.2.1) and an angular offset of 0.113′′ from the best afterglow position, we obtained 0.1. Unfortunately, the source was not resolved enough in our images in order to perform surface photometry, therefore we could not compute the projected offset in kpc and its normalized value.
In light of the values obtained for the chance association probability, the best host galaxy candidate is the source detected by HST and FORS2, as also proposed by Laskar et al. (2022).
| Filter | [] | FWHM [] | mag | |
|---|---|---|---|---|
| MUSE/ | 5439.27 | 852.44 | 27.42 | 0.08 |
| MUSE/ | 6436.47 | 1567.06 | 26.45 | 0.10 |
| FORS2/ | 6521.67 | 1645.55 | 26.51 | 0.23 |
| MUSE/ | 8054.53 | 1543.11 | 25.67 | 0.26 |
| / | 8102.91 | 2098.15 | 25.79 | 0.07 |
| / | 11696.34 | 4637.84 | 25.71 | 0.02 |
To further investigate the proposed host galaxy, we built a spectral energy distribution (SED) aimed at getting a photometric redshift estimation. For this purpose, we considered HST magnitudes obtained with the , filters, the VLT/FORS2 -band magnitude, and the VLT/MUSE corresponding magnitudes in the , , filters (see Table 10).
To perform the SED fit we followed a similar approach to the one described in the recent work by Nugent et al. (2022). We used the Python package for inference of stellar population Prospector (Johnson et al., 2021). Within this package, we used emcee affine-invariant ensemble sampler for Monte Carlo Markov-Chain (Foreman-Mackey et al., 2013) in order to sample the posterior distributions for the parameters in our analysis, while the spectral templates were built through the Flexible Stellar Population Synthesis (FSPS) package (Conroy et al. 2009; Conroy & Gunn 2010) by making use of MIST (Choi et al., 2016) and MILES (Sánchez-Blázquez et al., 2006) stellar population synthesis libraries.
We performed the fit with a Chabrier initial mass function (IMF, Chabrier 2003), a fixed dust emission contribution from Draine & Li (2007), and a parametric delay- star formation history (SFH). We included the intrinsic host attenuation as a SMC-like extinction in terms of optical depth in the band , from which we derived from the following relation: .
The free parameters considered in the model were redshift, age, stellar mass, the fraction of surviving mass at the age of the host, the metallicity of the galaxy, and the SFH e-folding factor. The best fit, along with the host galaxy observed magnitudes, are shown in Fig. 11, and a list of the results for the parameter space is reported in Table 11.
| Parameter | posterior median value |
|---|---|
| redshift | 0.64 |
| stellar mass [108 ] | 1.95 |
| extinction [mag] | 0.19 |
| metallicity ) | 0.16 |
| age [Gyrs] | 0.56 |
| folding factor [Gyrs] | 0.04 |
| survived mass fraction | 0.73 |
We compared the results of our SED analysis with common features of a wide range of SGRB hosts discussed by Nugent et al. (2022). We found that GRB 211106A host galaxy does not show unusual features with respect to the median values of typical SGRB hosts and their 68% credible intervals regarding age, metallicity, and extinction. However, we noted that the inferred mass is about one order of magnitude lower than the considered median value, though consistent at level. Most likely, this can be justified by the bias to detect more easily brighter, usually more massive, galaxies, while the magnitudes from FORS2 and HST observations are very close to the instrumental limits. Furthermore, we observed that the we obtained is significantly lower than the ones reported in Laskar et al. (2022) from its best-fit synchrotron model to the afterglow observations (namely in the 4.655.62 mag range). This discrepancy could be due to the burst occurring in a particularly dense host environment and thus not representative for the host galaxy global properties.
The SED fit enabled us to infer a redshift (consistent with the redshift range estimated by Laskar et al. 2022), which will be used for discussion in the following analysis.
6.2 GRB 211227A host galaxy analysis
| Diagnostic | Value | 12 + log(O/H) |
|---|---|---|
| [N II6583]/[Hα] | 0.740.03 | ¿9.25 |
| [O III5007]/[N II6583] | 0.190.05 | [9.15-9.25] |
| [N II6583]/[O II3727] | 0.460.02 | [8.95-9.05] |
| [N II6583]/[S II6718] | 6.320.29 | ¿9.25 |
| [O III5007]/[OII3727] | 0.090.02 | ¿9.25 |
| [O III5007]/[Hβ] | 0.420.11 | [8.95-9.05] |
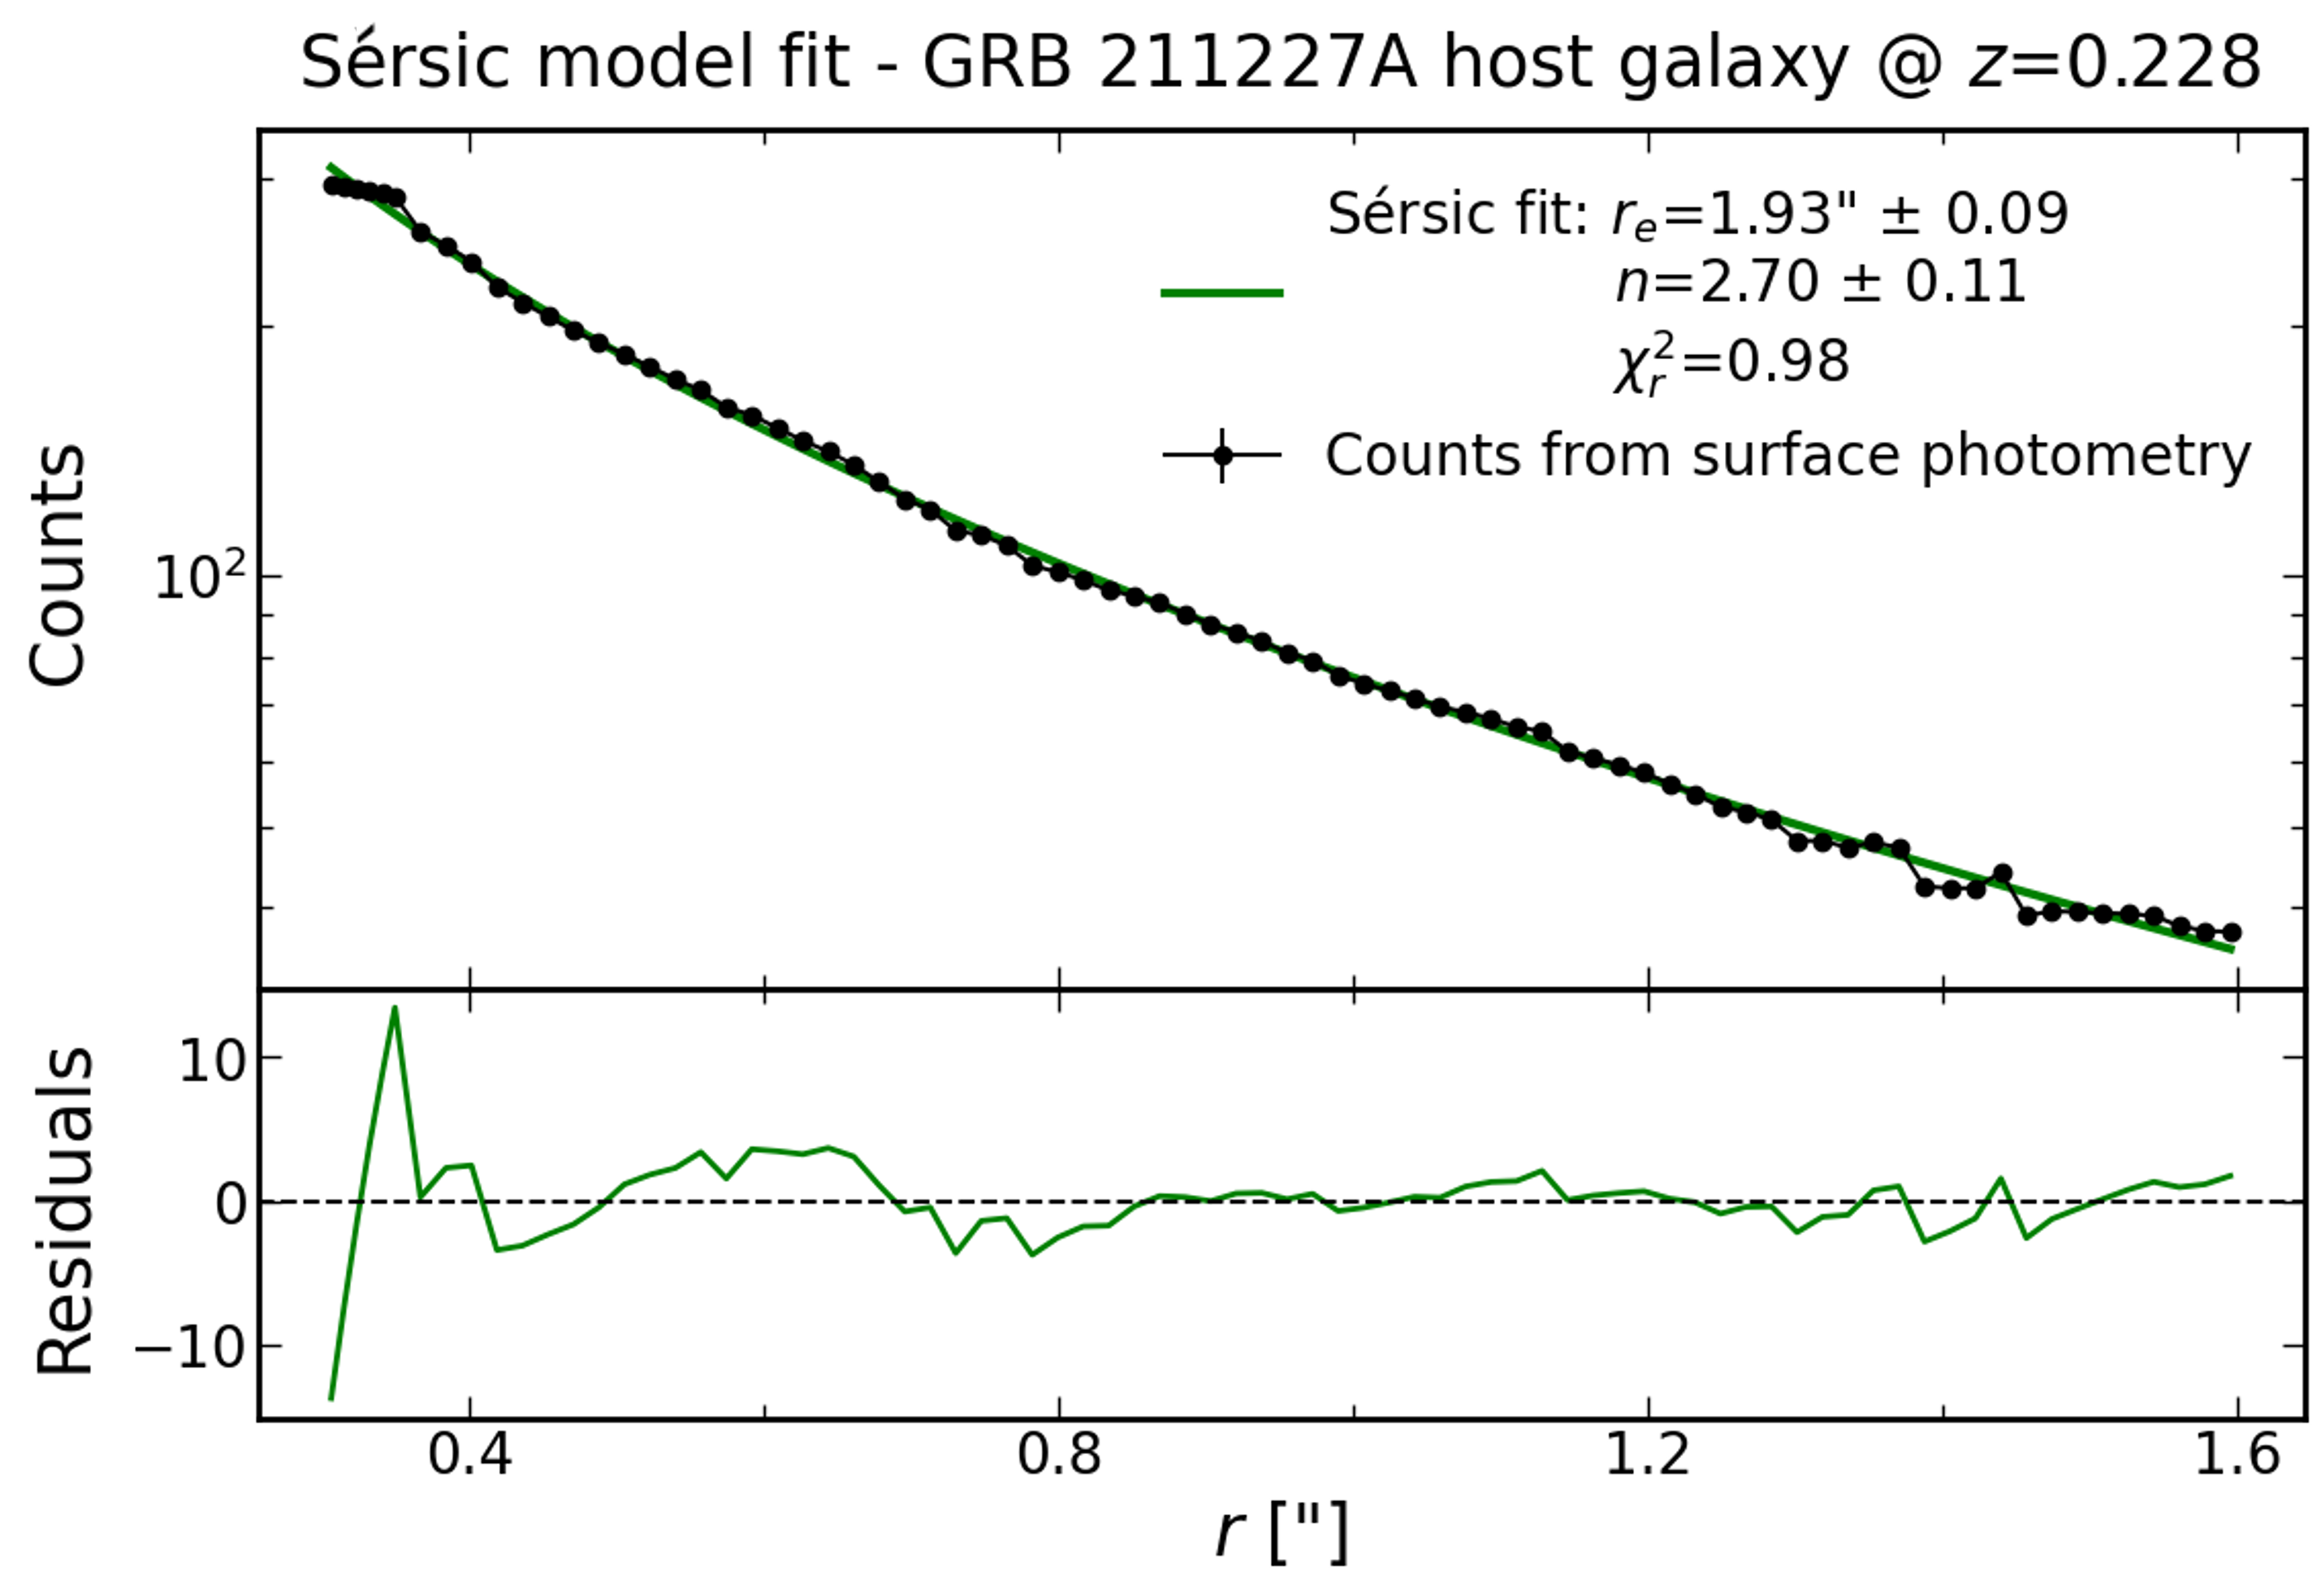
The association of GRB 211227A with the host galaxy is less complex than for GRB 211106A. As shown in §3.2, the XRT error circle lies 3.67′′ away from a = 0.228 galaxy with -band magnitude 19.4. A fit with a Sérsic model (see Fig. 12) yielded an effective radius , corresponding to 7.26 kpc at = 0.228, from which we obtained a normalized offset of 1.90. The corresponding chance association probability was thus 1.3%, suggesting that the source we analysed is probably the host galaxy of GRB 211227A. From the analysis of spectroscopic observation of this source, we identified several emission lines, all at a common redshift = 0.228 (see Table 9), in agreement with Malesani et al. (2021b). We also detected, at the same redshift, the absorption lines corresponding to Ca II 3933/3968 and to the Na I D doublet (5890/5896).
We focused our analysis on the detected emission lines, for which we computed the fluxes and corresponding luminosities presented in Table 9 in order to characterise the host galaxy. First, by matching photometric observations to our spectral data, we inferred a mean slit-loss correction factor of 2.91. We have also taken into account the extinction, both in the Milky Way and in the host galaxy. For the former, we obtained mag, where we considered the typical value for our galaxy of and = 0.02 (Schlegel et al., 1998). Then, following Pei (1992), we derived the value from the Milky Way extinction curve corresponding to the central wavelength of each detected emission lines. We estimated the attenuation in the host galaxy from the flux ratio of Hα and Hβ emission line fluxes, the ratio of which is known as the Balmer decrement. The intrinsic, dust corrected ratio is , assuming a case B recombination, in the low-density limit and electron temperature of 104 K (Osterbrock, 1989). We observed a Balmer decrement of , from which we derived:
| (2) |
where the attenuation at the wavelength of and is A and A. We obtained these values using a SMC-type extinction curve (from Pei, 1992) with .
In order to examine the galaxy nature, we computed its position in the Baldwin-Phillips-Terlevich (BPT, Baldwin et al. 1981) diagram by means of two emission lines ratios: [NII]6583/Hα and [OIII]5007/Hβ. Taking into account the diagram for the Sloan Digital Sky Survey galaxies reported in Kewley et al. (2013), we found that GRB 211227A putative host galaxy lies in a mixing sequence zone, slightly outside the Star-forming abundance sequence region. Moreover, the galaxy is placed below the clear bifurcation between star forming galaxies and AGNs, therefore it is difficult to distinguish how much contribution to the emission lines is given by the gas ionized by hot stars or non-thermal sources such as AGN and/or shocks (for a detailed discussion on this topic, see Kewley et al. 2013). Nevertheless, keeping this caveat in mind, we investigated the star formation rate (SFR) and metallicity of the galaxy, assuming the star forming component to be the leading ionizing power actor over a possible AGN one.
We measured for the [O II] emission line a luminosity of 1041 erg/s, corresponding to a SFR of yr-1 (derived following Kennicutt, 1998); we also measured a luminosity for the Hα emission line of 1040 erg/s, which translated into a SFR of yr-1.
Considering a rest frame band absolute magnitude , extracted from the host spectrum, corresponding to a luminosity (assuming the absolute band magnitude of field galaxies to be as done by D’Avanzo et al. 2009),
the specific SFR turned out to be and yr for the [O II] and the Hα emission line, respectively.
In order to estimate the metallicity, following Nagao et al. (2006), we computed the ratio of the emission lines indicated in Table 9 and derived the corresponding ranges of oxygen abundance. The results are presented in Table 12. The discrepancy of the values obtained could be due to the non-negligible contribution to the lines from AGN and/or shocks, especially regarding the high [N II]6583 flux, while another explanation is the different absolute scale differences between individual strong-line diagnostics (Kewley & Ellison, 2008). Nevertheless, we noticed that the indicators tend to favor a super-solar metallicity (taking 12+log(O/H)=8.69 as solar metallicity reference, from Asplund et al. 2009).
| Filter | [] | FWHM [] | mag | |
|---|---|---|---|---|
| 3821.47 | 600.87 | 22.314 | 0.015 | |
| 4874.36 | 1452.65 | 21.050 | 0.003 | |
| 6268.45 | 1241.21 | 20.123 | 0.003 | |
| 7619.31 | 1588.68 | 19.549 | 0.002 | |
| 8661.19 | 921.69 | 19.415 | 0.004 | |
| 12520 | 1720 | 18.596 | 0.145 | |
| 21470 | 3090 | 18.388 | 0.170 |
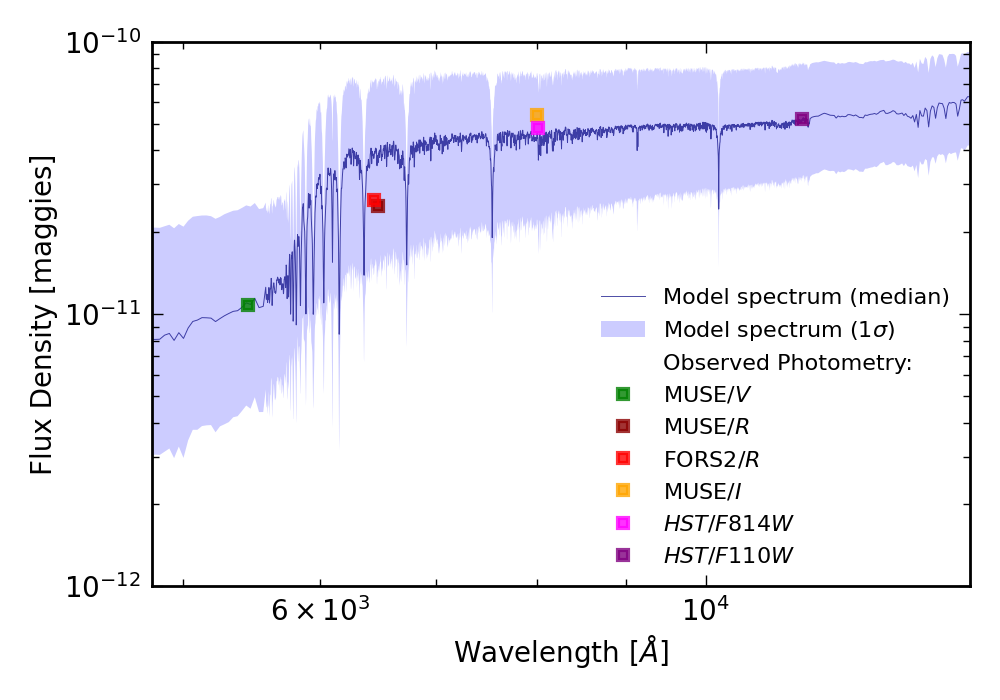
To further investigate the nature of the host galaxy, we performed a SED fit: we collected , , , and magnitudes from the CFHTLS survey (Hudelot et al., 2012), and , infrared magnitudes from the VISTA VHS DR5 (McMahon et al., 2021) catalogue (see Table 13). To perform the SED fit we followed the same procedure, and used the same spectral templates, described in §6.1. However, differently from the SED fit for GRB 211106A host, we fixed the redshift to the value derived from the spectrum: =0.228. The best fit, along with the host galaxy catalogue magnitudes, are shown in Fig. 13, and a list of the results for the parameter space is reported in Table 14.
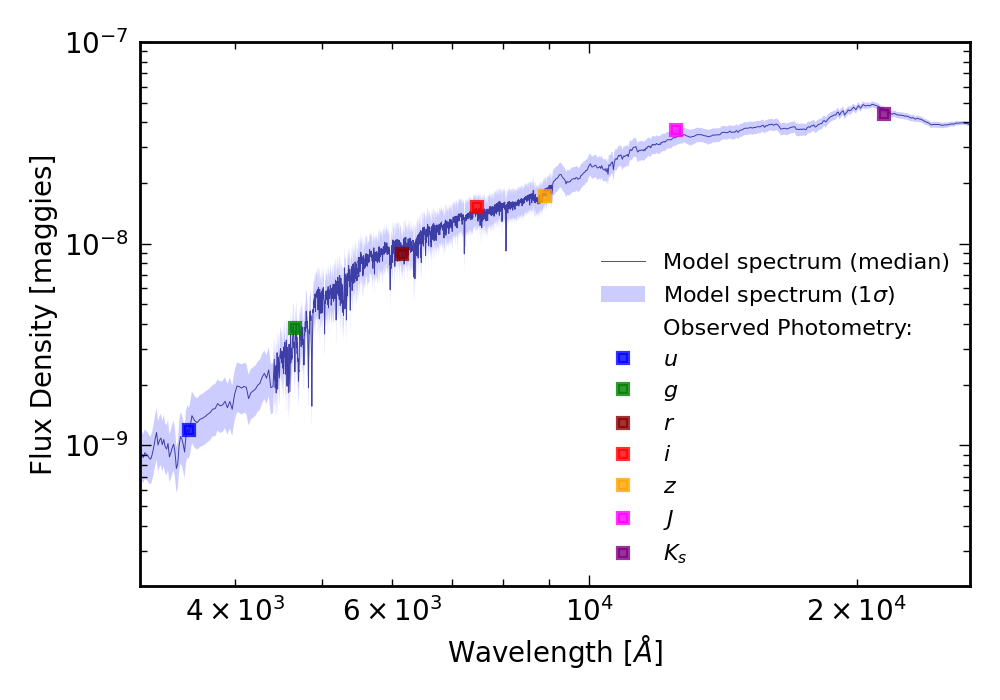
| Parameter | posterior median value |
|---|---|
| stellar mass [1010 ] | 3.42 |
| extinction [mag] | 0.19 |
| metallicity ) | 0.35 |
| age [Gyrs] | 5.64 |
| folding factor [Gyrs] | 0.95 |
| survived mass fraction | 0.64 |
Regarding the metallicity, we computed an oxygen abundance 12+log(O/H)=9.04, fairly super-solar, to some extent in agreement with what is suggested from the metallicity ranges in Table 12.
To frame out the stellar mass of the galaxy, we took into account the relation between stellar mass and absolute band magnitude proposed in Savaglio et al. (2009) for a sample of GRB host galaxies. For the host of GRB 211227A we computed an absolute magnitude , corresponding to a stellar mass of 1010. The median of the posterior distribution on the stellar mass is slightly higher than the value inferred from the band absolute magnitude and consistent at 2 level with the dispersion of the sample, pointing towards the goodness of our result.
Besides, we were able to estimate the SFR from the delay- SFH, the age of the host, and the total mass formed at : . From the median posterior values we derived:
| (3) |
which, given a mean conversion factor of in order to account for the different IMF assumed by the relations in Kennicutt (1998) (i.e., Salpeter IMF, Salpeter 1955) with respect to the Chabrier IMF from the SED analysis, is consistent with the values estimated from the [O II] and Hα line luminosities due to the wide 1 uncertanties derived from and , and consequently, making it difficult to discriminate the contribution of AGN and/or shocks on the [O II] and Hα lines.
We considered the results of our SED analysis as a reference to frame out GRB 211227A host galaxy properties with respect to the sample by Nugent et al. (2022). We found that GRB 211227A host galaxy is in good agreement at 1 c.l. with median values of typical SGRB hosts regarding stellar mass, SFR, and extinction, and 2 consistent with respect to usual metallicities. It is interesting to note that the host appears to be more massive than the average lying in the upper tail of the sample distribution. This fact, coupled to a SFR ranging from moderate to substantial values, suggests a transitioning nature for the host, with a mass typical of quiescent galaxies but a SFR more consistent with star-forming hosts.
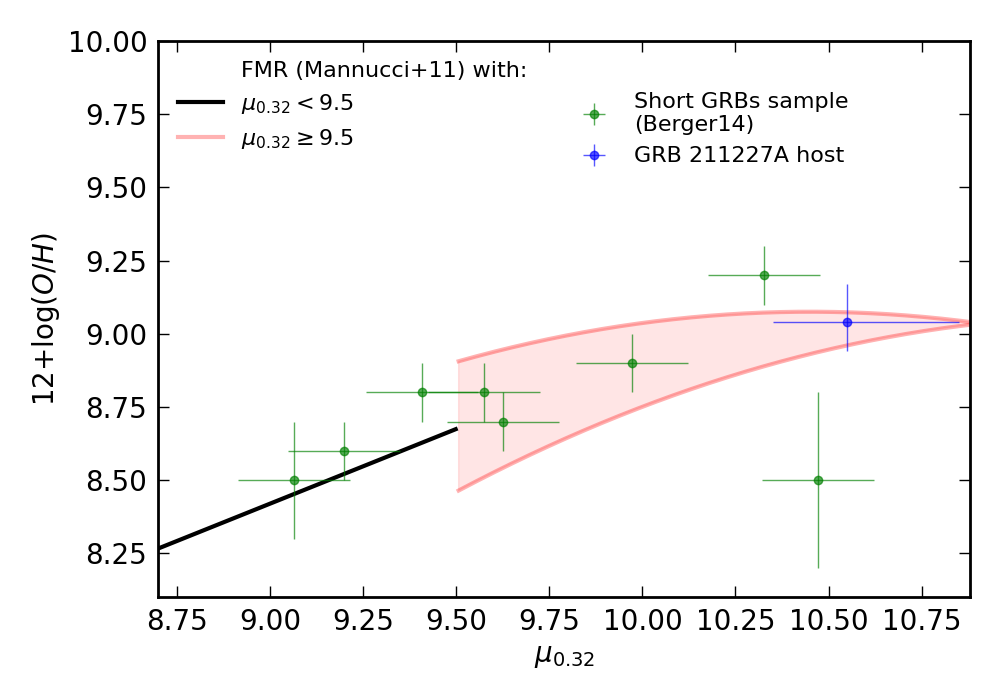
Since GRB 211227A shows an extended emission, we also compared its host galaxy properties to the typical values for LGRB hosts, which turn out to have a lower metallicity (median 12+log(O/H) 8.3, Stanek et al. 2006; Modjaz et al. 2008; Levesque et al. 2010; Vergani et al. 2015; Japelj et al. 2016; Palmerio et al. 2019), lower masses (median M 1.58109 M⊙, Savaglio et al. 2009; Leibler & Berger 2010; Vergani et al. 2015; Japelj et al. 2016; Palmerio et al. 2019), and they are younger and star-forming (Bloom et al., 2002; Wainwright et al., 2007; Vergani et al., 2015; Japelj et al., 2016; Palmerio et al., 2019). This suggests that a LGRB host nature is disfavoured for the galaxy. As a final gauge, we explored the fundamental metallicity relation (FMR, Mannucci et al. 2010; Mannucci et al. 2011), tested for the first time on SGRBs hosts by Berger (2014), between the oxygen abundance and the quantity =log()- 0.32log(SFR). We made use of metallicity, mass, and SFR values derived from the SED fit, leading to .
A plot of our results is shown in Fig. 14. The value is consistent with the FMR, supporting, despite the small sample and the possible lines contamination, the picture of SGRB hosts following the relation for field galaxies along a wide range of stellar mass and SFR values, and constraining it in a region of poor sampling.
6.3 Afterglow emission
After the analysis of the host galaxies associated with the two bursts, we investigated their optical afterglow emission with respect to their X-ray emission. We computed the X-ray to optical slope and we compared them with the population of Long GRBs analysed in the same way by Melandri et al. (2012). To do this, we estimated the flux both in the X-rays and in the optical band ( filter) at = 11 h in order to compute the spectral index . Moreover, we computed the X-ray spectral index from the late-time spectrum fit, defined as - 1, where is the photon index obtained from the X-ray spectral fit.
6.3.1 GRB 211106A
Starting from the X-ray light curve fit for GRB 211106A (§4.1), we estimated the X-ray flux at = 11 h, that is = 0.05 Jy, while for the optical afterglow we only had an upper limit of = 26.7 mag at = 2.82 d. We assumed that, at such a late time, the optical afterglow follows a similar decay with respect to the X-ray afterglow, therefore we estimated the optical limit at assuming a decay index , and we obtained Jy. The resulting limit for the X-ray to optical slope turns out to be 0.3. Moreover, we computed the value for starting from the joint spectral fit of Swift/XRT, Chandra and XMM-Newton data performed by Laskar et al. (2022), giving . Thus, and . According to the definition of a “dark” GRB (Jakobsson et al., 2004; van der Horst et al., 2009; Melandri et al., 2012), , we can classify GRB 211106A as a dark burst. The darkness of a burst was found to be related to high redshift or large dust column density for Long GRBs (Melandri et al., 2012), while for Short GRBs it may often be a consequence of the intrinsic optical faintness of the afterglow due to a low density circumburst medium (see Asquini et al., 2019). GRB 211106A shows a relatively high (Laskar et al., 2022), therefore intrinsic absorption can explain its darkness (for a recent comprehensive work on short GRBs darkness, see Gobat et al. 2023).
6.3.2 GRB 211227A
We repeated the same procedure for GRB 211227A, and we estimated the X-ray flux = 0.005 Jy, while for the optical afterglow we considered again the closest limit, that is = 25.4 mag, obtained at = 0.211 d (5 hours after ). In this case we fitted the X-ray light curve with a broken power law, and since both our limit and lie on the same branch of the broken power law (the last one), we estimated the optical limit at 11 hr assuming a decay index : Jy. The corresponding limit for the X-ray to optical slope turns out to be 0.5. We retrieved the X-ray spectral index from the Swift/XRT spectrum repository, and we obtained , from which we derived . Also in this case, GRB 211227A fulfills the condition for a “dark” GRB: . At variance with GRB 211106A, this burst shows a medium ( cm-2, see §5.1), therefore it is more likely that the darkness of the burst is due to a tenuous circumburst medium.
6.4 Kilonova limits
In this section we look for possible evidence of kilonova emission associated with the two GRBs presented in this work. The procedure adopted here follows the one described by Rossi et al. (2020): first, we put AT2017gfo spectra taken with a daily cadence, from 1.5 to 10.5 days after the trigger, from WISeREP repository151515 https://www.wiserep.org/search/spectra, in the rest frame. Then, in order to compare the AT2017gfo and GRB luminosity at the same wavelength, we computed an effective rest frame filter, centered at , where is the band corresponding to the filter used for GRB observations. After integrating the AT2017gfo luminosity spectra taken at different epochs over the effective rest frame filter, we built the AT2017gfo luminosity light curves in each rest frame filter, . We applied this procedure to all filters adopted for our observations for both GRBs.
6.4.1 GRB 211106A
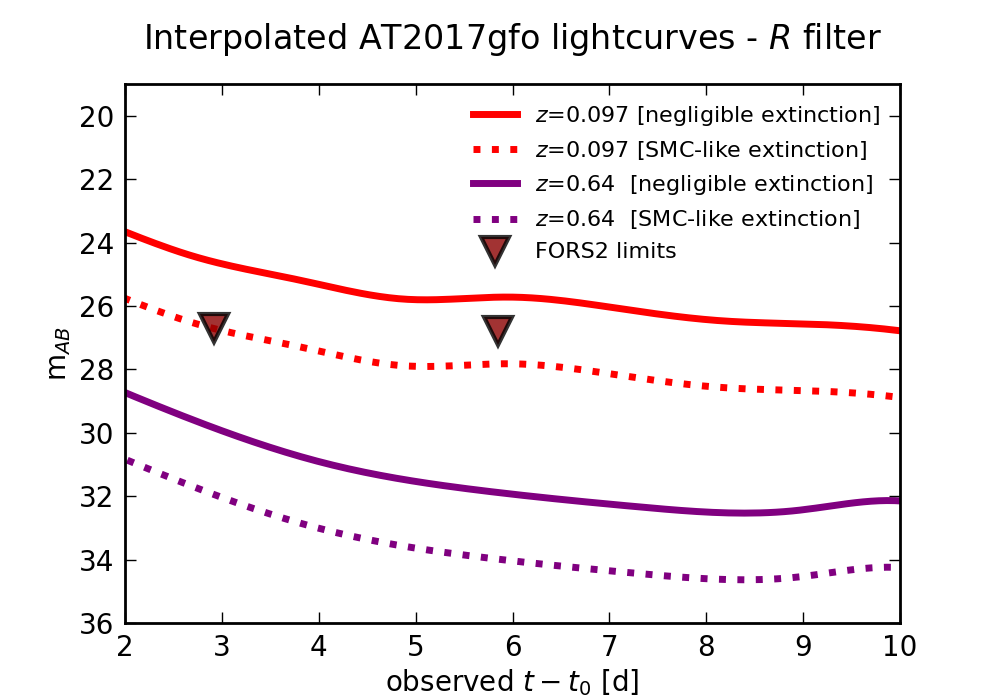
We show in Fig. 15 and Fig. 16 the light curves - built as described above - in , bands, and the magnitude limits on our observations performed with FORS2 and HAWK-I instruments (see §4). We investigated the kilonova detectability for =0.097 - as a reference - and the photometric =0.64, both assuming zero and non-negligible extinction. For the latter, we considered a coefficient 2.6 mag, which was found as a lower limit from the afterglow analysis by Laskar et al. (2022), derived taking into account a SMC-like extinction model. Following Pei (1992), and taking into account the same model, we derived =2.10 mag and =0.42 mag for our filters, accounting also for the Milky Way extinction along the line of sight161616 https://ned.ipac.caltech.edu/extinction_calculator. We estimated the expected magnitude in FORS2 epochs 1 and 2 by interpolating the light curve, while the third epoch was taken far later than the last AT2017gfo observation. At =0.097, the KN emission would have become fainter than the mean magnitude limit of the three epochs in -band 9 d after in case of negligible extinction and slightly before the time of our first epoch in the absorbed case.
For negligible absorption, in epoch 1 and 2 an AT2017gfo-like event would have been 1-2 magnitudes brighter than our limits, thus it would have been strongly detectable. On the other hand, in the case of high extinction it would have been more challenging to identify the KN in epoch 1 given an extrapolated magnitude comparable to the magnitude limit, while it would have been more than 1 magnitude below our threshold for epoch 2.
By placing our AT2017gfo-like light curve template at increasing values for , we found that the KN would have been undetectable even in epoch 1 for in the cases of zero extinction.
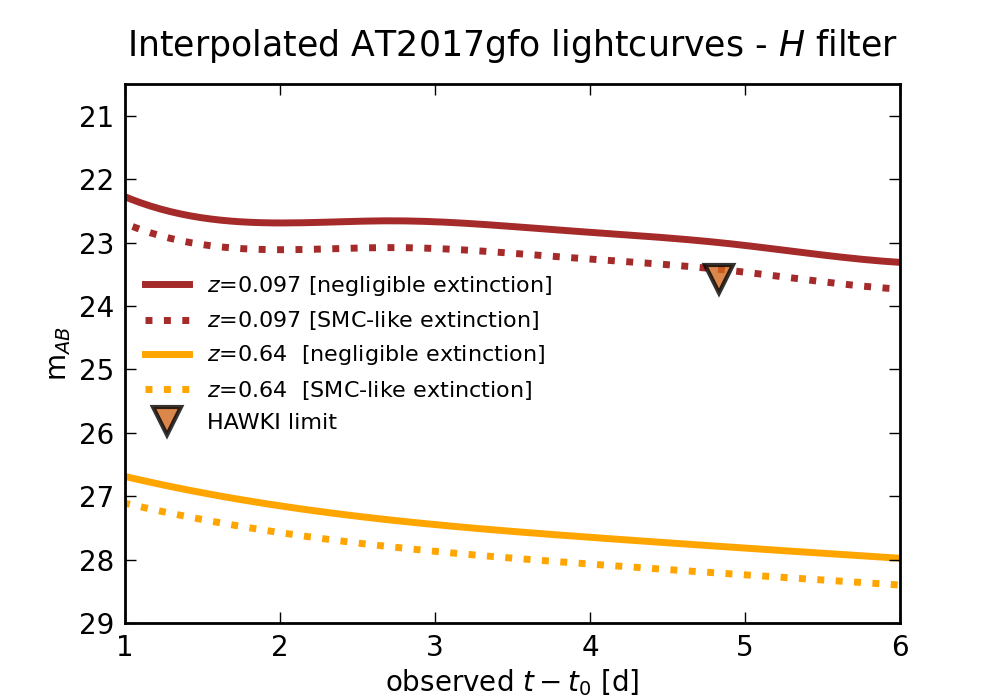
The same analysis performed for the HAWK-I band showed that, at the time of the observation, an AT2017gfo-like KN at =0.097 would have been about 0.6 and 0.2 mag brighter with respect to our limit, in the negligible and high extinction case, respectively. Here, the redshift threshold for the detection is =0.13 and =0.11 for the two cases.
Hence, the absence of a KN identification supports a GRB distance larger than =0.097. Such a conclusion is in agreement with the photometric redshift =0.64 we derived for the GRB 211106A host galaxy and with the 0.5-1.0 redshift range estimated by Laskar et al. (2022). At such a redshift, the expected light curves would have been significantly fainter than our magnitude limit in both and filters.
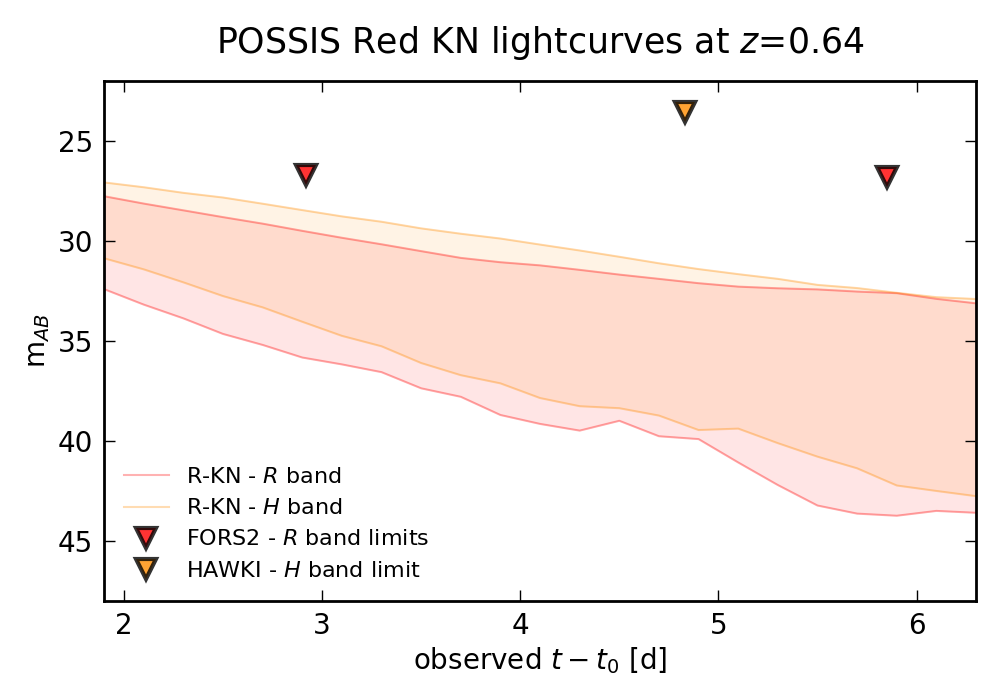
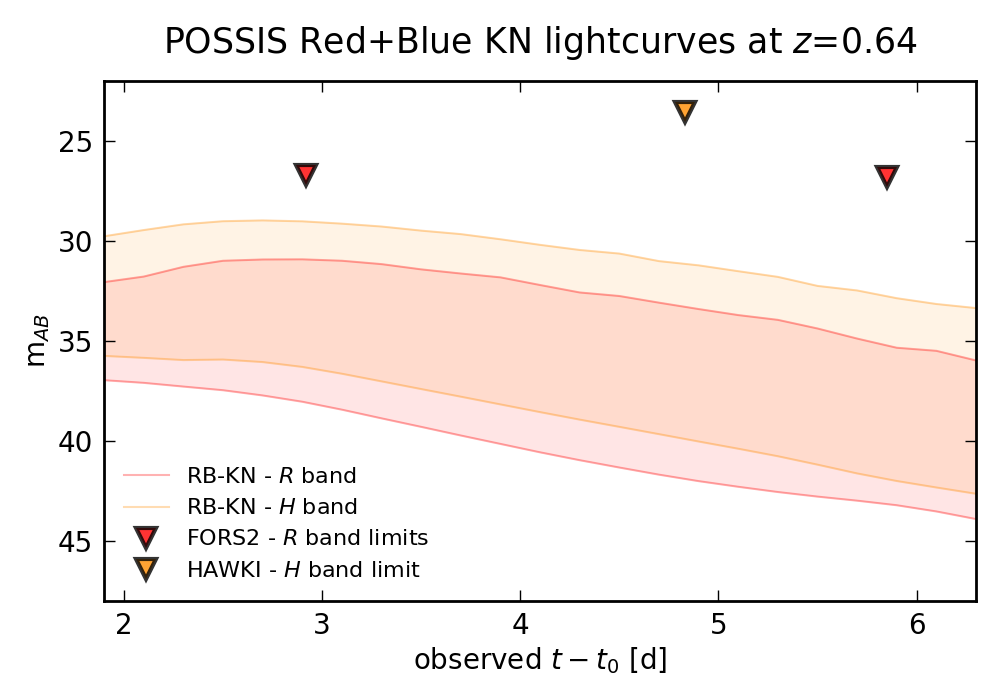
However, the KN non-detection could be ascribed also to an event with different characteristics with respect to AT2017gfo, since KNe associated to short GRBs can actually display significant differences in their luminosity, spectral properties, and temporal evolution (see, e.g., Rossi et al. 2020). To further investigate the constraints on KN emission provided by our optical/NIR upper limits, we made use of multidimensional models of kilonovae computed with the time-dependent 3D Monte Carlo code POSSIS171717https://github.com/mbulla/kilonova_models, by Bulla (2019). In particular, we focused on two classes of models: those presented by Anand et al. (2021), taylored for NS-BH mergers, and the ones from Dietrich et al. (2020) for NS-NS mergers. The former allowed us to compute light curves for the case of a ”Red” kilonova (R-KN) with a tidal dynamical ejecta contribution of lanthanide-rich elements only, while the latter provided us the case of a ”Red+Blue” kilonova (RB-KN) with also a polar lanthanide-free component. Both models include a contribution of spherical disk wind ejecta. Therefore, we could test different shapes against our photometric limits in order to constrain some of the kilonova parameters for GRB 211106A. Specifically, we built and band light curves from models placed at the distance of our photometric redshift, =0.64, as seen from an on-axis observer. All the examined light curves were a function of three fundamental parameters: the mass of the dynamical ejecta , the mass of the disk wind ejecta , and the half-opening angle of the lanthanide-rich component , whose ranges are listed in Table 11 for the two classes of models.
We examined 81 different configurations of R-KN and 140 of RB-KN, reported in Fig. 17. We found that none out of 81 models of R-KN and 140 models of RB-KN would have been detectable, even in our first FORS2 -band observation.
The kilonova at such a luminosity distance would have been very challenging to detect, requiring a fairly large amount of ejecta mass. From our detectability thresholds we were able to draw upper limits on the ejecta masses in the negligible extinction scenario: in the case of R-KN we established and , while for RB-KN we found and .
| Models | [] | [] | |
|---|---|---|---|
| R-KN | [0.01-0.09] | [0.01-0.09] | |
| RB-KN | [0.001-0.02] | [0.01-0.13] | [-] |
6.4.2 GRB 211227A
We performed the same analysis for GRB 211227A, without considering intrinsic optical extinction. This is because we found evidence for low from the SED analysis of the host galaxy (§6.2). This is in agreement with the observed offset of the XRT afterglow position with respect to the host galaxy center. As shown at the beginning of §6.2, the candidate host galaxy of GRB 211227A has an effective radius of 1.9′′ (corresponding to 7.26 kpc at =0.228) and the best XRT position places the afterglow at ( from the centre of the host galaxy, suggesting that the burst occurred outside the densest regions of its host. In Fig. 18 we report the light curve computed for the burst placed at = 0.228, along with our magnitude limits for the X-Shooter and observations and the FORS2 band observation.
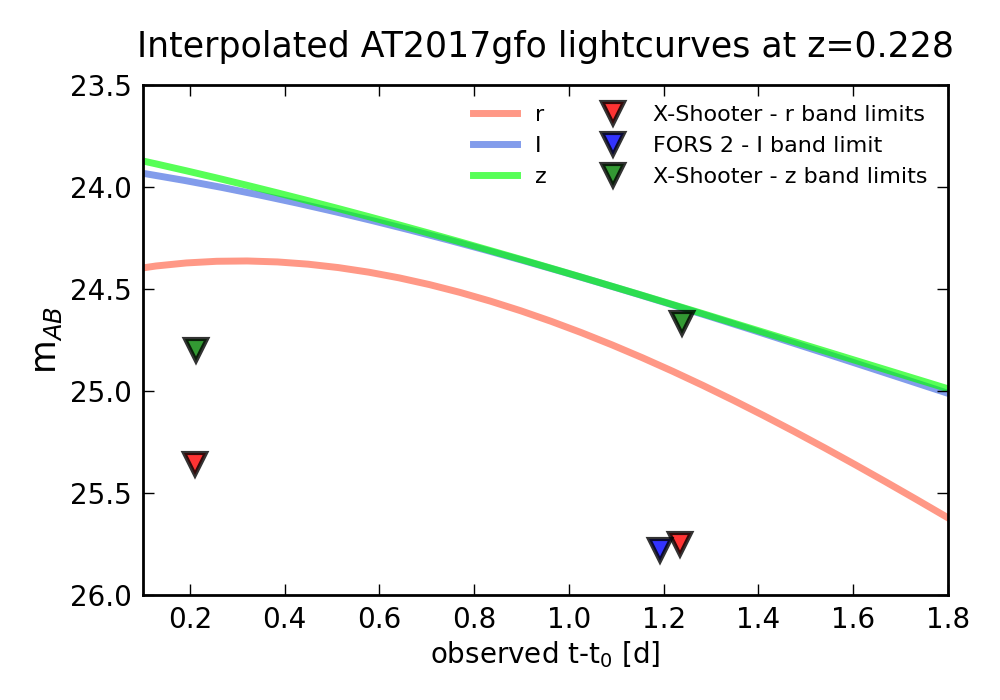
With the exception of the second -band observation, for which the magnitude limit is comparable to the interpolated magnitude of the AT2017gfo-like event, in all the other cases the kilonova would have been 0.8-1.2 magnitudes above our detection thresholds. This fact, coupled with the host galaxy association, and the early times of the two observations, suggests that the main reason for the non-detection of the KN emission could be an event with different properties with respect to AT2017gfo, rather than a similar one placed at a farther distance than =0.228, as for GRB 211106A.
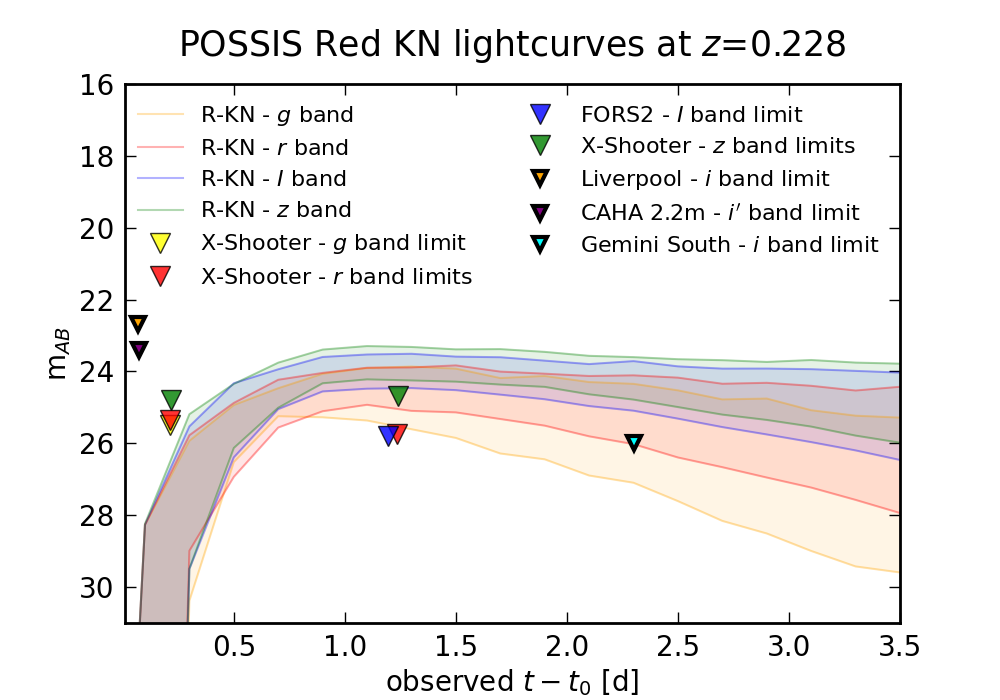
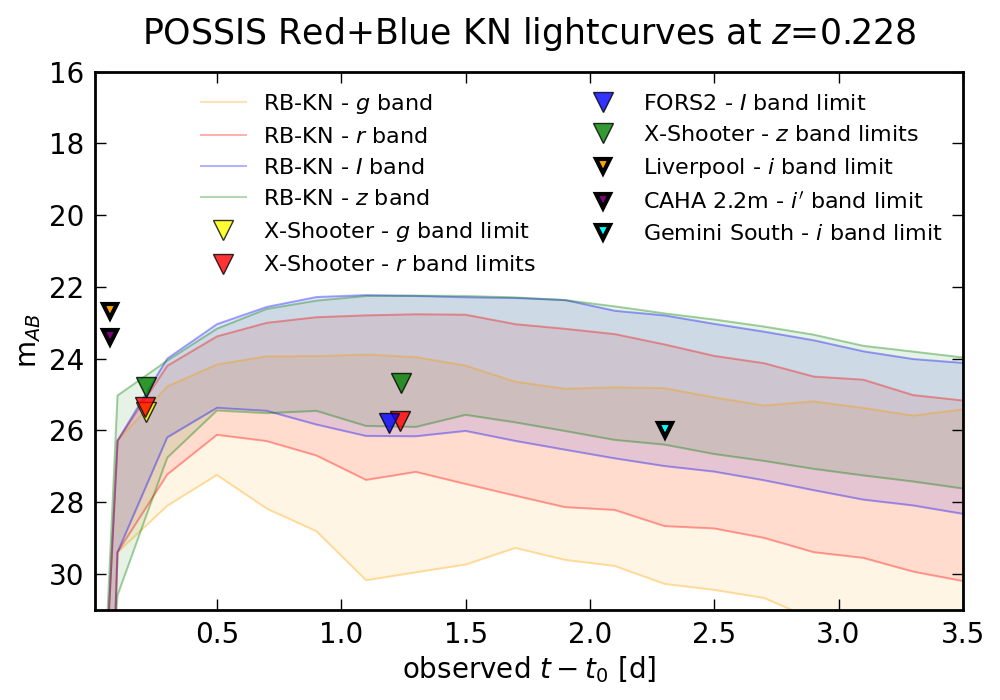
We tested models from POSSIS, presented in the previous section, for an on-axis observer. All the configurations are reported in Fig. 19 for R-KN and RB-KN. We found that a R-KN would have been detectable in all 81 models during the second and epochs, and the single observation. Especially due to the combination of deep limit and bright counterpart in the band, even the faintest R-KN would have been magnitudes above the threshold of the FORS2 epoch. For the RB-KN we found that 137 out of 140 configurations would have been detectable at least in the filter, which also in this case represents the most stringent constraint.
We found that the three configurations below our limits would have been the ones with the lowest dynamical mass budget , half opening angle =75∘, and with three different disk wind mass contribution . The angular dependence and the large mass range from the disk wind may suggest that, at the time of our second epoch of observations, the dominant mass contribution was given by the dynamical component. Therefore, we were able to draw upper limits for the dynamical ejecta mass alone. In the case of R-KN we established while for RB-KN we found , with a preference for large half-opening angle. Given the similarity between GRB 211211A and GRB 211227A, it is worth noticing how the former mass threshold is only marginally consistent with what was derived in the KN analysis by Rastinejad et al. (2022) in association to GRB 211211A, while the latter mass limit is not. These differences further underlines how KNe can present a wide range of properties and are far from being standard candles.
Nevertheless, in the R-KN scenario such low ejecta masses are still viable from BH-NS mergers. For instance, Metzger (2019) reports 10-4 as the lower end of typical dynamical ejecta. Even the suppression of KN emission could be possible due to the absence of ejecta when the BH swallows the NS: this is feasible assuming large NS-BH mass ratio, low spinning BH, and stiffer NS equation of state, as discussed in the analysis of the peculiar GW event GW190814 by Ackley et al. (2020). In the RB-KN scenario the situation would be more puzzling: as in the previous case, lower masses are possible for the dynamical component, however, the extended emission of the burst might suggest a magnetar nature for the central engine (Gompertz et al. 2013; Yang et al. 2022), that would ensure a further magnetar wind contribution on the ejecta material of the order of 10-2 (Metzger, 2019), too high to justify the non-detection.
6.5 Supernova limits
As we did for the kilonova detectability discussion presented in the previous section, we look for possible presence of supernova emission associated with the two bursts. For GRB 211106A, this is done in order to investigate and possibly rule out a collapsar origin associated with a short event (as in the case of GRB 200826A, Rossi et al. 2022), while for GRB 211227A because of the long duration of its prompt emission. In the following discussion we consider SN1998bw (Galama et al. 1998; McKenzie & Schaefer 1999; Patat et al. 2001; Sollerman et al. 2002; Clocchiatti et al. 2011) and SN2006aj (Pian et al. 2006; Mirabal et al. 2006; Ferrero et al. 2006; Sollerman et al. 2006) as references to investigate the supernova emission against our photometric limits. For those few cases where data were not available at the time of our observations, we made use of a back extrapolation from the retrieved lightcurves.
6.5.1 GRB 211106A
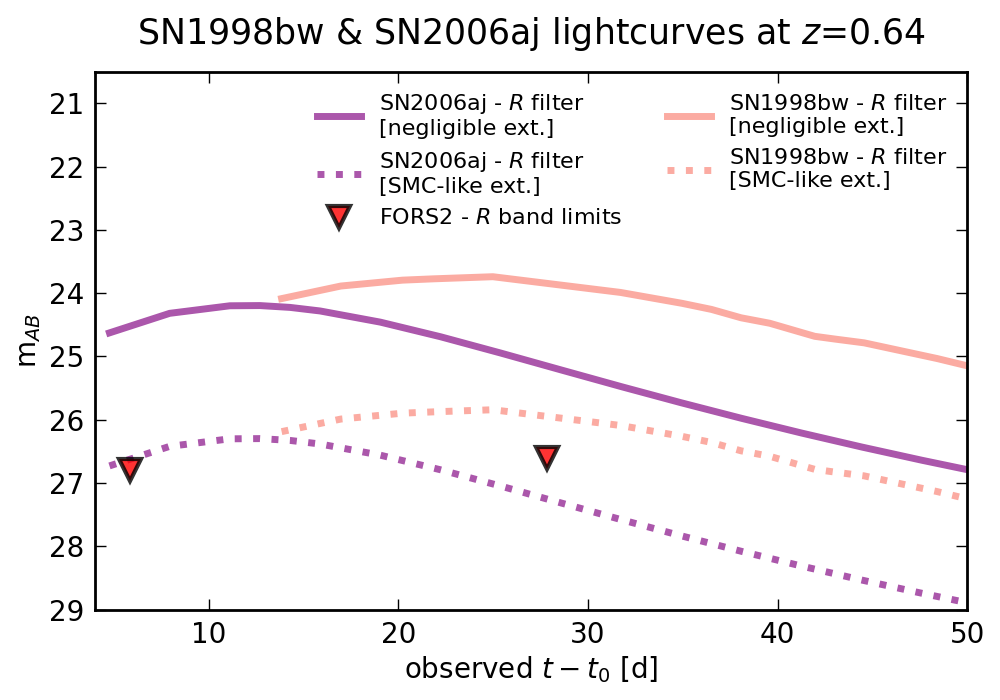
We show in Fig. 20 the light curves of the two supernovae mentioned above at =0.64, along with magnitude limits computed for the second and third FORS2 epochs, 5.9 and 27.9 days after T0, respectively. We observed that, in case of negligible absorption, the two supernovae would have been significantly brighter than our detection thresholds: SN1998bw would have been 2.6 mag above our third epoch limit, SN2006aj 2.2 mag above the second one. Including the intrinsic extinction =2.1 mag, as we did in §6.4.1, SN1998bw would have been still confidently detectable in the third observation, while a SN2006aj-like event would have been more challenging to reveal, even if 0.1 mag more luminous than the second epoch limit.
6.5.2 GRB 211227A
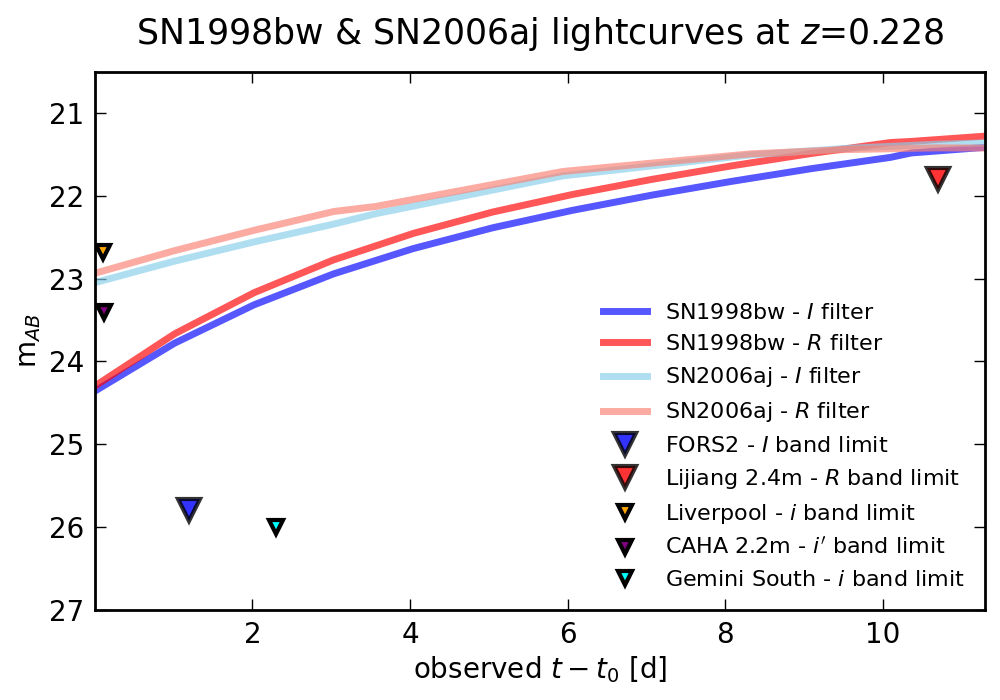
We also tested the two supernova lightcurves, placed at =0.228, against our photometric limits, to investigate a possible collapsar nature for GRB 211227A progenitor. Lü et al. (2022) showed that a SN1998bw-like event at =0.228 would have been detected in the -band at 10.7d after T0, in case of negligible extinction along the line of sight. In order to examine this conclusion we compared SN1998bw and SN2006aj-like band lightcurves, at =0.228, against our deepest photometric limit, obtained with FORS2 in the band at 1.2d after T0.
The lightcurves for and filter of SN1998bw and SN2006aj are shown in Fig. 21. We observed that both supernovae would have been brighter than our band limit, 2 mag for SN1998bw and 3 mag SN2006aj. This result is in agreement with Lü et al. (2022), pointing towards a compact binary merger progenitor for GRB 211227A.
6.6 GRB 211006A and GRB 211227A in the context of short GRBs
In order to deeper investigate the characteristics for the two GRBs discussed in this work, we compared their observed and rest frame properties with those of the short GRB sample named S-BAT4 (D’Avanzo et al., 2014). The sample consists of a sub-sample of the Swift short GRBs with favourable observing conditions for redshift determination from the ground, promptly re-pointed by Swift/XRT, and which are bright (in terms of the observed peak flux181818This flux-limited sample selects short GRBs having the peak photon flux ph s-1 cm-2 using the keV Swift/BAT light curves binned with ms. This corresponds to an instrument that is times less sensitive than Swift.) in the keV Swift/BAT energy band. Although relatively small (16 events up to June 2013), this sample of short GRBs is complete in flux and has the highest completeness in redshift (70%) with respect to the short GRB samples presented in the literature to date. Following the same criteria adopted for the original sample, we extended it by adding 26 new SGRBs detected from July 2013 to December 2021, 24 of which with redshift determination (15 spectroscopic and 8 photometric redshifts, while one spectroscopic redshift and one photometric redshift were retrieved also for GRB 090515A and GRB 130515A of the original sample, respectively). The sample built this way consists of 42 SGRBs, 37 of them with redshift measurement, corresponding to a redshift completeness of 88%, which reduces to 67% if we consider only events with spectroscopic redshift measurement. 8 SGRBs with extended emission (EE) are also included, considering also GRB 211127A, whose observed properties make it belong to the S-BAT4 sample. Given the lack of an on-board Swift/BAT trigger, GRB 211106A is not part of the S-BAT4. The detailed overview of the extended S-BAT4 sample will be presented in a forthcoming dedicated paper.
6.6.1 Prompt emission correlations
For the GRBs of the extended S-BAT4 sample we retrieved all the needed information to characterize the prompt phase from the literature and/or GCN circulars191919https://gcn.gsfc.nasa.gov/gcn3_archive.html. For the bursts with a measured redshift we computed the isotropic equivalent energy () - in the rest frame common energy range 1 keV - 10 MeV - and the rest frame peak energy (). The was computed converting all the retrieved fluence values from the original energy band to a common (in the rest frame) band by means of the following relation:
| (4) |
where is either a Band function (Band et al. 1993) or a Cut-off power law for the majority of the bursts considered, is the redshift of the event, and - is the energy range in which the original fluence was measured.
For some of the new bursts added to the S-BAT4 with a redshift measurement, observed only by Swift/BAT, we were not able to infer the rest frame energy properties as the spectrum was best fitted by a single power law.
For the original sample, we updated the prompt emission spectral quantities for GRB 111117A, for which a spectroscopic redshift = 2.211 was determined (Selsing et al., 2018) in place of the previous photometric one, = 1.3 reported in D’Avanzo et al. (2014).
An extensive analysis on the results is beyond the scope of this work and will be discussed in future papers.
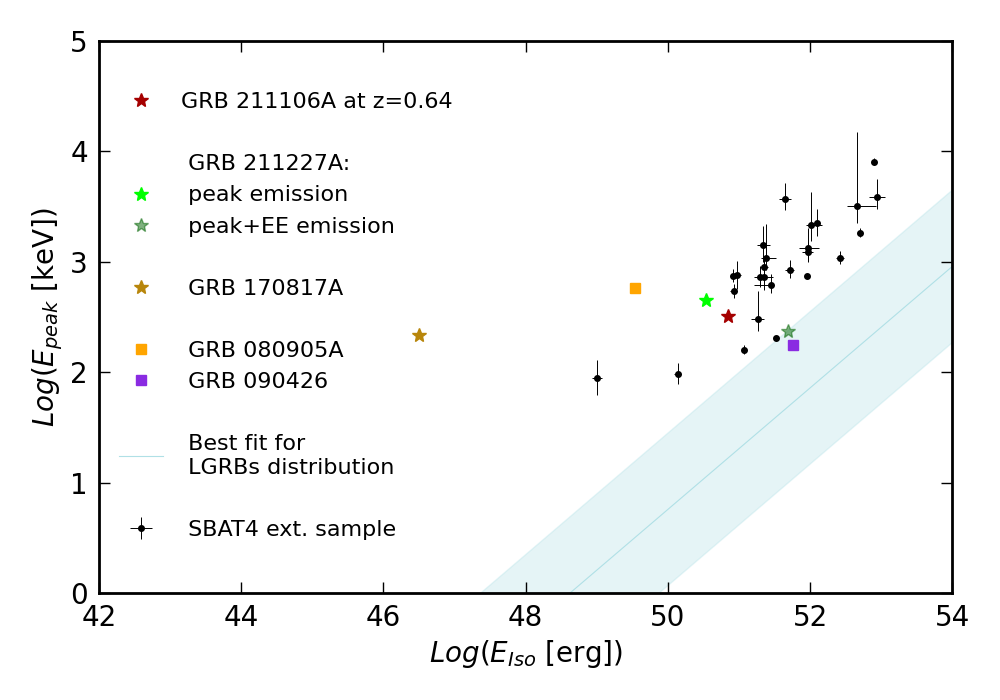
For GRB 211106A, assuming the photometric redshift, =0.64, we computed the rest frame prompt properties of the burst: 1050 erg and keV from the spectral parameters obtained by Konus-Wind (Ridnaia et al., 2021). For GRB 211227A, which belongs to the S-BAT4 sample, we likewise made use of the spectral parameters obtained by Konus-Wind (Zhu et al., 2022). We considered the values reported for both the main emission, lasting 4s, and the long rebrightening phase seen up to 84s. From the analysis of the peak we computed 1049 erg and keV. If we also consider the extended emission, the rest frame prompt properties become: 1051 erg and keV.
In Fig. 22 we reported the S-BAT4 sample in the plane. SGRBs lie almost entirely - with the exception of GRB 090426 - outside the 3 region in the correlation found for long GRBs (Amati et al., 2002), suggesting for a separate short GRB correlation with a slope similar to the long GRB relation with a different normalisation. A similar result was presented and discussed in D’Avanzo et al. (2014), implying that the distribution of GRBs over the plane, which clearly shows two different regions, can be used as a discriminant for the
GRB progenitor type (namely compact binary merger or collapsar).
We performed a fit to the SGRBs of the extended S-BAT4 sample202020We excluded GRB 080905A and GRB 090426, as discussed in D’Avanzo et al. (2014), as well as GRBs with only upper limits available. GRB 211227A was also excluded in order to test its properties with respect to the sample. in the plane with the relation , following the OLS bisector method presented in Isobe et al. (1990). The best bisector fit provided a normalization A and a slope B , in agreement with the findings of D’Avanzo et al. (2014).
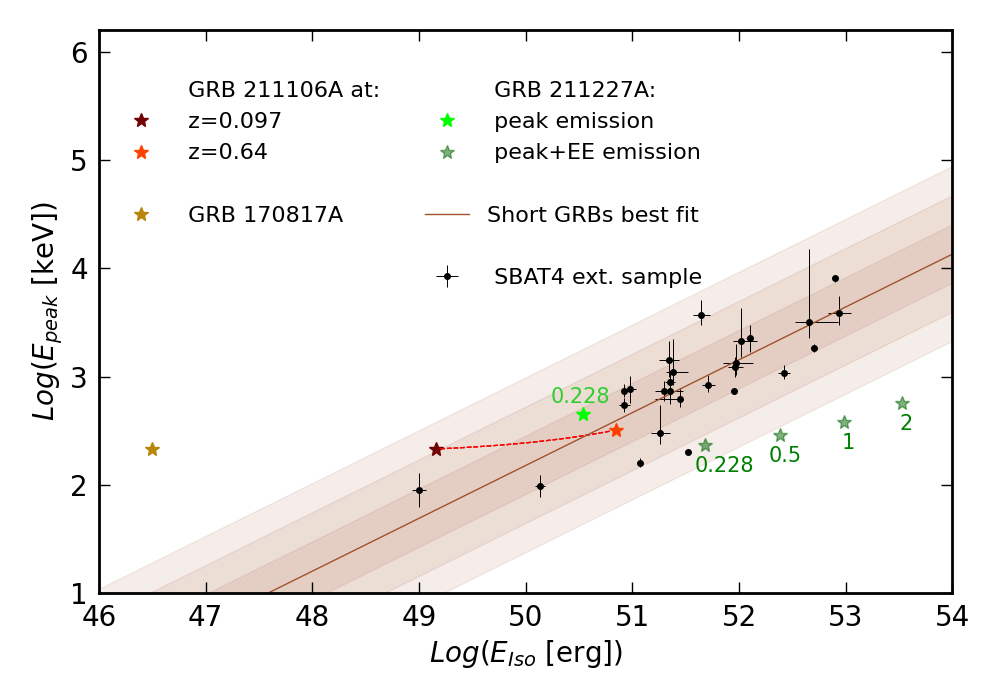
GRB 211106A, if at =0.64, would be consistent with the best fit of the relation found for SGRBs (Fig. 23), and, in general, needs to be at and to be consistent at 1 and 2 level, respectively. This, together with the discussion in §6.1 and §6.4, rules out an host galaxy at =0.097, that would be consistent only at 3 level with the SGRBs Amati relation.
GRB 211227A prompt energy quantities are consistent with the rest of the sample in the Amati plane, if we consider the whole burst emission at =0.228, at 3 level.
Given the computed , we tested the burst also at increasing values of the redshift (as done by Tsvetkova et al. 2022) and we verified that the burst would behave as a long GRB in terms of prompt features, leaving the short Amati relation 3 region for 0.4.
However, we lack a SN detection, the host galaxy properties are consistent with typical values of SGRBs hosts (§6.2), and the shape of the prompt emission lightcurve is clearly distinguished between the initial pulse and a softer long lasting emission (Fig. 2). If we analyse the burst in the context of SGRBs with extended emission, considering the prompt energy quantities of the initial pulse alone, it is in good agreement with the best short Amati relation fit at level, at =0.228. This fact, coupled with the spectral analysis, reflects the progenitor scenario from compact object merger, despite the long T90.
6.6.2 Rest frame X-ray afterglows
As a final gauge on GRB 211106A distance and GRB 211227A nature, we analyzed their X-ray afterglow emission compared to the S-BAT4 SGRBs. We computed the rest frame X-ray light curves for all SGRBs with redshift, as follows: first, we retrieved from the Swift Burst Analyser212121http://www.swift.ac.uk/burst_analyser/ (Evans et al., 2009) the observed 0.3–10 keV unabsorbed fluxes and the time-resolved measured photon spectral index, , for each GRB of the sample. We then put the fluxes in the common rest frame (2-10 keV) energy band by means of the following relation (as done by Gehrels et al. 2008):
| (5) |
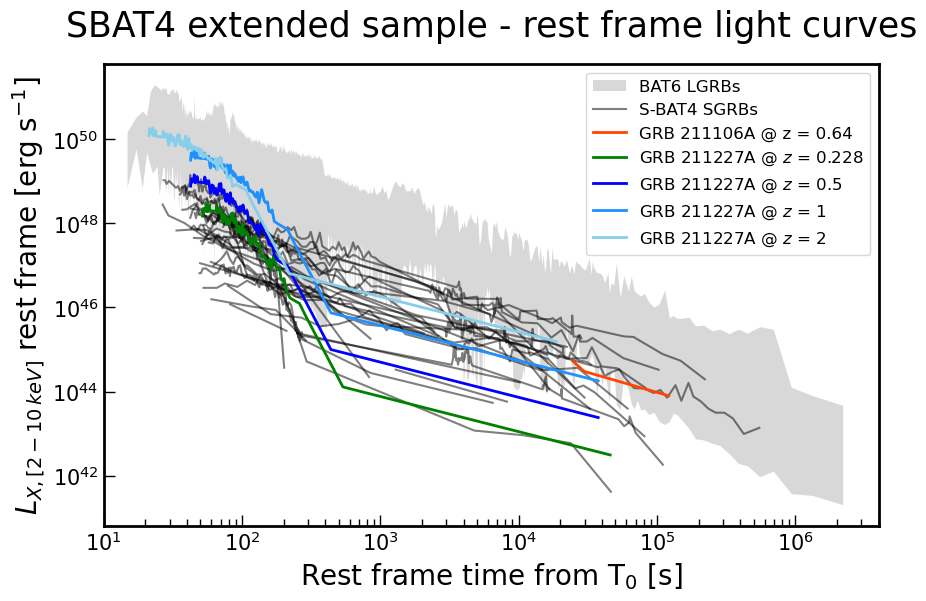
We show the curves we obtained for each GRB in Fig. 24, along with the one obtained for GRB 211106A. This is is consistent with the typical luminosity of the sample if at =0.64. This further confirms the estimate for the distance of the event obtained through the photometric redshift. Moreover, the rest frame X-ray light curve of GRB 211227A is consistent with the typical values of the other SGRBs, if at =0.228. However, if we put it at larger redshift (0.5, 1, 2), it is still consistent with the sample of short GRBs. Since the LGRBs fluxes are typically more luminous than SGRBs, this represents another test on the nature of the burst, from which we can safely classify GRB 211227A as a short GRBs with extended emission (and therefore originated by a compact binary merger progenitor), as also confirmed by its consistency with the short Amati relation in the previous section and from the galaxy features discussed in §6.2.
7 Conclusions
GRB 211106A and GRB 211227A are two events that belong to the short GRB class that, right after their discovery, were proposed as possibly associated to bright, low-redshift host galaxies. To further investigate the properties of these two events and of their host galaxies, we performed multi-epoch and multi-band analysis of ground-based optical and near-infrared observations obtained with the ESO-VLT FORS2, HAWK-I, MUSE, and X-Shooter instruments. At the same time, we carried out an analysis of the available Swift/XRT data for both bursts. We also carried out spectroscopic analysis of the GRB 211106A and GRB 211227A host galaxy candidates with the ESO-VLT MUSE and X-Shooter instruments, obtaining a redshift estimate of the former and studying in detail the properties of the latter. Finally, we investigated the kilonova detectability thresholds for both events and tested the GRBs properties by comparing them to those of a sample of short GRBs, namely the S-BAT4 sample (D’Avanzo et al., 2014), here extended up to December 2021.
From our analysis we obtained the following results:
-
•
We excluded an optical and a NIR counterpart for GRB 211106A, from FORS2 and HAWK-I observations at 3 confidence level, down to 26.7 mag at 2.9 d and 23.6 mag at 4.8 d, respectively;
-
•
By monitoring the GRB 211106A field over more than 3 weeks, at the position of the radio/mm afterglow we detected an optical source with constant magnitude mag from FORS2 observations. Its chance association probability with the burst is 0.13%, so we consider it as best-candidate host galaxy of GRB 211106A. We performed a SED fit, from which we derived a photometric redshift = 0.64;
-
•
We investigated the possible presence of a kilonova associated with GRB 211106A: we did not detect any source, as we would expect both in case of an AT2017gfo-like event and of a kilonova with different features. This is consistent with a host galaxy at = 0.64;
-
•
We explored the possible presence of a supernova event at = 0.64 associated with GRB 211106A: we found that, even in the case of significant extinction, SN1998bw-like and SN2006aj-like events should have been brighter than our limits, endorsing a compact binary merger progenitor scenario for the burst;
-
•
We ruled out the presence of optical and NIR emission from GRB 211227A from our FORS2 and X-Shooter images, placing 3 limits at 25.4 mag, 24.8 mag, 25.4 mag at 0.2 d, and 25.8 mag at at 1.2 d;
-
•
We performed a spectroscopic analysis of a galaxy 3.7′′ away from the GRB 211227A best X-rays position, for which we derived = 0.228 and 1.13%, making it the best candidate host galaxy. We investigated its properties in terms of metallicity, star forming rate, mass, and they all turned out to be consistent with typical values for short GRB hosts (Berger, 2014), and significantly different from long GRB ones (see §6.2);
-
•
An AT2017gfo-like kilonova should have been detected in our images, and our non-detection can be ascribed to a very faint emission. This may be produced either by a binary neutron star with low-mass dynamical ejecta or by a BH-NS binary with large mass inequality, low spin for the BH, and a stiff equation of state for the NS;
-
•
We were able to exclude a SN presence at = 0.228 associated with GRB 211227A thanks to the deep optical limits at 1.2 d, supporting the result of Lü et al. (2022);
-
•
For both GRB 211106A and GRB 211227A it was not possible to detect an optical counterpart despite deep limits. They both fulfill the condition for their classification as dark bursts. This results can be ascribed for the former to a large intrinsic absorption, while for the latter to a low-density circumburst medium;
-
•
Both GRB 211106A and GRB 211227A prompt-phase spectral properties, namely the peak energy and the isotropic-equivalent energy , are consistent with short GRBs belonging to the S-BAT4 extended sample. In particular, they are significantly outside the 3 region in the correlation found for long GRBs (Amati et al., 2002), while they are consistent at 1 c.l. with the short Amati relation (§6.6);
-
•
We placed all S-BAT4 SGRBs X-ray light curves in the common rest frame (2-10 keV) energy band, and the curves of the two GRBs are fully consistent with them, even if we consider a larger for GRB 211227A, significantly distinguishing it from LGRBs.
The conclusions we obtained from the analysis of GRB 211106A and GRB 211227A and their candidate host galaxies, taken altogether, confirm the classification of the two events as short GRBs, namely originated by a compact binary merger progenitor. In particular, GRB 211227A can be considered as a short GRB with extended emission, despite its T 2 s. Besides, the consistency of the prompt-phase spectral properties with the S-BAT4 sample and the X-ray rest frame light curves strengthens the association of the two bursts with the host galaxies at = 0.64 and = 0.228, respectively.
This work highlights the importance of performing deep and possibly rapid multiwavelength follow-up of single GRB events in order to avoid misleading host galaxy association and to constrain the GRB classification beyond the prompt emission duration.
On the other hand, the growing number of SGRBs detected will allow us to perform accurate sample studies, which can be used as tools to explore SGRBs properties in detail, as done in this work for GRB 211106A and GRB 211227A. Regarding this topic, a full discussion of the properties of the S-BAT4 sample will be presented in a forthcoming paper.
Acknowledgements.
Based on observations collected at the European Organisation for Astronomical Research in the Southern Hemisphere under ESO programmes 106.21T6.015, 106.21T6.016, 106.21T6.019. The authors thank B. Sbarufatti, O.S. Salafia and G. Tagliaferri for useful suggestions and discussion. This work made use of data supplied by the UK Swift Science Data Centre at the University of Leicester. PDA, MF, MGB, SC, TS, CS acknowledge funding from the Italian Space Agency, contract ASI/INAF n. I/004/11/4”. PDA acknowledge support from PRIN- MIUR 2017 (grant 20179ZF5KS). AJL and DBM are supported by the European Research Council (ERC) under the European Union’s Horizon 2020 research and innovation programme (grant agreement No. 725246). The Cosmic Dawn Center is supported by the Danish National Research Foundation.References
- Abbott et al. (2017) Abbott, B. P., Abbott, R., Abbott, T. D., et al. 2017, ApJ, 848, L12
- Acernese et al. (2014) Acernese, F., Agathos, M., Agatsuma, K., et al. 2014, Classical and Quantum Gravity, 32, 024001
- Ackley et al. (2020) Ackley, K., Amati, L., Barbieri, C., et al. 2020, A&A, 643, A113
- Amati et al. (2002) Amati, L., Frontera, F., Tavani, M., et al. 2002, A&A, 390, 81
- Anand et al. (2021) Anand, S., Coughlin, M. W., Kasliwal, M. M., et al. 2021, Nature Astronomy, 5, 46
- Arnaud (1996) Arnaud, K. A. 1996, in Astronomical Society of the Pacific Conference Series, Vol. 101, Astronomical Data Analysis Software and Systems V, ed. G. H. Jacoby & J. Barnes, 17
- Asplund et al. (2009) Asplund, M., Grevesse, N., Sauval, A. J., & Scott, P. 2009, ARA&A, 47, 481
- Asquini et al. (2019) Asquini, L., Campana, S., D’Avanzo, P., et al. 2019, A&A, 625, A6
- Baldwin et al. (1981) Baldwin, J. A., Phillips, M. M., & Terlevich, R. 1981, PASP, 93, 5
- Band et al. (1993) Band, D., Matteson, J., Ford, L., et al. 1993, ApJ, 413, 281
- Barthelmy et al. (2005a) Barthelmy, S. D., Barbier, L. M., Cummings, J. R., et al. 2005a, ssr, 120, 143
- Barthelmy et al. (2005b) Barthelmy, S. D., Chincarini, G., Burrows, D. N., et al. 2005b, Nature, 438, 994
- Beardmore et al. (2021) Beardmore, A. P., Barthelmy, S. D., Marshall, F. E., et al. 2021, GRB Coordinates Network, 31316, 1
- Becker (2015) Becker, A. 2015, HOTPANTS: High Order Transform of PSF ANd Template Subtraction
- Berger (2014) Berger, E. 2014, ARA&A, 52, 43
- Berger et al. (2005) Berger, E., Price, P. A., Cenko, S. B., et al. 2005, Nature, 438, 988
- Berger et al. (2021) Berger, E., Rouco Escorial, A., & Fong, W. 2021, GRB Coordinates Network, 31145, 1
- Bloom et al. (2002) Bloom, J. S., Kulkarni, S. R., & Djorgovski, S. G. 2002, AJ, 123, 1111
- Bulla (2019) Bulla, M. 2019, MNRAS, 489, 5037
- Burrows et al. (2005) Burrows, D. N., Hill, J. E., Nousek, J. A., et al. 2005, ssr, 120, 165
- Chabrier (2003) Chabrier, G. 2003, PASP, 115, 763
- Chambers et al. (2016) Chambers, K. C., Magnier, E. A., Metcalfe, N., et al. 2016, arXiv e-prints, arXiv:1612.05560
- Cherry et al. (2021) Cherry, M. L., Yoshida, A., Sakamoto, T., et al. 2021, GRB Coordinates Network, 31333, 1
- Choi et al. (2016) Choi, J., Dotter, A., Conroy, C., et al. 2016, ApJ, 823, 102
- Christensen et al. (2021) Christensen, L., Izzo, L., Schady, P., et al. 2021, GRB Coordinates Network, 31075, 1
- Ciotti & Bertin (1999) Ciotti, L. & Bertin, G. 1999, A&A, 352, 447
- Clocchiatti et al. (2011) Clocchiatti, A., Suntzeff, N. B., Covarrubias, R., & Candia, P. 2011, AJ, 141, 163
- Collaboration et al. (2015) Collaboration, T. L. S., Aasi, J., Abbott, B. P., et al. 2015, Classical and Quantum Gravity, 32, 074001
- Conroy & Gunn (2010) Conroy, C. & Gunn, J. E. 2010, ApJ, 712, 833
- Conroy et al. (2009) Conroy, C., Gunn, J. E., & White, M. 2009, ApJ, 699, 486
- Covino et al. (2006) Covino, S., Malesani, D., Israel, G. L., et al. 2006, A&A, 447, L5
- Currie et al. (2014) Currie, M. J., Berry, D. S., Jenness, T., et al. 2014, in Astronomical Society of the Pacific Conference Series, Vol. 485, Astronomical Data Analysis Software and Systems XXIII, ed. N. Manset & P. Forshay, 391
- D’Avanzo (2015) D’Avanzo, P. 2015, Journal of High Energy Astrophysics, 7, 73
- D’Avanzo et al. (2009) D’Avanzo, P., Malesani, D., Covino, S., et al. 2009, A&A, 498, 711
- D’Avanzo et al. (2014) D’Avanzo, P., Salvaterra, R., Bernardini, M. G., et al. 2014, MNRAS, 442, 2342
- DeLaunay & Tohuvavohu (2021) DeLaunay, J. & Tohuvavohu, A. 2021, arXiv e-prints, arXiv:2111.01769
- D’Elia et al. (2021a) D’Elia, V., D’Ai, A., Sbarufatti, B., et al. 2021a, GRB Coordinates Network, 31068, 1
- D’Elia et al. (2021b) D’Elia, V., D’Ai, A., Sbarufatti, B., et al. 2021b, GRB Coordinates Network, 31051, 1
- Dietrich et al. (2020) Dietrich, T., Coughlin, M. W., Pang, P. T. H., et al. 2020, Science, 370, 1450
- Draine & Li (2007) Draine, B. T. & Li, A. 2007, ApJ, 657, 810
- Eichler et al. (1989) Eichler, D., Livio, M., Piran, T., & Schramm, D. N. 1989, Nature, 340, 126
- Evans et al. (2009) Evans, P. A., Beardmore, A. P., Page, K. L., et al. 2009, MNRAS, 397, 1177
- Evans et al. (2007) Evans, P. A., Beardmore, A. P., Page, K. L., et al. 2007, A&A, 469, 379
- Ferrero et al. (2006) Ferrero, P., Kann, D. A., Zeh, A., et al. 2006, A&A, 457, 857
- Fletcher & Fermi-GBM Team (2021) Fletcher, C. & Fermi-GBM Team. 2021, GRB Coordinates Network, 31055, 1
- Fong et al. (2015) Fong, W., Berger, E., Margutti, R., & Zauderer, B. A. 2015, ApJ, 815, 102
- Fong et al. (2022) Fong, W.-f., Nugent, A. E., Dong, Y., et al. 2022, ApJ, 940, 56
- Foreman-Mackey et al. (2013) Foreman-Mackey, D., Hogg, D. W., Lang, D., & Goodman, J. 2013, PASP, 125, 306
- Fox et al. (2005) Fox, D. B., Frail, D. A., Price, P. A., et al. 2005, Nature, 437, 845
- Freudling et al. (2013) Freudling, W., Romaniello, M., Bramich, D. M., et al. 2013, A&A, 559, A96
- Galama et al. (1998) Galama, T. J., Vreeswijk, P. M., van Paradijs, J., et al. 1998, Nature, 395, 670
- Gehrels et al. (2008) Gehrels, N., Barthelmy, S. D., Burrows, D. N., et al. 2008, ApJ, 689, 1161
- Gehrels et al. (2006) Gehrels, N., Norris, J. P., Barthelmy, S. D., et al. 2006, Nature, 444, 1044
- Gehrels et al. (2005) Gehrels, N., Sarazin, C. L., O’Brien, P. T., et al. 2005, Nature, 437, 851
- Ghirlanda et al. (2019) Ghirlanda, G., Salafia, O. S., Paragi, Z., et al. 2019, Science, 363, 968
- Gobat et al. (2023) Gobat, C., van der Horst, A. J., & Fitzpatrick, D. 2023, MNRAS, 523, 775
- Goldstein et al. (2017) Goldstein, A., Veres, P., Burns, E., et al. 2017, ApJ, 848, L14
- Gompertz et al. (2013) Gompertz, B. P., O’Brien, P. T., Wynn, G. A., & Rowlinson, A. 2013, MNRAS, 431, 1745
- Gompertz et al. (2023) Gompertz, B. P., Ravasio, M. E., Nicholl, M., et al. 2023, Nature Astronomy, 7, 67
- Hallinan et al. (2017) Hallinan, G., Corsi, A., Mooley, K. P., et al. 2017, Science, 358, 1579
- Hjorth & Bloom (2012) Hjorth, J. & Bloom, J. S. 2012, in Chapter 9 in ”Gamma-Ray Bursts, 169–190
- Hjorth et al. (2005) Hjorth, J., Watson, D., Fynbo, J. P. U., et al. 2005, Nature, 437, 859
- Hudelot et al. (2012) Hudelot, P., Cuillandre, J. C., Withington, K., et al. 2012, VizieR Online Data Catalog, II/317
- Isobe et al. (1990) Isobe, T., Feigelson, E. D., Akritas, M. G., & Babu, G. J. 1990, ApJ, 364, 104
- Jakobsson et al. (2004) Jakobsson, P., Hjorth, J., Fynbo, J. P. U., et al. 2004, ApJ, 617, L21
- Japelj et al. (2016) Japelj, J., Vergani, S. D., Salvaterra, R., et al. 2016, A&A, 590, A129
- Johnson et al. (2021) Johnson, B. D., Leja, J., Conroy, C., & Speagle, J. S. 2021, ApJS, 254, 22
- Kann et al. (2021) Kann, D. A., de Ugarte Postigo, A., Thoene, C. C., et al. 2021, GRB Coordinates Network, 31341, 1
- Kennicutt (1998) Kennicutt, Robert C., J. 1998, ARA&A, 36, 189
- Kewley et al. (2013) Kewley, L. J., Dopita, M. A., Leitherer, C., et al. 2013, ApJ, 774, 100
- Kewley & Ellison (2008) Kewley, L. J. & Ellison, S. L. 2008, ApJ, 681, 1183
- Kilpatrick et al. (2021) Kilpatrick, C. D., Berger, E., & Fong, W. 2021, GRB Coordinates Network, 31146, 1
- Kouveliotou et al. (1993) Kouveliotou, C., Meegan, C. A., Fishman, G. J., et al. 1993, ApJ, 413, L101
- Laskar et al. (2022) Laskar, T., Rouco Escorial, A., Schroeder, G., et al. 2022, arXiv e-prints, arXiv:2205.03419
- Lazzati et al. (2001) Lazzati, D., Ramirez-Ruiz, E., & Ghisellini, G. 2001, A&A, 379, L39
- Leibler & Berger (2010) Leibler, C. N. & Berger, E. 2010, ApJ, 725, 1202
- Levan et al. (2023) Levan, A., Gompertz, B. P., Salafia, O. S., et al. 2023, arXiv e-prints, arXiv:2307.02098
- Levesque et al. (2010) Levesque, E. M., Kewley, L. J., Berger, E., & Zahid, H. J. 2010, AJ, 140, 1557
- Li & Paczyński (1998) Li, L.-X. & Paczyński, B. 1998, ApJ, 507, L59
- Lü et al. (2022) Lü, H.-J., Yuan, H.-Y., Yi, T.-F., et al. 2022, ApJ, 931, L23
- Malesani et al. (2021a) Malesani, D. B., D’Avanzo, P., Levan, A. J., Nicuesa Guelbenzu, A., & Stargate Consortium. 2021a, GRB Coordinates Network, 31070, 1
- Malesani et al. (2021b) Malesani, D. B., Izzo, L., Xu, D., et al. 2021b, GRB Coordinates Network, 31324, 1
- Mannucci et al. (2010) Mannucci, F., Cresci, G., Maiolino, R., Marconi, A., & Gnerucci, A. 2010, MNRAS, 408, 2115
- Mannucci et al. (2011) Mannucci, F., Salvaterra, R., & Campisi, M. A. 2011, MNRAS, 414, 1263
- Margutti & Chornock (2021) Margutti, R. & Chornock, R. 2021, ARA&A, 59, 155
- McKenzie & Schaefer (1999) McKenzie, E. H. & Schaefer, B. E. 1999, PASP, 111, 964
- McMahon et al. (2021) McMahon, R. G., Banerji, M., Gonzalez, E., et al. 2021, VizieR Online Data Catalog, II/367
- Melandri et al. (2014) Melandri, A., Covino, S., Rogantini, D., et al. 2014, A&A, 565, A72
- Melandri et al. (2012) Melandri, A., Sbarufatti, B., D’Avanzo, P., et al. 2012, MNRAS, 421, 1265
- Metzger (2019) Metzger, B. D. 2019, Living Reviews in Relativity, 23, 1
- Metzger et al. (2010) Metzger, B. D., Martínez-Pinedo, G., Darbha, S., et al. 2010, MNRAS, 406, 2650
- Mirabal et al. (2006) Mirabal, N., Halpern, J. P., An, D., Thorstensen, J. R., & Terndrup, D. M. 2006, ApJ, 643, L99
- Modigliani et al. (2010) Modigliani, A., Goldoni, P., Royer, F., et al. 2010, in Society of Photo-Optical Instrumentation Engineers (SPIE) Conference Series, Vol. 7737, Observatory Operations: Strategies, Processes, and Systems III, ed. D. R. Silva, A. B. Peck, & B. T. Soifer, 773728
- Modjaz et al. (2008) Modjaz, M., Kewley, L., Kirshner, R. P., et al. 2008, AJ, 135, 1136
- Monet et al. (2003) Monet, D. G., Levine, S. E., Canzian, B., et al. 2003, AJ, 125, 984
- Mooley et al. (2018) Mooley, K. P., Nakar, E., Hotokezaka, K., et al. 2018, Nature, 554, 207
- Nagao et al. (2006) Nagao, T., Maiolino, R., & Marconi, A. 2006, A&A, 459, 85
- Nakar (2007) Nakar, E. 2007, Phys. Rep, 442, 166
- Narayan et al. (1992) Narayan, R., Paczynski, B., & Piran, T. 1992, ApJ, 395, L83
- Nava et al. (2012) Nava, L., Salvaterra, R., Ghirlanda, G., et al. 2012, MNRAS, 421, 1256
- Norris & Bonnell (2006) Norris, J. P. & Bonnell, J. T. 2006, ApJ, 643, 266
- Norris et al. (2010) Norris, J. P., Gehrels, N., & Scargle, J. D. 2010, ApJ, 717, 411
- Nugent et al. (2022) Nugent, A. E., Fong, W.-F., Dong, Y., et al. 2022, ApJ, 940, 57
- O’Connor et al. (2022) O’Connor, B., Troja, E., & Gottlieb, A. 2022, GRB Coordinates Network, 31376, 1
- Osterbrock (1989) Osterbrock, D. E. 1989, S&T, 78, 491
- Palmerio et al. (2019) Palmerio, J. T., Vergani, S. D., Salvaterra, R., et al. 2019, A&A, 623, A26
- Patat et al. (2001) Patat, F., Cappellaro, E., Danziger, J., et al. 2001, ApJ, 555, 900
- Pei (1992) Pei, Y. C. 1992, ApJ, 395, 130
- Perley (2021) Perley, D. A. 2021, GRB Coordinates Network, 31323, 1
- Perley et al. (2009) Perley, D. A., Metzger, B. D., Granot, J., et al. 2009, ApJ, 696, 1871
- Pian et al. (2006) Pian, E., Mazzali, P. A., Masetti, N., et al. 2006, Nature, 442, 1011
- Planck Collaboration et al. (2016) Planck Collaboration, Ade, P. A. R., Aghanim, N., et al. 2016, A&A, 594, A13
- Rastinejad et al. (2022) Rastinejad, J. C., Gompertz, B. P., Levan, A. J., et al. 2022, Nature, 612, 223
- Ridnaia et al. (2021) Ridnaia, A., Frederiks, D., Golenetskii, S., et al. 2021, GRB Coordinates Network, 31054, 1
- Rodrigo & Solano (2020) Rodrigo, C. & Solano, E. 2020, in XIV.0 Scientific Meeting (virtual) of the Spanish Astronomical Society, 182
- Rodrigo et al. (2012) Rodrigo, C., Solano, E., & Bayo, A. 2012, SVO Filter Profile Service Version 1.0, IVOA Working Draft 15 October 2012
- Rossi et al. (2022) Rossi, A., Rothberg, B., Palazzi, E., et al. 2022, ApJ, 932, 1
- Rossi et al. (2020) Rossi, A., Stratta, G., Maiorano, E., et al. 2020, MNRAS, 493, 3379
- Rosswog (2005) Rosswog, S. 2005, ApJ, 634, 1202
- Rouco Escorial et al. (2021) Rouco Escorial, A., Fong, W., Kilpatrick, C. D., et al. 2021, GRB Coordinates Network, 31259, 1
- Salpeter (1955) Salpeter, E. E. 1955, ApJ, 121, 161
- Sánchez-Blázquez et al. (2006) Sánchez-Blázquez, P., Peletier, R. F., Jiménez-Vicente, J., et al. 2006, MNRAS, 371, 703
- Savaglio et al. (2009) Savaglio, S., Glazebrook, K., & Le Borgne, D. 2009, ApJ, 691, 182
- Schlegel et al. (1998) Schlegel, D. J., Finkbeiner, D. P., & Davis, M. 1998, ApJ, 500, 525
- Selsing et al. (2018) Selsing, J., Krühler, T., Malesani, D., et al. 2018, A&A, 616, A48
- Skrutskie et al. (2006) Skrutskie, M. F., Cutri, R. M., Stiening, R., et al. 2006, AJ, 131, 1163
- Sollerman et al. (2002) Sollerman, J., Holland, S. T., Challis, P., et al. 2002, A&A, 386, 944
- Sollerman et al. (2006) Sollerman, J., Jaunsen, A. O., Fynbo, J. P. U., et al. 2006, A&A, 454, 503
- Stanek et al. (2006) Stanek, K. Z., Gnedin, O. Y., Beacom, J. F., et al. 2006, Acta Astron., 56, 333
- Stetson (1987) Stetson, P. B. 1987, PASP, 99, 191
- Tanvir et al. (2013) Tanvir, N. R., Levan, A. J., Fruchter, A. S., et al. 2013, Nature, 500, 547
- Tohuvavohu et al. (2020) Tohuvavohu, A., Kennea, J. A., DeLaunay, J., et al. 2020, ApJ, 900, 35
- Tohuvavohu et al. (2021) Tohuvavohu, A., Raman, G., DeLaunay, J., & Kennea, J. A. 2021, GRB Coordinates Network, 31049, 1
- Tominaga et al. (2021) Tominaga, M., Kawakubo, Y., Serino, M., et al. 2021, GRB Coordinates Network, 31319, 1
- Troja et al. (2022) Troja, E., Fryer, C. L., O’Connor, B., et al. 2022, Nature, 612, 228
- Troja et al. (2017) Troja, E., Piro, L., van Eerten, H., et al. 2017, Nature, 551, 71
- Tsvetkova et al. (2022) Tsvetkova, A., Frederiks, D., Lysenko, A., et al. 2022, GRB Coordinates Network, 31544, 1
- van der Horst et al. (2009) van der Horst, A. J., Kouveliotou, C., Gehrels, N., et al. 2009, ApJ, 699, 1087
- Vergani et al. (2015) Vergani, S. D., Salvaterra, R., Japelj, J., et al. 2015, A&A, 581, A102
- Vernet et al. (2011) Vernet, J., Dekker, H., D’Odorico, S., et al. 2011, A&A, 536, A105
- Villasenor et al. (2005) Villasenor, J. S., Lamb, D. Q., Ricker, G. R., et al. 2005, Nature, 437, 855
- Wainwright et al. (2007) Wainwright, C., Berger, E., & Penprase, B. E. 2007, ApJ, 657, 367
- Willingale et al. (2013) Willingale, R., Starling, R. L. C., Beardmore, A. P., Tanvir, N. R., & O’Brien, P. T. 2013, MNRAS, 431, 394
- Winkler et al. (2003) Winkler, C., Courvoisier, T. J. L., Di Cocco, G., et al. 2003, A&A, 411, L1
- Yang et al. (2022) Yang, J., Ai, S., Zhang, B.-B., et al. 2022, Nature, 612, 232
- Zhu et al. (2022) Zhu, J.-P., Wang, X. I., Sun, H., et al. 2022, ApJ, 936, L10