Current Address: ]Department of Physics, Harvard University, Cambridge, Massachusetts 02138, USA
On the Onset of Coherent Phonon Motion in Peierls-Distorted Antimony by Attosecond Transient Absorption
Abstract
Attosecond extreme-ultraviolet (XUV) transient absorption spectroscopy measurements on the Peierls-distorted phase of the semimetal antimony (Sb) are presented. After excitation by an ultrashort, broad band near-infrared (NIR) pulse, the distortion is (partly) lifted causing the well-known coherent phonon motion of the lattice. While the overall observed dynamics generally follow a displacive excitation model, a delayed onset of the pump-induced carrier dynamics due to hot-carrier thermalization is observed, as well as a large spectral phase dependence in the coherent phonon oscillation. The observed spectral phase dependence in the coherent motion is attributed to significantly different carrier relaxation timescales for carrier energies above and near the Fermi level of the semimetal. A simple theoretical model is presented that considers the carrier relaxation timescales in the displacive phonon model to explain the observed dynamics. The results conclusively show that the overall displacive motion is not solely due to an abrupt displacement of carriers from their equilibrium configuration by the pump pulse and that carrier-relaxation effects need to be considered in the description of the phonon motion. The results furthermore show an effect of NIR field-driven shifts of band-energies, which is observed as a transient reshaping of the core-level absorption features.
I Introduction
The optical control over coherent phonon motion in solids offers intriguing ways to engineer lattice deformation and promises a number of technical applications ranging from phase-change memory and opto-acoustic devices to strain engineering and pyroelectric materials. While coherent phonons can be created directly out of coupling to the electromagnetic radiation, e.g. from THz frequency photons or Raman excitation by higher frequencies, an indirect mechanism termed “displacive excitation of coherent phonons” (DECP) is known to be prominent [1]. In this mechanism the photon-driven electronic excitation changes the energetic landscape of the solid, leading the lattice to rearrange to a new energetic optimum position. The effect is exemplary in Peierls-distorted materials: Peierls-distortion describes a one-dimensional lattice deformation at equilibrium, in which the atomic sites in the lattice are distorted from the equally-spaced pure-lattice energetic minimum, and the less symmetric configuration allows the electrons to occupy lower energy bands than in the more-symmetric lattice, achieving an overall energetically favorable configuration. If, however, these electrons are forced out of their equilibrium energy due to the optical excitation, the lattice is now free to lift the deformation and moves towards the higher symmetry phase.
In their original work on DECP, Zeiger et al. [1] describe a simple model of this motion and successfully explain the observed temporal behavior of the NIR reflectivity. In the derivation of the model equations, Zeiger et al. note that both the number of excited electrons and the change of electron temperature lend themselves as the basis for their model and they expect equal contributions for both, as both will depend on the intensity envelope of the pump pulse. Early follow up work, however, identified a deviation in the phase of the phonon motion that could not be explained by this displacive model [2].
Recent experiments using attosecond/femtosecond XUV transient absorption of metals [3] and semiconductors [4, 5, 6] following photo-excitation have shown that there can be significant observable differences in the time-dependent XUV absorption on the femtosecond timescale between the creation of excited carriers by an NIR pulse and the formation of a thermalized distribution through carrier-carrier and carrier-phonon scattering. In addition, there are clear signatures of coherent phonon motion through energetic shifts of the XUV transient absorption [7, 8]. This leads to the opportunity to explore whether the coherent phonon motion follows the carrier excitation directly, or if it is delayed through the formation of a Fermi-Dirac distributed (i.e. thermalized) electron population. In this work, we set out to explore the behavior of the coherent phonon signal following displacive excitation by an NIR pulse of a Peierls-distorted material using attosecond XUV transient absorption spectroscopy, specifically on the semimetal antimony (Sb). The method allows us to study the change of XUV absorbance features with a temporal resolution shorter than the period of the NIR field oscillation. Our results show that the response of the coherent phonon motion is indeed affected by the relaxation of optically-excited carriers into the thermalized, hot Fermi-Dirac distribution, both in the amplitude of the observed signal as well as in the phase of the phonon oscillation. This work is structured as follows: after a brief introduction of the sample and the methods, results on the static and transient XUV absorption of Sb in the fs to ps range are presented and discussed. Then, attosecond transient absorption spectra of the few-fs dynamic around photoexcitation are discussed. Finally, the phase of the coherent phonon oscillation is analysed and the effect of carrier-relaxation is discussed.
At room temperatures and pressures, Sb forms a rhombohedral A7 crystalline symmetry. The Peierls distortion leads to a displacement of neighboring hexagonal planes along the c lattice coordinate, with the so-called Peierls parameter at 298 K [9] (whereas would correspond to equidistant spacing of hexagonal planes and a cubic lattice symmetry). The distortion leads to an opening of a pseudo-gap at the Fermi energy () and the Sb semimetallicity, which exhibits a narrow density of states (DOS) around - characteristic for the group V semimetals [10]. Besides the original DECP study on Bi and Sb, the coherent phonon motion is well studied by transient reflectivity and absorption in the NIR to visible [1, 2, 11, 12, 13] and XUV spectral regions [14], as well as photoelectron spectroscopy [15] and time-resolved diffraction [16, 17, 18]. Recent theoretical studies using density-functional theory [19, 20, 21] (DFT) and molecular dynamics [22] (MD) simulations have successfully treated the excitation of the coherent phonon motion due to a change of the minimum coordinate of the potential energy surface as a function of electron temperature or number of excited electrons.
II Methods
For the experiments, a thin film of Sb is grown on a Si3N4 membrane window (30 nm thickness, Norcada NX5050X) using a home-built physical vapor deposition oven. In a vacuum chamber, Sb pellets (99.999% purity) are mounted on a tungsten coil that is heated to about 300 °C through resistive heating. Fresh Si3N4 substrates are exposed to the Sb vapor for 6 hours. A covered part of the edge of the substrate frame during exposure allows to measure the step height of the deposited film using a commercial atomic-force scanning-tip microscope, showing a film thickness of approximately 32 nm. Sb is reported to self-crystalize to a polycrystalline form of the rhombohedral A7 phase in thin films [23]. A Raman spectrum of the films excited by 633 nm radiation shows the expected prominent phonon peak of the A1g mode at 148 cm-1 and Eg mode at 110 cm-1.
To perform the XUV transient absorption experiments, a typical pump-probe setup is used, starting with mJ-level NIR pulses centered around 780 nm wavelength from a commercial Ti:Sapphire laser amplifier, post-compressed by self-phase modulation in a hollow-core fiber to below 4 fs pulse duration (FWHM) for both driving high harmonic generation (HHG) for the XUV probe and the pump pulses. A detailed description of the setup can be found in appendix A.
III Coherent Phonon Motion of Sb
III.1 Results
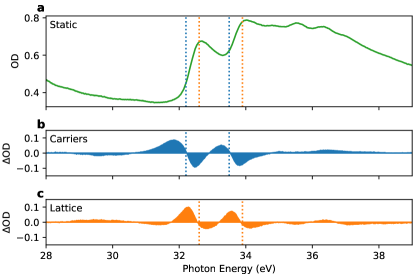
In Fig. 1, the static absorbance of Sb in the region between 28 eV and 40 eV is shown. Dominating are two peaks at 32.6 eV and 33.9 eV, corresponding to transitions of electrons from the 4d5/2 and 4d3/2 (semi-)core levels of Sb, respectively, to the energetically lowest high symmetry points in the conduction bands (CB). The absorption onset leads into a plateau region of absorption with additional peaks at 35 eV and 36 eV. The initial peak structure agrees well with previous experiments on the XUV absorption spectrum of Sb, which associate the higher energy peaks with transitions to higher bands at the Gamma point of Sb [24].
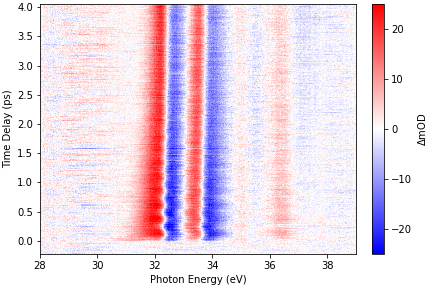
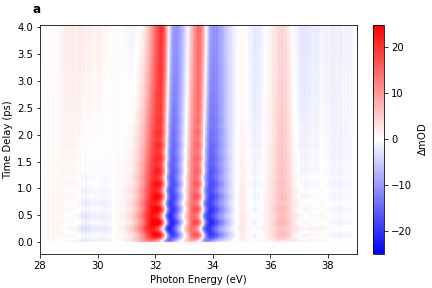
Next, the long-time-range transient absorption of Sb is taken. Spectra are recorded for time delays between –0.2 ps and 4.0 ps in 6.7 fs steps, with an estimated incident fluence of 4.4 mJ/cm2. A small residual signal is observed at delay times where the NIR pulse arrives long after the XUV pulse. From our previous knowledge of measurements on thin film samples, this is typically due to a laser-induced heating. This small contribution is subtracted equally from all spectra.
The resulting delay-dependent change in absorbance is shown in Fig. 2. At delay settings where the XUV probe precedes the NIR pump, no significant change in absorbance is visible. At the zero-time delay, a strong change in the signal is observed. An increase in absorbance occurs at energies below the onset of the 4d to CB absorbance of the static spectrum and a decrease in absorbance at energies above. The feature is repeated for both the spin-orbit split 4d5/2 and 4d3/2 orbitals. Furthermore, changes in absorbance are observed both within the energy range around accessible by the broad band NIR pump (e.g. roughly below 36 eV), and above. This shows that the observed dynamics are both due to a change in allowed core-level transitions following a pump-induced change in band-occupations (state opening/blocking) and overall changes in the electronic band structure. At early timescales the increased absorption features extend to lower energies compared to later timescales, indicating a rapid rearrangement of the carriers within the first hundreds of femtoseconds after excitation. Additionally, the induced changes slowly decay towards longer time delays. Most strikingly, as observed in other investigations [7, 8, 25, 26], the change in absorbance exhibits strong oscillatory features at positive delay times. These oscillations appear to modulate the observed changes in absorption, which quickly decay towards larger time delays, up to around 1.0 to 1.5 ps, i.e. faster than the overall decay of the pump-induced changes in absorption. These can be associated with the coherent phonon motion.
III.2 Component Analysis
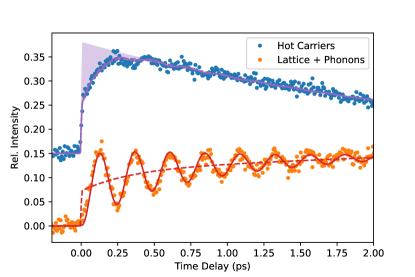
To allow further insight into the observed dynamics and to reduce the complexity of the observed signal, a component analysis approach via singular value decomposition (SVD) is chosen. A short introduction into the method is given in appendix B. The SVD yields “global” spectral and temporal components from the experimental data, i.e. without the need to further select certain temporal or spectral ranges. To perform the SVD in the basis of the static absorbance, the static absorbance is added back to the measured change in absorbance. The leading component, encoding the static absorbance, is then omitted from the following analysis. The resulting spectral components (Fig. 1b,c) and temporal components (Fig. 3) for the next two strongest components are resolved: Analyzing the change in absorbance of the spectral components, we note that the first component (Fig. 1b) shows a strong, asymmetric lineshape around the Fermi-energy of the core-level transitions (32.1 eV and 33.4 eV). This is consistent with a broadening of the Fermi-Dirac distribution due to an increase in carrier temperature. On the other hand, the second component (Fig. 1c) shows a similar asymmetric lineshape around the energy of the absorption peaks. This is consistent with an overall shift of the absorption spectrum due to movement of the lattice. We therefore associate the first component with the change in carrier temperature and the second component with the dynamic of the lattice motion. This is furthermore supported by their temporal dynamics: We observe a strong rise and subsequent exponential decay following zero-delay in the first component (blue dots in Fig. 3) and a strong, exponentially damped oscillatory modulation and a slow rise in the second component (orange dots). The fast rise and exponential decay of the first component is characteristic for an effect of a change in carrier temperature, while the oscillatory behavior and the slow rise of the second component can be associated with a change of lattice structure due to the phonon motion and the heating of the lattice. The carrier temperature signal appears to be modulated by the phonon oscillation, and the maxima in the carrier temperature coincide with minima in the lattice signal and vice-versa. A similar effect had been previously theoretically predicted [19] and was observed in the XUV transient reflectivity spectroscopy of bismuth [8], where the result was associated with a modulation of the signal due to the back-coupling interaction of the lattice shift by the coherent phonon motion on the specific heat of the carriers and therefore their temperature.
Notably, the signal associated with a change in carrier temperature does not immediately reach its maximum within the instrument response function (IRF), but appears delayed (see shaded area in Fig. 3).
To analyze the observed signals quantitatively, we model the system using a modified two temperature system with a classical treatment of the phonon motion, following the Ansatz of Giret et al. [19]. A detailed derivation of the model can be found in appendix D. The result of a non-linear least-squares fit of the model to the carrier temperature and lattice dynamic is shown in Fig. 3 (purple and red solid lines).
III.3 Interpretation of Fitted Model
Compared to previous results of the Sb coherent phonon mode, measured by transient reflectivity studies in the NIR spectrum (4.5 THz) [1], a smaller value of the A1g phonon frequency of 4.180.01 THz is obtained from the fitting for these particular thin film samples. Similarly, a longer lifetime for the carrier recombination (2.720.03 ps) and a much shorter lifetime of the coherent phonon motion (0.840.02 ps) is obtained, compared to reference data (1.67 ps and 2.90 ps, respectively) [1]. There are several possible explanations for these differences. First, as the observation of a residual heat signal shows, the very-thin samples are heated by the laser excitation to temperatures above room temperature. It was shown that higher temperatures lead to a softening of the phonon frequency, as well as a faster decay of the coherent phonon in Sb [12], as well as in Bi [27] and Ti2O3 [28]. However, in the case of Ti2O3 the increase in temperature was also associated with a fast recombination of carriers, which is opposite to the elongated lifetime of carriers observed here. Secondly, a similar effect on the softening and phonon lifetime has been observed to be dependent on the pump fluence for Sb [29], Bi [30] and Te [31]. Lastly, the (polycrystalline) thin films are known to influence the coherent phonon mode as well, due to their higher defect density compared to single crystals and also due to confinement within the films. However, the latter effects would lead to a shift in frequency for the A1g mode in the Raman spectrum as well, which was found to be close to literature reference values (4.4 THz here vs. 4.5 THz reported [1]). Extrapolating changes in the phonon decay rate in Sb that have been observed for temperatures below 300 K to higher temperatures below the melting point of Sb would not yield the observed results [12]. Comparison to measured fluence dependencies of the phonon frequency and decay rate by NIR single shot transient absorption spectroscopy on Sb thin films [29] yields good agreement with the values obtained here.
While a delayed build-up dynamic, as observed in the carrier-signal here, has been observed in reflectivity measurements in Bi and Sb before, it has been largely associated with a delayed response of the electronic system, but has found little discussion. Similar effects have been observed for XUV transient absorption spectroscopy in semiconductors [4, 5, 6], where they were related to relaxation of as-excited carriers via intra-valley carrier-carrier scattering or inter-valley carrier-phonon scattering. On the other hand, Giret et al. [19] have discussed effects of carrier diffusion along the layer thickness in X-ray diffraction experiments [16]. Extending the two-temperature model to include one-dimensional carrier diffusion to explain the delay, we are unable to find a sufficient diffusion effect on the carrier temperature, even when varying reported diffusivity values for Sb over orders of magnitudes.
We do find good agreement with the delayed rise of the carrier temperature due to a relaxation of as-excited carriers in the fit results, however it is necessary to include a scaling factor that limits the effect of the relaxation to achieve a good fit. Here we use the word relaxation to refer to the possibility of several processes, carrier-carrier scattering and carrier-phonon scattering, and these can be carrier-energy dependent. While relaxations via carrier-carrier scattering have reported lifetimes of a few femtoseconds, relaxation via carrier-phonon scattering has been reported to occur on tens to hundreds of femtoseconds, making it the likely dominating observed mechanism. The apparent effect of this scaling factor can be understood as part of the excited carrier population relaxing into the thermalized carrier distribution within the duration of the pump pulse, while other carriers relax on measurably longer timescales. This could indicate two dominating channels for carrier-relaxation (e.g. both carrier-carrier and carrier-phonon scattering), however, a strong variance of the density of states of Sb in the vicinity of readily explains this behavior: The larger density of states 0.5 eV above leads to a much faster carrier relaxation than in the narrow regions closer to it. Recent calculations by O’Mahony [29] show a long relaxation lifetime for carriers at or below , comparable to the result of the fit () and fast relaxation ( fs) for carrier energies eV above - well within reach of our broad band pump pulse.
The phase of the phonon oscillation from the fitting procedure (-0.08±0.01 rad) clearly differs from the pure DECP model, even if accounting for phase-effects of the damping (which we find to be rad) [1]. This indicates a delayed reaction of the phonon motion. Reported values on the A1g phase in the literature are varying, ranging from -0.020.02 rad [1] to -0.130.01 rad [2] and warrant a closer inspection below.
IV Early time-scale dynamics
To analyze the early timescale behavior of the dynamics more carefully, the transient scan is repeated for a short delay range, extending from –9.8 fs to 17.0 fs with delay steps of 0.2 fs (0.4 fs for the last 6.6 fs). During scans of the short delay range the pump-probe interferometer is actively stabilized, leading to a measured deviation of the time delay over the course of the measurement to less than 300 as (RMS).
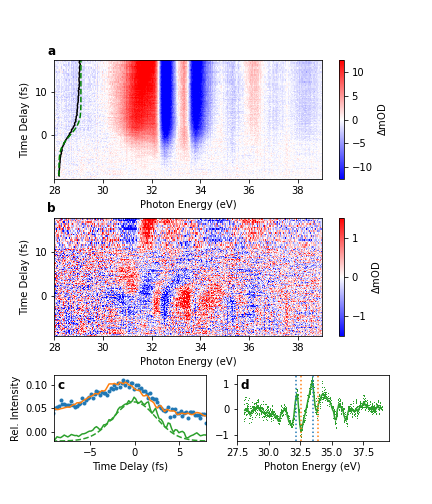
The delay-dependent change in absorbance for the short-time-range scan is shown in Fig. 4(a). As can be seen, a change in signal quickly appears around zero-delay. However, the signal does not appear to rise uniformly, but rather small, spectrally-dependent deviations from this rise are observed.
To further visualize this effect, a SVD is again performed. The strongest component is spectrally similar to the sum of both spectral components of the long-range scan and exhibits a temporal dynamic of a step-like function (see black line in Fig. 4a) broadened by the width of the Gaussian IRF (FWHM 5.6 fs, see appendix A). This leading spectral and temporal component is subtracted from the measured data and the residual signal is shown in Fig. 4b. The residual is dominated by the next two components of the SVD: The second strongest component shows a series of weak, spectrally dispersive features that can be observed around zero-delay in Fig. 4b, close to, but distinguishable from the noise limit, which is 0.6 mOD (standard deviation). These features extend further into negative time-delays (i.e. XUV first, NIR second) than expected from the IRF: The temporal component is shown in Fig. 4c (blue), together with the Gaussian IRF (dashed green). Since high-order dispersion of the broad band pulses can lead to small satellite structures, the NIR pulse intensity envelope is calculated from the step-like rise signal by taking the numerical first derivative and is shown in Fig. 4c (solid green).
The observed elongation of the transient signal towards negative delays is indicative of a pump-induced spectral shift during the coherent life-time of the core-hole excitation. Such re-shaping induced features are well known in gas-phase attosecond transient absorption spectroscopy [32, 33, 34], where they are associated with a dynamic Stark effect during the free induction decay of excited states, which leads to a change of lineshape in the absorption spectrum. They have also been observed in solids in core-excitonic insulators [35, 36] and semiconductors [37]. While field-driven dynamics have been observed by attosecond transient absorption and reflection spectroscopy in semiconductors that do not feature prominent core-excitonic states, they have typically been associated with field-driven population dynamics such as the Franz-Keldysh effect [38, 39, 40]. The spectral component of the transient reshaping is shown in Fig. 4d and can be associated with an energetic shift of the high-symmetry points of the CBs, while a smaller structure below indicates that such a shift also occurs in the valence bands (VBs). Since the duration of the transient reshaping is limited by the dipole lifetime [35], a convolution of an exponential decay with the obtained NIR pulse envelope allows to determine the lifetime of the Sb 4d core-excited dipole to be 2.50.1 fs, which is comparable to the reported 4d photoemission linewidth 0.62 eV [41] assuming the broadening depends on the lifetime fs.
Lastly, in the third strongest SVD component, spectral differences with respect to the rise-signal are observed in the region below the (32.1 eV). Relative to the rise-signal, the transient absorption is initially (shortly after zero-delay) stronger for transition energies lower in the VB (0.8 eV below ). At later positive time delays the situation is inverted and a stronger absorbance towards the top of the VB is observed. The observation is consistent with a strong optical excitation of holes in the high-density areas of the VB [42, 10] and a fast redistribution of these carriers towards the top of the VB and towards a thermalized distribution.
V Effect of carrier-relaxation

Having established a model expression for the temporal behavior in section III.2 allows us to controllably remove different parts of the dynamic from the measured data and study the residuals. To further study the effects of the phonon motion and carrier relaxation, the phonon motion is removed from the model by setting the oscillation amplitude to zero (see dashed lines in Fig. 3) and the thermalized temporal and spectral contributions to the measured signal are subtracted. The procedure is explained in more detail in Appendix B. This allows to isolate the non-thermalized dynamics, as is visible in the resulting residuals shown in Fig. 5. As can be seen, at the earliest timescales, a remaining dispersive spectral profile, as described in the previous section, quickly decays in the region below 32.1 eV, representing the non-thermalized, as-excited hole population quickly rearranging to a Fermi-Dirac distribution within the carrier relaxation timescale previously obtained from the model fit. Furthermore, the hole population seems to decay faster for energies further away from the , in accordance with the expected effect of the DOS. The analysis of the CB population signal is complicated by the overlapping contribution from the spin-orbit split core-level transitions.
V.1 Spectral Phase of Phonon Motion
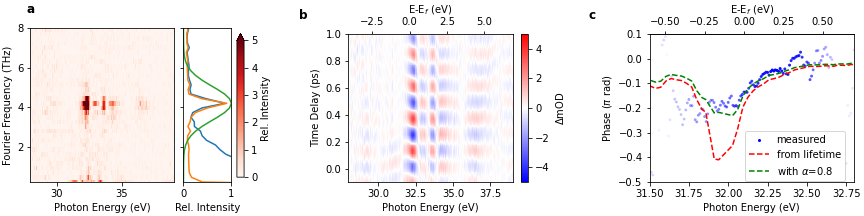
Having eliminated the slow decay signals and isolated the phonon oscillations, a Fourier analysis using a Takeda-algorithm is performed [43, 44]. The frequency dependent amplitude for each photon energy is calculated by a discrete Fourier transform and shown in Fig 6a. As can be seen, the phonon motion is sharply peaked around 4.2 THz, in agreement with the result of the fit.
To obtain the spectral phase of the oscillation, a Gaussian filter of 2 THz width (FWHM) is applied around the 4.2 THz peak (at positive frequencies only) and the inverse transformation into the time domain is calculated. The filtered oscillations are shown in Fig 6b and the phase is shown at zero-time delay in Fig 6c. As can be seen, the phase varies dramatically across the spectral domain and sharply shifts or is slanted across the bands.
V.2 Interpretation of spectral phase
The phase difference of the phonon oscillation from a pure cosine form () has been associated with a mixing of the DECP mechanism with an impulsive excitation [2]. In the case of Bi and Sb, O’Mahony et al. have calculated the interatomic force for different excited states [21]. For the A1g phonon mode they find an initially higher force caused by the carrier population after optical excitation at 1.55 eV compared to the force after thermalization. This transient force adds an impulsive component to the displacive motion, which imparts an additional phase on the A1g mode and a reduction of the oscillation amplitude. However, such additional forces would lead to a phase of opposite sign compared to the measured phase here. It was suggested that the transient interatomic force of the optically excited carrier population could also be lower than after relaxation, e.g. in the case of As or for different photon energies in the case of Bi and Sb [21].
In the following, the approach of O’Mahony et al. is adapted to study the effect of a time-dependent phonon force that arises due to the displacive force with the rate of carrier relaxation :
| (1) |
where is a scaling parameter controlling the influence of carrier-relaxation, such that corresponds to a scenario in which only the thermalized carriers contribute to the phonon motion, i.e. at t=0 there is no force acting on the phonon and the change in temperature of the carriers, , is the cause of the phonon motion. In contrast, corresponds to all carriers contributing equally, i.e. the number of excited carriers is driving the phonon motion and the constant displacive force is already established at the end of the optical excitation.
Inserting the time-dependent force in the phonon-coordinate equation of motion (cf. Eqn. (13)), the solution to the differential equation:
| (2) |
then describes a cosine-oscillating phonon motion with phase
| (3) |
and amplitude (For a derivation and the solution for see appendix C). In the case of the pure displacive model (), a cosine motion with no additional phase is expected.
The expected phase for , based on the calculated carrier relaxation rate obtained by O’Mahony et al. is shown in Fig 6c (red dashes) and agrees well with the observed phase, especially above . This indicates that indeed the change of carrier temperature and the thermalization of carriers is the driving force of the phonon motion. Below , the predicted phase diverges from the observation. This could hint at a (small) contribution from the non-thermalized carriers or an earlier decay of the carriers due to other mechanisms, e.g. carrier-carrier scattering or scattering due to defects in the thin film. We find reasonable agreement in this area for a value of (green dashes in Fig 6c). Further studies could uncover the relationship by investigating the influence of carrier-concentrations and equilibrium temperature. We note that the amplitude of the A1g mode is lowered by the effect of carrier relaxation, compared to the pure DECP solution. A comparison between the oscillation amplitude of the A1g mode and the Eg mode (which is not observed in our experimental configuration) could shine further light on the early-timescale forces, as previously suggested [21]
VI Conclusion
An XUV transient absorption spectroscopy measurement of the coherent phonon motion in antimony after displacive excitation has been shown. The results of the component analysis show the influence of the relaxation of the optically excited and thermally hot carriers on the carrier-dependent signal. The results show that the component analysis successfully separates highly transient optically excited carrier dynamics and thermalized carrier and phonon dynamics. This allows to reveal the spectrally dependent relaxation timescales of optically excited carriers and their effect on the phase of the coherent phonon motion from a core-level perspective. The obtained relaxation time as well as the spectral phase seem to agree well with theoretical predictions based on the relaxation of carriers. Our results show how XUV transient absorption spectroscopy is able to extract meaningful timescales of electronic and structural dynamics on vastly different scales, ranging from few femtoseconds to picoseconds, from core-hole coherence decay and initial scattering rates of carriers, to carrier cooling times, as well as phonon decay and carrier recombination. Regarding the DECP model, the spectral dependence of the phonon oscillation phase shows that the phonon motion is not purely displacive, but is dependent on the excited state lifetime to a large degree. In the language of Zeiger et al. [1], one can conclude that the DECP is driven mainly by the change in electron temperature and not the number of (as-)excited carriers . This shows that carrier-relaxation needs to be considered to obtain a full picture of dynamics in solids and a pure temperature-based description is not sufficient. Furthermore, the results reveal signatures of a field-driven band-reshaping, measured by a phase-change in the free induction decay of core-level transitions. To the best of our knowledge, the results present the first evidence of field-driven reshaping of XUV absorption in a non-excitonic material. This result is of interest, since the band-gap at the L-points of Sb and Bi are small and a field-driven closing or inversion of this gap could potentially drive a topological phase transition [45, 46, 47].
Acknowledgments
Investigations were supported by the U.S. Air Force Office of Scientific Research, Grants No. FA9550-19-1-0314 (primary) and No. FA9550-20-1-0334, and the W. M. Keck Foundation award No. 046300-002. LD acknowledges the European Union’s Horizon research and innovation programme under the Marie Skłodowska-Curie grant agreement No 101066334 — SR-XTRS-2DLayMat. YSP acknowledges the National Science Foundation Research Experiences for Undergraduates (REU) Grant No. 1852537.
Appendix A Experimental Setup
To perform XUV transient absorption experiments, NIR pulses centered around 780 nm wavelength from a commercial Ti:sapphire laser amplifier (Coherent Legend Elite USX operated at 1 kHz repetition rate, 22 fs pulse duration (FWHM) and 4 mJ pulse energy) are spectrally broadened by self-phase modulation in a gas-filled stretched hollow-core fiber (700 µm inner diameter, 2 m length) filled with a pressure-gradient of argon. The resulting spectrum spans over one octave. The pulses are compressed in time using a combination of double-angle dispersion compensating mirrors (Ultrafast Innovations PC70 and PC1332) and various dispersive elements (fused silica windows and wedge-pairs, as well as a 2 mm thin ADP plate to compensate the negative third order due to self-steepening), leading to pulses shorter than 4 fs in duration (FWHM) and 1.5 mJ pulse energy. A 20:80 beamsplitter is used to divide the pulse energy. The stronger transmitted pulse is focused by a spherical mirror (f=0.45 m) and steered through a thin fused-silica window inside a vacuum system. At the focal point a ceramic gas cell with pre-drilled beam openings is continuously flushed with krypton ( 23 Torr) to generate spectrally continuous XUV pulses through the process of high harmonic generation (HHG). The residual NIR radiation is removed from the XUV by a 200 nm thick Al filter and the focal point is reimaged by a grazing-incidence toroidal mirror in a 2f:2f configuration. At the second focal point, a motorized XY-stage carrying the sample materials, clean reference membranes and a gas cell is used to carry out the various aspects of the absorption experiments in-situ.
To perform pump-probe time-resolved measurements, the weaker reflected NIR pulses are attenuated by an iris and run parallel to the in-vacuum beam through air. They are focused by a spherical mirror (f=1.0 m) and steered through a window into the vacuum system, where they are colinearly recombined by a hole-mirror at 45∘. The hole in the center of the mirror allows the XUV probe radiation to pass through, while a part of the NIR excitation pump pulses is reflected from the metal-coated annular surface, leading to a colinear beam geometry. The pump intensity is limited with an iris aperture to 6 µJ, leading to an estimated incident fluence of 4.4 mJ/cm2 at the central ring of the annular NIR focus (170 m beam diameter), assuming an average reflectivity of 70% across the pump spectrum. After the interaction with the samples under normal incidence at the focal point, the NIR pump pulses are once more removed from the XUV pulse by an iris acting as a pin-hole and a second aluminum foil (150 nm thickness). The XUV pulses are then spectrally dispersed by a flat-field grating (Hitachi 001-0639) and imaged by a CCD camera (Princeton Scientific Pixis 400B) at the image plane.
To control the temporal delay between XUV and NIR pulses, a retroreflector is mounted atop two motorized stages in the pump arm, a long travel stepper-motor controlled stage and a short travel piezo-electric stage. While the stepper-motor controlled stage allows to scan picosecond ranges, the piezo-electric stage allows finer delay control on the sub-femtosecond scale. To avoid artifacts from variances in the XUV spectrum, static XUV spectra are rapidly taken sequentially for the sample and blank membranes. Similarly for pump-probe spectra, a mechanical shutter in the pump arm allows to rapidly take sequential spectra with and without the pump beam present. The spectra taken without the pump beam are used to calculate a noise correlation matrix from regions of the spectrum where no change of absorbance is observed, which is used to suppress correlated source noise in the observed transient spectra [48].
To avoid excessive build-up of heat in the thin Sb sample from the absorption of NIR pulses, a chopper is used to reduce the laser repetition rate to 250 Hz. To compensate for drifts due to atmospheric conditions as well as vibrations of the optical components, the pump-probe interferometer can be actively stabilized by a spectral-interference feedback system: By using a small diameter Al film mounted on a larger, annular fused silica plate, part of the 780 nm HHG driving field is allowed to propagate parallel to the XUV beam. This annular beam is too large to pass through the center of the hole-mirror and is reflected from the metal surface instead. There it intersects the part of the pump beam that was not reflected and passed through the mirror instead. The two focusing beams are overlapped in a spectrometer, leading to spectral interference and a delay-dependent fringe pattern. The spectral interference over a selected spectral range is read out by a computer and the relative fringe position is used to calculate the deviation of the measured delay from the set-point and used to correct the piezo stage in a proportional-integral controller loop. While the relative delay is used to stabilize the interferometer during the measurement, the absolute delay between the two pulses is calculated and saved as well and is available for post-processing. Note that the absolute delay measured in this manner does not directly correspond to the in-situ XUV-NIR delay, due to slight variations in optical path length. This is in fact deliberate to gain sufficient peak separation of the delay-dependent interference (AC peak) from the structure-rich spectrum of the fiber-broadened pulses (DC peak) in the numerical Fourier evaluation.
To calibrate the XUV-NIR zero delay, attosecond transient absorption spectra of AC Stark shifting of the Ne 3s4p autoionization resonance are recorded periodically during the delay-dependent scans. The light-induced phase signal of the autoionization line is analyzed through SVD and the zero-delay is obtained through a non-linear least-squares fitting of a Gaussian instrument response function (IRF) convoluted with the exponential decay of the autoionizing resonance [34].
Appendix B Reconstruction of thermal-mode through component analysis

The singular value decomposition applies a bi-linear vector decomposition to the matrix of measured data (spectrogram) , where the matrix elements represent the values sampled at time-delay and photon-energy , such that:
| (4) |
where is a vector containing the weights of all components, and the associated temporal and spectral vector for each component, respectively. Having established a model expression for the temporal behavior allows to reconstruct the spectrogram for the model by replacing the temporal vector by sampling the expression at the same delay-points and calculating the outer product with the associated spectral component and scalar weight:
| (5) |
As such, the resulting spectrogram from the non-linear fit of Eqn. (16) below is shown in Fig. 7a. Compared to the experimental results shown in Fig. 2, there is good agreement with the dominating dynamics. As described in the main text, the influence of the coherent phonon motion can now be removed from this model, to obtain the pure thermal model dynamic, by reducing the oscillation amplitudes to zero. The resulting spectrogram is shown in Fig. 7b. As can be seen the system quickly reaches its maximum after laser-excitation and then starts to equilibriate towards later time-delays. This spectrogram is subtracted from the experimental data to obtain the isolated phonon-dynamics shown in Fig. 5.
Appendix C Amplitude of Coherent Phonon Mode with Carrier-Relaxation
We will start with the general solution of the differential equation (cf. Eqn. (1,2)). Again, following the work by O’Mahony et al.[21], we solve at the initial conditions and , which gives us:
| (6a) | |||
| (6b) |
Taking the ratio between the two gives Eqn. (3). On the other hand, taking the sum of squares:
| (7) |
Then
| (8) |
where
| (9) |
We can reinsert the amplitude in Eqn. (2) and get:
| (10) |
This result is very similar to that reported in Ref. [21], i.e. it represents a lowering of the phonon amplitude due to the time-dependent force and is dependent on the scaling parameter . This implies that the results that were obtained in Ref. [21] assuming a decrease in force on the A1g-mode during carrier relaxation could be compatible with the assumed increase in force in this work.
Appendix D Two Temperature Model
| Term | Value |
|---|---|
| A | |
| B | |
| C | |
| D | |
| E | |
| z | |
| (ps-1) | |
| (ps-1) | |
| (ps-1) | |
| (rad THz) | |
| (rad ) |
We start with the density of as-excited carriers :
| (11) |
where is the pump-pulse intensity and describes the rate of carrier relaxation. The relaxation of as-excited carriers leads to a change of carrier temperature :
| (12) |
where is the carrier heat capacity, the electron-phonon coupling term with the lattice temperature . The last term accounts for the back-coupling effect due to the change of potential energy caused by the phonon motion per unit volume [19].
We describe the phonon-motion in the DECP model as:
| (13) |
where is the undampened phonon frequency and the dampening rate, such that , the displacement force and the specific mass of the phonon ( the atomic mass of Sb).
Lastly, this leads to the rate equation for the lattice temperature:
| (14) |
We will assume for now that the displacement force follows the pump pulse , such that
| (15) |
Assuming the heat capacities, and coupling/relaxation rates are constant over the change in temperature and carrier-energy, we can write an approximate general solution in closed form:
| (16a) |
| (16b) |
where is the effective electron cooling rate and the -operator denotes a convolution integral. To account for the instrument response, we assume the pump pulse follows a Gaussian distribution with width 6.5 fs (FWHM), as obtained from a measurement of the modification of Ne autoionizing lines as described in appendix A. Note that since the carrier relaxation rate wildly differs over the carrier-energy, we find it necessary to introduce the additional scaling parameter in the equation above, to differentiate between the fast and intermediate relaxation times that are within the pump-pulse duration and the observed slow relaxation (see discussion above).
A multi-dimensional least-squares fit is performed for both channels, where the values for the rates and oscillation frequency are minimized at the same time, while the amplitudes are left as free parameters. The best-fit prediction is shown as solid lines in Fig. 3 and the values together with a confidence interval estimated from the parameter covariance are shown in Table 1.
References
- Zeiger et al. [1992] H. J. Zeiger, J. Vidal, T. K. Cheng, E. P. Ippen, G. Dresselhaus, and M. S. Dresselhaus, Theory for displacive excitation of coherent phonons, Physical Review B 45, 768 (1992).
- Garrett et al. [1996] G. A. Garrett, T. F. Albrecht, J. F. Whitaker, and R. Merlin, Coherent THz Phonons Driven by Light Pulses and the Sb Problem: What is the Mechanism?, Physical Review Letters 77, 3661 (1996).
- Chang et al. [2021a] H.-T. Chang, A. Guggenmos, S. K. Cushing, Y. Cui, N. U. Din, S. R. Acharya, I. J. Porter, U. Kleineberg, V. Turkowski, T. S. Rahman, D. M. Neumark, and S. R. Leone, Electron thermalization and relaxation in laser-heated nickel by few-femtosecond core-level transient absorption spectroscopy, Physical Review B 103, 064305 (2021a).
- Zürch et al. [2017] M. Zürch, H.-T. Chang, L. J. Borja, P. M. Kraus, S. K. Cushing, A. Gandman, C. J. Kaplan, M. H. Oh, J. S. Prell, D. Prendergast, C. D. Pemmaraju, D. M. Neumark, and S. R. Leone, Direct and simultaneous observation of ultrafast electron and hole dynamics in germanium, Nature Communications 8, 15734 (2017).
- Cushing et al. [2018] S. K. Cushing, M. Zürch, P. M. Kraus, L. M. Carneiro, A. Lee, H.-T. Chang, C. J. Kaplan, and S. R. Leone, Hot phonon and carrier relaxation in Si(100) determined by transient extreme ultraviolet spectroscopy, Structural Dynamics 5, 054302 (2018).
- Attar et al. [2020] A. R. Attar, H.-T. Chang, A. Britz, X. Zhang, M.-F. Lin, A. Krishnamoorthy, T. Linker, D. Fritz, D. M. Neumark, R. K. Kalia, A. Nakano, P. Ajayan, P. Vashishta, U. Bergmann, and S. R. Leone, Simultaneous Observation of Carrier-Specific Redistribution and Coherent Lattice Dynamics in 2H-MoTe2 with Femtosecond Core-Level Spectroscopy, ACS Nano 14, 15829 (2020).
- Weisshaupt et al. [2017] J. Weisshaupt, A. Rouzée, M. Woerner, M. J. J. Vrakking, T. Elsaesser, E. L. Shirley, and A. Borgschulte, Ultrafast modulation of electronic structure by coherent phonon excitations, Physical Review B 95, 081101 (2017).
- Géneaux et al. [2021a] R. Géneaux, H.-T. Chang, A. M. Schwartzberg, and H. J. B. Marroux, Source noise suppression in attosecond transient absorption spectroscopy by edge-pixel referencing, Optics Express 29, 951 (2021a).
- Barrett et al. [1963] C. S. Barrett, P. Cucka, and K. Haefner, The crystal structure of antimony at 4.2, 78 and 298° K, Acta Crystallographica 16, 451 (1963).
- Gonze et al. [1990] X. Gonze, J.-P. Michenaud, and J.-P. Vigneron, First-principles study of As, Sb, and Bi electronic properties, Physical Review B 41, 11827 (1990).
- Ishioka et al. [2008] K. Ishioka, M. Kitajima, and O. V. Misochko, Coherent A1g and Eg phonons of antimony, Journal of Applied Physics 103, 123505 (2008).
- Hase et al. [2015] M. Hase, K. Ushida, and M. Kitajima, Anharmonic Decay of Coherent Optical Phonons in Antimony, Journal of the Physical Society of Japan 84, 024708 (2015).
- Teitelbaum et al. [2018a] S. W. Teitelbaum, T. Shin, J. W. Wolfson, Y.-H. Cheng, I. J. Porter, M. Kandyla, and K. A. Nelson, Real-Time Observation of a Coherent Lattice Transformation into a High-Symmetry Phase, Physical Review X 8, 031081 (2018a).
- Géneaux et al. [2021b] R. Géneaux, I. Timrov, C. J. Kaplan, A. D. Ross, P. M. Kraus, and S. R. Leone, Coherent energy exchange between carriers and phonons in Peierls-distorted bismuth unveiled by broadband XUV pulses, Physical Review Research 3, 033210 (2021b).
- Papalazarou et al. [2012] E. Papalazarou, J. Faure, J. Mauchain, M. Marsi, A. Taleb-Ibrahimi, I. Reshetnyak, A. van Roekeghem, I. Timrov, N. Vast, B. Arnaud, and L. Perfetti, Coherent Phonon Coupling to Individual Bloch States in Photoexcited Bismuth, Physical Review Letters 108, 256808 (2012).
- Fritz et al. [2007] D. M. Fritz, D. A. Reis, B. Adams, R. A. Akre, J. Arthur, C. Blome, P. H. Bucksbaum, A. L. Cavalieri, S. Engemann, S. Fahy, R. W. Falcone, P. H. Fuoss, K. J. Gaffney, M. J. George, J. Hajdu, M. P. Hertlein, P. B. Hillyard, M. Horn-von Hoegen, M. Kammler, J. Kaspar, R. Kienberger, P. Krejcik, S. H. Lee, A. M. Lindenberg, B. McFarland, D. Meyer, T. Montagne, E. D. Murray, A. J. Nelson, M. Nicoul, R. Pahl, J. Rudati, H. Schlarb, D. P. Siddons, K. Sokolowski-Tinten, Th. Tschentscher, D. von der Linde, and J. B. Hastings, Ultrafast Bond Softening in Bismuth: Mapping a Solid’s Interatomic Potential with X-rays, Science 315, 633 (2007).
- Waldecker et al. [2017] L. Waldecker, T. Vasileiadis, R. Bertoni, R. Ernstorfer, T. Zier, F. H. Valencia, M. E. Garcia, and E. S. Zijlstra, Coherent and incoherent structural dynamics in laser-excited antimony, Physical Review B 95, 054302 (2017).
- Teitelbaum et al. [2018b] S. W. Teitelbaum, T. Henighan, Y. Huang, H. Liu, M. P. Jiang, D. Zhu, M. Chollet, T. Sato, É. D. Murray, S. Fahy, S. O’Mahony, T. P. Bailey, C. Uher, M. Trigo, and D. A. Reis, Direct Measurement of Anharmonic Decay Channels of a Coherent Phonon, Physical Review Letters 121, 125901 (2018b).
- Giret et al. [2011] Y. Giret, A. Gellé, and B. Arnaud, Entropy Driven Atomic Motion in Laser-Excited Bismuth, Physical Review Letters 106, 155503 (2011).
- Murray and Fahy [2015] É. D. Murray and S. Fahy, First-Principles Calculation of Femtosecond Symmetry-Breaking Atomic Forces in Photoexcited Bismuth, Physical Review Letters 114, 055502 (2015).
- O’Mahony et al. [2019] S. M. O’Mahony, F. Murphy-Armando, É. D. Murray, J. D. Querales-Flores, I. Savić, and S. Fahy, Ultrafast Relaxation of Symmetry-Breaking Photo-Induced Atomic Forces, Physical Review Letters 123, 087401 (2019).
- Bauerhenne et al. [2017] B. Bauerhenne, E. S. Zijlstra, and M. E. Garcia, Molecular dynamics simulations of a femtosecond-laser-induced solid-to-solid transition in antimony, Applied Physics A 123, 608 (2017).
- Prins [1933] J. A. Prins, Diffraction of Electrons in Amorphous and in Crystalline Antimony, Nature 131, 760 (1933).
- Ejiri et al. [1978] A. Ejiri, F. Sugawara, and H. Onuki, XUV Absorption Spectra of Sb Metal and BiSb Alloys, Japanese Journal of Applied Physics 17, 204 (1978).
- Sidiropoulos et al. [2021] T. P. H. Sidiropoulos, N. Di Palo, D. E. Rivas, S. Severino, M. Reduzzi, B. Nandy, B. Bauerhenne, S. Krylow, T. Vasileiadis, T. Danz, P. Elliott, S. Sharma, K. Dewhurst, C. Ropers, Y. Joly, M. E. Garcia, M. Wolf, R. Ernstorfer, and J. Biegert, Probing the Energy Conversion Pathways between Light, Carriers, and Lattice in Real Time with Attosecond Core-Level Spectroscopy, Physical Review X 11, 041060 (2021).
- Kato et al. [2020] K. Kato, H. Mashiko, Y. Kunihashi, H. Omi, H. Gotoh, and K. Oguri, Highly sensitive transient reflection measurement in extreme ultraviolet region for tracking carrier and coherent phonon dynamics, Optics Express 28, 1595 (2020).
- Boschetto et al. [2008] D. Boschetto, E. G. Gamaly, A. V. Rode, B. Luther-Davies, D. Glijer, T. Garl, O. Albert, A. Rousse, and J. Etchepare, Small Atomic Displacements Recorded in Bismuth by the Optical Reflectivity of Femtosecond Laser-Pulse Excitations, Physical Review Letters 100, 027404 (2008).
- Zeiger et al. [1996] H. J. Zeiger, T. K. Cheng, E. P. Ippen, J. Vidal, G. Dresselhaus, and M. S. Dresselhaus, Femtosecond studies of the phase transition in Ti2O3, Physical Review B 54, 105 (1996).
- O’Mahony [2020] S. M. O’Mahony, Electronic Excitation and Atomic Forces in Optically Excited Group V Semimetals, Doctoral thesis, University College Cork (2020).
- DeCamp et al. [2001] M. F. DeCamp, D. A. Reis, P. H. Bucksbaum, and R. Merlin, Dynamics and coherent control of high-amplitude optical phonons in bismuth, Physical Review B 64, 092301 (2001).
- Hunsche et al. [1995] S. Hunsche, K. Wienecke, T. Dekorsy, and H. Kurz, Impulsive Softening of Coherent Phonons in Tellurium, Physical Review Letters 75, 1815 (1995).
- Ott et al. [2013] C. Ott, A. Kaldun, P. Raith, K. Meyer, M. Laux, J. Evers, C. H. Keitel, C. H. Greene, and T. Pfeifer, Lorentz Meets Fano in Spectral Line Shapes: A Universal Phase and Its Laser Control, Science 340, 716 (2013).
- Wu et al. [2016] M. Wu, S. Chen, S. Camp, K. J. Schafer, and M. B. Gaarde, Theory of strong-field attosecond transient absorption, Journal of Physics B: Atomic, Molecular and Optical Physics 49, 062003 (2016).
- Drescher et al. [2019] L. Drescher, G. Reitsma, T. Witting, S. Patchkovskii, J. Mikosch, and M. J. J. Vrakking, State-Resolved Probing of Attosecond Timescale Molecular Dipoles, The Journal of Physical Chemistry Letters 10, 265 (2019).
- Géneaux et al. [2020] R. Géneaux, C. J. Kaplan, L. Yue, A. D. Ross, J. E. Bækhøj, P. M. Kraus, H.-T. Chang, A. Guggenmos, M.-Y. Huang, M. Zürch, K. J. Schafer, D. M. Neumark, M. B. Gaarde, and S. R. Leone, Attosecond Time-Domain Measurement of Core-Level-Exciton Decay in Magnesium Oxide, Physical Review Letters 124, 207401 (2020).
- Lucchini et al. [2021] M. Lucchini, S. A. Sato, G. D. Lucarelli, B. Moio, G. Inzani, R. Borrego-Varillas, F. Frassetto, L. Poletto, H. Hübener, U. De Giovannini, A. Rubio, and M. Nisoli, Unravelling the intertwined atomic and bulk nature of localised excitons by attosecond spectroscopy, Nature Communications 12, 1021 (2021).
- Chang et al. [2021b] H.-T. Chang, A. Guggenmos, C. T. Chen, J. Oh, R. Géneaux, Y.-D. Chuang, A. M. Schwartzberg, S. Aloni, D. M. Neumark, and S. R. Leone, Coupled valence carrier and core-exciton dynamics in WS2 probed by few-femtosecond extreme ultraviolet transient absorption spectroscopy, Physical Review B 104, 064309 (2021b).
- Schultze et al. [2014] M. Schultze, K. Ramasesha, C. D. Pemmaraju, S. A. Sato, D. Whitmore, A. Gandman, J. S. Prell, L. J. Borja, D. Prendergast, K. Yabana, D. M. Neumark, and S. R. Leone, Attosecond band-gap dynamics in silicon, Science 346, 1348 (2014).
- Lucchini et al. [2016] M. Lucchini, S. A. Sato, A. Ludwig, J. Herrmann, M. Volkov, L. Kasmi, Y. Shinohara, K. Yabana, L. Gallmann, and U. Keller, Attosecond dynamical Franz-Keldysh effect in polycrystalline diamond, Science 353, 916 (2016).
- Schlaepfer et al. [2018] F. Schlaepfer, M. Lucchini, S. A. Sato, M. Volkov, L. Kasmi, N. Hartmann, A. Rubio, L. Gallmann, and U. Keller, Attosecond optical-field-enhanced carrier injection into the GaAs conduction band, Nature Physics 14, 560 (2018).
- Nolot et al. [2021] E. Nolot, C. Sabbione, W. Pessoa, L. Prazakova, and G. Navarro, Germanium, antimony, tellurium, their binary and ternary alloys and the impact of nitrogen: An X-ray photoelectron study, Applied Surface Science 536, 147703 (2021).
- Ley et al. [1973] L. Ley, R. A. Pollak, S. P. Kowalczyk, R. McFeely, and D. A. Shirley, Evidence for Covalent Bonding in Crystalline and Amorphous As, Sb, and Bi from Valence-Band Photoelectron Spectra, Physical Review B 8, 641 (1973).
- Takeda et al. [1982] M. Takeda, H. Ina, and S. Kobayashi, Fourier-transform method of fringe-pattern analysis for computer-based topography and interferometry, JOSA 72, 156 (1982).
- Drescher et al. [2022] L. Drescher, T. Witting, O. Kornilov, and M. J. J. Vrakking, Phase dependence of resonant and antiresonant two-photon excitations, Physical Review A 105, L011101 (2022).
- Jin et al. [2020] K.-H. Jin, H. W. Yeom, and F. Liu, Doping-induced topological phase transition in Bi: The role of quantum electronic stress, Physical Review B 101, 035111 (2020).
- Bao et al. [2021] C. Bao, P. Tang, D. Sun, and S. Zhou, Light-induced emergent phenomena in 2D materials and topological materials, Nature Reviews Physics , 1 (2021).
- de la Torre et al. [2021] A. de la Torre, D. M. Kennes, M. Claassen, S. Gerber, J. W. McIver, and M. A. Sentef, Colloquium: Nonthermal pathways to ultrafast control in quantum materials, Reviews of Modern Physics 93, 041002 (2021).
- Geneaux et al. [2019] R. Geneaux, Marroux Hugo J. B., Guggenmos Alexander, Neumark Daniel M., and Leone Stephen R., Transient absorption spectroscopy using high harmonic generation: A review of ultrafast X-ray dynamics in molecules and solids, Philosophical Transactions of the Royal Society A: Mathematical, Physical and Engineering Sciences 377, 20170463 (2019).