Chance or Chaos? Fractal geometry aimed to inspect the nature of Bitcoin
Abstract.
The aim of this paper is to analyse the Bitcoin in order to shed some light on its nature and behaviour. We select 9 cryptocurrencies that account for almost 75% of total market capitalisation and compare their evolution with that of a wide variety of traditional assets: commodities with spot and futures contracts, treasury bonds, stock indices, growth and value stocks. Fractal geometry will be applied to carry out a careful statistical analysis of the performance of the Bitcoin returns. As a main conclusion, we have detected a high degree of persistence in its prices, which decreases the efficiency but increases its predictability. Moreover, we observe that the underlying technology influences price dynamics, with fully decentralised cryptocurrencies being the only ones to exhibit self-similarity features at any time scale.
Key words and phrases:
Bitcoin, Cryptocurrencies, Fractal geometry, Hurst exponent, Long-term memory, Efficient market.2020 Mathematics Subject Classification:
62P20, 91B82, 91B84.1. Introduction
We face a context of great uncertainty regarding the regulation of Bitcoin (btc). Each country has its own view of its nature, which leads to a wide variety of legislative solutions ranging from prohibition to full incorporation into economies. However, given the seemingly unlimited opportunities of its underlying technology, global coordination is not only desirable, but necessary.
Indeed, the diversity of approaches creates a confusing landscape for financial institutions and investors seeking to trade btcs. Thus, while it is not surprising that this concern makes headlines in the financial press, it is striking the multitude of scientific papers with titles as: Is Bitcoin money? And what that means [20], Is Bitcoin a currency, a technology-based product, or something else? [54], or Is Bitcoin a better safe-haven investment than gold and commodities? [44].
Paradoxically, we encounter more questions than certainties; therefore, a deep understanding of the behaviour of btc and similar assets is still pending, in order for governments to have the knowledge and the right tools to converge towards a standardised regulation.
In this unsettled framework, the overall goal of this paper is to shed some light on the nature of btc in order to foresee if its prices move randomly or in a chaotic but predictable way, which would allow forecasting opportunities. More precisely, we address the question of how cryptocurrencies (cc hereafter) can be classified by means of techniques coming from fractal geometry, and how they are correlated with already established asset classes.
We tackle the following key issues:
-
(1)
Identify factors detecting differences in the dynamics of cc in the markets.
-
(2)
Understand if there are essential characteristics that make btc peculiar when compared with traditional commodities. The aim is to find out if it can act as diversifying element in portfolio management, or can be exploited as a modern alternative to save haven products.
-
(3)
Discern whether the inspection of historical data to predict present and future price evolution makes actual sense, or the moves are aleatory and independent, in which case one better applies probabilistic techniques ad hoc to the concrete distribution.
-
(4)
Clarify if return series follow a normal or Gaussian distribution, as most of the methods applied in statistical analysis and prediction models have this as underlying assumption in a direct or subtle way.
-
(5)
Judge if it is of any use to take data at various frequencies or subperiods to drive conclusions about prices of cc and other assets, or they present scale invariance that would enable the application of fractal techniques.
As highlights of our findings, for all cc with purely decentralized technologies (that is, that really get rid of intermediaries or audit control) we detect clear signs of chaoticity, which do not fit under any traditional Gaussian patterns. Furthermore, the computation of the fractal dimension under different time frames and scales certainly reveals that these cc present long memory and self similarity properties. Hence technical analysis of past data is well-founded but shifting the scale is helpless to get finer predictions.
We also confirm that these properties are shared neither by centralized cc nor by assets like gold, silver, crude, wheat, or treasury bonds, which are quite poorely correlated to btc that is in turn tightly interrelated to most actors of the cryptosphere. This disables any narrative or marketing strategy to declare btc or as the new gold and its often claimed diversifying power.
Our results upgrade the previous literature in several directions: we pioneer in disclosing that it is the underlying technology, instead of the capitalization, the crucial element influencing cc prices; we also open a new research line that challenges the widely accepted impermeability of the cc market to the macroeconomic environment. In fact, we detect a major paradigm shift (driven possibly by rising inflation and interest rates) in cc interrelations and feedback with external products by zooming in on the last trimester of 2022 and 2023 data.
About the techniques we apply to drive the above conclusions, despite they are quite classical going back to Mandelbrot original development of fractal geometry, we enhance them with a proper rigorous mathematical approach by including a priori tests to check that the assumptions of the method are fulfilled by our data, as well as a later inference test to validate our outcomes.
Even though it may seem an obviousness to check the hypotheses before using a procedure and confirm the statistical significance of the computations, as pointed out in [15], many papers in the financial literature ignore naively both steps. Likewise, regardless of the more sophisticated statistical tools in the recent literature (as dfa or mf-dfa), as highlighted in [40], most of them assume that the variables creating time series follow a normal distribution, even knowing that this is typically not the case.
To avoid this restriction, we have chosen the robust method [35, 5] to compute the fractal dimension, since it has minimal requirements, which we ensure that our data accomplish, boosted with suitable inference tests. We choose this instead of the modified statistic, as [48] evidenced that the latter produces strong bias towards accepting the null hypothesis of data independence.
On the other hand, there is no need of adding artificial complexity to the computations by using fancy multifractal techniques, as [8] guarantees that most capitalized cc display unifractal patterns, and our study starts with a careful selection of 9 cc representing almost 75% of the total volume.
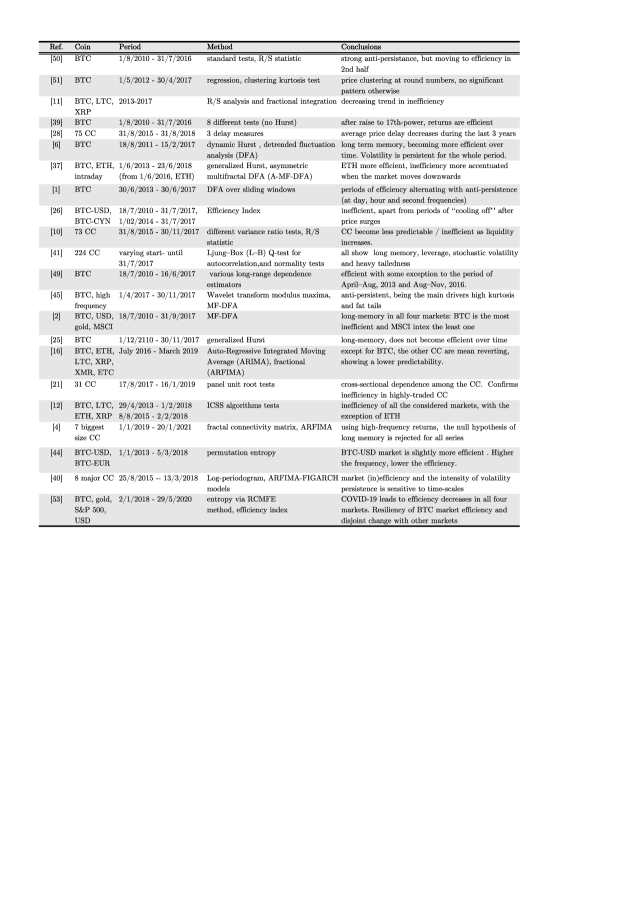
The paper is organized as follows: in section 2 we introduce the basic notions concerning cc consensus protocols, memory/efficiency character of time series, and fractality that will be used extensively throughout the paper; whereas section 3 includes a detailed survey of the literature to stress that the debate about the nature of btc is a vivid area of current research, which has not reached yet any consensus and deserves further attention. Later on, in section 4 we give descriptive statistics of our datasets explaining the sources and criteria of selection of the different assets. Then we explain the details of how we perfom the method (cf. section 5) and discuss thoroughly the outcomes and the corresponding implications in section 6. Finally, we include a summary of main conclusions (section 7) and, for completion, three appendices with additional tables about overview of the techniques used in the previous literature, calculations of the Hurst exponent, as well as full correlation matrices.
2. Background material: basic facts and definitions
2.1. Blockchain and its different consensus algorithms
The paradigm change brought by btc represents an evolution towards decentralised networks, allowing peer-to-peer interactions (with no need of intermediaries or central authorities that audit the operations) and the secure exchange not only of information but also of value. The technology that enables the latter is known as blockchain; roughly speaking, it uses cryptographic techniques to run a shared and secure digital register to record transactions, like a ledger.
Different consensus protocols/algorithms have been developed to validate and secure operations: Proof-of-Work (PoW), where different users (miners) compete to solve a mathematical problem that requires high computational cost; or Proof-of-Stake (PoS), which selects validators randomly, giving a higher probability to those who deposit a larger amount of cc as a guarantee.
We will not go into technical details of other variants, like Nominated PoS (NPoS), PoS Authority (PoSA), Delegated PoS (DPoS), and Ripple Protocol Consensus Algorithm (rpca). Let us just point out that some of them are controlled by very few nodes as in the traditional transaction systems.
In short, the consensus method provides each cc with distinct features in terms of energy efficiency, security and scalability; thus, we wonder the following:
Does the technology of cc influence their behaviour in the markets?
Accordingly, we will focus on the comparative study of cc with different consensus mechanisms (see Table 2). Up to our knowledge, it is the first time that the underlying technology is used in the literature as a distinctive characteristic.
2.2. Efficiency versus persistence and fractality
An essential yet unresolved matter is the predictability of cc behaviour, a notion that challenges the Efficient Market Hypothesis (emh), which is one the key cornerstones for modeling financial data [18]. A market is efficient if prices follow a random Brownian motion, reflecting all available information; thus a market is said efficient if past data cannot be exploited to predict future returns.
More precisely, 3 characteristics determine this motion: independence (i.e. prices have no memory and their dynamics are fully random), stationarity (the magnitude of changes does not vary with time) and normality, which implies that extreme events occur with very low probability. The latter cannot explain the sudden and sharp movements in financial markets. Illustratively, from 1916 to 2003 the Dow Jones index had 48 days with a swing bigger than 7%, but under the normal distribution this should occur 1 day every 300,000 years [34].
In short, the evidence from real data leads to look for alternatives to emh that allow to predict these abrupt changes, which also happen in waves and not isolated nor orderly, thus showing the chaotic fluctuation of prices. This is precisely what led B. Mandelbrot to use chaos theory as an inspiration to create fractal geometry in the 70s, which seeks to quantify complex patterns in nature.
Indeed, fractal objects work like chaotic systems where instantaneous shifts can have significant effects in the long term. Roughly speaking, two main features define a fractal: it has a fractional (non integer) dimension, and it is scale invariant or self-similar, i.e., presents copies of itself as it is zoomed in (like a snowflake). For a time series this means that its basic features are kept if we consider time subperiods or alter the data frequency of the sample.
When prices evolve inefficiently (then predictably), there are two types of memory: antipersistent or mean reverting if an increase is followed by a fall and conversely, drawing an oscillatory path around the mean; and persistent or long memory, that is, after a rise/drop comes another move with the same trend. In practice, the higher the persistence is, the more difficult it is for the values to return to their predetermined target in the event of a fall or exogenous shock.
3. Literature review
3.1. Under which label do we classify Bitcoin?
The right description of btc is a desirable goal to grasp its potential role in the market for risk management and portfolio diversification. While its design has similarities with gold (mining, decentralization, not government-backed, globally traded 24/7) and currencies (medium of exchange), if btc were a real unit of account or a store of value, it would not exhibit high volatility characterized by bubbles and crashes (cf. [13]).
In this spirit, it resembles more a highly speculative asset than a typical commodity or currency (see [19]), or at least belongs to a category in between the latter two (cf. [17]). Moreover, [9] shows that btc has its own risk-return features and is uncorrelated with traditional assets. Because of this, [27] concludes that it cannot play the role of a safe-haven from an econometric perspective.
In fact, its evolution does not respond to monetary policy news, but it reacts to events related to cc, having significant correlations with them [4, 52]. Analogously, [24] claims that the isolation of btc from the global financial system implies that it is not an actual source of economic instability.
However, the dependence between cc and other assets may change over time. Indeed, [56] checks that the gold-btc correlation reached a maximum during the peak of the covid-19, dropping to almost zero in July 2021. Because of this, it is not completely hopeless to include cc in a portfolio. Even more, [17] argues that btc is helpful for risk-averse investors in anticipation of negative shocks, as its reactions to market sentiment are quicker.
3.2. Efficient Market Hypothesis (EMH) in the “cryptosphere”
Despite the extensive analysis about emh’s applicability to the btc market (see [14] and Table 8 for a survey), there is no agreement on whether the periods of efficiency alternate either with mean reverting dynamics (as claimed in [1, 50]) or with long memory trends (stated by [6, 41]).
More precisely, [11] unveils a decreasing trend in the predictability, confirmed in [28] by checking a reduction in price reaction time to unexpected events. This is further supported in [51], as no pattern in returns can be discovered away from price clustering. But there is no common narrative to explain the varying efficiency over time: according to [26], inefficiency is higher during price rises; [43] found out that liquidity (volatility) has a significant positive (negative) effect on the efficiency, which can be enhanced by introducing btc futures [42].
On the contrary, there are sources claiming that btc moves similarly most of the time, but there is no agreement between those who advocate that the mainstream is efficiency [49, 38], long term memory [2, 21, 25], or anti-persistency [45], no matter the frequency or time frame considered.
Despite the almost exclusive restriction to btc, some authors compare it with other cc. In this spirit, [10] concludes that btc is the least predictable, which is reinforced by [8], with notable efficiency in lower volume quantiles and anti-persistance in higher ones. However, [16, 37] also find evidences of the reverse arguments, showing that less capitalized coins are more efficient than btc, while the latter presents long memory (see also [12]).
3.3. Unraveling complexity by means of fractal geometry
[3, 39] claim that the efficiency of cc varies across frequencies, being this heterogeneous memory behaviour against the self-similarity required for fractal objects. This view is shared by [43], which checked that higher the frequency, lower the pricing efficiency is. In the same spirit, [29, 37] conclude that the regime of persistence depends on the time scale and the period considered.
On the contrary, [7] reports similar memory patterns, no matter of the time frequencies, implying a self-similar process. This is confirmed in [30] via a big data-driven study joint with statistical testing, providing evidence of dominant fractal traits at all high frequency rates for btc prices.
Later on, [8] clearly reveals that one cannot apply a common model to address the whole cc landscape. Indeed, highly capitalized coins display roughly unifractal processes, and thus can be described via fractional Brownian motion; but cryptoassets with fewer liquidity exhibit strong multifractality, and more sophisticated models would be required for capturing their complex dynamics.
As pointed out in [46], multifractal features are not exclusive of cc, in fact, they are similar to that of stock markets, but differ from regular coins. Additionally, [47] checked that btc shows higher fractality than gold, which reopens the debate about its nature also from the outlook of fractal geometry.
4. Data and descriptive statistics
4.1. Types of assets: selection criteria and sources
We have worked with a dataset (obtained from Binance) containing the prices of btc and eight other cc (see Table 1) over the time period from 20/8/2020 to 24/2/2023, considering opening values every 15 minutes ( observations), 1 hour () and 1 day (). The aim is to contrast daily dynamics with intraday or high frequency movements in view of seeking for self-similarity features.
In order to compare with other assets traded on traditional financial markets, time series have been selected from Bloomberg with daily values of:
-
3 commodities with futures contracts (gold, crude oil and wheat),
-
one spot commodity (silver),
-
a 10-year US Treasury bond futures contract (FC),
-
2 stock market indices (Nasdaq and EuroStoxx),
-
3 growth stocks (Tesla, Netflix and Amazon), and 3 value stocks (The Coca-Cola Co., Procter & Gamble and Johnson & Johnson).
| Asset | Ticker | Market | Initial Release/Public Offering/Description |
|---|---|---|---|
| Bitcoin | BTC | Binance | 9 January 2009 |
| Ethereum | ETH | Binance | 30 July 2015 |
| Binance Coin | BNB | Binance | 3 July 2017 |
| Ripple | Binance | June 2012 | |
| Cardano | Binance | 27 September 2017 | |
| Polygon | MATIC | Binance | 2019 |
| Solana | SOL | Binance | 24 March 2020 |
| Tron | TRX | Binance | 25 July 2018 |
| Polkadot | DOT | Binance | 26 May 2020 |
| Amazon | AMZN | NASDAQ | 15 May 1997 |
| Tesla | TSLA | NASDAQ | 29 June 2010 |
| Netflix | NFLX | NASDAQ | 23 May 2002 |
| Procter & Gamble | PG | NYSE | 13 Jan 1978 |
| Johnson & Johnson | JNJ | NYSE | 24 Sept 1944 |
| The Coca-Cola Co. | KO | NYSE | Sept 1919 |
| Silver | XAGUSD | LBMA | spot price per ounce in US dollars |
| Gold | GCG23 | COMEX | 100 troy ounce FC due in Feb 2023 |
| Crude oil | CLK23 | NYMEX | West Texas Intermediate FC due May 2023 |
| Wheat | ZWK23 | NYMEX | FC expiring in May 2023 |
| US Treasury bonds | ZNM23 | 10-year FC due in June 2023 | |
| Nasdaq | CCMP | NASDAQ | launched in 1971 |
| EuroStoxx | SX5E | EUROSTOXX | 26 February 1998 |
We conjecture that growth stocks (i.e., those with a 5-year average sales growth over 15 %) will perform similar to cryptoassets having actually positive correlation; while it is expected that when cc go up, value stocks (that is, the ones with price-to-sales ratio ) will go down.
On the other hand, to assess whether cc perform as a safe haven asset, commodities have been chosen, as well as low volatility assets as treasury bonds. Moreover, to compare the cryptoeconomy to the traditional financial market we include stock indices, which act as a thermometer of market movements.
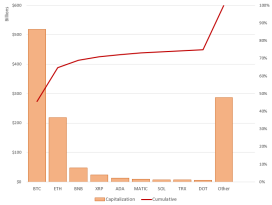
Regarding the selection of cc, we applied the Pareto principle to their capitalisation, according to which 80% of the results are due to 20% of the variables involved. Although the 9 selected cc “only” accumulate approximately 74% of the total market capitalisation (see Table 2), we have ruled out cc with volume percentages below 0.5%, which we consider to be unrepresentative. Let us stress that we have chosen archetypes of five different consensus protocols to enable our aim of comparing cc on the basis of their underlying technology.
| Ticker | Protocol | Capitalization (million $) | Percentage | Cumulative |
|---|---|---|---|---|
| BTC | PoW | 517,890 | 45.51% | 45.51% |
| ETH | PoS | 218,230 | 19.18% | 64.69% |
| BNB | PoSA | 48,060 | 4.22% | 68.91% |
| XRP | RPCA | 23,590 | 2.07% | 70.98% |
| ADA | PoS | 12,760 | 1.12% | 72.10% |
| MATIC | PoS | 10,080 | 0.89% | 72.99% |
| SOL | PoS | 7,690 | 0.68% | 73.66% |
| TRX | DPoS | 6,960 | 0.61% | 74.28% |
| DOT | Nominated PoS | 6,300 | 0.55% | 74.83% |
As can be seen in Figure 1, btc and eth account for almost 65 % of the total volume, while the 9 chosen cc together have a total capitalisation of more than $851 billion, which will give us a global view of the market, accounting for almost 75% of the total capitalisation estimated at $1,138 trillion, according to Investing (\urlwww.investing.com) as of 24 May 2023.
4.2. Descriptive statistical analysis of data
Let us first point out that daily opening values have been taken. In addition, unless otherwise specified, to facilitate the direct comparison, only weekday values are included, even though cc are still trading at weekends.
To analyse the normality of the time series, one typically converts them from price series to return series . In our case, we have calculated a total of 608 returns for each series on a logarithmic scale, i.e. we work with the sample , where
| (4.1) |
Table 3 reports the descriptive statistics for the full sample period from 2/8/2020 to 24/2/2023, and leads us to the following preliminary conclusions:
-
cc have a much higher volatility than other assets; in particular, btc’s volatility (3.85) is much higher than gold’s (0.92). As a result, this is a first indication that btc does not behave as a safe haven asset.
-
For a normal distribution, the kurtosis is around 3 and the skewness is near zero. The values of the latter do not seem conclusive, as most of them are close to zero; however, the kurtosis seems to point that neither cc nor traditional stock market players follow a normal pattern.
-
The normality test (Jarque Bera) brings strongly significant evidence that none of the series under study follows Gaussian moves, which confirms Mandelbrot’s criticism [34] to classical economic theories arguing that the normality assumption does not properly capture price evolution.
| Asset | Mean | Median | Std. | Max. | Min. | Skew. | Kurt. | J. Bera |
|---|---|---|---|---|---|---|---|---|
| BTC | 0.0401 | -0.0190 | 3.8451 | 17.8448 | -16.7093 | -0.2419 | 5.9025 | 376.16∗∗∗ |
| ETH | 0.1428 | 0.2390 | 5.1954 | 23.3707 | -32.4864 | -0.4250 | 7.5343 | 288.07∗∗∗ |
| BNB | 0.2217 | 0.1630 | 5.6390 | 29.5648 | -41.6751 | -0.2158 | 11.5924 | 7311.6∗∗∗ |
| XRP | -0.1597 | 0.1424 | 6.6802 | 36.6201 | -53.8523 | -0.6736 | 15.8684 | 3289.8∗∗∗ |
| ADA | -0.0909 | -0.1909 | 5.9398 | 28.7239 | -31.1317 | 0.1538 | 6.5777 | 435.14∗∗∗ |
| matic | 0.4301 | -0.0706 | 8.1566 | 48.7557 | -41.0080 | 1.0209 | 9.6473 | 1639.1∗∗∗ |
| SOL | 0.0081 | -0.2235 | 7.9623 | 38.0494 | -54.9008 | -0.5784 | 9.8461 | 665.94∗∗∗ |
| TRX | 0.0556 | 0.1906 | 5.5029 | 34.3355 | -38.8245 | -0.2373 | 11.5803 | 1096.2∗∗∗ |
| DOT | -0.0957 | -0.2126 | 6.5311 | 28.0615 | -48.3208 | -0.3569 | 10.0600 | 271.22∗∗∗ |
| AMZN | -0.1167 | 0.0016 | 2.5189 | 10.4044 | -15.1499 | -0.3680 | 6.4681 | 296.59∗∗∗ |
| TSLA | 0.0707 | 0.1384 | 4.3051 | 14.4446 | -17.0308 | -0.1375 | 4.3593 | 47.421∗∗∗ |
| NFLX | -0.1004 | -0.0627 | 3.0387 | 12.0963 | -30.6729 | -2.4777 | 28.1416 | 15228∗∗∗ |
| PG | 0.0034 | 0.0768 | 1.1469 | 3.6368 | -7.5586 | -0.8748 | 7.1694 | 498.61∗∗∗ |
| JNJ | -0.0043 | 0.0270 | 1.0430 | 5.5584 | -3.7804 | 0.1567 | 4.6431 | 66.278∗∗∗ |
| KO | 0.0419 | 0.0869 | 1.1405 | 5.5815 | -7.0610 | -0.2622 | 6.9038 | 333.44∗∗∗ |
| Silver | -0.0544 | -0.0637 | 1.8350 | 7.9983 | -8.5103 | -0.1167 | 5.6815 | 154.02∗∗∗ |
| Gold | -0.0143 | 0.0429 | 0.9210 | 2.8140 | -4.8252 | -0.5177 | 4.9956 | 134.18∗∗∗ |
| Crude | 0.0892 | 0.2208 | 2.5703 | 11.6753 | -12.3624 | -0.1827 | 5.1919 | 181.26∗∗∗ |
| Wheat | 0.0630 | -0.1375 | 2.2508 | 17.5554 | -9.6304 | 0.8261 | 9.6193 | 1179.1∗∗∗ |
| Bonds | -0.0303 | -0.0036 | 0.4281 | 1.7628 | -1.4895 | 0.0768 | 4.3337 | 46.587∗∗∗ |
| Nasdaq | -0.0005 | 0.1616 | 1.6119 | 6.8863 | -7.0825 | -0.3765 | 4.4745 | 22.102∗∗∗ |
| EuroSt. | 0.0310 | 0.1008 | 1.0992 | 5.6815 | -5.3614 | -0.2227 | 5.9040 | 276.7∗∗∗ |
Additionally, we split our sample into two subperiods (see Table 4) in order to test whether the efficiency has varied over time. A first inspection shows that descriptive statistics are quite stable for btc, while other assets present sign shifts in mean (trx, nflx) or kurtosis (silver). This provides a first hint that self-similarity features may not be shared for all items under review. Let us also point out that the significativity level for the normality test raises to 5% during the second subperiod for wheat, oil, gold, silver, Nasdaq, US bonds, tsla and jnj, which may foresee a change in performance.
| Sample period | N | Mean | SD | Skew. | Kurt. |
|---|---|---|---|---|---|
| BTC | |||||
| 20/8/2020 – 01/7/2022 | 681 | 0.0395 | 4.1134 | -0.1986 | 5.2739 |
| 01/7/2022 – 24/2/2023 | 239 | 0.0358 | 2.9172 | -0.5396 | 8.9691 |
| TRX | |||||
| 20/8/2020 – 01/7/2022 | 681 | 0.1229 | 6.2265 | -0.2374 | 9.4431 |
| 01/7/2022 – 24/2/2023 | 239 | -0.1431 | -0.6032 | -0.5396 | 5.9418 |
| NFLX | |||||
| 20/8/2020 – 01/7/2022 | 470 | -0.2597 | 3.0527 | -3.4819 | 34.9563 |
| 01/7/2022 – 24/2/2023 | 164 | 0.36498 | 2.9482 | 0.7096 | 3.9657 |
| Silver | |||||
| 20/8/2020 – 01/7/2022 | 485 | -0.0710 | 1.7950 | -0.4791 | 6.0914 |
| 01/7/2022 – 24/2/2023 | 169 | -0.0199 | 0.7124 | 0.7096 | 4.5917 |
Finally, let us mention that we do not display descriptive statistics for intraday frequencies of cc for brevity, since there are not remarkable differences with Table 3, apart from the higher number of observations.
5. Methodology: R/S analysis enhanced by a test of significance
A fractal is defined by scale invariance and chaotic nature, whose complexity is measured by the fractal dimension . As the graphs of returns are bumpy/peaky curves in the plane, should be between 1 (dim. of a smooth curve) and 2 (dim. of the plane); then, we can write , with .
For time series one typically computes the value of , known as Hurst exponent, which was introduced to study the Nile overflows [22, 23]. Economists use to assess the efficiency of the market, so that it is considered efficient if , and inefficient otherwise (see more details in Table 5).
| Motion | random Brownian | fractional Brownian | fractional Brownian |
|---|---|---|---|
| Persistence | none (independent) | anti-persistent (mean-reverting) | persistent |
| Memory/Correlation | none | short term | long term |
| Efficiency | efficient | inefficient | inefficient |
Hereafter we explain the rescaled range () method (cf. [32, 33, 35]) to get without imposing independence nor normality of the returns (as other more methods widely used in the literature do). The only restriction is to work with stationary series, but we will check that this is the case (see subsection 6.1).
One of the additional advantages of the analysis is that it is robust in the sense that can detect non-periodic cycles even if they are longer than the sample period, as well as long-term correlations. For instance, [36] applied it to conclude that many natural phenomena are not independent random processes.
We have divided the calculation procedure into the steps described below:
-
(1)
Take a series of returns , computed as in (4.1).
-
(2)
Split the full series into sub-series of length :
-
1st sub-series: ,
-
2nd sub-series: , and so on up to the
-
sub-series: .
In short, we consider a pack with all sub-series. This step is done with for different values of .
-
-
(3)
For each sub-series , compute the mean and the standard deviation (which will be functions of ).
-
(4)
Determine the series of distances to the mean by means of
and create the cumulative time series for each sub-series :
-
(5)
Find the range of each cumulative subset, for all :
Then divide this by the corresponding standard deviation , that is, compute . Thus, one gets a dimensionless measure that depends on and allows comparing the relative variability of sets of different sizes.
-
(6)
Obtain the rescaled range statistic by averaging for all sub-series:
Note that the different partition sizes () from (2) lead to the set of values:
-
(7)
Computation of . By analogy to Hurst’s ideas, assume that the variability of the data follows a potential law of the form:
now take logarithms on both sides to reach the linear relation
We can plot for , and get the corresponding regression line (see Figure 2), whose slope is the desired .
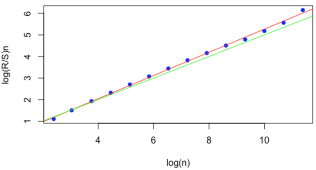
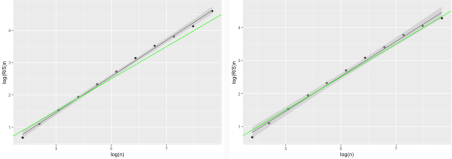
Many papers in the literature stop here, which is a naive approach as pointed out in [15], since one needs an extra statistical test to judge if computed for the sample is significatively different from the value 0.5 characterizing an independent process. This is why we have developed our own R script to top up the method by adding a -test for the slope of the line (see Figure 3).
6. Results and discussion
6.1. Test for stationarity as prerequisite for R/S analysis
Despite this step is often skipped, to be rigorous, one needs to check that the assumptions of a method are fulfilled before applying it, in this case, that all time series are stationary. For the cc the corresponding test ensures at more than 99% confidence that this is the case (see Table 6) at any scale in the full interval (these results are not altered for the subperiods).
| 15 min (lag order = 44) | 1 h (lag = 28) | daily (lag = 9) | |
|---|---|---|---|
| ADA | -44.340∗∗ | -29.644∗∗ | -8.2618∗∗ |
| BNB | -42.009∗∗ | -29.384∗∗ | -7.5603∗∗ |
| BTC | -43.426∗∗ | -28.566∗∗ | -8.7709∗∗ |
| DOT | -43.915∗∗ | -29.196∗∗ | -9.8369∗∗ |
| ETH | -43.757∗∗ | -28.549∗∗ | -9.1639∗∗ |
| MATIC | -43.159∗∗ | -29.456∗∗ | -9.3751∗∗ |
| SOL | -44.326∗∗ | -29.367∗∗ | -8.3510∗∗ |
| TRX | -43.360∗∗ | -30.270∗∗ | -9.0032∗∗ |
| XRP | -43.736∗∗ | -27.587∗∗ | -8.9680∗∗ |
Concerning the remaining assets, stationarity is guaranteed at the same level of significance for daily data in all the three periods under study, as can be checked in Table 7.
| full period (lag order = 8) | 1st subset (lag = 7) | 2nd subset (lag = 5) | |
|---|---|---|---|
| Gold | -8.7680∗∗ | -8.7733∗∗ | -5.2928∗∗ |
| Silver | -8.8266∗∗ | -8.1462∗∗ | -5.6915∗∗ |
| Nasdaq | -8.0335∗∗ | -8.5723∗∗ | -5.1938∗∗ |
| Eurotock | -7.8613∗∗ | -8.1981∗∗ | -5.1350∗∗ |
| Oil | -10.0500∗∗ | -9.6601∗∗ | -6.7996∗∗ |
| US bonds | -8.1775∗∗ | -7.6914∗∗ | -4.9403∗∗ |
| Wheat | -6.8168∗∗ | -5.5172∗∗ | -4.8443∗∗ |
| AMZN | -8.1451∗∗ | -8.2698∗∗ | -5.1547∗∗ |
| NFLX | -7.8880∗∗ | -7.6475∗∗ | -5.2018∗∗ |
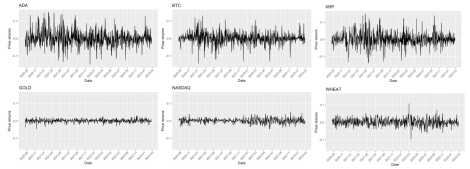
Let us stress that, regardless the stationary character of all the return series, a quick visual inspection (see Figure 4) already gives us an early warning about the different complexity level in the graphs of cc versus traditional assets (even through the curves for cc are drawn with average daily values to smooth out irregularities). The tool to quantify this and grasp finer disparities within cc, which are not displayed at first sight by the graphs, is the fractal dimension or, equivalently, the Hurst exponent that we compute in the sequel.
6.2. Memory and efficiency in cryptocurrencies and traditional assets
We start by analysing the Hurst index (see Table 8) of the time series for the full temporal frame with daily opening data for cc, commodities, stock indices and the US bonds. At a first glance, we conclude that all cc (except xrp) have long-term memory, and thus it would make sense to carry out a technical analysis to predict their future behaviour. As a corollary, cc do not fulfil the emh of statistical independence of prices.
The same is true for most of the remaining assets, but our data do not provide enough evidence to discard that silver or gold move randomly; hence, they “forget” the past. Nasdaq and two of the stocks that compose it (amzn and nflx) also have aleatory patterns; in contrast, Eurostoxx has a long-term memory and, paradoxically, from an efficiency viewpoint it resembles more the btc than the other index, which includes more disruptive companies.
| Name | Hurst | -value | |
|---|---|---|---|
| BTC | 919 | 0.64169 | |
| ETH | 919 | 0.63337 | |
| BNB | 919 | 0.65587 | |
| XRP | 919 | 0.56646 | 0.01623 |
| ADA | 919 | 0.65739 | |
| MATIC | 919 | 0.68630 | |
| SOL | 919 | 0.67028 | |
| TRX | 919 | 0.59418 | |
| DOT | 919 | 0.63734 | |
| Silver | 653 | 0.50182 | 0.97300 |
| Gold | 652 | 0.54179 | 0.23721 |
| Crude | 633 | 0.59764 | |
| Wheat | 608 | 0.58424 | |
| Bonds | 633 | 0.54451 | |
| Nasdaq | 633 | 0.53580 | 0.32121 |
| EuroSt. | 650 | 0.58617 | |
| AMZN | 633 | 0.45961 | 0.28361 |
| NFLX | 633 | 0.62543 | 0.03299 |
Notice that the aleatory behaviour of xrp already gives a hint that the consensus methods may influence the efficiency of cc. Indeed, xrp cannot be regarded as decentralised, since most of its nodes are controlled by a single company. This is because its aim is not to replace banks as intermediaries, but to improve their effectiveness, as a substitute for the banking swift.
Next, to discern if trx and bnb, which are neither fully decentralised, also display random patterns, we will perform a more refined fractal analysis, considering different time periods and/or modifying the time frequencies. Actually, when varying the latter, the outcomes in Table 9 reveal that btc’s movements are non-efficient at any scale, also exhibiting long-term memory. In contrast, xrp and trx operate mostly in an efficient way.
| Hurst | -value | |
|---|---|---|
| BTC | ||
| 15 min. | 0.53736 | |
| 1 hour | 0.55226 | |
| Daily | 0.64169 | |
| XRP | ||
| 15 min. | 0.51401 | 0.06970 |
| 1 hour | 0.52551 | 0.01164 |
| Daily | 0.56646 | 0.01623 |
| TRX | ||
| 15 min. | 0.51740 | 0.04995 |
| 1 hour | 0.52192 | 0.04746 |
| Daily | 0.59418 | |
| BNB | ||
| 15 min. | 0.55127 | |
| 1 hour | 0.56468 | |
| Daily | 0.65587 |
But to observe traits of aleatoriness in bnb, we still need to reduce the time arc (or zoom in) to the 2nd subperiod (see Table 10). As before, although using daily splits trx exhibits long-term memory, if we take high frequency data, it behaves following a random motion, which is an early clue of lack of self-similarity.
| Hurst | -value | |
|---|---|---|
| XRP | ||
| 15 min. | 0.51450 | 0.14754 |
| 1 hora | 0.51419 | 0.28596 |
| Daily | 0.56816 | 0.13156 |
| TRX | ||
| 15 min. | 0.51719 | 0.07521 |
| 1 hour | 0.52535 | 0.04041 |
| Daily | 0.62667 | |
| BNB | ||
| 15 min. | 0.53628 | |
| 1 hour | 0.53901 | |
| Daily | 0.62968 |
6.3. Fractal features: does the graph change when zooming in?
Next we inspect whether the return graphs of btc and other assets exhibit self similarity features, that is, if they look the same on different time scales. For this to hold, the efficiency character must not vary at different subintervals or if we change the frequency to take the data.
Unlike btc, which moves a persistently at any frequency (cf. Table 9), silver and Eurostoxx (Table 11) change pattern as we reduce the partition. Specifically, for daily data silver moves randomly, but it is mean-reverting for high frequencies. Due to this shift, we deduce that it does not behave as a fractal.
| N | Hurst | -value | |
|---|---|---|---|
| Silver | |||
| 15 min. | 60,320 | 0.42234 | |
| 1 hour | 15,463 | 0.42702 | |
| Daily | 653 | 0.50182 | 0.97286 |
| Eurostoxx | |||
| 15 min. | 23,376 | 0.45768 | |
| 1 hour | 5,849 | 0.48318 | 0.06186 |
| Daily | 650 | 0.58617 |
Moreover, one can also observe that traditional assets display a change in the memory character for different periods (see Table 12). Therefore, none of them can be regarded as a fractal object.
| 20/8/2020 – 24/2/2023 | 20/8/2020 – 1/7/2022 | 1/7/2022 – 24/02/2023 | ||||
|---|---|---|---|---|---|---|
| Hurst | -value | Hurst | -value | Hurst | -value | |
| Silver | 0.5018 | 0.97286 | 0.5746 | 0.04957 | 0.6340 | |
| Gold | 0.5418 | 0.23721 | 0.5880 | 0.6688 | 0.02832 | |
| Crude | 0.5976 | 0.5561 | 0.03144 | 0.4498 | 0.38206 | |
| Wheat | 0.5842 | 0.5861 | 0.5647 | 0.23887 | ||
| US bonds | 0.5445 | 0.5631 | 0.02122 | 0.6406 | ||
| Nasdaq | 0.5358 | 0.32121 | 0.5835 | 0.03252 | 0.6475 | 0.01860 |
| Eurostoxx | 0.5862 | 0.6135 | 0.6768 | 0.01810 | ||
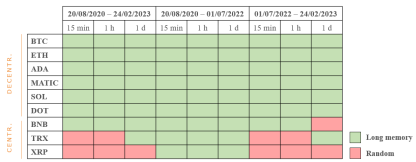
In contrast, the scale-invariance of btc is shared by the five cc whose consensus protocols are fully decentralised (see Figure 5). This holds both in the complete study period and in the two sub-intervals considered, thus confirming the fractal nature of cc that operate peer-to-peer. Furthermore, this corroborates our guess that the underlying consensus protocol is key to determine the efficiency (instead of the capitalization as claimed in previous literature, since bnb and xrp are 3rd and 4th in volume, respectively; recall Table 2).
Additionally, we have analysed how the btc’s Hurst values vary as a function of time from March 2018 to Feb. 2023 with daily opening data. To address this question and calculate , a 150-value rolling window has been used. The outcomes (see Figure 6) show that btc presents long-term memory most of the time with values between 0.55 and 0.75, except at specific moments such as November 2019, when sharp oscillations within the anti-persistence zone occur.
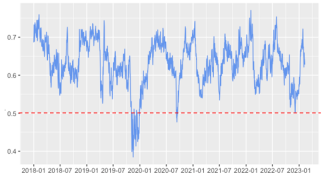
Notice that in the last trimester of 2022 the dynamics seems quite random, which could be influenced by the macroeconomomic situation tensioned by high inflation and rising interest rates.
6.4. A striking turnabout: efficiency may happen (under a change of variable)
We were puzzled by the claim in [38] that if, instead of working directly with the btc returns defined via (4.1), we take the values , then the resulting series becomes more efficient, except for the fact that their tests do not provide enough evidence to reject independence. As the authors restrict to btc and do not compute the Hurst exponent, we decided to update their study and broaden it including the variety of cc and traditional assets we are dealing with.
A quick glance at Figure 7 compared to Figure 5 already reveals that this simple transformation distorts the conclusions about efficiency, and unlike [38] we also get that for most time frames and scales the new values behave independently. Furthermore, if we relax the significance requirements to 1%, most of the table will be coloured as random.
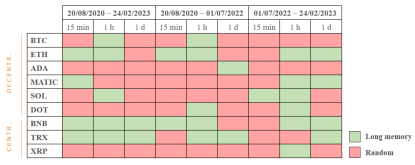
Nevertheless, our outcomes also reveal that the reply to the change of variable and shift to higher efficiency is not consistent, as trx moves oppositely towards long-memory character. Additionally, we lose information, since the new outcomes do not evidence any coherent common trend or difference according to neither technology nor liquidity.
Interestingly, traditional assets are more resilient to changes in the efficiency character in a coherent way (compare Table 13 and Table 12), which gives a further support from an alternative perspective to our conclusion about the different nature of cc versus traditional assets.
| 20/8/2020 – 24/2/2023 | 20/8/2020 – 1/7/2022 | 1/7/2022 – 24/02/2023 | ||||
|---|---|---|---|---|---|---|
| Hurst | -value | Hurst | -value | Hurst | -value | |
| Silver | 0.5213 | 0.0627 | 0.5255 | 0.0434 | 0.5654 | 0.0264 |
| Gold | 0.5291 | 0.0971 | 0.5273 | 0.0205 | 0.6534 | |
| Crude | 0.4845 | 0.345 | 0.4847 | 0.4560 | 0.6208 | |
| Wheat | 0.5241 | 0.5329 | 0.5542 | 0.0205 | ||
| US bonds | 0.5600 | 0.5913 | 0.0140 | 0.5586 | 0.0709 | |
| Nasdaq | 0.5203 | 0.2530 | 0.5814 | 0.5603 | 0.0102 | |
| Eurostoxx | 0.5928 | 0.5977 | 0.5571 | 0.0154 | ||
For the purposes of the present paper, we leave this subsection as a matter of curiosity that deserves further and closer inspection, as we disagree with the premature statement in [38] that any odd power will produce similar results. Indeed, very recent research [55] proves that for a return series with for all , the fractional dimension keeps invariant under the change for every .
It is actually an interesting future research line to find an optimal change of variable that turns any time series into a random Brownian motion, as this will enable to use the plethora of statistical techniques based on the normal distribution, and drive conclusions after undoing the transformation. However, despite some numerical experiments can be helpful, a rigorous approach to this problem should wait for extra advances in fractal geometry, as it is an open problem to find a concrete formula of how the dimension would vary.
6.5. Interdependence of Bitcoin and other assets
To determine whether a diversified portfolio can be built with cc alone or they should be combined with other types of products, we obtain the Pearson correlations between the different assets in the whole period and in both sub-intervals. In view of the outcomes (see Table 14), the second option happens, as btc has very strong positive correlations with all cc except matic.
| full period | 1st subperiod | 2nd subperiod | |
|---|---|---|---|
| BNB | |||
| TRX | |||
| SOL | |||
| MATIC | |||
| ETH | |||
| DOT | |||
| ADA | |||
| XRP | 0.0441 | ||
| TSLA | |||
| NFLX | -0.006 | ||
| AMZN | |||
| KO | - | 0.0053 | |
| PG | - | ||
| JNJ | - | ||
| Crude | |||
| Wheat | -0.0784 | ||
| US bonds | - | ||
| Silver | 0.012 | - | |
| Gold | - | - | |
| Nasdaq | |||
| EuroStoxx | 0.1553 |
We also confirm our previous guess that growth stocks (tsla, nflx & amzn, and hence the Nasdaq index) have similar dynamics than btc. However, it has a weak linear relation with value stocks, hence the mix of these with btc has no diversification power, and it is a clever strategy to combine them with e.g. nflx, with whom strong negative correlations pop up (see Table 21). Moreover, we conclude that btc is far from acting like the more conservative safe haven products for investors, as no no correlation with them arose.
If we now restrict to the interrelations within the cryptosphere, all cc are very tightly correlated as expected (see Tables 18 and 19 for the full matrices of the full period and the first subinterval, respectively). Nevertheless, it is quite surprising that, if we focus on the last subperiod, the completely unprecedented event of negative correlations between them emerges (cf. Table 20).
If we move from the whole time frame to the earlier subset, most of the values match up to the 1st decimal, except some shifts in the interdependences of gold and silver with growth stocks (see Tables 21 and 22). But if we look at the last subinterval, unexpectedly the landscape changes quite radically. Certainly, btc loses correlation strength with growth stocks (cf. Table 23); in parallel, slight negative correlations start to emerge with assets such as jnj or silver.
7. Conclusions
Our main goal was to decide whether the evolution of btc prices is random (as assumed by the emh) or follows chaotic (but more predictable) patterns, opening the door to forecasting opportunities. Via the Hurst values (), we confirm that the btc dynamics are not independent, but have long memory, even if we change the time interval or the frequency of data collection. The latter indicates that the graphs of btc returns are self similar, an essential feature to confirm their nature as fractals.
On the contrary, when changing the scale, we get efficiency shifts for traditional assets, as well as those cc whose consensus protocols have centralised features (bnb, trx & xrp). Up to our knowledge, we pioneer in stressing that it is the underlying technology (intead of the liquidity) the key to determine differences between the performance of cc within the market.
As a corollary, the fractality of btc, characterised by chaotic events occurring in waves rather than isolatedly, contradicts every conservative investor’s desire for it to be a store of value. This invalidates that btc could be considered a safe haven, while not holding the narrative that it is the digital gold.
From our correlational study, btc generally exhibits the same trend as other cc and growth stocks. In practice, this implies that it is not possible to build a risk-controlled portfolio with this type of assets alone. At the same time, there is no tight correlation of btc with conservative products; consequently, it is also very difficult exploit btc as a diversification tool.
Complementarily, if we focus on the later subperiod, the correlations of all assets get disrupted. It will be interesting for future work to analyse whether this paradigm shift is an isolated event or is sustained over time. A plausible justification within the actual context could come from the influence of a sharp rise in interest rates, joint with a global economy strained by inflation.
To recap, we detect a high degree of persistence in btc prices. This may be due to the lack of investor confidence in this market, as it is unstructured and lacks oversight by the authorities. With more legislative certainty, participation will increase, which may lead to a rise of efficiency (or decrease in predictability) that would stabilise the cryptoeconomy.
Appendix A Table giving a literature overview
Appendix B Complete tables with Hurst exponents
| Hurst -value BTC 15 min. 0.5374 1 hour 0.5523 Daily 0.6417 ETH 15 min. 0.5375 1 hour 0.5525 Daily 0.6334 BNB 15 min. 0.5513 1 hour 0.5647 Daily 0.6559 Hurst -value XRP 15 min. 0.5140 0.06970 1 hour 0.5219 0.04746 Daily 0.5942 ADA 15 min. 0.5356 1 hour 0.5540 Daily 0.6574 MATIC 15 min. 0.5539 1 hour 0.5767 Daily 0.6863 Hurst -value SOL 15 min. 0.5480 1 hour 0.5632 Daily 0.6703 TRX 15 min. 0.5174 0.04995 1 hour 0.5219 0.04746 Daily 0.5942 DOT 15 min. 0.5276 1 hour 0.5413 Daily 0.6373 |
| Hurst -value BTC 15 min. 0.5462 1 hour 0.5651 Daily 0.6670 ETH 15 min. 0.5450 1 hour 0.5637 Daily 0.6685 BNB 15 min. 0.5569 1 hour 0.5736 Daily 0.6622 Hurst -value XRP 15 min. 0.5271 1 hour 0.5446 Daily 0.5820 ADA 15 min. 0.5411 1 hour 0.5630 Daily 0.6733 MATIC 15 min. 0.5505 1 hour 0.5752 Daily 0.6918 Hurst -value SOL 15 min. 0.5627 1 hour 0.5819 Daily 0.7275 TRX 15 min. 0.5310 1 hour 0.5384 Daily 0.5949 DOT 15 min. 0.5352 1 hour 0.5528 Daily 0.6398 |
| Hurst -value BTC 15 min. 0.5406 1 hour 0.5508 Daily 0.6227 ETH 15 min. 0.5491 1 hour 0.5641 Daily 0.6645 BNB 15 min. 0.5363 1 hour 0.5390 Daily 0.6297 Hurst -value XRP 15 min. 0.5145 0.14754 1 hour 0.5141 0.28596 Daily 0.5682 0.13156 ADA 15 min. 0.5376 1 hour 0.5531 Daily 0.6832 MATIC 15 min. 0.5377 1 hour 0.5506 Daily 0.6468 Hurst -value SOL 15 min. 0.5604 1 hour 0.5854 Daily 0.6767 TRX 15 min. 0.5172 0.07521 1 hour 0.5254 0.04041 Daily 0.6267 DOT 15 min. 0.5322 1 hour 0.5463 Daily 0.6829 |
Appendix C Correlation matrices for criptoassets and BTC versus traditional assets
Hereafter ∗∗∗ (∗∗, ∗) denotes significance at 0.1% (1%, 5%) significance level.
| BTC | BNB | TRX | SOL | MATIC | ETH | DOT | ADA | XRP | |
|---|---|---|---|---|---|---|---|---|---|
| BTC | 1 | ||||||||
| BNB | 0.7318∗∗∗ | 1 | |||||||
| TRX | 0.7089∗∗∗ | 0.8866∗∗∗ | 1 | ||||||
| SOL | 0.6606∗∗∗ | 0.7489∗∗∗ | 0.5968∗∗∗ | 1 | |||||
| MATIC | 0.5037∗∗∗ | 0.8222∗∗∗ | 0.5711∗∗∗ | 0.7780∗∗∗ | 1 | ||||
| ETH | 0.8422∗∗∗ | 0.9057∗∗∗ | 0.7742∗∗∗ | 0.8825∗∗∗ | 0.8378*** | 1 | |||
| DOT | 0.9527∗∗∗ | 0.7042∗∗∗ | 0.7252∗∗∗ | 0.6598∗∗∗ | 0.4609*** | 0.8008∗∗∗ | 1 | ||
| ADA | 0.8275∗∗∗ | 0.7456∗∗∗ | 0.7379∗∗∗ | 0.7017∗∗∗ | 0.6312∗∗∗ | 0.8524∗∗∗ | 0.8423∗∗∗ | 1 | |
| XRP | 0.8050∗∗∗ | 0.7997∗∗∗ | 0.8387∗∗∗ | 0.6221∗∗∗ | 0.5788∗∗∗ | 0.8152∗∗∗ | 0.8233∗∗∗ | 0.8548∗∗∗ | 1 |
| BTC | BNB | TRX | SOL | MATIC | ETH | DOT | ADA | XRP | |
|---|---|---|---|---|---|---|---|---|---|
| BTC | 1 | ||||||||
| BNB | 0.8217∗∗∗ | 1 | |||||||
| TRX | 0.7785∗∗∗ | 0.8917∗∗∗ | 1 | ||||||
| SOL | 0.6259∗∗∗ | 0.7686∗∗∗ | 0.5974∗∗∗ | 1 | |||||
| MATIC | 0.5779∗∗∗ | 0.8250∗∗∗ | 0.5768∗∗∗ | 0.8175∗∗∗ | 1 | ||||
| ETH | 0.8342∗∗∗ | 0.9392∗∗∗ | 0.7925∗∗∗ | 0.8741∗∗∗ | 0.8827∗∗∗ | 1 | |||
| DOT | 0.9380∗∗∗ | 0.7820∗∗∗ | 0.7933∗∗∗ | 0.6235∗∗∗ | 0.5258∗∗∗ | 0.7821∗∗∗ | 1 | ||
| ADA | 0.7851∗∗∗ | 0.7998∗∗∗ | 0.7793∗∗∗ | 0.6684∗∗∗ | 0.6965∗∗∗ | 0.8371∗∗∗ | 0.8029∗∗∗ | 1 | |
| XRP | 0.7656∗∗∗ | 0.8538∗∗∗ | 0.8927∗∗∗ | 0.5820∗∗∗ | 0.6313∗∗∗ | 0.7979∗∗∗ | 0.7868∗∗∗ | 0.8290∗∗∗ | 1 |
| BTC | BNB | TRX | SOL | MATIC | ETH | DOT | ADA | XRP | |
|---|---|---|---|---|---|---|---|---|---|
| BTC | 1 | ||||||||
| BNB | 0.5929∗∗∗ | 1 | |||||||
| TRX | 0.9059∗∗∗ | 0.2921∗∗∗ | 1 | ||||||
| SOL | 0.6932∗∗∗ | 0.1368 | 0.8407∗∗∗ | 1 | |||||
| MATIC | 0.4791∗∗∗ | 0.7286∗∗∗ | 0.2211∗∗ | -0.1586∗ | 1 | ||||
| ETH | 0.8396∗∗∗ | 0.7048∗∗∗ | 0.6931∗∗∗ | 0.5532∗∗∗ | 0.5588∗∗∗ | 1 | |||
| DOT | 0.8011∗∗∗ | 0.3992∗∗∗ | 0.8477∗∗∗ | 0.8809∗∗∗ | 0.1309 | 0.7540∗∗∗ | 1 | ||
| ADA | 0.7125∗∗∗ | 0.2197∗∗∗ | 0.8101∗∗∗ | 0.9460∗∗∗ | -0.0652 | 0.6323∗∗∗ | 0.9413∗∗∗ | 1 | |
| XRP | 0.044∗∗∗ | 0.3717∗∗∗ | -0.002∗∗∗ | 0.090∗∗∗ | 0.1914∗ | 0.0062 | -0.0515 | -0.0496 | 1 |
| BTC | TSLA | NFLX | AMZN | KO | PG | JNJ | OIL | WHEAT | ZNM23 | SILVER | GOLD | CCMP | SX5E | |
|---|---|---|---|---|---|---|---|---|---|---|---|---|---|---|
| BTC | 1 | |||||||||||||
| TSLA | 0.6240∗∗∗ | 1 | ||||||||||||
| NFLX | 0.5564∗∗∗ | 0.1255∗∗ | 1 | |||||||||||
| AMZN | 0.5540∗∗∗ | 0.3264∗∗∗ | 0.8124∗∗∗ | 1 | ||||||||||
| KO | -0.1100∗∗ | 0.2883∗∗∗ | -0.7136∗∗∗ | -0.5929∗∗∗ | 1 | |||||||||
| PG | 0.1017∗ | 0.4000∗∗∗ | -0.1337∗∗∗ | -0.0511 | 0.6250∗∗∗ | 1 | ||||||||
| JNJ | 0.2074∗∗∗ | 0.3453∗∗∗ | -0.4702∗∗∗ | -0.3805∗∗∗ | 0.7655∗∗∗ | 0.4230∗∗∗ | 1 | |||||||
| OIL | 0.1331∗∗∗ | 0.4739∗∗∗ | -0.6360∗∗∗ | -0.4502∗∗∗ | 0.8346∗∗∗ | 0.4178∗∗∗ | 0.7680∗∗∗ | 1 | ||||||
| WHEAT | 0.1005∗ | 0.4453∗∗∗ | -0.5995∗∗∗ | -0.3983∗∗∗ | 0.7225∗∗∗ | 0.4370∗∗∗ | 0.6566∗∗∗ | 0.8853∗∗∗ | 1 | |||||
| ZNM23 | 0.2886∗∗∗ | -0.0723 | 0.8077∗∗∗ | 0.8527∗∗∗ | -0.7906∗∗∗ | -0.1962∗∗∗ | -0.6048∗∗∗ | -0.7307∗∗∗ | -0.6281∗∗∗ | 1 | ||||
| SILVER | 0.3457∗∗∗ | -0.1752∗∗∗ | 0.6281∗∗∗ | 0.5899∗∗∗ | -0.5643∗∗∗ | -0.1753∗∗∗ | -0.2711∗∗∗ | -0.5135∗∗∗ | -0.4070∗∗∗ | 0.7052∗∗∗ | 1 | |||
| GOLD | -0.1281∗∗ | -0.1695∗∗∗ | 0.1380∗∗∗ | 0.1976∗∗∗ | -0.0755 | 0.3312∗∗∗ | -0.1653∗∗∗ | -0.1631∗∗∗ | 0.018 | 0.3385∗∗∗ | 0.5770∗∗∗ | 1 | ||
| CCMP | 0.8458∗∗∗ | 0.6579∗∗∗ | 0.7100∗∗∗ | 0.7734∗∗∗ | -0.1598∗∗∗ | 0.2298∗∗∗ | 0.1021∗ | -0.0114 | -0.068 | 0.4794∗∗∗ | 0.3704∗∗∗ | 0.0016 | 1 | |
| SX5E | 0.6749∗∗∗ | 0.4388∗∗∗ | 0.3532∗∗∗ | 0.1908∗∗∗ | 0.2798∗∗∗ | 0.3701∗∗∗ | 0.4401∗∗∗ | 0.2734∗∗∗ | 0.1016∗ | -0.0676 | 0.1415∗∗∗ | -0.075 | 0.7065∗∗∗ | 1 |
| BTC | TSLA | NFLX | AMZN | KO | PG | JNJ | OIL | WHEAT | ZNM23 | SILVER | GOLD | CCMP | SX5E | |
|---|---|---|---|---|---|---|---|---|---|---|---|---|---|---|
| BTC | 1 | |||||||||||||
| TSLA | 0.6812∗∗∗ | 1 | ||||||||||||
| NFLX | 0.3544∗∗∗ | 0.0853 | 1 | |||||||||||
| AMZN | 0.2980∗∗∗ | 0.0984∗ | 0.8644∗∗∗ | 1 | ||||||||||
| KO | 0.2099∗∗ | 0.5322∗∗∗ | -0.6331∗∗∗ | -0.4738∗∗∗ | 1 | |||||||||
| PG | 0.0924∗ | 0.5644∗∗∗ | -0.2808∗∗∗ | -0.1528∗∗ | 0.7504∗∗∗ | 1 | ||||||||
| JNJ | 0.4573∗∗∗ | 0.5669∗∗∗ | -0.4379∗∗∗ | -0.2835∗∗∗ | 0.7824∗∗∗ | 0.4341∗∗∗ | 1 | |||||||
| OIL | 0.3493∗∗∗ | 0.5853∗∗∗ | -0.6032∗∗∗ | -0.5135∗∗∗ | 0.8831∗∗∗ | 0.5302∗∗∗ | 0.8046∗∗∗ | 1 | ||||||
| WHEAT | 0.2084∗∗∗ | 0.5141∗∗∗ | -0.6787∗∗∗ | -0.5854∗∗∗ | 0.8468∗∗∗ | 0.5623∗∗∗ | 0.7137∗∗∗ | 0.9100∗∗∗ | 1 | |||||
| ZNM23 | -0.2597∗∗∗ | -0.5172∗∗∗ | 0.7155∗∗∗ | 0.6348∗∗∗ | -0.8814∗∗∗ | -0.5346∗∗∗ | -0.7664∗∗∗ | -0.9465∗∗∗ | -0.8981∗∗∗ | 1 | ||||
| SILVER | 0.012 | -0.2938∗∗∗ | 0.3056∗∗∗ | 0.4494∗∗∗ | -0.4883∗∗∗ | -0.5377∗∗∗ | -0.2296∗∗∗ | -0.4530∗∗∗ | -0.4421∗∗∗ | 0.5016∗∗∗ | 1 | |||
| GOLD | -0.5741∗∗∗ | -0.1756∗∗∗ | -0.3667∗∗∗ | -0.1677∗∗∗ | -0.1346∗∗ | 0.2643∗∗∗ | -0.1043∗ | 0.008 | 0.2110∗∗∗ | -0.033 | 0.2536∗∗∗ | 1 | ||
| CCMP | 0.7984∗∗∗ | 0.7068∗∗∗ | 0.5825∗∗∗ | 0.6223∗∗∗ | 0.1693∗∗∗ | 0.2419∗∗∗ | 0.3897∗∗∗ | 0.2023∗∗∗ | 0.0303 | -0.041 | -0.007 | -0.4723 | 1 | |
| SX5E | 0.8005∗∗∗ | 0.6782∗∗∗ | 0.3206∗∗∗ | 0.3571∗∗∗ | 0.4124∗∗∗ | 0.3419∗∗∗ | 0.5725∗∗∗ | 0.4249∗∗∗ | 0.1995∗∗∗ | -0.2916∗∗∗ | -0.1215∗∗ | -0.5028∗∗∗ | 0.9041∗∗∗ | 1 |
| BTC | TSLA | NFLX | AMZN | KO | PG | JNJ | OIL | WHEAT | ZNM23 | SILVER | GOLD | CCMP | SX5E | |
|---|---|---|---|---|---|---|---|---|---|---|---|---|---|---|
| BTC | 1 | |||||||||||||
| TSLA | 0.4625∗∗∗ | 1 | ||||||||||||
| NFLX | -0.0057 | -0.6776∗∗∗ | 1 | |||||||||||
| AMZN | 0.5396∗∗∗ | 0.9061∗∗∗ | -0.6243∗∗∗ | 1 | ||||||||||
| KO | 0.0053 | 0.0187 | -0.0855 | 0.0868 | 1 | |||||||||
| PG | -0.1615∗ | -0.3325∗∗∗ | 0.1678∗ | -0.2334∗∗ | 0.8862∗∗∗ | 1 | ||||||||
| JNJ | -0.5115∗∗∗ | -0.3869∗∗∗ | -0.0964 | -0.3739∗∗∗ | 0.5586∗∗∗ | 0.6238∗∗∗ | 1 | |||||||
| OIL | 0.3249∗∗∗ | 0.5943∗∗∗ | -0.7818∗∗∗ | 0.5898∗∗∗ | 0.1343 | -0.1611∗ | 0.0887 | 1 | ||||||
| WHEAT | -0.0784 | 0.4506∗∗∗ | -0.5450∗∗∗ | 0.3125∗∗∗ | -0.6074∗∗∗ | -0.7372∗∗∗ | -0.2562∗∗ | 0.4156∗∗∗ | 1 | |||||
| ZNM23 | 0.4490∗∗∗ | 0.4700∗∗∗ | -0.4555∗∗∗ | 0.5972∗∗∗ | 0.6617∗∗∗ | 0.4577∗∗∗ | 0.1813∗ | 0.5487∗∗∗ | -0.2809∗∗∗ | 1 | ||||
| SILVER | -0.1935∗ | -0.8158∗∗∗ | 0.7776∗∗∗ | -0.6900∗∗∗ | 0.2269∗∗ | 0.5357∗∗∗ | -0.2835∗∗∗ | -0.6520∗∗∗ | -0.6288∗∗∗ | -0.1823∗ | 1 | |||
| GOLD | 0.20761∗∗ | -0.5669∗∗∗ | 0.6723∗∗∗ | -0.3722∗∗∗ | 0.3678∗∗∗ | 0.5710∗∗∗ | 0.0768 | -0.4172∗∗∗ | -0.7638∗∗∗ | 0.2084∗∗ | 0.8354∗∗∗ | 1 | ||
| CCMP | 0.6902∗∗∗ | 0.6555∗∗∗ | -0.1618∗ | 0.7480∗∗∗ | 0.4621∗∗∗ | 0.2024∗ | -0.2785∗∗∗ | 0.3319∗∗∗ | -0.2431∗∗ | 0.7113∗∗∗ | -0.2581∗∗ | 0.1508 | 1 | |
| SX5E | 0.1553 | -0.5850∗∗∗ | 0.8704∗∗∗ | -0.5044∗∗∗ | 0.2686∗∗∗ | 0.4704∗∗∗ | 0.0049 | -0.6055∗∗∗ | -0.7780∗∗∗ | -0.0851 | 0.7946∗∗ | 0.8497∗∗∗ | 0.1278 | 1 |
References
- [1] Alvarez-Ramirez J, Rodriguez E, Ibarra-Valdez E. Long-range correlations and asymmetry in the Bitcoin market. Phys. A. Stat. Mech. Appl. 2018;492,948–955.
- [2] Al-Yahyaee KH, Mensi W, Yoon, SM. Efficiency, multifractality, and the long-memory property of the Bitcoin market: A comparative analysis with stock, currency, and gold markets. Finance Res. Lett. 2018;27,228–234.
- [3] Aslan A, Sensoy, A. Intraday efficiency-frequency nexus in the cryptocurrency markets. Finance Res. Lett. 2020;35,101298.
- [4] Assaf A, Mokni K, Yousaf I, Bhandari, A. Long memory in the high frequency cryptocurrency markets using fractal connectivity analysis: The impact of COVID-19. Research in International Business and Finance 2023;64,101821.
- [5] Avram F, Taqqu, MS. Robustness of the R/S statistic for fractional stable noises. Statistical inference for stochastic processes 2000;3,69–83.
- [6] Bariviera AF. The inefficiency of Bitcoin revisited: A dynamic approach. Econom. Lett. 2017;161,1–4.
- [7] Bariviera AF, Basgall MJ, Hasperué W. Some stylized facts of the Bitcoin market Physica A 2017;484, 82-90.
- [8] Bariviera AF. One model is not enough: Heterogeneity in cryptocurrencies’ multifractal profiles. Finance Res. Lett. 2021;39, 101649.
- [9] Baur DG, Dimpfl T, Kuck K. Bitcoin, gold and the US dollar–A replication and extension. Finance Res. Lett. 2018;25, 103–110.
- [10] Brauneis A, Mestel R. Price discovery of cryptocurrencies: Bitcoin and beyond. Econ. Lett. 2018;165,58–61.
- [11] Caporale GM, Gil-Alana L, Plastun A. Persistence in the cryptocurrency market. Res Int Bus Financ 2018;46,141–148.
- [12] Charfeddine L, Maouchi, Y. Are shocks on the returns and volatility of cryptocurrencies really persistent?. Finance Res. Lett. 2019;28,423–430.
- [13] Cheah ET, Fry J. Speculative bubbles in Bitcoin markets? An empirical investigation into the fundamental value of Bitcoin. Econom. Lett. 2015;130,32-36.
- [14] Corbet S, Lucey B, Urquhart A, Yarovaya L. Cryptocurrencies as a financial asset: A systematic analysis. Int. Rev. Financial Anal. 2019;62,182–199.
- [15] Couillard M, Davison M. A comment on measuring the Hurst exponent of financial time series. Physica A 2005;348,404–418.
- [16] David SA, Inacio Jr CMC, Nunes R, Machado, JT. Fractional and fractal processes applied to cryptocurrencies price series. J. Adv. Res. 2021;32,85–98.
- [17] Dyhrberg AH. Bitcoin, gold and the dollar–A GARCH volatility analysis. Finance Res. Lett. 2016;16,85–92.
- [18] Fama EF. Efficient capital markets: A review of theory and empirical work. J. Finance 1970;25(2),383–417.
- [19] Gajardo G, Kristjanpoller WD, Minutolo M. Does Bitcoin exhibit the same asymmetric multifractal crosscorrelations with crude oil, gold and DJIA as the Euro, Great British Pound and Yen. Chaos Solitons Fractals 2018;109,195–205.
- [20] Hazlett PK, Luther WJ. Is bitcoin money? And what that means. The Quarterly Review of Economics and Finance 2020;77,144–149.
- [21] Hu Y, Valera HGA, Oxley L. Market efficiency of the top market-cap cryptocurrencies: Further evidence from a panel framework. Finance Res. Lett. 2019;31,138–145.
- [22] Hurst HE, Long-term storage capacity of reservoirs Trans Amer Soc Civ Eng 1951;11,770–808.
- [23] Hurst HE, A suggested statistical model of some time series which occur in nature. Nature 1957;180,494.
- [24] Ji Q, Bouri E, Gupta R, Roubaud, D. Network causality structures among Bitcoin and other financial assets: A directed acyclic graph approach. The Quarterly Review of Economics and Finance 2018;70,203–213.
- [25] Jiang Y, Nie H, Ruan W. Time-varying long-term memory in Bitcoin market. Financ. Res. Lett. 2018;25,280–284.
- [26] Kristoufek L. On Bitcoin markets (in)efficiency and its evolution. Physica A 2018;503,257–262.
- [27] Klein T, Pham Thu H, Walther T. Bitcoin is not the New Gold-A comparison of volatility, correlation, and portfolio performance Int. Rev. Financ. Anal. 2018;59,105–116.
- [28] Köchling G, Müller J, Posch PN. Price delay and market frictions in cryptocurrency markets. Econ. Lett. 2019;174,39–41.
- [29] Lahmiri S, Bekiros S, Bezzina F. Multi-fluctuation nonlinear patterns of European financial markets based on adaptive filtering with application to family business, green, Islamic, common stocks, and comparison with Bitcoin, NASDAQ, and VIX. Physica A 2020;538,122858.
- [30] Lahmiri S, Bekiros, S. Big data analytics using multi-fractal wavelet leaders in high-frequency Bitcoin markets. Chaos, Solitons & Fractals 2020; 131, 109472.
- [31] Lahmiri S, Bekiros S. The effect of COVID-19 on long memory in returns and volatility of cryptocurrency and stock markets. Chaos, Solitons & Fractals 2021;151,111221.
- [32] Mandelbrot B. Statistical methodology for non-periodic cycles: from the covariance to R/S analysis Ann. Econ. Soc. Measurem. 1972;1,259–290.
- [33] Mandelbrot B. Limit theorems on the self-normalized range for weakly and strongly dependent processes Probab. Theory Related Fiel. 1975;31,271–285.
- [34] Mandelbrot B, Hudson RL. The (mis) behaviour of markets: a fractal view of risk, ruin and reward: Profile books; 2010.
- [35] Mandelbrot B, Taqqu M. Robust R/S analysis of long-run serial correlation Bull. Int. Stat. Inst. 1979;48,59–104.
- [36] Mandelbrot B, Wallis JR. Some long-run properties of geophysical records Water Resour Res 1969;5,321–340.
- [37] Mensi W, Lee YJ, Al-Yahyaee KH, Sensoy A, Yoon, SM. Intraday downward/upward multifractality and long memory in Bitcoin and Ethereum markets: An asymmetric multifractal detrended fluctuation analysis. Finance Res. Lett. 2019;31, 19–25.
- [38] Nadarajah S, Chu J, On the inefficiency of Bitcoin. Econ. Lett. 2017;150, 6-9.
- [39] Omane-Adjepong M, Alagidede P, Akosah N. Wavelet time-scale persistence analysis of cryptocurrency market returns and volatility. Physica A 2019;514,105–120.
- [40] Partida A, Gerassis S, Criado R, Romance M, Giráldez E, Taboada J. The chaotic, self-similar and hierarchical patterns in Bitcoin and Ethereum price series. Chaos, Solitons & Fractals 2022;165,112806.
- [41] Phillip A, Chan, JS, Peiris S. A new look at cryptocurrencies. Econ. Lett. 2018;163,6–9.
- [42] Ruan Q, Meng L., Lv D. Effect of introducing Bitcoin futures on the underlying Bitcoin market efficiency: A multifractal analysis. Chaos, Solitons & Fractals 2021;153,111576.
- [43] Sensoy A. The inefficiency of Bitcoin revisited: a high-frequency analysis with alternative currencies. Finance Res. Lett. 2019;28,68–73.
- [44] Shahzad SJH, Bouri E, Roubaud D, Kristoufek L, Lucey B. Is Bitcoin a better safe-haven investment than gold and commodities? Int. Rev. Financial Anal. 2019;63,322–330.
- [45] Stavroyiannis S, Babalos V, Bekiros S, Lahmiri S, Uddin GS. The high frequency multifractal properties of Bitcoin. Physica A 2019;520, 62–71.
- [46] Stosic D, Stosic D, Ludermir TB, Stosic T. Multifractal behavior of price and volume changes in the cryptocurrency market. Physica A 2019;520,54–61.
- [47] Telli Ş, Chen H. Multifractal behavior in return and volatility series of Bitcoin and gold in comparison. Chaos, Solitons & Fractals 2020;139,109994.
- [48] Teverovsky V, Taqqu MS, Willinger W. A critical look at Lo’s modified statistic. J. Stat. Plan. Inference 1999;80(1-2),211–227.
- [49] Tiwari AK, Jana RK, Das D, Roubaud D. Informational efficiency of Bitcoin—An extension. Econ. Lett. 2018;163,106–109.
- [50] Urquhart A. The inefficiency of Bitcoin. Econ. Lett. 2016; 148, 80-82.
- [51] Urquhart A. Price clustering in bitcoin. Econ. Lett. 2017;159,145–148.
- [52] Vidal-Tomás D, Ibañez A. Semi-strong efficiency of bitcoin. Finance Res Lett 2018;27,259–265.
- [53] Wang J, Wang X. COVID-19 and financial market efficiency: evidence from an entropy-based analysis Financ. Res. Lett. 2021;101888.
- [54] White R, Marinakis Y, Islam N, Walsh S. Is Bitcoin a currency, a technology-based product, or something else?. Technol. Forecast. Soc. Change 2020;151,119877.
- [55] Yu B, Liang Y. Fractal dimension variation of continuous functions under certain operations. Fractals 2023;31(5),2350044.
- [56] Zhang S, Mani G. Popular cryptoassets (Bitcoin, Ethereum, and Dogecoin), Gold, and their relationships: volatility and correlation modeling. Data Science and Management 2021;4,30–39.