Improving Robustness and Accuracy of Ponzi Scheme Detection on Ethereum Using Time-Dependent Features
Abstract
The rapid development of blockchain has led to more and more funding pouring into the cryptocurrency market, which also attracted cybercriminals’ interest in recent years. The Ponzi scheme, an old-fashioned fraud, is now popular on the blockchain, causing considerable financial losses to many crypto-investors. A few Ponzi detection methods have been proposed in the literature, most of which detect a Ponzi scheme based on its smart contract source code or opcode. The contract-code-based approach, while achieving very high accuracy, is not robust: first, the source codes of a majority of contracts on Ethereum are not available, and second, a Ponzi developer can fool a contract-code-based detection model by obfuscating the opcode or inventing a new profit distribution logic that cannot be detected (since these models were trained on existing Ponzi logics only). A transaction-based approach could improve the robustness of detection because transactions, unlike smart contracts, are harder to be manipulated. However, the current transaction-based detection models achieve fairly low accuracy. We address this gap in the literature by developing new detection models that rely only on the transactions, hence guaranteeing the robustness, and moreover, achieve considerably higher Accuracy, Precision, Recall, and F1-score than existing transaction-based models. This is made possible thanks to the introduction of novel time-dependent features that capture Ponzi behaviours characteristics derived from our comprehensive data analyses on Ponzi and non-Ponzi data from the XBlock-ETH repository.
1 Introduction
Since the birth of Bitcoin in 2008 [47], the blockchain technology has grown exponentially and revolutionized the way currencies and digital assets are transferred, exchanged, and traded. Thanks to its inherent decentralization, anonymity, and immutability, a blockchain, regarded as a digital ledger, provides better tampering resistance, robustness, privacy protection, and cheaper turn-around costs compared to a traditional financial system [24, 70].
Apart from applications in digital finance, Turing-complete smart contracts introduced first by Ethereum [10] and then by other similar blockchain platforms allow developers to implement sophisticated logic on the chain, further expanding the applicability of the technology to many other sectors including supply chains [26, 41, 11], data sharing [59, 38], games [52, 6], and the internet of things [49, 25, 48].
In recent years, crypto-crowdfunding via initial coin offerings (ICOs) has become a major fundraising method used by many businesses [46], providing an attractive alternative to the traditional stock exchanges. By the end of December 2021, the global market capitalization of blockchains had reached a staggering amount of over $2.9 trillion with more than 20,000 different cryptocurrencies [19]. However, this phenomenal success of the blockchain technology in digital finance has also led to a rising number of cybercrimes. Smart-contract-supporting blockchains have now become a paradise for a plethora of devastating financial scams, most notably Ponzi schemes, Honeypots, Phishing, Pump and Dump, and Rug Pull [12].
A Ponzi scheme [2] is a classic fraudulent investment scam, which first appeared over 100 years ago in Boston. These scams often worked under the hood of high-yield investment opportunities. In short, a Ponzi scheme promises high returns to investors by using the funds from newcomers to pay earlier investors. A Ponzi scheme will inevitably collapse when few or no new investors join, making most investors, except for the early ones and the scheme owner, losing their money. The most common victims of Ponzi schemes are novice investors who are attracted by the promise of a large profit but aren’t aware of where the money comes from or how the business works [36, 37].
Although having a long history, Ponzi schemes never go out of fashion because fraudsters never stop deploying them across different platforms. Blockchain platforms are no exception, and in fact, create an even more favourable environment for Ponzi scams to thrive due to the lack of supervision from a central authority and its inherent anonymity [61, 62]. According to Chainanalysis’s 2021 Crypto Crime Report [13], from 2017 to 2020, most blockchain frauds were Ponzi schemes, which accounted for nearly $7 billion worth of cryptocurrency in 2019, more than double of all other scams in 2020.
The development of Ponzi schemes on Ethereum111In the scope of this work we focus on Ponzi schemes on Ethereum only. For Bitcoin-based Ponzi schemes, please refer to [60, 4]. have attracted some attention from the research community. The very first work in this area was by Bartoletti et al. [3], who analyzed the source codes of available Ethereum smart contracts and proposed four criteria to identify a Ponzi scheme (their paper first appeared on Arxiv in 2017). They classified Ponzi schemes on the Ethereum chain into four different types according to their money distribution logic (see Section 2.2). They also constructed the very first Ponzi dataset on Ethereum, consisting of 184 Ponzi contracts (active from 2015 to 2017) by manually inspecting their source codes. To automatically detect Ponzi schemes, a number of Ponzi detection models using various machine learning methods [16, 17, 39, 29, 63, 69, 35] and symbolic execution techniques [15] have been developed in the literature. All of the machine-learning-based approaches employed both transaction-based features (account features) and contract-code-based features (opcode features) in their models to improve the detection accuracy. Most notably, SADPonzi [15], which used a semantic-aware approach, achieves 100% accuracy. Their proposed system can identify a Ponzi contract by comparing the extracted semantic information of its bytecode and that of four known Ponzi scheme patterns.
However, a contract-code-based approach, while capable of achieving very high accuracy, is not robust. First, the source codes (in Solidity) of a majority of contracts on Ethereum are not available (see, e.g., [72]). Second, a Ponzi developer can fool a contract-code-based detection model by obfuscating the opcode (see [15, Section 7.2.1]) or inventing a new profit distribution logic that cannot be detected (since these models or methods were trained or strictly rely on existing Ponzi logics) (see [15, Section 8]). We will discuss these points with more details in Section 2.3. A transaction-based approach could improve the robustness of detection because transactions, unlike smart contracts, are harder to be manipulated. However, the current transaction-based detection models achieve fairly low accuracy [16, 17, 39].
In this work, we aim to develop more robust and accurate detection models that only rely on transaction data. To this end, we first collected all related transactions of 1395 applications that are included in the first ten million Ethereum blocks (July 2015 to May 2020) from the XBlock-ETH repository. We then analysed the data to capture the way Ponzi applications work. We observed that Ponzi and non-Ponzi applications have distinctive behaviours and characteristics and more importantly, that the time factor, which has been overlooked in most studies, is crucial in identifying a Ponzi application. We introduced a list of novel time-dependent features that capture the behaviours of an application throughout its lifetime. To evaluate the effectiveness of this new list of features, we ran the same classifiers and also some new ones on this list and on the existing list used by other transaction-based models [16, 39], treated as the baselines. The experiments showed that our proposed list of features achieved significantly higher F1-score values compared to the baselines. More specifically, the F1-score values of the baselines are improved by 8.3% or 26.4% if using our new features with the same classifiers. Finally, we demonstrated that our approach can also detect, with high accuracy, new types of Ponzi schemes that were not present in the training dataset.
The rest of the paper is organized as follows. In Section 2, we introduce the background knowledge of Ethereum, Ponzi schemes, and discuss related works in the literature. In Section 3, we describe the data collection process, provide a comprehensive analysis of the collected data, discuss our transaction-based features aggregation and well-known classification models. In Section 4, we explain in detail the workflow, experimental configuration, evaluation metrics and experiment outcomes. Finally, in Section 5, we summarize our work and introduce a few directions for future work.
2 Background
2.1 Ethereum in a Nutshell
Ethereum is the second most popular blockchain after Bitcoin in terms of market capitalization [18]. It is also the largest platform that provides a decentralized virtual environment (i.e., Ethereum Virtual Machine or EVM for short) to execute smart contracts [56]. In 2022, the Ethereum chain reached 15 million blocks with over 1.5 billion transactions [57].
Smart contracts on Ethereum are executable programs that run automatically when their trigger conditions are met. Those contracts can be implemented using an object-oriented and high-level language called Solidity [27]. Contract source codes are then compiled into bytecodes, which can be represented as low-level human-readable instructions - opcodes [67]. After that, the bytecodes are launched onto EVM. Once a contract is deployed, it cannot be modified by anyone. Moreover, any activities in the life cycle of a contract, e.g. deployment, execution, or even termination, must be triggered by a transaction. Therefore, any communication ‘from’ or ‘to’ a contract is recorded as a transaction and stored on the blockchain as immutable data. In other words, in Ethereum, a transaction is a key unit that involves all the activities of the contract.
In Ethereum, there are two types of transactions, external and internal transactions [16]. While external transactions are stored in the chain, internal transactions are only recorded from smart contracts execution. The type of a transaction strongly depends on the type of account from which the transaction is sent. More specifically, external transactions are sent out from externally owned accounts (EOA), i.e., user accounts, while internal transactions come from smart contracts (SC) themselves. Each transaction contains a few common data fields listed below [57].
-
•
Participant address: An account address of a sender or receiver participating in this transaction.
-
•
Value: Transferred Ether (ETH) amount. ETH is the representative token in Ethereum that is used for many purposes, such as trading on crypto exchanges, paying the transaction fee, and paying for decentralized services.
-
•
Timestamp: The time at which a transaction is mined.
-
•
Block: Number of the blocks in which the transaction is recorded.
-
•
Transaction fee: Amount paid to the miner for processing the transaction.
-
•
Gas usage: The fee required to conduct a transaction or execute a contract on Ethereum successfully. Normal ETH transfers involve 21,000 gas units, while contract executions require a higher amount.
-
•
Input data: Additional data included for the transaction, such as a message, a contract bytecode, or the contract’s calling function and input.
-
•
Status: The delivery status of the transaction. The status can be marked “failed” for reasons such as insufficient transferred amount, insufficient gas, or even an invalid bytecode.
2.2 Ponzi Schemes on Ethereum
The blockchain technology has the potential to revolutionize the way traditional businesses work [44] by reducing credit costs [32], improving users’ privacy [70], and realizing machine trust [22]. However, this technology also creates a golden opportunity for cybercriminals, resulting in the migrations of many financial scams to the blockchain platforms [12]. Among blockchain scams, Ponzi schemes [2] are the most popular from 2017 to 2020. In hindsight, this is not a surprise. Blockchain’s inherent properties, i.e., automation, transparency, immutability, and anonymity create an ideal environment for this scam to grow [43]. While in traditional Ponzi schemes, scams can often be stopped, scammers get caught by the authority and compensations can be paid to the victims, in a blockchain environment, once a smart contract is up and running, it can’t be stopped unless some preinstalled conditions are met, and scammers can stay entirely anonymous and withdraw money without revealing their identity. As a result, the scammers can often get away and the investments are permanently lost. Finally, the fact that the working logic of Ponzi schemes are immutable and publicly available on the chain for everyone to see can create a false sense of trust in the schemes among novice investors, making them fall prey to the scammers.
In layman term, Ponzi schemes are scams often camouflaged as high-return investment programs that use the funds from the later investors to pay the existing ones. With no real project behind and no intrinsic value, a Ponzi scheme will eventually collapse when there are not enough new investors joining and/or the payment commitment can no longer be fulfilled. A more official and authoritative definition of Ponzi schemes is given by the U.S. Securities and Exchange Commission [53]. At the hear of each Ponzi scheme is a money redistribution mechanism. Bartoletti et al. [3] classified Ponzi schemes on Ethereum into four different categories based on their redistribution mechanisms as follows.
Chain-shaped schemes use a linear money distribution mechanism. These schemes often commit to paying investors a multiple, e.g., double, of their original investments. Each new investor joining the scheme is appended to a payment list in their order of arrival. Each investor in the list is paid in full with their promised amount whenever the accumulated fund (minus some commission fee) is sufficient. These schemes will collapse when the investment becomes too large to fulfill and the waiting time of late comers grows.
Tree-shaped schemes use a tree structure to manage the money redistribution, in which an inviter is a parent node, and the invitees are their children. Once a new investor joins the scheme, his investment is split and distributed among the ancestors: the nearer an ancestor is, the more he will receive. In this type of Ponzi scheme, investors cannot guess how much they will gain because their profit depends on how many users they and their descendants can invite and also how much these users pay. Similar to other schemes, tree-shaped Ponzi collapses when there are no or too few users joining.
Handover schemes, like Chain-shaped schemes, also use a linear payment list. However, instead of gathering newcomers’ investments, these schemes require the entry toll, which increases every time a new user joins this scheme. At a time, only one user is invited by the last user in the list, and the new entry toll is paid entirely to the inviter to make an instant profit. Once the inviter is paid, he hands the privilege over to the following user who just came.
Waterfall schemes are similar to chain-shaped schemes in payment order but different in money distribution logic. Every new investment is distributed along the list of existing investors from the first to the last or until the fund is exhausted. This first-join-first-receive logic implies that the later joining investors are less likely to reap any profit.
2.3 Related Works
Detecting scams on blockchain systems is crucial to making a secure trading environment for crypto-investors and providing a favourable development environment for potential decentralized applications (D-apps). Existing Ponzi detection models (on Ethereum) can be divided into two groups, depending on whether they rely on smart contract codes or on the transactions.
Contract-Code-Based Approaches: A contract source code reflect the working logic used in an application. Therefore, Bartoletti et al. [3] proposed four criteria to detect the contract of a Ponzi application. As a result, 184 different Ponzi schemes on Ethereum were detected manually by scanning their source codes. Finally, based on the detected Ponzi list, a comprehensive analysis was conducted to highlight the various characteristics of Ponzi schemes.
However, it turns out that the original source codes of 77.3% contracts on Ethereum are not available (see Zhou et al. [72]). To tackle this drawback and to detect Ponzi automatically, many researchers built Ponzi detection tools based on the frequency distribution of operation codes (opcodes), which are always available on the Ethereum chain. Chen et al. proposed an automatic detection tool on opcode features using machine learning models XGBoost [16] and Random Forest [17]. Their experimental results showed that the detection models using opcode features achieved greater performance than those using account features, which were aggregated from transactions. Finally, using both types of features provided the best performance in their work.
Further improvements were proposed to improve the detection accuracy. Fan et al. [28] pointed out that an imbalanced dataset caused an overfit in previous models [16, 17]. Hence, to improve data quality and the detection accuracy, they proposed a data enhancement method that expanded the dataset and eliminated the imbalance. Additionally, Wang et al. [63] adopted a deep learning technique to build a more accurate detection tool. Their study also used oversampling techniques (Smote and Tomek) to deal with an imbalanced dataset. There were also other studies that focused more on crafting better representative features rather than improving model’s performance or data quality. Jung et al. [39] aggregated more sophisticated account features and combined them with opcode features to build a new detection model with high accuracy. Sun et al. [54] introduced a behaviour forest algorithm that first builds a behaviour tree from the contract’s opcodes to represent continuous behaviours of the smart contract and then measures the similarity between contracts to detect a Ponzi scheme at an early stage.
While the various aforementioned studies focus on improving detection accuracy, their methods’ robustness has been overlooked. Indeed, as demonstrated by Chen et al. [15], scammers can use code obfuscation techniques [8] to counter those detection models relying on opcode features (see [15, Section 7.2.1]). For example, a contract code can be manipulated or modified to change the opcode occurrence frequency. Chen et al. [15] also proposed in their work a new detection tool called SADPonzi, which was built upon a semantic-aware approach and achieved the best performance with Precision and Recall reaching 100%. SADPonzi was proven to be more robust than the current opcode-based method when facing code obfuscation techniques. More specifically, it can detect a Ponzi contract by comparing the extracted semantic information of its bytecode and the predefined semantics of four known Ponzi schemes. However, the approach of SADPonzi requires a domain expert to analyze a Ponzi application’s operational logic to build the corresponding semantic pattern, which can be costly to put into practice. On top of that, as was also mentioned by the authors, SADPonzi can only effectively detecs known and well-defined Ponzi types with predefined semantics, and may fail to detect a new Ponzi variant (see [15, Section 8]).
Transaction-Based Approaches: Transactions are records that save historical activities between an application and its participants. Not surprisingly, in several studies [3, 16, 17], transaction data was used to capture the differences in behaviours between Ponzi and non-Ponzi applications. Unlike the models using opcode features, the detection tools built on transaction data are more resilient to scammers’ countermeasures because transaction information cannot be modified or deleted from the chain. Although scammers can add transaction records, they cannot manipulate transaction data as freely as they can with smart contract’s source code and opcodes for two reasons. First, any participant, not just the creator, can create transactions, which is out of control of the contract creator. Second, the cost to create a transaction on the chain is not cheap (approximately $14.26 on average for each transaction in 2022 [58]). Thus, manipulating the data of a Ponzi application to avoid detection by flooding the system with extra transactions is infeasible or at least very costly to do.
Although there are a few works in the literature that studied models based on features extracted from the transaction data only (e.g., account features), they all achieved low accuracy [16, 17, 15]. This is because account features are often extracted from all transactions in a contract’s lifetime, which only provides general, time-independent information such as the final balance, the number of transactions, or the number of users. The scam behaviours, which are indicated by the change of information throughout a Ponzi’s timeline, however, cannot be captured entirely by those features. To improve the detection accuracy, some studies [16, 17, 39, 63] have integrated these account features with opcode features. However, this hybrid approach also inherits the shortcomings of the contract-code-based approach. Thus, to maintain the robustness of the transaction-based approach, we should only use transaction data to build detection models and at the same time should identify more informative features to increase the detection accuracy. More specifically, we proposed time-dependent features alongside account features to improve the detection capability of the transaction-based models. This is the key idea of our work.
3 Data collection, analysis and features aggregation
3.1 Data Collection
We first need a reliable dataset to build an effective feature list and accurate transaction-based detection models. Although previous studies introduced some benchmarks, most of them are contract-based datasets. We collected data (Ponzi/non-Ponzi contract addresses and their associated transactions) following the process described in Fig. 1. It is worth noting that each Ponzi application is often implemented by a single smart contract. Therefore, we can retrieve all transaction data of an application by collecting all transactions sent from and to the application’s contract.
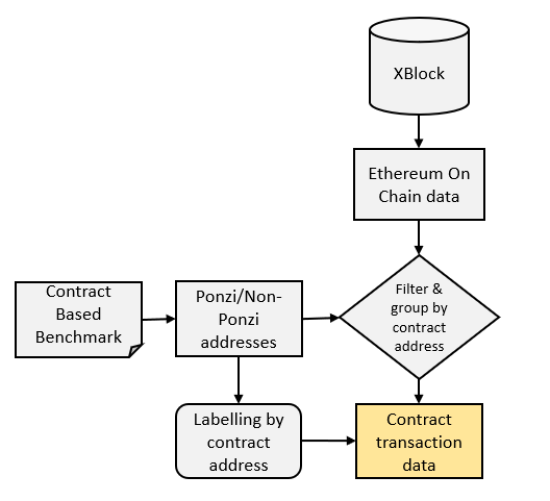
As depicted in Fig. 1, we first gathered contract addresses of known Ponzi and non-Ponzi applications. The Ponzi contract address list was created originally by [3], which contains 184 verified Ponzi contracts active from 2015 to 2017. However, 25 duplicated contracts and 26 other misclassified Ponzi contracts in this list were filtered out by [15]. Thus, we have only 133 valid Ponzi contracts left. Moreover, we also reused 1262 non-Ponzi contract addresses in the dataset of [15], which were collected from top-ranked DApps on the DApps ranking website [21]. Those top decentralized applications were ranked by the number of active users, daily transactions, and daily trading volume, which means that they have been used by thousands of users in the community and are very unlikely to be scams. Thus, as the first step, we gathered from the literature 1395 applications’ contract addresses, 133 among which are Ponzi. Next, we downloaded transactions associated with these applications, analyzed them, and refined our dataset further to include only 79 Ponzi and 1182 non-Ponzi applications, as explained below.
We downloaded processed Ethereum on-chain data from the XBlock-ETH repository [71, 68] and extracted relevant data associated with the aforementioned 1395 contracts. Note that the authors of XBlock-ETH first gathered raw blockchain data from Ethereum, including blocks, traces, and receipts, and then, processed and categorized data into seven different datasets: Block, Block Transaction, Internal Transaction, Contract Info, ERC20 Transaction, ERC721 Transaction, and Token Info. We are only interested in the Block Transaction dataset and the Internal Transaction dataset. All relevant transactions in the first 10 million blocks (from July 2015 to May 2020) were retrieved, including transactions of Ponzi applications and non-Ponzi applications. Note that the contract addresses of interest (1395 in total) can be found in the FROM or TO address fields of the transactions.
As the final step in the refinement of our dataset, we filtered out unsuccessful transactions which failed for various reasons such as insufficient gas or errors in the contract codes. Those transactions were removed because there was no activities occurring following those calls. Moreover, we also discarded inadequate applications to enhance our dataset. Those applications were eliminated because their number of transactions were too low (one or zero transaction) or their lifetime is shorter than one day. These are outliers and their behaviours are not the same as the common behaviours of the whole group. Even if such an application is a Ponzi scheme, it is also a failed one. Therefore, removing those applications is important to build a clean dataset, especially for a transaction-based approach. As a result, our finally dataset contains 1182 non-Ponzi applications and 79 Ponzi applications. The statistics by Ponzi types in our dataset are displayed in Table 1.
| Ponzi type | Number of applications | Percentage |
|---|---|---|
| Chain-shaped | 68 | 86% |
| Tree-shaped | 1 | 1.3% |
| Handover | 1 | 1.3% |
| Waterfall | 4 | 5% |
| Other | 5 | 6.4 % |
3.2 Data Analysis
In this section, we study how Ponzi applications work and demonstrate how time-dependent characteristics
can help discriminate Ponzi applications. To this end, we analyze the historical transaction data of DynamicPyramid, a representative Ponzi contract2220xa9e4e3b1da2462752aea980698c335e70e9ab26c (DynamicPyramid’s address). This is a chain-shaped scheme, the most popular type, which constitutes 86% of all known Ponzi contracts.
The analysis of one Ponzi scheme and one non-Ponzi scheme is sufficient to emphasize the importance of the time dimension in detecting Ponzi applications, while avoiding the risk of overfitting when the model development relies too heavily on the known types of the scams and may fail to detect unknown types in the future.
In general, different types of applications have different transaction behaviours, and understandably, Ponzi applications have unique behaviours that are different from non-Ponzi ones. We note that all Ponzi applications in our dataset have been already analyzed in [3]. However, they did not perform the same analysis on non-Ponzi applications to show the differences between them. In our analysis, we compare the representative applications of the two groups to demonstrate their differences regarding temporal behaviours.
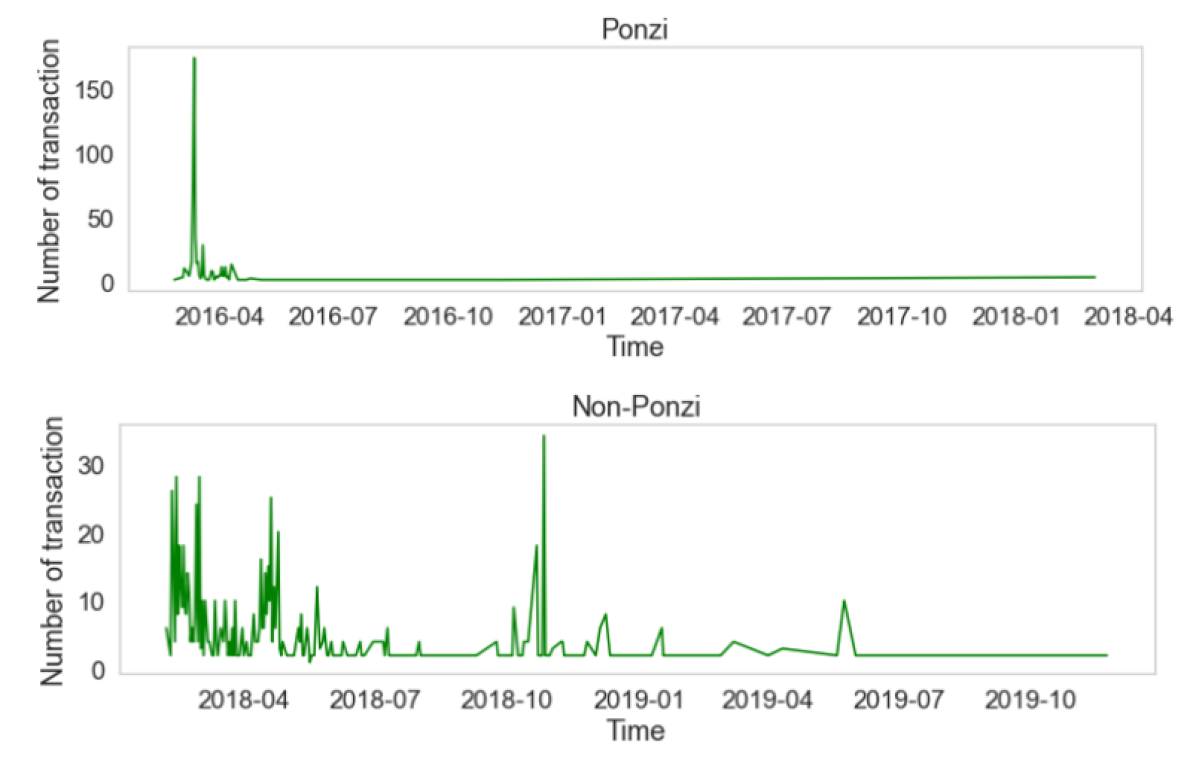
Transaction volumes. We start our analysis by comparing the transaction volumes of a Ponzi application (DynamicPyramid) and a non-Ponzi application3330xb2c3531f77ee0a7ec7094a0bc87ef4a269e0bcfc (a non-Ponzi contract address). The transaction volume of an application measures the daily number of associated internal and external transactions. As observed in Fig. 2, the Ponzi application had a shorter lifespan with a peak transaction volume concentrating in the first month followed by almost no activities. In comparison, the non-Ponzi application had more regular activities throughout its long lifespan. It is because a Ponzi application often introduces itself as a potential project with a high investment return promise. However, there is no actual project behind it. Thus, participants of Ponzi applications often work actively at the beginning since the application pays them regularly. However, when the number of participants increases, it is impossible for the application to pay a large proportion of members. This results in members leaving the application and the scheme collapses.
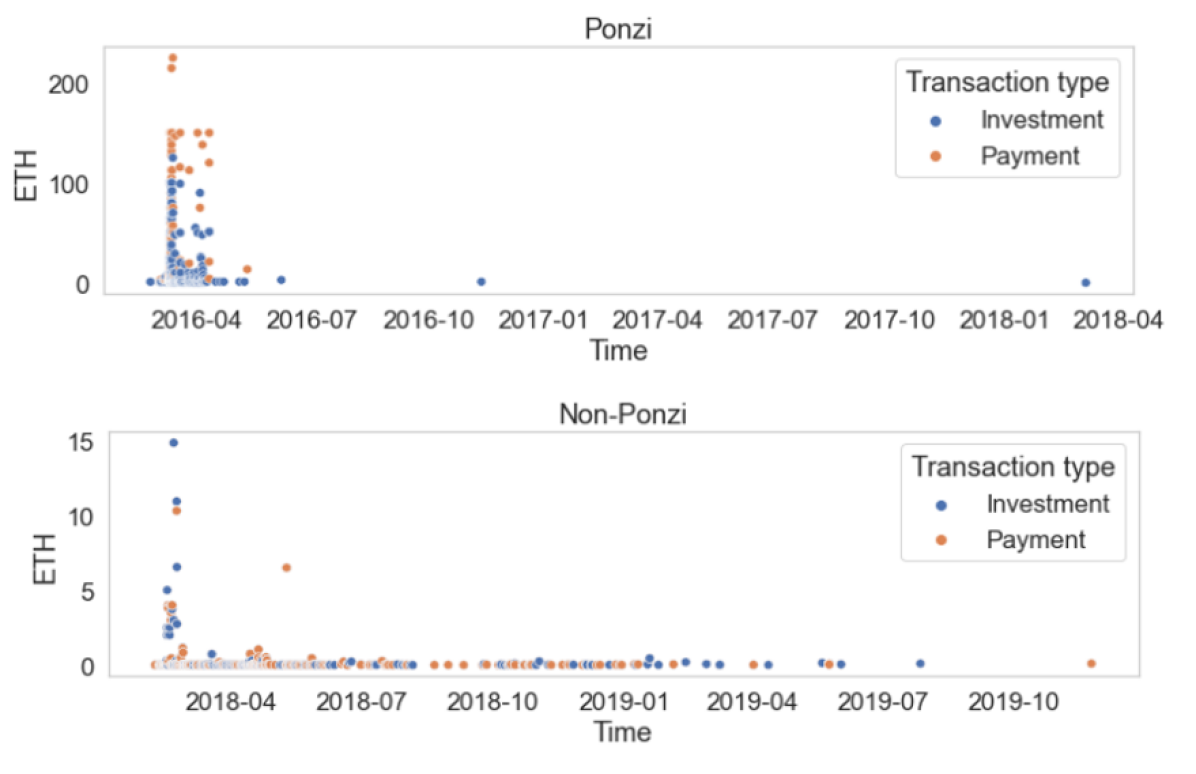
Investment versus payment activities. Pushing our analysis one step further, we break down transactions into two different types, namely, investments and payments.
An investment refers to a transaction sending ETH from an investor to an application, whereas a payment refers to a transaction from an application that pays ETH to an investor.
As demonstrated in Fig. 3, payments (orange dots) and investments (blue dots) of the Ponzi application concentrated only in the first month. Moreover, each orange dot was preceded by some blue dots of smaller ETH amounts. This is because the examined Ponzi application, a chain-shaped scheme, must gather sufficient new investment funds before making a payment to a single participant. After this intensely active period, the number of payments decreased and finally disappeared, despite a few new investments going into the application. This happened because the application’s balance was no longer enough to make any new payment. On the contrary, the activities spread out over the life of the non-Ponzi application and the payment amount is often equal to or less than the investment amount.
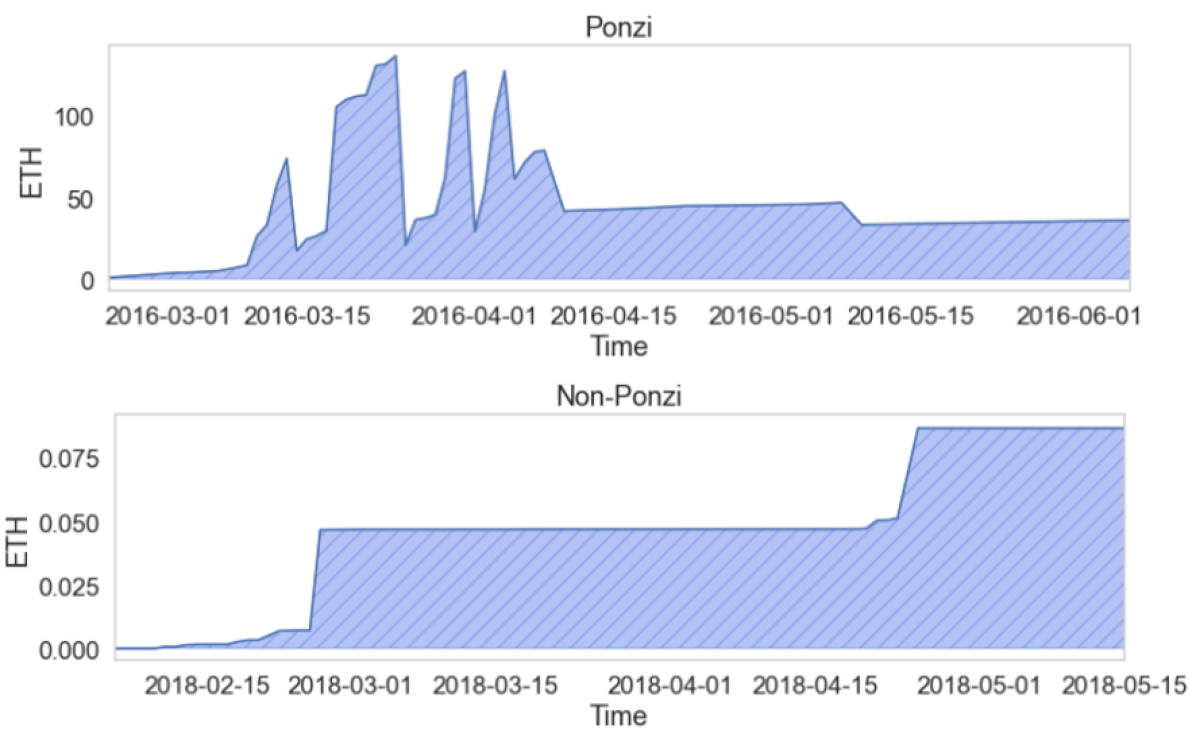
Application balance. The balance of an application is the amount of ETH in the application at the time. How the balance varies as time goes by can indicate the type of application. As demonstrated in Fig. 4, the balance of the Ponzi application (Dynamic Pyramid) often rose gradually (investments), and after a while, dropped dramatically and created a “cliff” (payment). This is because the balance was gradually accumulated from the investments until reaching the amount that the application has committed to pay to a particular investor when he joined the application. Once the desired balance was reached, the promised profit was immediately paid to the corresponding investor.
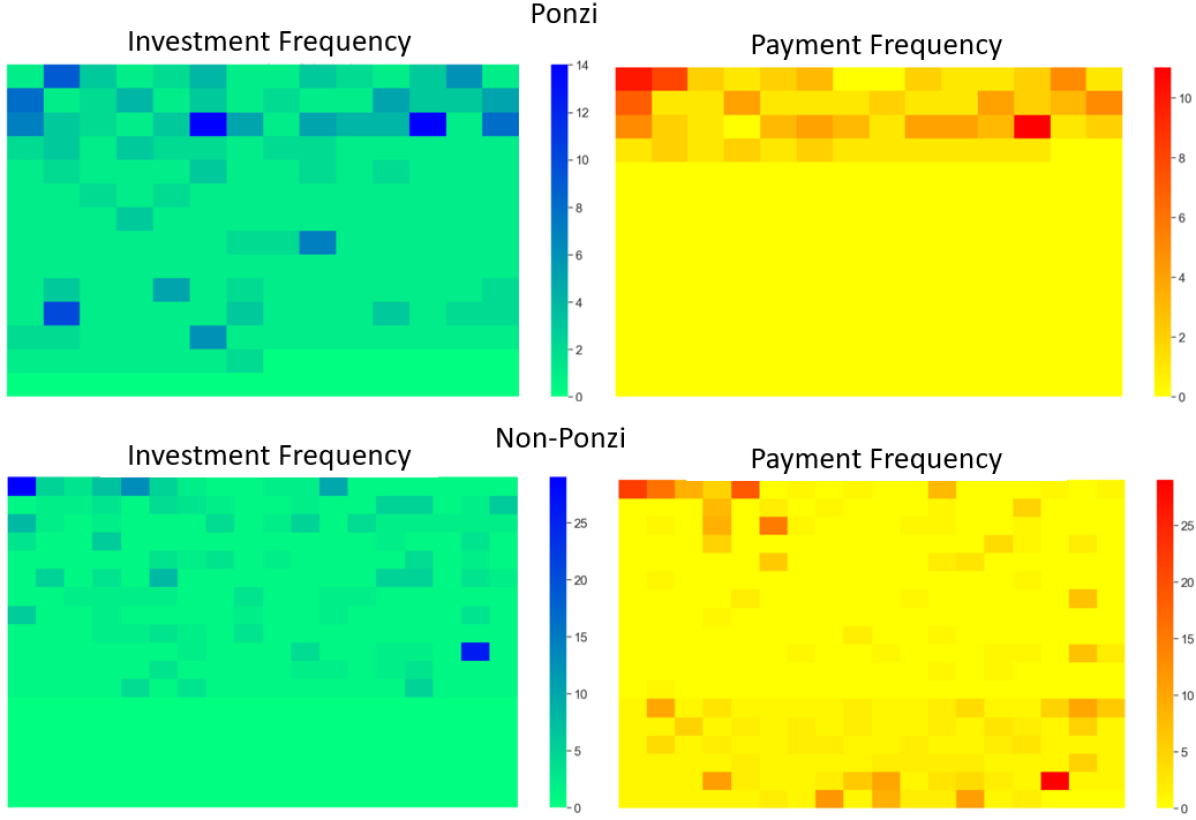
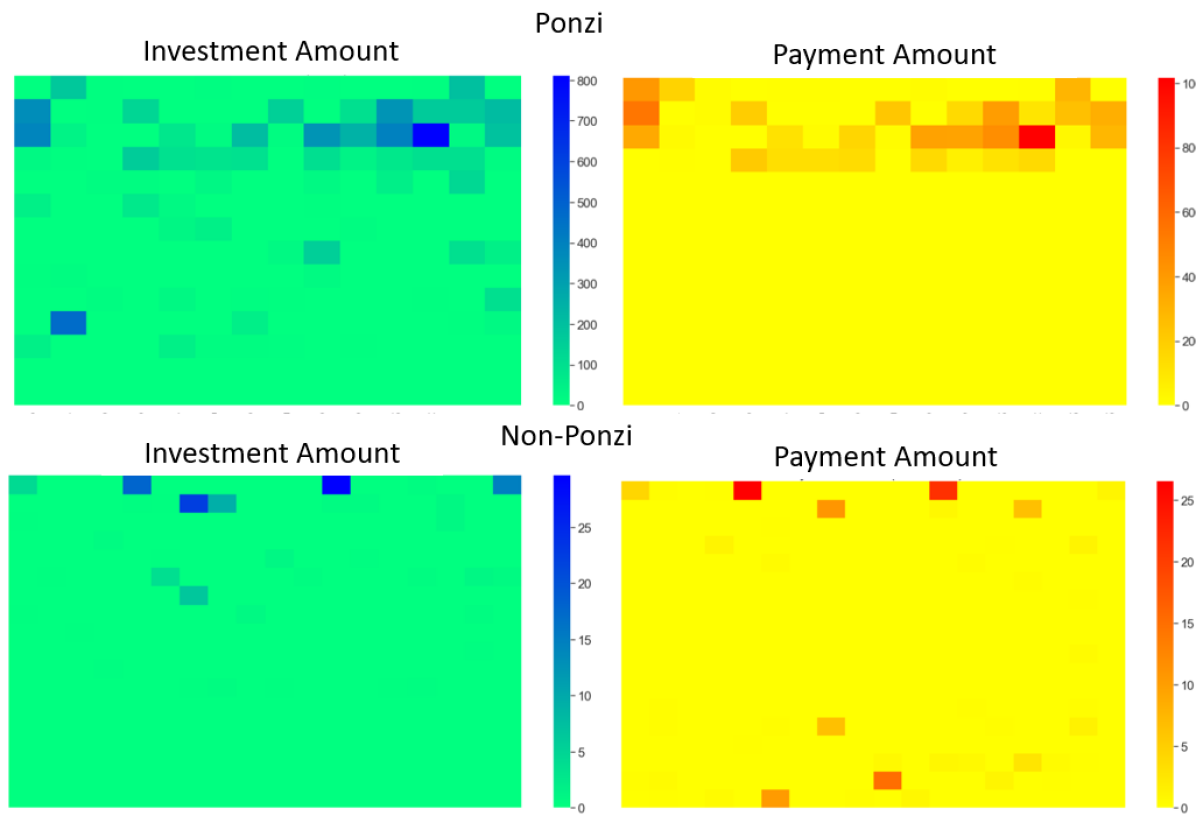
Investment and payment frequencies/amounts. Apart from the contract-centric data mentioned above, user-centric data is also essential in distinguishing the Ponzi behaviours. Fig. 5 shows the frequencies of investments (blue heat map) and payments (red heat map) of Ponzi and non-Ponzi applications’ participants. More specifically, the frequency represents the number of times each investor (corresponding to a square in the map) invested or got paid. Fig. 6 demonstrates the investment amounts (blue heat map) and payment amounts (red heat map) for all investors. The two sub-figures of the Ponzi application (DynamicPyramid) in both figures indicate that the earlier an investor joined the application the higher chance he would receive a payment. More specifically, the Ponzi application paid most early investors and none to the late investors, including those who invested heavily but joined late. On the other hand, the two sub-figures of the non-Ponzi application show that the payment frequencies and amounts do not depend on the order the users joined the application. In fact, a large number of users who came in late but still received payments regularly regardless of the number of times they invested.
3.3 Transaction-Based Features
In the literature, the only type of transaction-based features used so far, often referred to as account features, are based on general statistics of the transactions, e.g., the total/average investment amount, the final balance of the contract, or the maximum number of payments to an investor, etc. (see Appendix A for the complete list). Using account features alone led to low detection accuracy, as reported in various works in the literature. This isn’t a surprise, given that the temporal dimension has been completely neglected in the existing works. The discussion in Section 3.2 clearly demonstrates that the temporal dimension is essential in studying the behaviours of Ponzi and non-Ponzi schemes, and shouldn’t be ignored. Using a combination of account and time-dependent features proposed in our work is a natural way to improve the accuracy of the detection models. We also show later in Section 4.3 that even using the time-dependent features alone can already improve the detection accuracy compared to account-feature-based approaches. Both types of features are discussed in detail below.
Account features: This type of features has been widely used in previous studies [16, 17, 39, 63]. These features capture general information about the contract of interest.
More specifically, general statistic metrics such as average, count, sum, standard deviation, and Gini coefficient444The measure of wealth inequality in a social group. A Gini coefficient of 0 indicates perfect equality, while a Gini coefficient of 1 indicates perfect inequality. [66] can be extracted from the set of all relevant transactions to aggregate account features. Although insufficient to capture all behaviours of the Ponzi scheme, account features are still useful in expressing the scam’s working logic. For example, the Gini coefficient of the number of payments can demonstrate an inequality in money distribution, or the final balance of the application indicates whether the investment funds have been distributed all to investors. Therefore, in our investigation, we still include account features introduced in the literature [17, 16, 39, 63], which are listed in Appendix A.
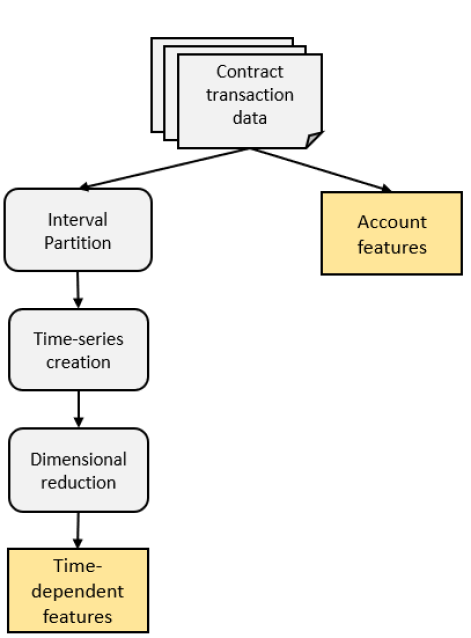
Time-dependent features: As discussed earlier, time-dependent features play an important role in identifying Ponzi applications. Unlike account features, they capture the behaviours and activities throughout the application’s lifetime. To aggregate time-dependent features, we first partitioned our transactions into several time intervals (days), and built 43 time-series that measure various aspects of the transactions, e.g., the total number of incoming transactions or the total amount of money the contract received from user addresses during each interval. These times series form three dimensions, namely, the contract address, the interval, and the data value for that contract in that interval (e.g., account balance). In order to use the time-series data alongside the account features, which are only two-dimensional (contract address and data value), in a single detection model, we then use a dimensionality-reduction technique to compress the 3-dimensional time-series data into the 2-dimensional data, producing the final time-dependent features. We discuss both tasks in detail below (see Fig. 7 for the general feature aggregation process).
To create the time-series, we following the following steps.
-
1.
For a fixed time duration , one day in our case, we split our transaction data into time intervals of length each where
-
2.
Based on the timestamp field, we assigned each transaction to its corresponding interval.
-
3.
We created 43 time-series (see Appendix B for the complete list), which were aggregated using the eight basic data fields of a transaction listed in Section 2.1 together with data derived from them. These data are comprehensive enough to represent any activities that occur during the application’s lifetime. Thus, for each application, the time-series can be represented as a 2-dimensional matrix of size . Lastly, if the dataset has applications, the time-series data extracted from the whole dataset can be represented as a 3-dimensional array with size .
Finally, to generate 2-dimensional time-dependent features to used together with the account features in the same model, we employed a dimensionality-reduction technique to compress the time-series data. To classify multivariate time-series variables, Blázquez-García et al. [9] introduced a number of techniques, including dimensionality-reduction and dissimilarity-based techniques. The former aims to reduce the dimensionality of the input multivariate time-series into a set of uncorrelated variables [34] while the latter directly analyzes the pairwise dissimilarity between the time-series [42, 50, 5]. In our research, we used a dimensionality-reduction technique to reduce the time dimension of the time-series. In particular, we employed a finite set of 12 statistical measures (see Appendix C) proposed in the previous studies (see, e.g., [34, 65, 23, 30]) to capture the global information of the time-series. By applying these 12 measures to the 43 time-series, we compressed the 3-dimensional time-series data downto a 2-dimensional matrix (note that ).
The Python codes used to aggregate and process features from the downloaded transactions are available online at [1].
3.4 Detection Models
In this research, to measure the effectiveness of our proposed time-dependent features, we reused classification methods employed in the previous studies [39, 16], namely, Random Forest (RF) [55] and XGBoost (XGB) [14]. In addition, other well-known classification methods such as -nearest neighbor (KNN) [20], Support vector machine (SVM) [33], and LightGBM (LGBM) [40] were also included in our experiment in order to find the most suitable classification model for the problem. The details of each classification model is listed below.
-
•
Random Forest (RF) is a computationally efficient classification algorithm that works effectively in several domains [51] including fraud detection[7]. A key idea of this algorithm is to use the Bootstrap resampling technique to generate different training decision trees by repeatedly sampling samples from the original dataset. Finally, a better result is achieved by aggregating the predictions from all trees in the forest.
-
•
XGBoost (XGB) is a gradient-boosting based algorithm that creates gradient-boosted decision trees in sequential form and then groups these trees to form a strong model. Unlike RF, which aggregates the results from all trees to get the final result, the result of XGB is the prediction of the last model, which addressed data misclassified from previous models.
-
•
-nearest neighbour (KNN) is a non-parametric classifier that uses proximity to estimate the likelihood that a data point will become a member of one group.
-
•
Support vector machine (SVM) is an algorithm that performs classification by achieving a hyperplane that enlarges the border between two categories in an multi-dimensional feature space. We include this classifier in our experiment because this method has been widely applied in binary classification problems or fraud detection problems.
-
•
LightGBM (LGBM) is also a gradient-boosting-based algorithm similarly to XGB. However, LGBM grows a tree vertically (leaf-wise) while XGB grows trees horizontally (level-wise). With leaf-wise algorithms, LGBM often has better accuracy and faster training time than other gradient-boosting-based algorithms.
4 Experiments
4.1 Model Structure and Experiment Setting
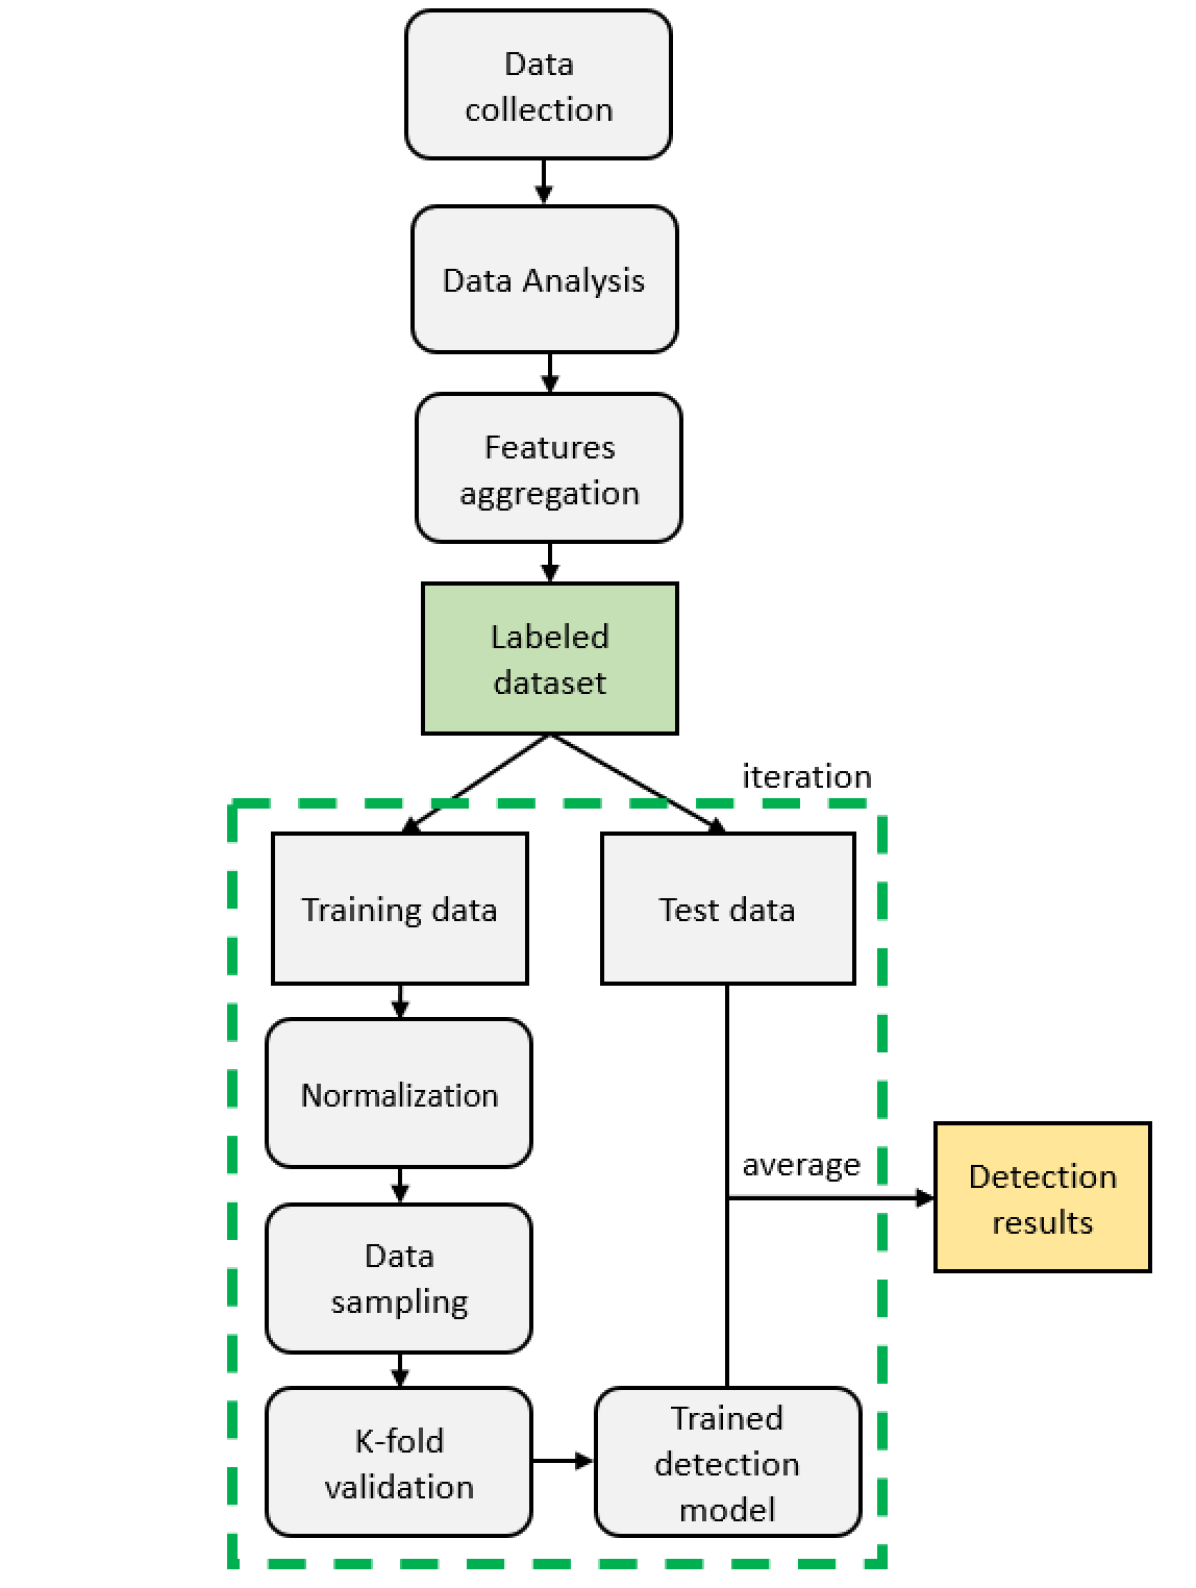
We describe in Fig. 8 the overall transaction-based detection workflow. After the Data collection, Data analysis, and Feature aggregation steps were done (see Section 3), two groups of features, namely, account features and time-dependent features, were produced. These two groups were used both separately and together in different detection models. The dataset consisting of 79 Ponzi and 1182 non-Ponzi applications and their feature groups were split into a training set (80%) and a test set (20%).
In our data collection, the ratio of Ponzi and non-Ponzi applications is 79:1182, which means Ponzi applications only occupy 6% of total applications. Therefore, we applied data sampling techniques to balance our dataset. We adopted the well-known oversampling method Borderline-SMOTE [31] to generate new Ponzi instances that have more than half of the K nearest neighbours being non-Ponzi applications. That helps to enhance the existence of Ponzi applications that are more likely to be misclassified as they are located near the border of the two classes. However, if we generate too many Ponzi samples, it may cause overfitting in our model. Therefore, instead of generating Ponzi applications up to the same number of non-Ponzi applications, we only generated the number of Ponzi samples to some extent and then applied the random undersampling method to reduce the bias on the non-Ponzi class samples.
After the dataset is balanced, the -fold cross-validation method was used to train the selected classifier on the training set. More specifically, the training set was divided into subsets of the same size, and a detection model is also run times. At each iteration, one of the subsets was sequentially picked as validation data for validating our model performance. In contrast, the remaining subsets were all used as training data for building a model. In our experiment, we only set = 5, which is lower than common practice in the literature because our dataset is small. Finally, a trained model was used to classify the applications in the unseen test dataset. To make our test result more reliable, we repeated the experiment process 500 times, and the final result was obtained by taking the average. It is worth mentioning that the same hyperparameters were used for the same models to make a fair comparison.
The Python codes of our models are available online at [1].
4.2 Evaluation Metrics
We use standard metrics to evaluate the accuracy of the detection models in our experiments. Hereinafter, the numbers of true positives (TP), true negatives (TN), false positives (FP), and false negatives (FN) (see Table 2) are used for calculating the Accuracy, Precision, Recall, and F1-score.
-
•
Accuracy: the fraction of correct predictions.
-
•
Precision: the fraction of the actual scams out of all the predicted scams by the method.
-
•
Recall: the fraction of detected scams among all actual scams.
-
•
F1-score: the harmonic mean of Precision and Recall.
| Predicted Ponzi | Predicted non-Ponzi | |||||
|---|---|---|---|---|---|---|
| Ponzi |
|
|
||||
| non-Ponzi |
|
|
4.3 Experimental Results
We conducted three experiments to demonstrate the advantages of using our proposed time-dependent features.
Experiment 1 (Performance comparison). In this experiment, we aimed to compare the performance of our proposed models using the new features with the existing approaches. As already mentioned, most of the previous studies used either opcode features or both opcode features and account features to build their detection models. Only a few works attempted a transaction-based approach (without using opcode features) separately [16, 39]. To have a fair comparison, we aimed to reproduce those experiments on our dataset and use them as the baselines. However, their codes and feature data haven’t been released to the community. Thus, we reimplemented those models based on the details provided in their papers, including the lists of features and classification algorithms.
We would like to emphasize that the F1-score we obtained for the model used in [16] is actually higher than what was reported in their paper (54% versus 44%). However, we couldn’t reproduce the very high scores reported in [39]. We are not completely sure of the reason for this discrepancy. However, we note that the authors of [15] also encountered the same issue: they reimplemented the approach in [39] and achieved similar F1-score as ours (66% versus 68.8%). This could be due to the fact that in both [15] and our paper, we started from the same dataset of 1395 Ponzi and non-Ponzi schemes, while in [39], the authors used a different set that includes 3203 non-Ponzi addresses. Unfortunately, it was not clear in their paper how these addresses were collected and hence, we couldn’t recreate their dataset. We also noticed that although the bytecode size (size_info) was created from the smart contract bytecode, it was listed among the top eight important transaction-based features listed in [39, Table 2]. This makes their detection model depend on contract code as well and therefore is susceptible to opcode obfuscation techniques [15, 8]. In our experiment to reproduce their transaction-based model, we ignored this irrelevant (contract-code-based) feature size_info.
A comparison of various scores of our models and the baselines are provided in Table 3. We have the following observations.
- 1.
-
2.
Second, even with the time-dependent features alone, our detection model already achieved higher F1-score than the baselines. Moreover, ours also achieved higher Recall values. By definition, a higher Recall value means our approach can detect more Ponzi cases than the baseline approaches.
-
3.
Third, among the attempted classification algorithms, we noticed that gradient-boosting classifiers were more efficient in Ponzi detection than others. XGBoost (XGB) and LightGBM (LGBM) achieved better F1-score values than other classifiers, even though we only used time-dependent features. Following Table 3, LightGBM, using both time-dependent and account features, provided the best outcome not only in the F1-score but also in Accuracy and Precision.
| Approaches | Features | Classifier | Accuracy | Precision | Recall | F1-score |
| Jung et al. [39] | Account | Random Forest | 0.965 | 0.811 | 0.612 | 0.688 |
| Chen et al. [16] | Account | XGBoost | 0.948 | 0.620 | 0.487 | 0.537 |
| Our approach | Time-dependent | Random Forest | 0.963 | 0.702 | 0.765 | 0.725 |
| Time-dependent + Account | Random Forest | 0.970 | 0.751 | 0.806 | 0.771 | |
| Time-dependent | XGBoost | 0.964 | 0.701 | 0.780 | 0.731 | |
| Time-dependent + Account | XGBoost | 0.974 | 0.784 | 0.831 | 0.801 | |
| Time-dependent | KNN | 0.914 | 0.420 | 0.879 | 0.563 | |
| Time-dependent + Account | KNN | 0.915 | 0.422 | 0.886 | 0.567 | |
| Time-dependent | SVM | 0.879 | 0.342 | 0.936 | 0.496 | |
| Time-dependent + Account | SVM | 0.884 | 0.352 | 0.938 | 0.507 | |
| Time-dependent | LightGBM | 0.967 | 0.721 | 0.781 | 0.743 | |
| Time-dependent + Account | LightGBM | 0.977 | 0.811 | 0.845 | 0.822 |
Experiment 2 (Contribution of time-dependent features). Next, we conduct another experiment to investigate how much the newly proposed time-dependent features contributed to our top model’s performance. To this end, we first retrieved the list of features’ importance from the LGBM model in the previous experiment. The importance of a feature in the LGBM model is defined to be the number of times this feature is used to split the data across all decision trees. In LGBM, an effective feature selection technique, namely Exclusive Feature Bundling (EFB), has been adopted to reduce the number of features without affecting the model’s performance. We found from the outcome of the LGBM detection model that only 200/541 features (516 time-dependent features and 25 account features) had been used at least once to build a tree in the LGBM detection model. More specifically, these 200 important features consist of 175 time-dependent features and all 25 account features. We sorted these 200 features in descending order of importance. After that, we reran the detection experiment with an LGBM model using only the most important features among the 200. The experimental results shown in Fig. 9 demonstrate how the F1-score values of the prediction were improved as more time-dependent features were used in the model. We can also observe in the bottom sub-figure that while the top five most important features are all account features, from the top 10 onward, time-dependent features start to appear. For example, the top 30 contains 16 account features and 14 time-dependent features.
As can be seen from Fig. 9, the F1-score sharply increases when we increase the number of features, especially at the beginning. According to the top sub-figure of Fig. 9, the value of the F1-score exceeds 0.8 when at least 30 features out of 200 most important features are used, reaching a peak at 0.826 with the top 90 features. Then, the F1-score values fluctuate around 0.820 as the number of features further increases. As shown in the bottom sub-figure of Fig. 9, the percentage of time-dependent features in the important feature list increases in the same direction as F1-score and over 50% when the F1-score is over 0.8. It proves that our proposed time-dependent features have significantly contributed to the performance of LGBM, the best-performing classification model in Experiment 1.
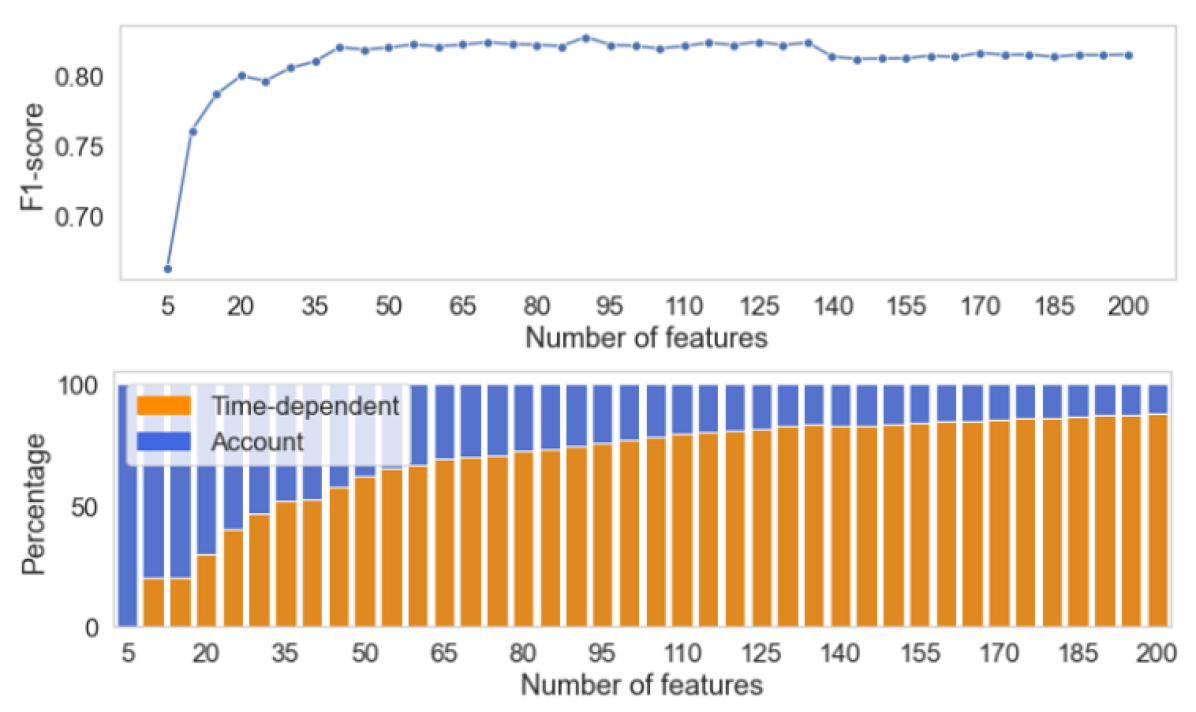
. The F1-score value increases as more time-dependent features are used in the feature list, demonstrating the effectiveness of using time-dependent features.
| Test candidate | Scam rate | #Ponzi | #non-Ponzi | Accuracy | Precision | Recall | F1-score |
|---|---|---|---|---|---|---|---|
| Waterfall | 100% | 4 | 0 | 0.91 | 1.0 | 0.91 | 0.94 |
| 50% | 4 | 4 | 0.94 | 0.98 | 0.89 | 0.93 | |
| 6% | 4 | 62 | 0.97 | 0.79 | 0.89 | 0.83 | |
| Tree-shaped | 100% | 1 | 0 | 1.0 | 1.0 | 1.0 | 1.0 |
| 50% | 1 | 1 | 0.99 | 0.99 | 1.0 | 0.99 | |
| 6% | 1 | 15 | 0.98 | 0.87 | 1.0 | 0.91 | |
| Handover | 100% | 1 | 0 | 0.97 | 0.97 | 0.97 | 0.97 |
| 50% | 1 | 1 | 0.97 | 0.94 | 0.95 | 0.94 | |
| 6% | 1 | 15 | 0.98 | 0.80 | 0.94 | 0.85 | |
| All of above | 100% | 6 | 0 | 0.92 | 1.0 | 0.92 | 0.95 |
| 50% | 6 | 6 | 0.94 | 0.98 | 0.91 | 0.93 | |
| 6% | 6 | 94 | 0.98 | 0.80 | 0.91 | 0.84 |
Experiment 3 (Detecting a new type of Ponzi). To check whether our classification model using the proposed feature list can detect a new Ponzi type, we conducted the third experiment using the LGBM model as follows. The key idea is to train our model on some types of Ponzi schemes and test it on another type of Ponzi schemes to see if it can still accurately detect these schemes.
To achieve this, we first removed all applications for each known type of Ponzi schemes mentioned in Section 2.2 from our training set. The removed applications were then used in a test set for testing the trained model’s new Ponzi detection ability. However, we only removed each of the three Ponzi types (waterfall schemes, tree-shaped schemes, and handover schemes) or all three and not the chain-shaped schemes, which account for 86% of all the Ponzi schemes in the dataset. The reason is that if we remove all chain-shaped schemes, our model won’t have enough Ponzi samples to learn the scam’s behaviours. Furthermore, various test sets with different scam rates were introduced to test how our model performs in different situations, e.g., with a full-scam test set (100% scams), a balance test set (50% scams), and a few-scam test set (6% scams, similar to our entire dataset’s scam rate). Due to the lack of Ponzi applications, we can only decrease the scam rate by increasing the number of non-Ponzi applications in test sets. The same experimental settings were used in our experiments.
The results, demonstrated in Table 4, indicate that the detection model can detect over 89% of actual new Ponzi applications in a given test set (greater than 89% of Recall value in most cases). Moreover, the Precision value is approximately 80% even in few-scam test sets, and the model also achieved F1-score at least 90% in all cases. Although the dataset we have is not ideal in the sense that there are very few Ponzi applications of types other than the chain-shaped, which may affect the reliablity of our third experiment, the outcome still gives strong evidence that a completely new type of Ponzi scheme can still be detected by our model.
5 Conclusions and future work
Although the blockchain technology can provide great benefits to various industries, it also opens new opportunities for exploitation by scammers. Ponzi schemes, often advertised as high-yield investment projects, have stolen a large amount of money from investors globally.
In this study, we proposed a robust method for detecting Ponzi schemes in Ethereum using only the transaction data, which is hard to be manipulated by scammers. We proposed a list of effective features that reflect the scam natures, extracted from a careful analysis of the Ponzi and non-Ponzi schemes, in order to improve the detection accuracy of the transaction-based approach.
More specifically, our analysis showed that some characteristics of a Ponzi application depend on time and should be captured by time-series, representing the application’s behaviours and activities throughout its lifetime.
As such, we introduced a list of novel time-dependent features, extracted from these time-series, which help to significantly improve various performance metrics compared to the existing transaction-based approaches.
Our plan for future work is discussed below. First, although we have considerably increased the detection accuracy of transaction-based detection tools, there is still room for future improvement. Specifically, one open problem is to find more effective statistical measures to represent the global nature of time-series (other than the 12 measures we obtained from the existing works). Second, it is desirable to collect more data to extend the ground-truth dataset for Ponzi applications, which will help to train the detection models more effectively. Moreover, with more data, we can test our approaches on other popular machine learning algorithms that work effectively on big data such as Artificial Neural Networks (ANN) [64] or Recurrent Neural Networks (RNN) [45]. Finally, as time goes by, blockchain scams are becoming more sophisticated. For example, instead of simply using smart contracts to perform a fraud automatically, scammers may use multiple smart contracts or smart contracts from a third party as an additional service, making the picture much more complicated. In such cases, the application’s transactions might not be enough to perform fraud detection. Detecting such sophisticated scams remains a big challenge.
References
- [1] Python codes for this paper, 2022.
- [2] Artzrouni, M. The mathematics of ponzi schemes. Mathematical Social Sciences 58, 2 (2009), 190–201.
- [3] Bartoletti, M., Carta, S., Cimoli, T., and Saia, R. Dissecting ponzi schemes on ethereum: Identification, analysis, and impact. Future Generation Computer Systems 102 (2020), 259–277.
- [4] Bartoletti, M., Pes, B., and Serusi, S. Data mining for detecting Bitcoin Ponzi schemes. In 2018 Crypto Valley Conference on Blockchain Technology (CVCBT) (2018), pp. 75–84.
- [5] Beggel, L., Kausler, B. X., Schiegg, M., Pfeiffer, M., and Bischl, B. Time series anomaly detection based on shapelet learning. Computational Statistics 34, 3 (2019), 945–976.
- [6] Besançon, L., Da Silva, C. F., and Ghodous, P. Towards blockchain interoperability: Improving video games data exchange. In 2019 IEEE international conference on blockchain and cryptocurrency (ICBC) (2019), IEEE, pp. 81–85.
- [7] Bhattacharyya, S., Jha, S., Tharakunnel, K., and Westland, J. C. Data mining for credit card fraud: A comparative study. Decision support systems 50, 3 (2011), 602–613.
- [8] BiAn. a source code level code obfuscation tool developed for solidity smart contract, 2022.
- [9] Blázquez-García, A., Conde, A., Mori, U., and Lozano, J. A. A review on outlier/anomaly detection in time series data. ACM Computing Surveys (CSUR) 54, 3 (2021), 1–33.
- [10] Buterin, V. Ethereum: A next generation smart contract and decentralized application platform, 2014.
- [11] Casado-Vara, R., Prieto, J., De la Prieta, F., and Corchado, J. M. How blockchain improves the supply chain: Case study alimentary supply chain. Procedia computer science 134 (2018), 393–398.
- [12] Chainalysis. Crypto crime series: Decoding ethereum scams, 2019.
- [13] Chainalysis. The chainalysis 2021 crypto crime report, 2021.
- [14] Chen, T., and Guestrin, C. Xgboost: A scalable tree boosting system. In Proceedings of the 22nd acm sigkdd international conference on knowledge discovery and data mining (2016), pp. 785–794.
- [15] Chen, W., Li, X., Sui, Y., He, N., Wang, H., Wu, L., and Luo, X. SADPonzi: Detecting and characterizing Ponzi schemes in Ethereum smart contracts. Proceedings of the ACM on Measurement and Analysis of Computing Systems 5, 2 (2021), 1–30.
- [16] Chen, W., Zheng, Z., Cui, J., Ngai, E., Zheng, P., and Zhou, Y. Detecting ponzi schemes on ethereum: Towards healthier blockchain technology. In Proceedings of the 2018 world wide web conference (2018), pp. 1409–1418.
- [17] Chen, W., Zheng, Z., Ngai, E. C.-H., Zheng, P., and Zhou, Y. Exploiting blockchain data to detect smart ponzi schemes on ethereum. IEEE Access 7 (2019), 37575–37586.
- [18] Coinmarketcap. Cryptocurrencies ranking, 2021.
- [19] Coinmarketcap. Total cryptocurrency market cap, 2021.
- [20] Cover, T., and Hart, P. Nearest neighbor pattern classification. IEEE transactions on information theory 13, 1 (1967), 21–27.
- [21] Dapp.com. All dapp ranking, 2018.
- [22] De Filippi, P., Mannan, M., and Reijers, W. Blockchain as a confidence machine: The problem of trust & challenges of governance. Technology in Society 62 (2020), 101284.
- [23] Deng, H., Runger, G., Tuv, E., and Vladimir, M. A time series forest for classification and feature extraction. Information Sciences 239 (2013), 142–153.
- [24] Dinh, T. T. A., Liu, R., Zhang, M., Chen, G., Ooi, B. C., and Wang, J. Untangling blockchain: A data processing view of blockchain systems. IEEE Transactions on Knowledge and Data Engineering 30, 7 (2018), 1366–1385.
- [25] Dorri, A., Kanhere, S. S., and Jurdak, R. Towards an optimized blockchain for iot. In 2017 IEEE/ACM Second International Conference on Internet-of-Things Design and Implementation (IoTDI) (2017), IEEE, pp. 173–178.
- [26] Dutta, P., Choi, T.-M., Somani, S., and Butala, R. Blockchain technology in supply chain operations: Applications, challenges and research opportunities. Transportation research part e: Logistics and transportation review 142 (2020), 102067.
- [27] Ethereum. Solidity, 2015.
- [28] Fan, S., Fu, S., Xu, H., and Cheng, X. Al-spsd: Anti-leakage smart ponzi schemes detection in blockchain. Information Processing & Management 58, 4 (2021), 102587.
- [29] Fan, S., Fu, S., Xu, H., and Zhu, C. Expose your mask: Smart ponzi schemes detection on blockchain. In 2020 International Joint Conference on Neural Networks (IJCNN) (2020), IEEE, pp. 1–7.
- [30] Fulcher, B. D., and Jones, N. S. Highly comparative feature-based time-series classification. IEEE Transactions on Knowledge and Data Engineering 26, 12 (2014), 3026–3037.
- [31] Han, H., Wang, W.-Y., and Mao, B.-H. Borderline-smote: A new over-sampling method in imbalanced data sets learning. In International conference on intelligent computing (2005), Springer, pp. 878–887.
- [32] Hardin, T., and Kotz, D. Amanuensis: Information provenance for health-data systems. Information Processing & Management 58, 2 (2021), 102460.
- [33] Hearst, M. A., Dumais, S. T., Osuna, E., Platt, J., and Scholkopf, B. Support vector machines. IEEE Intelligent Systems and their applications 13, 4 (1998), 18–28.
- [34] Hyndman, R. J., Wang, E., and Laptev, N. Large-scale unusual time series detection. In 2015 IEEE international conference on data mining workshop (ICDMW) (2015), IEEE, pp. 1616–1619.
- [35] Ibba, G., Pierro, G. A., and Di Francesco, M. Evaluating machine-learning techniques for detecting smart ponzi schemes. In 2021 IEEE/ACM 4th International Workshop on Emerging Trends in Software Engineering for Blockchain (WETSEB) (2021), IEEE, pp. 34–40.
- [36] Investor.gov. Investor alert: Ponzi schemes targeting seniors, 2018.
- [37] Investor.gov. Investor alert: Ponzi schemes using virtual currencies, 2018.
- [38] Jaiman, V., and Urovi, V. A consent model for blockchain-based health data sharing platforms. IEEE access 8 (2020), 143734–143745.
- [39] Jung, E., Le Tilly, M., Gehani, A., and Ge, Y. Data mining-based ethereum fraud detection. In 2019 IEEE International Conference on Blockchain (Blockchain) (2019), IEEE, pp. 266–273.
- [40] Ke, G., Meng, Q., Finley, T., Wang, T., Chen, W., Ma, W., Ye, Q., and Liu, T.-Y. Lightgbm: A highly efficient gradient boosting decision tree. Advances in neural information processing systems 30 (2017).
- [41] Korpela, K., Hallikas, J., and Dahlberg, T. Digital supply chain transformation toward blockchain integration. In proceedings of the 50th Hawaii international conference on system sciences (2017).
- [42] Lara, J. A., Lizcano, D., Rampérez, V., and Soriano, J. A method for outlier detection based on cluster analysis and visual expert criteria. Expert Systems 37, 5 (2020), e12473.
- [43] Li, X., Jiang, P., Chen, T., Luo, X., and Wen, Q. A survey on the security of blockchain systems. Future Generation Computer Systems 107 (2020), 841–853.
- [44] Lin, C., He, D., Huang, X., Khan, M. K., and Choo, K.-K. R. Dcap: A secure and efficient decentralized conditional anonymous payment system based on blockchain. IEEE Transactions on Information Forensics and Security 15 (2020), 2440–2452.
- [45] Medsker, L. R., and Jain, L. Recurrent neural networks. Design and Applications 5 (2001), 64–67.
- [46] Morkunas, V. J., Paschen, J., and Boon, E. How blockchain technologies impact your business model. Business Horizons 62, 3 (2019), 295–306.
- [47] Nakamoto, S. Bitcoin: A peer-to-peer electronic cash system. Decentralized Business Review (2008).
- [48] Novo, O. Blockchain meets iot: An architecture for scalable access management in iot. IEEE internet of things journal 5, 2 (2018), 1184–1195.
- [49] Panarello, A., Tapas, N., Merlino, G., Longo, F., and Puliafito, A. Blockchain and iot integration: A systematic survey. Sensors 18, 8 (2018), 2575.
- [50] Rebbapragada, U., Protopapas, P., Brodley, C. E., and Alcock, C. Finding anomalous periodic time series. Machine learning 74, 3 (2009), 281–313.
- [51] Rokach, L. Decision forest: Twenty years of research. Information Fusion 27 (2016), 111–125.
- [52] Scholten, O. J., Hughes, N. G. J., Deterding, S., Drachen, A., Walker, J. A., and Zendle, D. Ethereum crypto-games: Mechanics, prevalence, and gambling similarities. In Proceedings of the Annual Symposium on Computer-Human Interaction in Play (2019), pp. 379–389.
- [53] Securities, U., and Commission, E. What is a ponzi scheme?, 2009.
- [54] Sun, W., Xu, G., Yang, Z., and Chen, Z. Early detection of smart ponzi scheme contracts based on behavior forest similarity. In 2020 IEEE 20th International Conference on Software Quality, Reliability and Security (QRS) (2020), IEEE, pp. 297–309.
- [55] Svetnik, V., Liaw, A., Tong, C., Culberson, J. C., Sheridan, R. P., and Feuston, B. P. Random forest: a classification and regression tool for compound classification and qsar modeling. Journal of chemical information and computer sciences 43, 6 (2003), 1947–1958.
- [56] Szabo, N. Smart contracts: Building blocks for digital markets, 1996.
- [57] team, T. E. The ethereum blockchain explorer, 2015.
- [58] team, T. E. Average daily transaction fee, 2022.
- [59] Theodouli, A., Arakliotis, S., Moschou, K., Votis, K., and Tzovaras, D. On the design of a blockchain-based system to facilitate healthcare data sharing. In 2018 17th IEEE International Conference On Trust, Security And Privacy In Computing And Communications/12th IEEE International Conference On Big Data Science And Engineering (TrustCom/BigDataSE) (2018), IEEE, pp. 1374–1379.
- [60] Vasek, M., and Moore, T. There’s no free lunch, even using Bitcoin: Tracking the popularity and profits of virtual currency scams. In Financial Cryptography and Data Security (Berlin, Heidelberg, 2015), R. Böhme and T. Okamoto, Eds., Springer Berlin Heidelberg, pp. 44–61.
- [61] Vasek, M., and Moore, T. Analyzing the bitcoin ponzi scheme ecosystem. In Financial Cryptography and Data Security (Berlin, Heidelberg, 2019), A. Zohar, I. Eyal, V. Teague, J. Clark, A. Bracciali, F. Pintore, and M. Sala, Eds., Springer Berlin Heidelberg, pp. 101–112.
- [62] Wang, L., Cheng, H., Zheng, Z., Yang, A., and Zhu, X. Ponzi scheme detection via oversampling-based long short-term memory for smart contracts. Knowledge-Based Systems 228 (2021), 107312.
- [63] Wang, L., Cheng, H., Zheng, Z., Yang, A., and Zhu, X. Ponzi scheme detection via oversampling-based long short-term memory for smart contracts. Knowledge-Based Systems 228 (2021), 107312.
- [64] Wang, S.-C. Artificial neural network. In Interdisciplinary computing in java programming. Springer, 2003, pp. 81–100.
- [65] Wang, X., Smith, K., and Hyndman, R. Characteristic-based clustering for time series data. Data mining and knowledge Discovery 13, 3 (2006), 335–364.
- [66] Wiki. Gini coefficient, 2022.
- [67] Wood, G. Ethereum: A secure decentralised generalised transaction ledger, 2014.
- [68] XBlock. Xblock: Ethereum on-chain data, 2022.
- [69] Zhang, Y., Yu, W., Li, Z., Raza, S., and Cao, H. Detecting ethereum ponzi schemes based on improved lightgbm algorithm. IEEE Transactions on Computational Social Systems 9, 2 (2021), 624–637.
- [70] Zhao, Q., Chen, S., Liu, Z., Baker, T., and Zhang, Y. Blockchain-based privacy-preserving remote data integrity checking scheme for iot information systems. Information Processing & Management 57, 6 (2020), 102355.
- [71] Zheng, P., Zheng, Z., Wu, J., and Dai, H.-N. XBlock-ETH: Extracting and exploring blockchain data from ethereum. IEEE Open Journal of the Computer Society 1 (2020), 95–106.
- [72] Zhou, Y., Kumar, D., Bakshi, S., Mason, J., Miller, A., and Bailey, M. Erays: Reverse engineering ethereum’s opaque smart contracts. In 27th USENIX Security Symposium (USENIX Security 18) (2018), pp. 1371–1385.
Appendix A Account feature list
The list of different account features, which are used to represent the general characteristics of an application, are given below.
-
•
total_inv_amt: total ETH amount sent to a contract
-
•
total_pay_amt: total ETH amount sent out from a contract
-
•
num_all_txs: total number of tranasctions
-
•
num_in_txs: total number of transactions sent to a contract
-
•
num_out_txs: total number of transactions sent out from a contract
-
•
num_inv_acc: number of distinct account addresses that send ETH to a contract
-
•
num_pay_acc: number of distinct account addresses that send ETH to a contract
-
•
life_time: a contract lifetime
-
•
gini_amt_in: the Gini coefficient of total ETH amount sent to a contract
-
•
gini_amt_out: the Gini coefficient of total ETH amount received from a contract
-
•
avg_inv_amt: the average of ETH amounts sent to a contract
-
•
avg_pay_amt: the average of ETH amounts sent out from a contract
-
•
dev_inv_amt: the standard deviation of ETH amounts sent to a contract
-
•
dev_pay_amt: the standard deviation of ETH amounts sent out from a contract
-
•
avg_time_btw_txs: the average of time distance between two consecutive transactions
-
•
overlap_addr: the number of addresses that invested and be paid by contract
-
•
gini_time_in: the Gini coefficient of number of transactions sent to a contract
-
•
gini_time_out: the Gini coefficient of number of transactions sent out from a contract
-
•
know_rate: the proportion of partipants who have invested before payment
-
•
balance: the balance of a smart contract
-
•
difference_idx: the difference measurement of counts between payment and investment
-
•
paid_rate: the proportion of investors who received at least one payment
-
•
max_pay: maximum number of payment to a participant
-
•
balance_rate: ratio between balance and total investment
-
•
pay_skewness: a payment skewness
Appendix B Time-series list
Below is the list of 43 different time-series we used to represent the change of information associated with an application throughout its lifetime in different aspects. Those time-series were derived from basic transaction information listed in Section 2.1. We then grouped them by the information from which they were created. All of these data depend on time, e.g., which day they were measured.
B.1 ETH value:
-
•
balance: the amount of ETH in a contract.
-
•
profit_and_loss: subtraction of total investments (profit) and total payments (loss) of a contract.
-
•
loss: total ETH amounts that a contract pays to its participants.
-
•
loss_by_contract: total ETH amount sent from a contract to other contracts.
-
•
loss_by_person: total ETH amount sent from a contract to the other user accounts.
-
•
loss_from_internal_txs: total ETH amount recorded by internal transactions that a contract pays to its participants.
-
•
loss_from_normal_txs: total ETH amount recorded by external transactions that a contract pays to its participants.
-
•
profit: total ETH amount that the contract received from its participants.
-
•
profit_by_contract: total ETH amount that the contract received from other contracts.
-
•
profit_by_person: total ETH amount that the contract received from other user accounts.
-
•
profit_from_internal_txs: total ETH amount recorded by internal transactions that a contract pays received from its participants.
-
•
profit_from_normal_txs: total ETH amount recorded by external transactions that a contract pays received from its participants.
B.2 Transaction:
-
•
total_txs: total number of transactions.
-
•
total_internal_txs: total number of internal transactions
-
•
total_in_coming_txs: total number of transactions sent to a contract.
-
•
total_in_coming_internal_txs: total number of internal transactions sent to the contract.
-
•
total_in_coming_normal_txs: total number of external transactions sent to the contract.
-
•
total_normal_txs: total number of external transactions
-
•
total_out_going_txs: total number of transactions sent from a contract.
-
•
total_out_going_internal_txs: total number of internal transactions sent from a contract.
-
•
total_out_going_normal_txs: total number of external transactions sent from a contract.
B.3 Participant address:
-
•
total_unique_addresses: total number of distinct participants (addresses) of a contract.
-
•
total_unique_in_coming_addresses: total number of distinct participants who sent transactions to a contract.
-
•
total_unique_in_coming_addresses_from_internal: total number of distinct participants who sent internal transactions to a contract.
-
•
total_unique_in_coming_addresses_from_normal: total number of distinct participants who sent external transactions to a contract.
-
•
total_unique_out_going_addresses: total number of distinct participants who receive transactions from a contract.
-
•
total_unique_out_going_addresses_from_internal: total number of distinct participants who receive internal transactions from a contract.
-
•
total_unique_out_going_addresses_from_normal: total number of distinct participants who receive external transactions from a contract.
B.4 Calling Function555 Calling function can be retrieved from a transaction’s input data:
-
•
total_unique_calling_function: total number of distinct functions were called by a contract or its participants.
-
•
total_unique_in_coming_calling_function: total number of distinct functions called by participants.
-
•
total_unique_in_coming_calling_function_from_internal: total number of distinct functions called via internal transactions by participants.
-
•
total_unique_in_coming_calling_function_from_normal: total number of distinct functions called via external transactions by participants.
-
•
total_unique_out_going_calling_function: total number of distinct functions called by contracts.
-
•
total_unique_out_going_calling_function_from_internal: total number of distinct functions called via internal transactions by contracts
-
•
total_unique_out_going_calling_function_from_normal: total number of distinct functions called via external transactions by contracts
B.5 Participant Account Type:
-
•
num_in_coming_txs_from_contract: number of transactions sent to a contract from other contracts
-
•
num_in_coming_txs_from_person: number of transactions sent to a contract from other user accounts.
-
•
num_out_going_txs_to_contract: number of transactions sent from a contract to other contracts
-
•
num_out_going_txs_to_person: number of transactions sent from a contract to other user accounts.
-
•
num_unique_in_coming_contract_address: number of distinct contracts that sent transactions to a contract
-
•
num_unique_in_coming_person_address: number of distinct user accounts that sent transactions to a contract
-
•
num_unique_out_going_contract_address: number of distinct contracts that received transactions from a contract
-
•
num_unique_out_going_person_address: number of distinct user accounts that received transactions from a contract.
Appendix C Time-series statistical measures
Below are the 12 statistical measures that were used to capture the characteristics of a time-series.
-
•
Mean: Mean value of intervals
-
•
Var: Variance value of intervals
-
•
ACF1: First order of auto-correlation of the series
-
•
Linearity:Strength of linearity calculated based on the coefficients of an orthogonal quadratic regression
-
•
Curvature: Strength of curvature calculated based on the coefficients of an orthogonal quadratic regression
-
•
Trend: Strength of trend of a time-series based on an STL decomposition
-
•
Season: Strength of seasonality of a time-series based on an STL
-
•
Entropy: Spectral entropy measures the “forecastability” of a time-series, where low values indicate a high signal-to-noise ratio, and large values occur when a series is difficult to forecast
-
•
Lumpiness: Changing variance in remainder computed on non-overlapping windows
-
•
Spikiness: Strength of spikiness which is variance of the leave-one-out variances of the remainder component
-
•
Fspots: Flat spot using discretization computed by dividing the sample space of a time-series into ten equal-sized intervals, and computing the maximum run length within any single interval.
-
•
Cpoints: The number of times a time-series crosses the mean line