Computer Simulation of Carbonization and Graphitization of Coal
Abstract
This study describes computer simulations of carbonization and graphite formation, including the effects of hydrogen, nitrogen, oxygen, and sulfur. We introduce a novel technique to simulate carbonization, “Simulation of Thermal Emission of Atoms and Molecules (STEAM),” designed to elucidate the removal of volatiles and density variations in carbonization residue. The investigation extensively analyzes the functional groups that endure through high-temperature carbonization and examines the graphitization processes in carbon-rich materials containing non-carbon “impurity elements”. The physical, vibrational, and electronic attributes of impure amorphous graphite are analyzed, and the impact of nitrogen on electronic conduction is investigated, revealing its substitutional integration into the sp2 layered network.
keywords:
coal, carbon, amorphous graphite, molecular simulation, carbonization, graphitization1 Introduction
The global graphite shortage has steered research towards alternatives to natural graphite for current and emerging technologies [1]. Among these materials, coal has garnered natural attention. Although the detrimental effects of coal combustion for energy generation on health, climate, and the environment have been extensively documented in previous studies [2, 3, 4], contemporary apprehensions regarding the scarcity of natural and synthetic graphite (currently on the list of critical materials [5]) have prompted a fresh appraisal of coal’s potential as a carbon resource [6, 7, 8]. In the United States, research on coal utilization has extended beyond energy production to include using coal-based cryptocrystalline graphite as electrode materials in lithium-ion [9, 10, 11] and aluminum-ion [12] batteries. Additionally, there is a growing interest in using coal as filler material in composites to enhance the mechanical properties of polymers [13], as well as to improving the electrical properties of metals [14]. The later exemplified by successful cases using polycrystalline graphene composites with copper [15] and aluminum [16].
Synthetic graphitization of coal begins with carbonization - the controlled heating of coal within the temperature range of 800 K to 1500 K, in the absence of oxygen. This elevated temperature triggers the release of volatile compounds including gaseous hydrocarbons, oxides of carbon, organo-nitrides, and organo-sulfides, yielding a solid residue known as coke [17]. The consensus is that subjecting the coke to higher temperatures (2500 K 3200 K) induces the cleavage of aliphatic chains and the formation of polyaromatic compounds through free radical crosslinking [18]. These polyaromatic compounds exhibit interconnected carbon atom rings, resulting in structures having sp2 hybridization, akin to graphite [19]. However, research suggests that non-carbon elements in graphitic precursors (e.g., coal) such as hydrogen, nitrogen, oxygen, and sulfur, remain present in the final graphite material and interfere with its formation [20, 21, 22]. For instance, Franklin demonstrated that the presence of oxygen can render the graphite precursor non-graphitizing [23]. Bourrat and co-workers showed that sulfur can endure in the coke after carbonization of some graphite precursors for temperatures above 2000 K, forming crosslinks between the graphitic layers [24].
Established experimental techniques such as Raman Spectroscopy [25], Fourier transform infrared spectroscopy [26], electron paramagnetic resonance [27], and others, can inform on the structure of the materials obtained at different stages from coal carbonization to its graphitization, but they fall short in clarifying how low concentrations of non-carbon atoms influence properties like the electronic conduction in coal-derived nanostructures.
Molecular simulation is an ideal method to gain insight into the atomistic attributes of coal and its derived nanostructures. Recent studies led by Thapa and colleagues [28, 29] have provided a new perspective on the graphitization mechanism of carbonaceous materials, painting an atomistic portrait of amorphous graphite formation at elevated temperatures in elemental carbon. This work challenged the notion that layering in graphite emerged solely from Van der Waals forces, and indicated that layering is due significantly to wavefunction mixing, involving interactions among electrons in the galleries. This insight, also observed in other layered carbon allotropes such as multi-shell fullerenes [30] and multi-walled nanotubes [31], emphasizes the importance of molecular simulations to understand the chemistry and bonding in complex systems.
Our study examines carbonization and the emergence of layered nanostructures derived from coal-like computer models. We include carbon, hydrogen, oxygen, nitrogen, and sulfur. A new method for simulating carbonization, known as the ”Simulation of Thermal Emission of Atoms and Molecules (STEAM),” is presented and explored in detail. Analysis of gas evolution from bituminous coal models during carbonization, and the functional groups present in the coke are conducted. Additionally, ab initio density functional theory (DFT) [32] is employed to probe graphitization in models with “coal-like” elemental compositions containing 5% and 10% non-carbon constituents (by weight). The analysis encompasses an exploration of the vibrational modes, electronic structure, and transport in impure amorphous graphite. Furthermore, the study investigates the impact of carbon-substituted nitrogen on the electronic transport in the layered amorphous nanostructure, utilizing the space-projected conductivity technique [33, 34].
2 Computational Methods
Molecular dynamics (MD) simulations were conducted using two methods: (1) The reactive force field (REAXFF) inter-atomic potential [35], including hydrogen, carbon, nitrogen, oxygen, and sulfur, and (2) DFT with plane-wave pseudo-potentials for all the aforementioned elements except hydrogen. The REAXFF calculations were executed within the Large-scale Atomic/Molecular Massively Parallel Simulator (LAMMPS) [36], while the Vienna Ab initio Simulation Package (VASP) [37] was employed for DFT computations. A single k-point () and periodic boundary conditions were used for all DFT calculations. When relevant, simulations followed the canonical or the isobaric-isothermal ensemble at specified temperature and/or pressure, controlled by a Nosé-Hoover thermostat and/or barostat [38, 39, 40]. MD simulations using REAXFF and DFT employed timesteps of 0.25 fs and 1.5 fs, respectively. The subsequent sections elaborate on the specific simulation protocols for carbonization and graphitization.
3 Results & Discussion
3.1 Carbonization
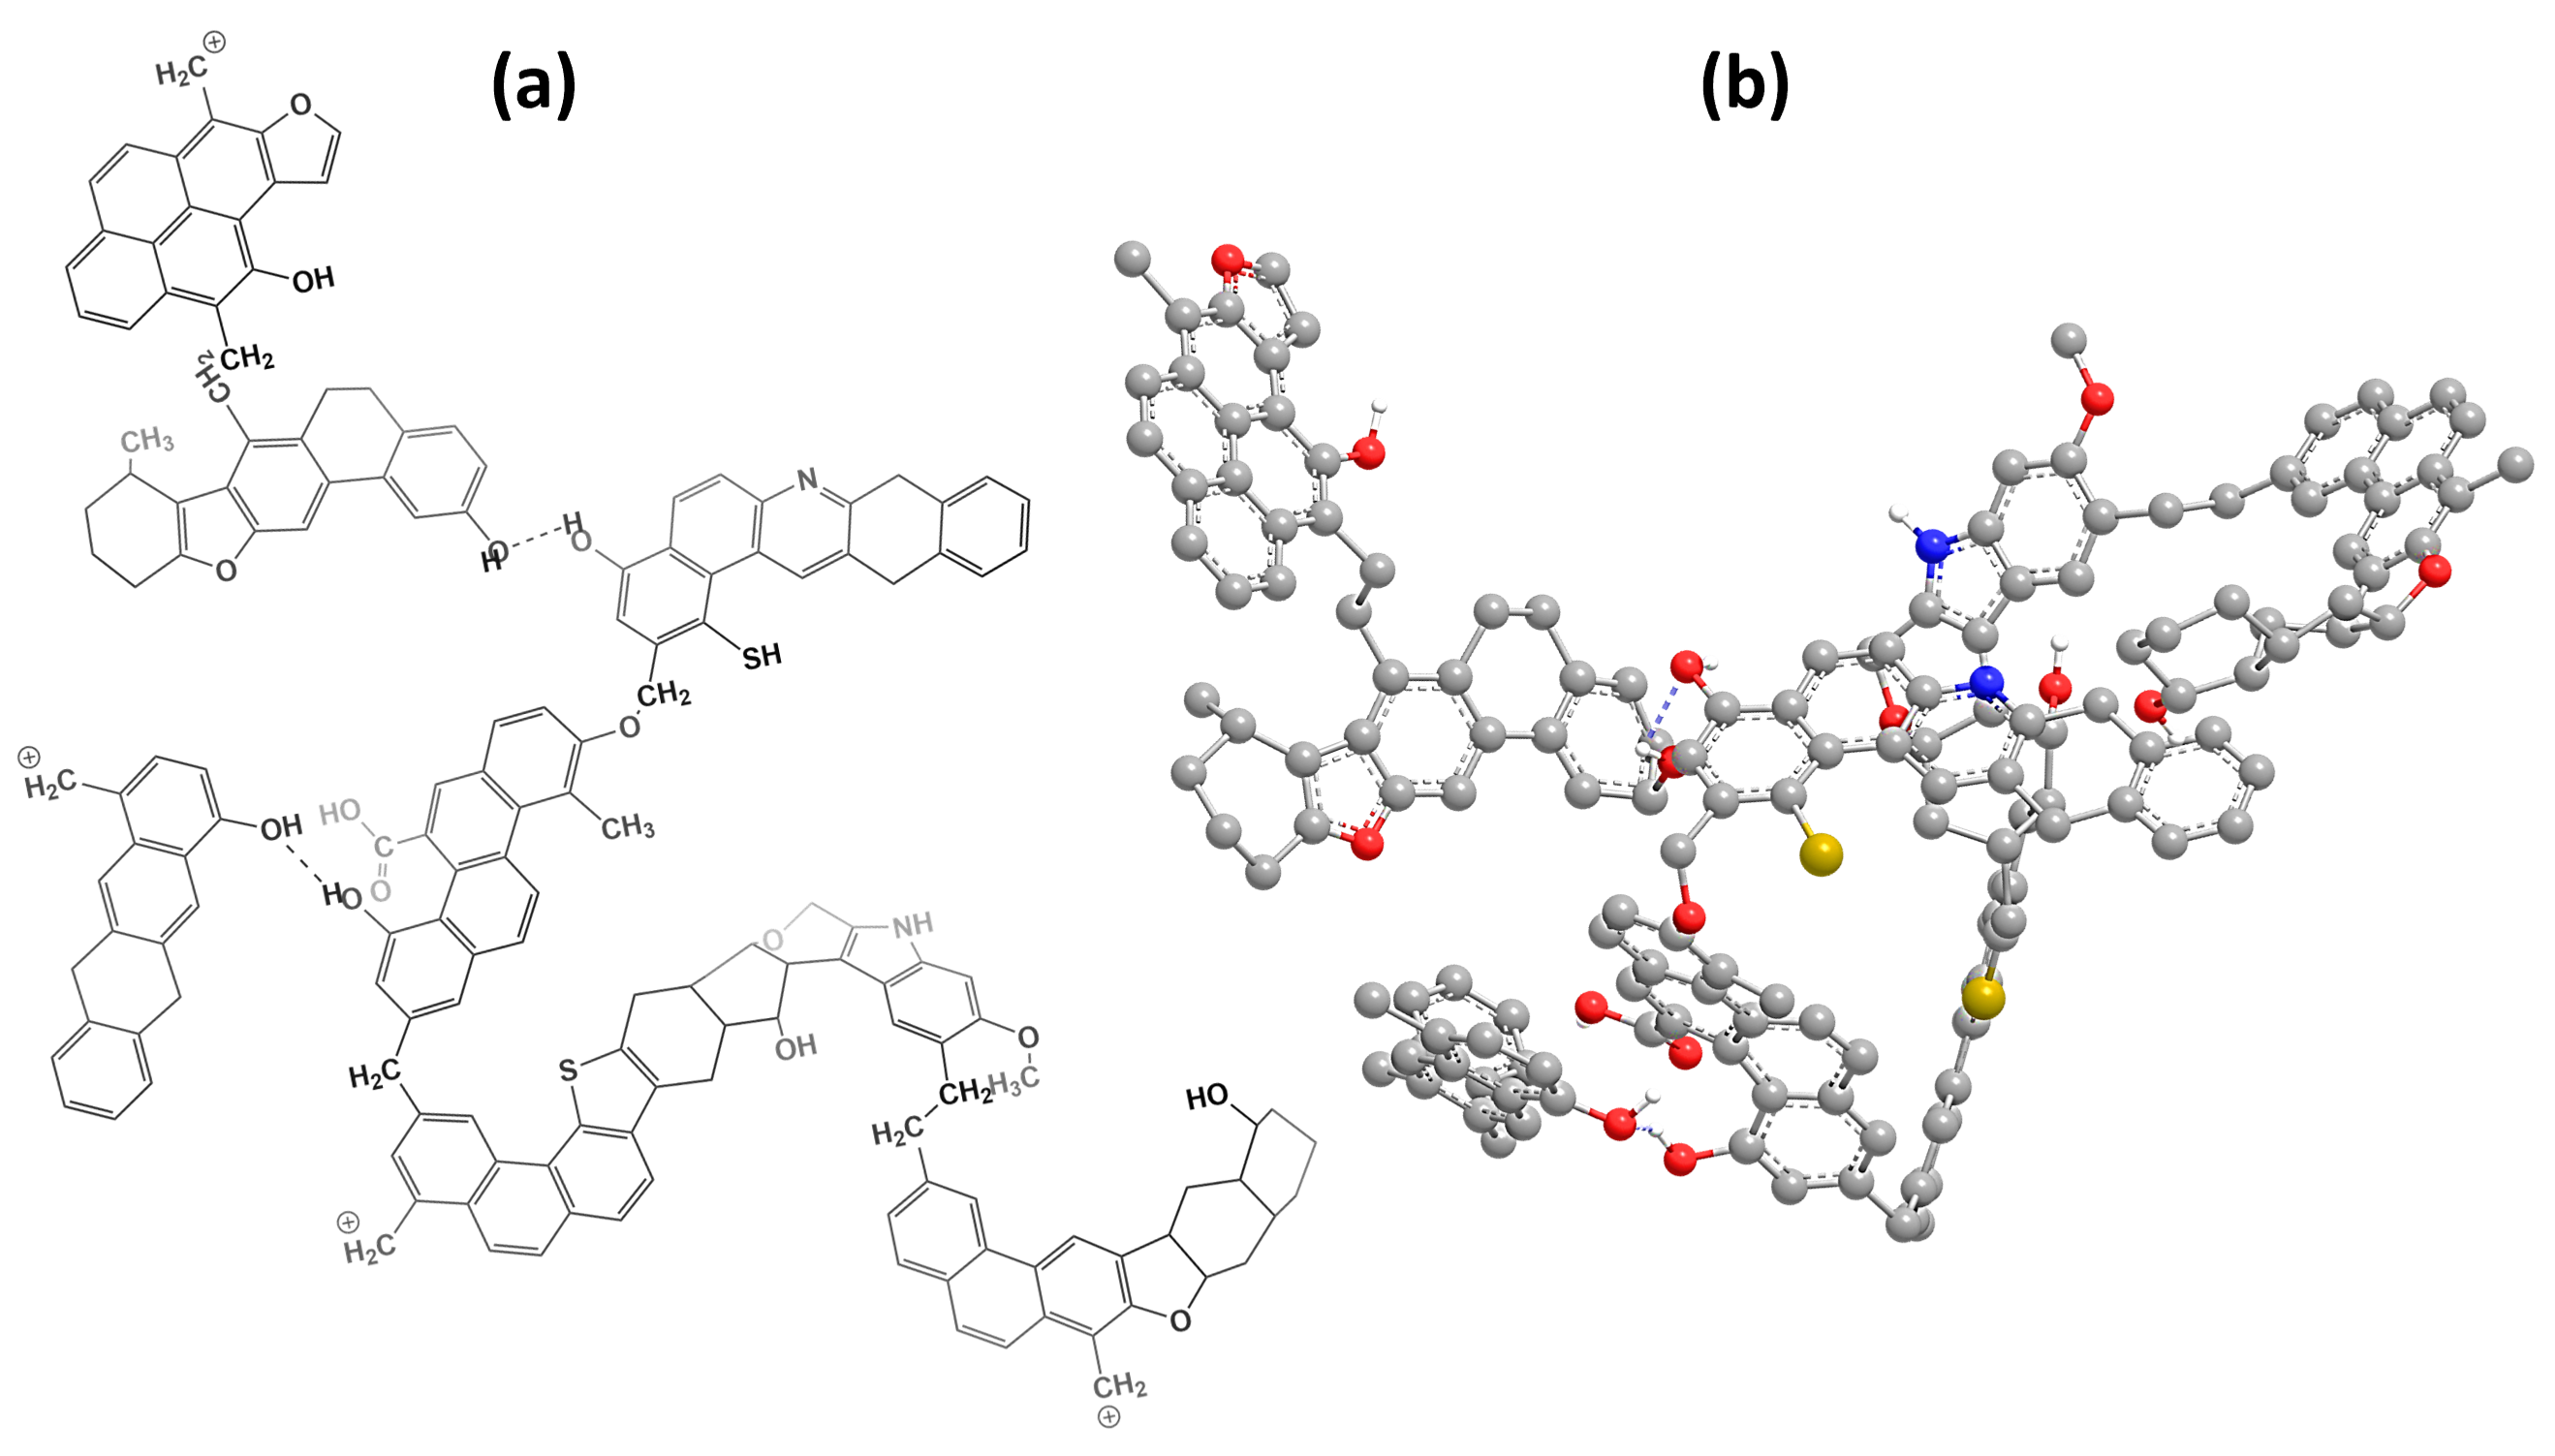
An initial model of coal was made. Starting with ChemDraw®, 3D computer models of Pittsburgh No. 8 coal (hereafter referred to as P8 coal) were constructed from Solomon’s proposed P8 coal, derived from structural and thermal decomposition data [41]. P8 coal is a metallurgical, high-volatile (A) bituminous ranked coal (hvAb) [42]. Figure 1a showcases the 2D representation of the P8 Solomon model, characterized by its chemical formula: C161H140O15N2S2.
The aliphatic and aromatic structures were initially delineated in 2D using ChemDraw®. Subsequently, these structures were subjected to crude optimization through the MM3 force field [43] to achieve a stable steric conformation (refer to Figure 1b). The PACKMOL software package [44] was used to construct supercell models, each comprising 5 units (1600 atoms) of the macromolecular unit structure. In the figures, hydrogen, carbon, nitrogen, oxygen, and sulfur atoms are visually distinguished by white, gray, blue, red, and yellow colors, respectively.
| Pressure | P8 Coal Density | Coke Density | No. of Coke Molecules | Chemical Composition |
|---|---|---|---|---|
| [GPa] | [g/cm3] | [g/cm3] | ||
| 0.4 | 1.22 | 1.32 | 1 | C611H199N5O20S4 |
| 2.0 | 1.49 | 1.66 | 1 | C658H200N7O10S2 |
The supercell models were extensively annealed using REAXFF to optimize their structure. New configurations were achieved through conjugate gradient relaxation, leading to local energy minima. To obtain realistic 3D coal models that reflect the density of P8 coal, the supercells were further annealed under isothermal-isobaric conditions (NPT), allowing density optimization. By doing so, the resulting models satisfy the periodic boundary conditions and therefore, can be used in accurate DFT calculations.
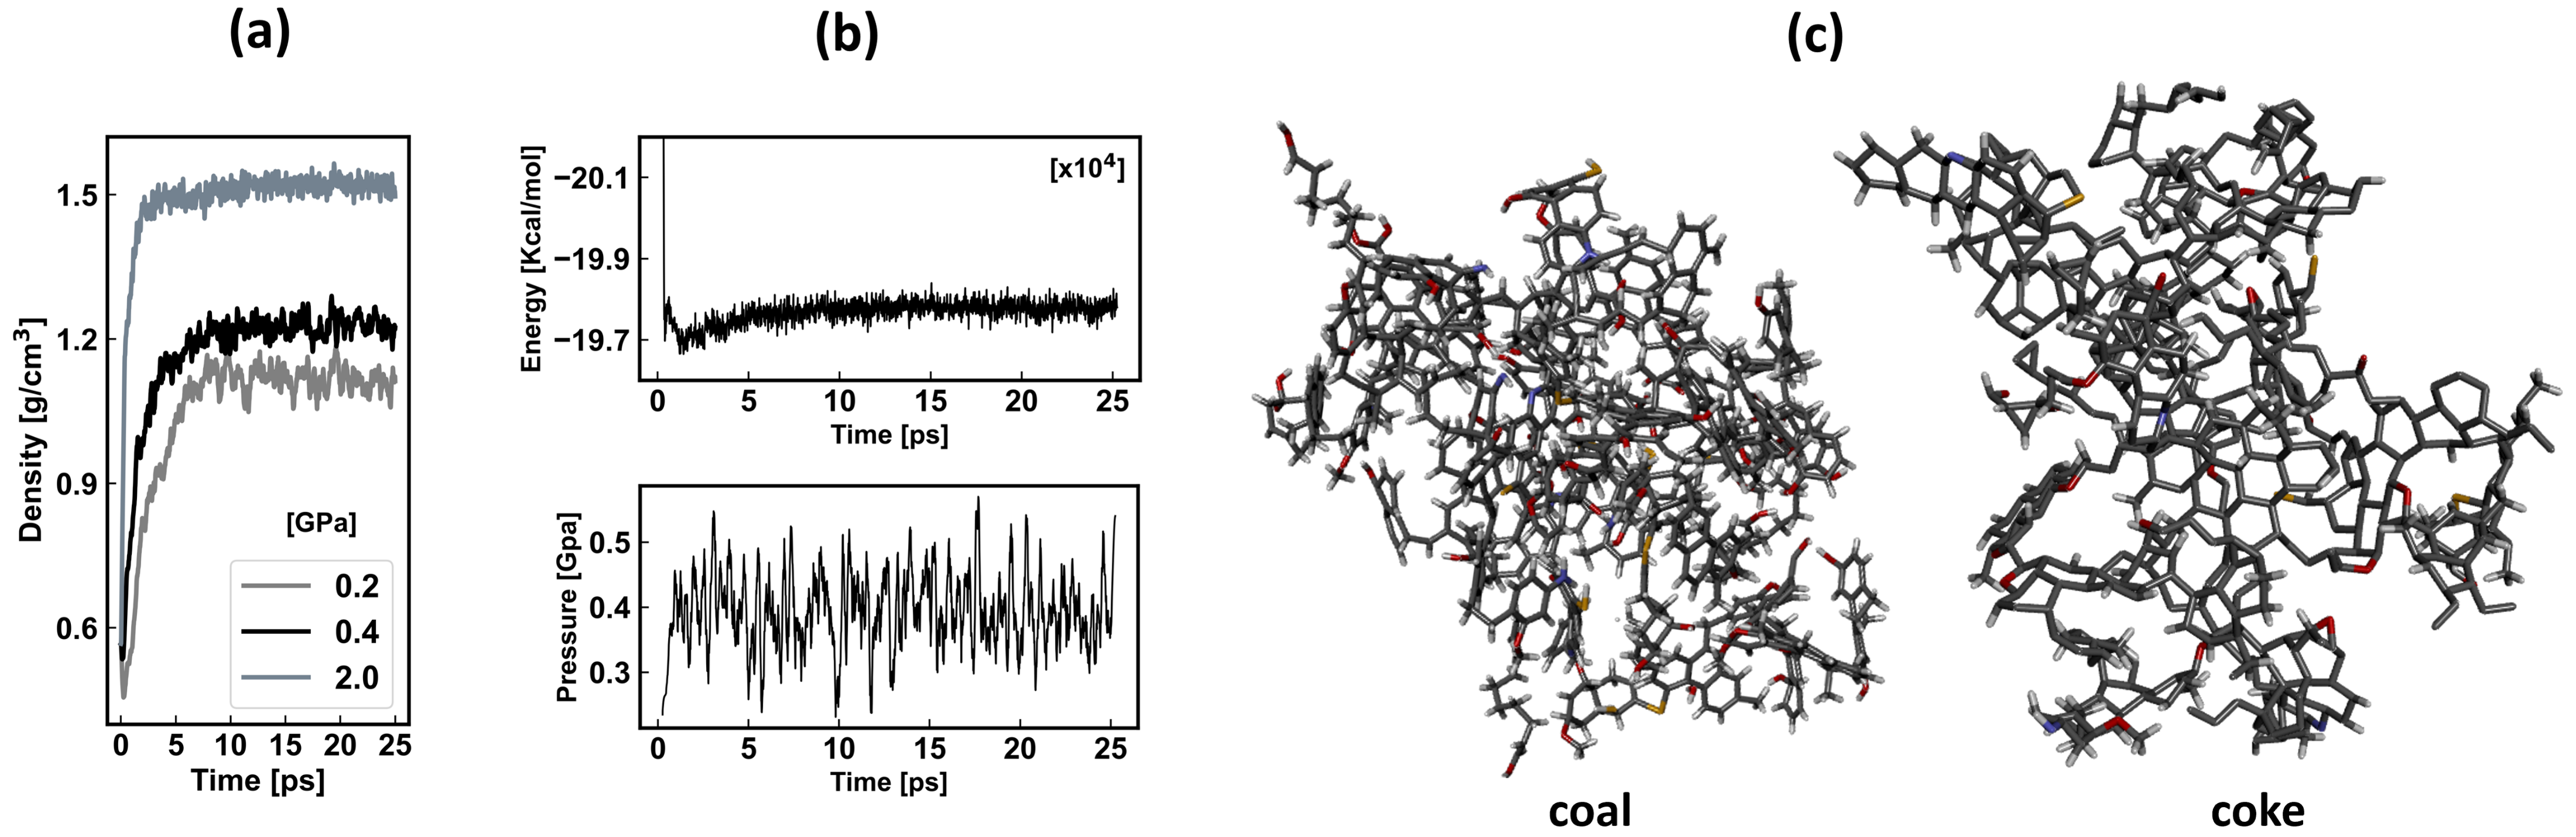
Vitrinite reflectance (Ro) is a well-established gauge of the interplay between temperature and pressure during coal maturation [45]. Utilizing Ro 0.78 for P8 coal [46] translates to a corresponding burial temperature of around 390 K [47, 48]. Consequently, the NPT simulation maintained a constant temperature of 400 K. Low pressure values (0.2, 0.4, and 2.0 GPa) were selected in alignment with experimental data from Reference [45], where a similar pressure range was used to establish the relationship between Ro and pressure.
Figure 2a shows the density time evolution for the simulations at 0.2, 0.4, and 2.0 GPa. Other relevant thermodynamic quantities were also continuously monitored to ensure simulation stability. The energy and pressure time-series plot at 0.4 GPa is depicted in Figure 2b. Models obtained at 2.0 GPa and 0.4 GPa were selected for this study due to their optimal densities () which align closely with experimental (1.46 g/cm3) and estimated particle (1.22 g/cm3) densities for Pittsburgh No. 8 coal, as reported by White and co-workers [42]. The optimal densities obtained at 0.4 and 2.0 GPa are shown in the second column of Table 1.
The models were equilibrated at 500 K for 50 ps under constant temperature (NVT) conditions. Subsequently, the temperature was ramped to 1273 K over 100 ps. We introduce a new simulation protocol designed to capture the emission of volatiles and variations in density during coke formation in the carbonization process. This technique, referred to as ”Simulation of Thermal Emission of Atoms and Molecules (STEAM),” is an iterative approach that incorporates successive NVT and NPT cycles. During the NVT phase, volatile molecules within a specified molecular mass range are systematically removed become non-bonded to the rest of the network. Meanwhile, the NPT phase ensures density convergence and maintains periodic boundary conditions in the system.
In our implementation of STEAM within this study, both the NPT and NVT phases extended over 125 ps each. Throughout the NVT phase, molecules with a molecular mass below 50 g/mol - formed due to bond cleavage - were removed at a rate of up to 5 molecules every 1.25 ps - modeling the outgassing. Completion of the STEAM process was determined by three criteria: (1) Absence of atom/molecule deletion in an NVT step, (2) predominance of high-molecular-mass molecules (preferably a substantial coke-forming molecule), and (3) maintenance of consistent pressure during NPT steps after the NVT phase in (1). Our simulation protocol is summarized as follows:
-
1.
Formulate coal model and generate supercell of macromolecular coal units.
-
2.
Determine initial model density via NPT simulation, leveraging Ro data for the coal (if available).
-
3.
Initiate STEAM implementation by selecting appropriate simulation duration for NVT and NPT phases. A recommended runtime should exceed 100 ps, ensuring sufficient time for density convergence during the NPT step.
-
4.
Conduct NVT simulation, ensuring adequate atom removal intervals to allow a reasonable probability for molecule fragment recombination (e.g., start with 1000 timesteps).
-
5.
Execute the NPT step while closely monitoring density convergence.
-
6.
Iterate between NVT and NPT phases until no bond cleavage occurs in NVT step.
-
7.
Re-run the last NVT step from item 6 to confirm absence of new bond cleavages.
-
8.
Verify that mainly high-molecular-mass molecules remain, ideally a single molecule.
-
9.
Perform an additional NPT step to attain a fully converged coke density.
-
10.
Employ conjugate gradient relaxation to acquire an energy-minimized configuration.
Figure 2c shows coal structure formed at 0.4 GPa ( = 1.21 g/cm3) after item 3 was completed, and the coke structure obtained after item 10. A corresponding figure for the coal and coke formed at 2.0 GPa can be found in Figure S1 in the supplementary material.
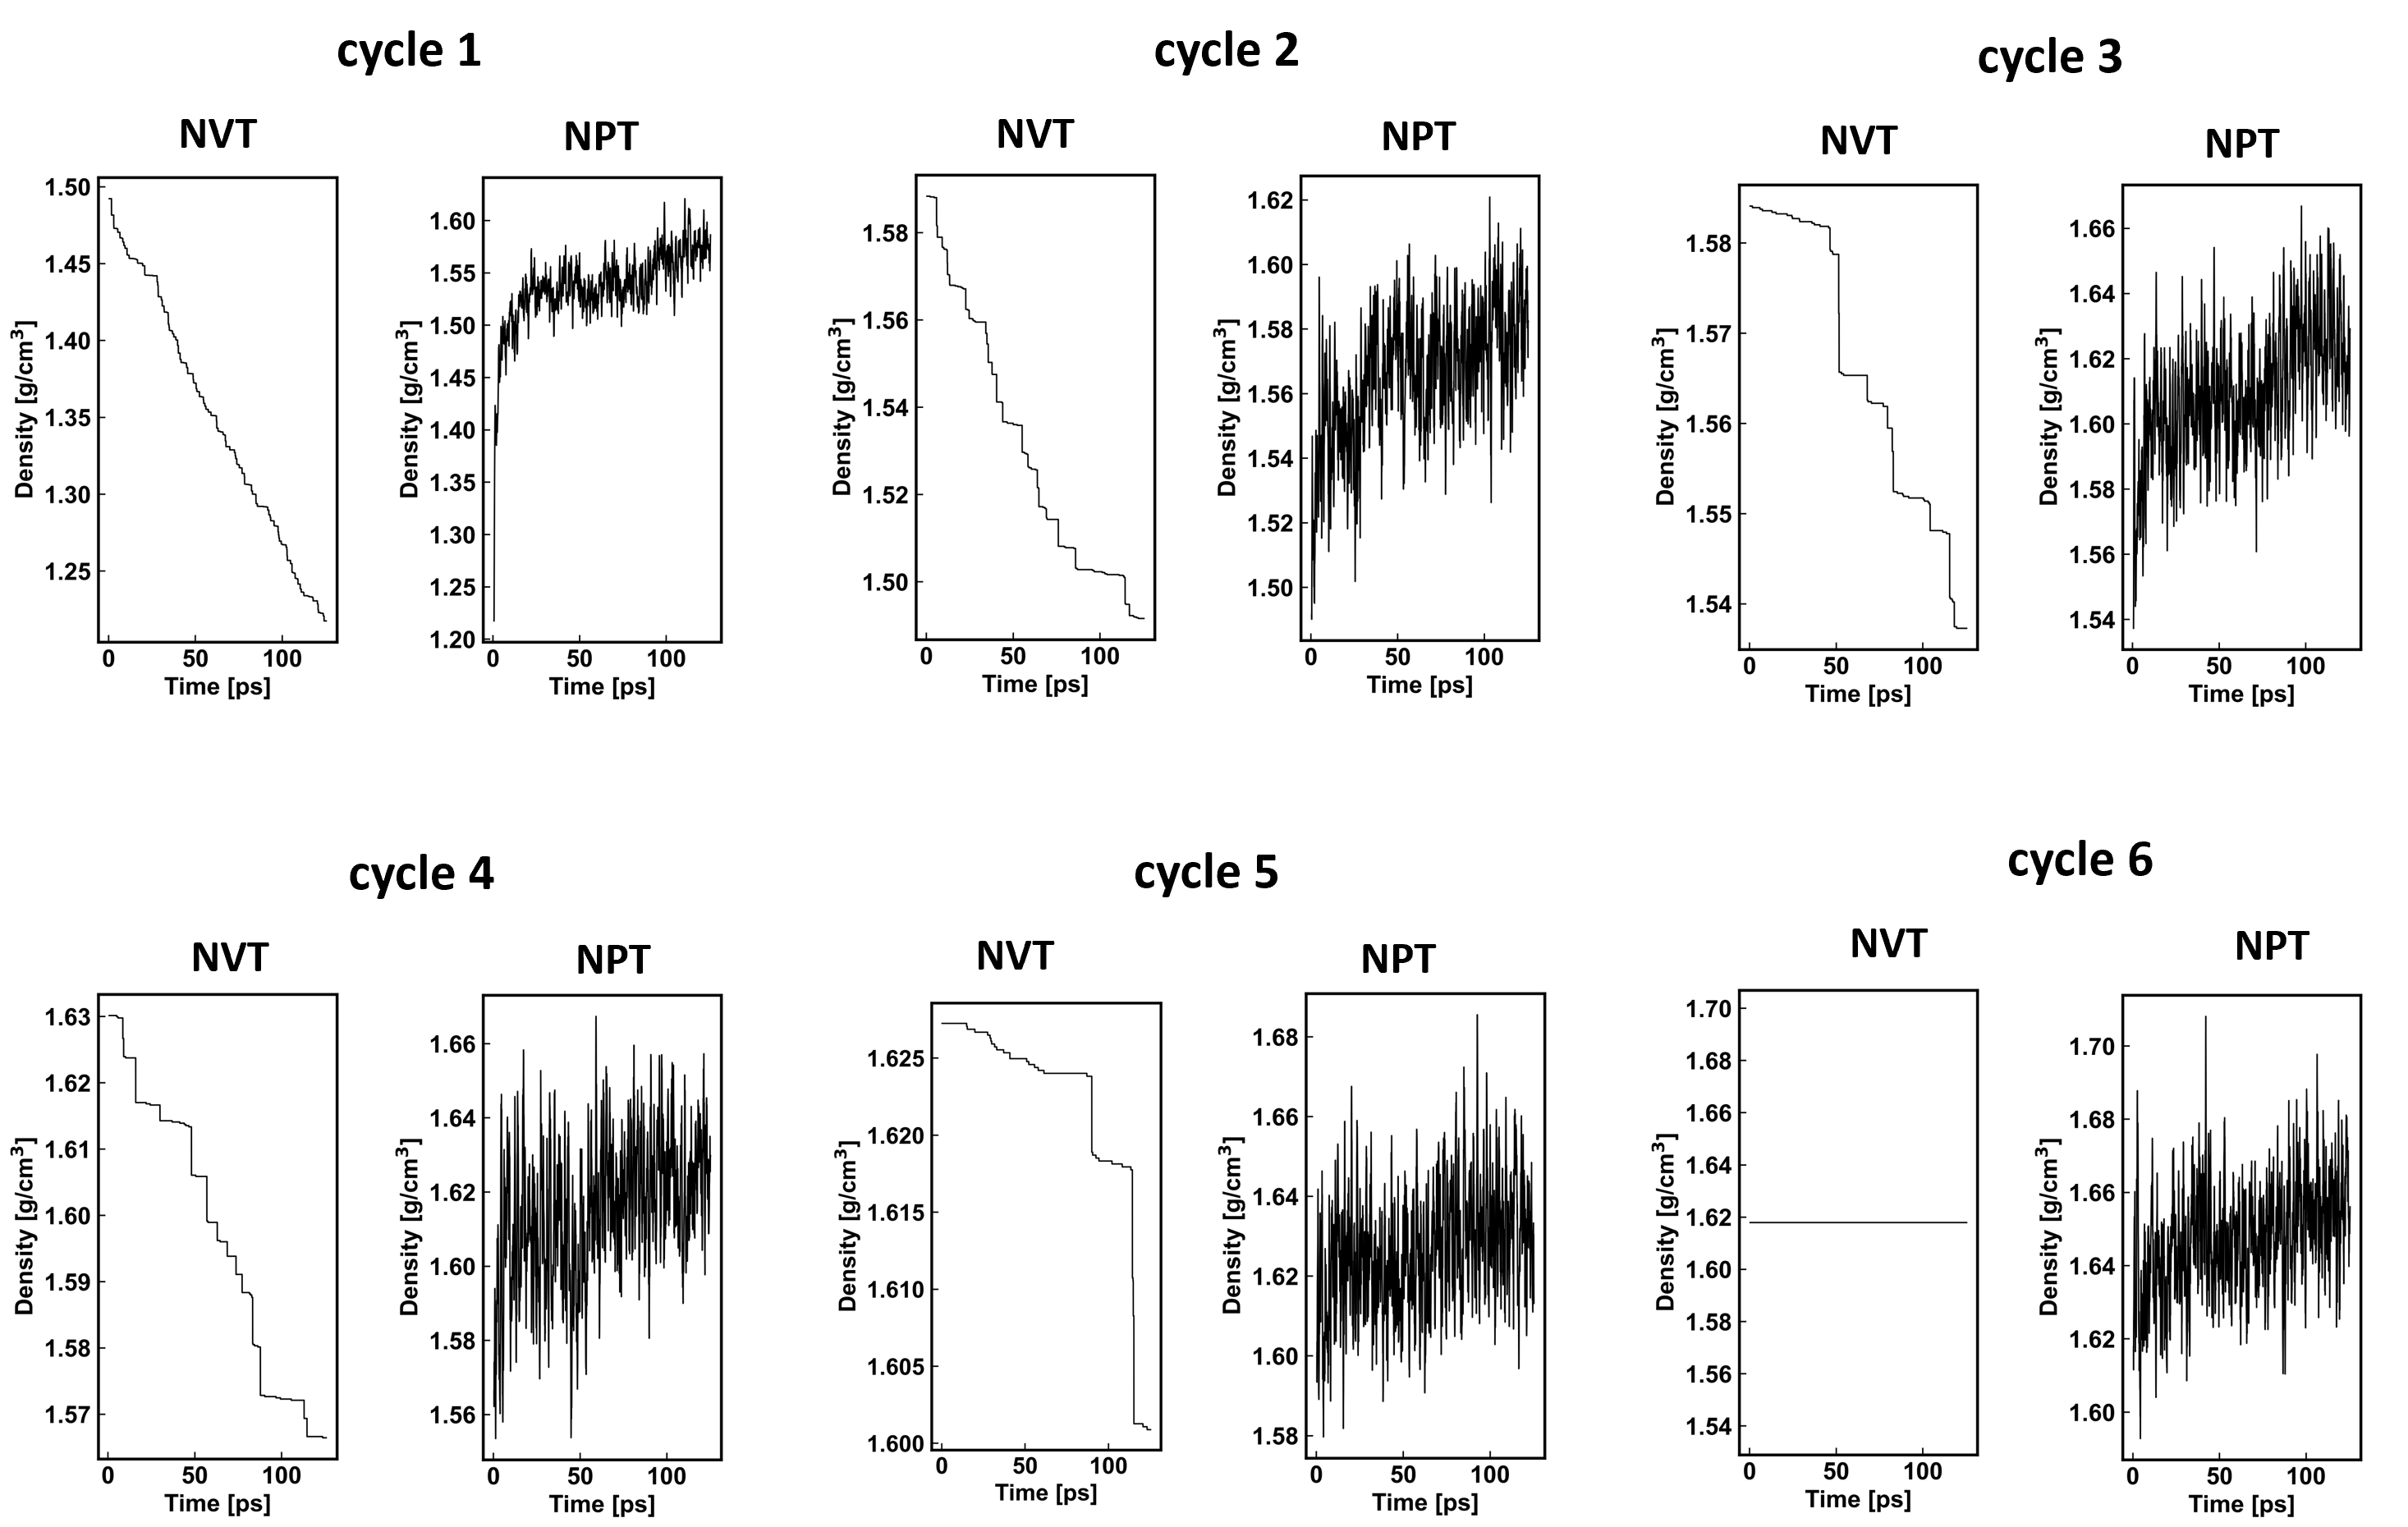
In the initial phases of carbonization, rapid emission of light gases was observed, succeeded by expulsion of heavier gases before the eventual formation of coke. This pattern is illustrated by the density-time plots for the NVT phase in the overview of the STEAM process at 2.0 GPa and 0.4 GPa, shown in Figure 3 and Figure S2 respectively. Within the NVT step, the consistent volume scaling demonstrates that the release of low-mass molecules corresponds to minor step heights, while higher-mass molecules result in more prominent step heights. Noteworthy among the gases emitted are hydrogen (H2, stemming from H radicals), carbon oxides (CO and CO2), hydrogen sulfide (H2S), hydrogen cyanide (HCN), water vapor (H2O), as well as hydrocarbons like CH4,C2H2, C2H4, C2H6, and so on - gases intrinsically associated with the carbonization process. Occasionally, alkyl radicals (R), predominantly CH3, combine with H radicals to yield alkanes.
Subsequent bond cleavage analysis revealed that the primary source of oxygen-related volatiles was hydroxyl (OH) present in carboxyl (R–COOH) or alcohol (R–OH) functional groups. In specific cases, ether (R-O-R′) bond cleavage form formaldehyde (HCHO), which subsequently combined with OH radicals to produce CO and CO2. As carbonization progressed, prior to coke formation, hydrogen sulfide (H2S) emerge from mercaptans (R–SH). The delayed release of H2S was also observed by Whittaker and Grindstaff [22]: The evolution of the sulfurous gas induces an internal pressure that results in the irreversible expansion of graphitic precursors in the late stages of carbonization, or the early stages of graphitization [22]. In rare instances, CS (with potential for evolution into CS2) was liberated from heterocyclic thiophenes. Furthermore, bond fragmentation within aromatic rings resulted in aromatic hydrogen generation and triggered the liberation of hydrogen cyanide from ring nitrogen.
The compositions of the coke, as detailed in Table 1, revealed that over 65% of the non-carbon elements were emitted as gases, contrasting with the retention of about 80% of carbon atoms. As depicted in Figure 2c and Figure S1, some carbon ring structures (5, 6, and 7-membered rings) were retained in the coke (indicative of the early stages of graphitization). The coke matrix retained pyrrolic and pyridinic nitrogen due to hydrogen atom removal from 5- and 6-membered heterocyclic aromatic rings, respectively. Aliphatic ethers (R–O–R′) also persisted, serving as bridges between aromatic and aliphatic carbon structures. Cyclic ethers also formed as oxirane and oxolane structures. The Carbonyl components in P8 coal gave rise to emerging ketones (R2C=O), and the Organosulfur compounds manifested as thioethers (R–S–R′) and thioketones (R2C=S).
3.2 Graphitization
To study graphitization, we found that utilizing DFT precision forces is required [28, 29]; thus, in this section we employed VASP. Our approach involves randomly distributing 200 atoms of carbon, nitrogen, oxygen, and sulfur in a cubic box to achieve a density of 2.4 g/cm3. Henceforth the non-carbon elements will be referred to as “impurity elements”. Six models were created, incorporating 5% and 10% impurity elements (three models for each concentration). The oxygen to nitrogen and oxygen to sulfur ratio was 3:1 for both cases. This ratio was deliberately selected to reflect the elemental concentration in the coke (as detailed in Table 1), while maintaining a carbon-rich environment. The models were annealed for 360 ps at 3000 K - the common graphitization temperature [49, 50, 51]. Subsequently, the models were relaxed to an energy minimum configuration using the conjugate gradient algorithm. Note that hydrogen is excluded. This is because hydrogen is typically “burned off” in the carbonization phase, and frankly, the timestep required is too short for practical VASP simulations.
The interactions between the electrons and ions were described using the Perdew-Burke-Ernzerhof projected-augmented-wave pseudopotential [52, 53]. We set a cutoff energy of 400 eV for the plane-wave-basis used to expand electronic wave functions during the molecular dynamics simulation, and a higher cutoff of 520 eV was used for the electronic structure calculations. For where it applies, the layered nanostructures containing non-carbon elements are referred to as impure amorphous graphite.
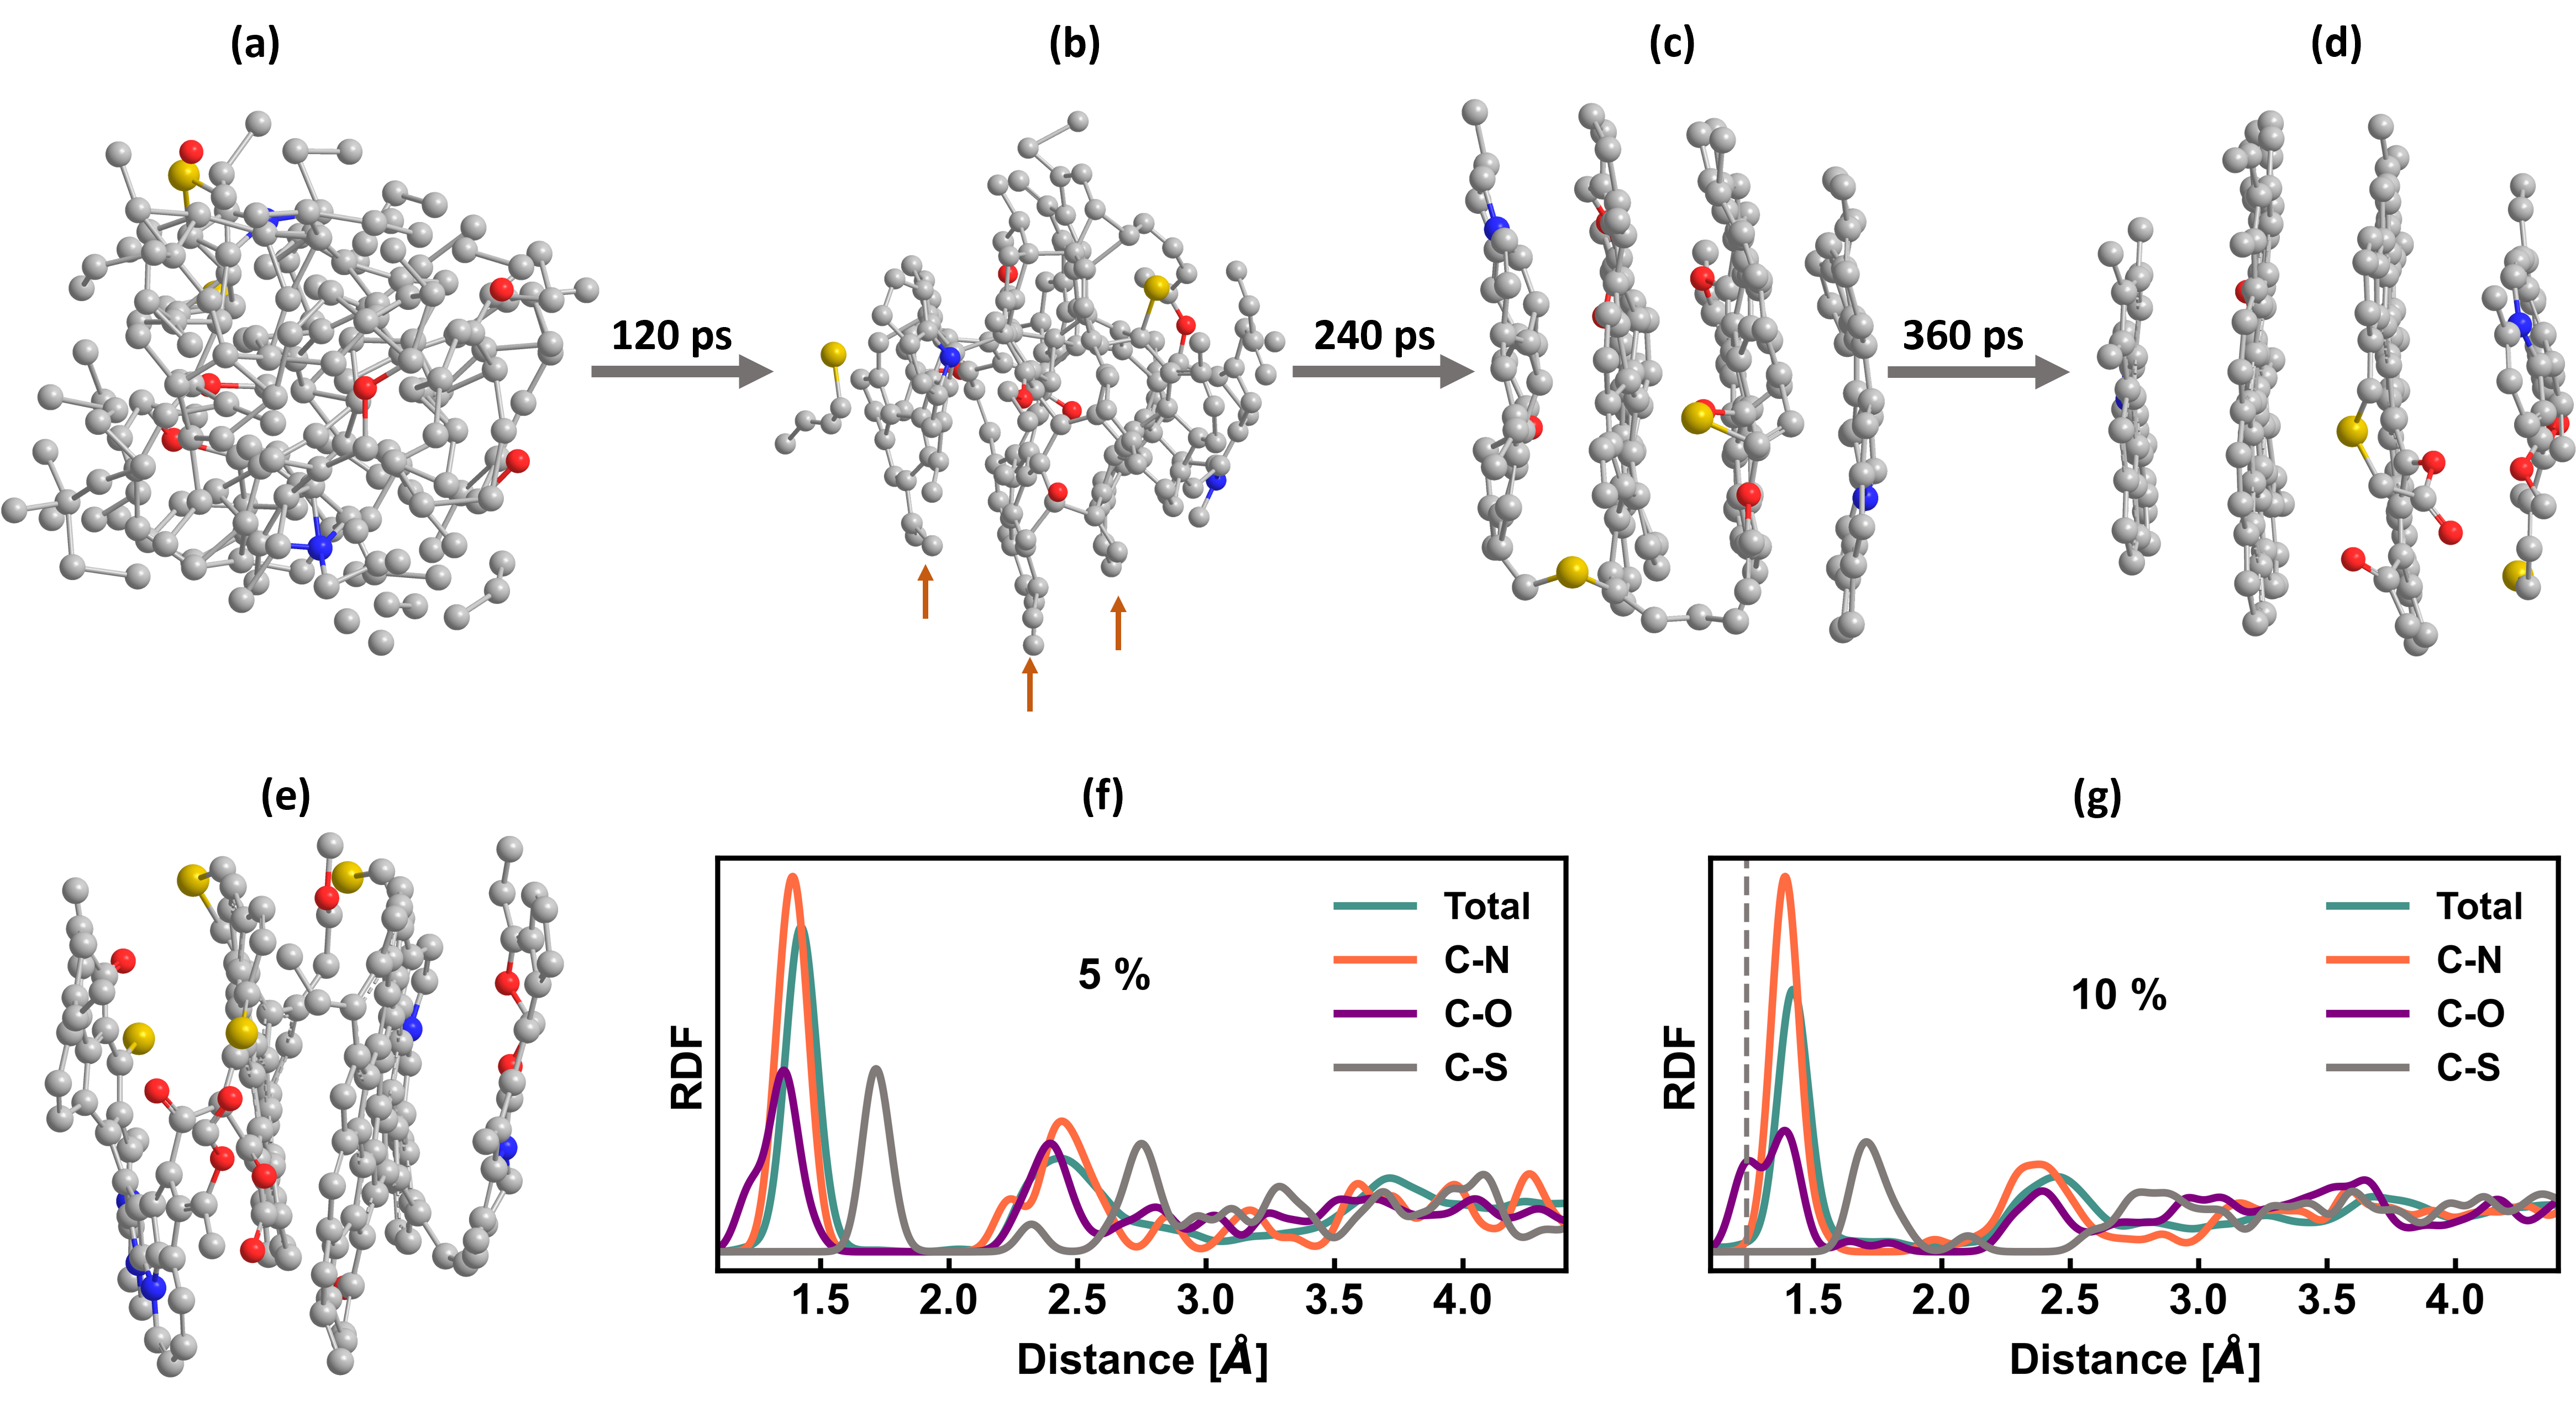
Figure 4a - d is a chronological depiction of the layering process observed in layered nanostructure with 5% impurity concentration. In contrast, the models with 10% impurity concentration lack distinct layers; instead, they exhibit inter-layer atomic bonding involving carbon atoms near oxygen atoms (see Figure 4e). Wang and Hu highlighted the connection between layering defects in graphite and the presence of oxygen, revealing that even at low concentrations, graphite oxidation significantly disrupts its layered structure [54].
Preceding any discernible indications of layering (indicated by the brown arrows in Figure 4b), a process involving rearrangement of the non-carbon atoms occurred. Nitrogen atoms readily adopt graphitic nitrogen (N-3) structures (forming bonds with three neighboring carbons in sp2 configuration). Once formed, this configuration was maintained throughout the simulation. In specific cases, nitrogen atoms disrupt ring connectivity in the layers by bonding with only 2 carbon atoms after substituting a sp2 carbon atom, thereby forming pyrrolic (N-5) or pyridinic (N-6) structure by carbon substitution in a 5- or 6-membered ring, respectively. Oxygen atom form ether-bridges (C–O–C) or ketone (C=O) structures that terminate ring connectivity. Similarly, sulfur atoms display a preference for thioether (C–S–C) and thioketone (C=S) structures. Notably, sulfur conformation in impure amorphous graphite mirrors sulfur’s inclimation to form C–S–C bond at the edges (grain boundaries) in crystalline graphite [55].
In early graphitization stages, sulfur atoms initially establish crosslinks between layers (see Figure 4c). However, upon energy optimization, sulfur atoms demonstrate a preference for bonding within the layers (refer to Figure 4d). From experimental observations, Kipling and co-workers suggested that crosslinking of sulfur between layers exist in graphitized materials from sulfur-containing precursors [56] This was later challenged by Adjizian and co-workers in a DFT study that found such sulfuric crosslinking structures were energetically unfavorable in graphite [55]. Our results offer a nuanced perspective: crosslinking does occur during intermediate graphitization stages, but the energy-optimized sulfur conformation is not as a crosslink between the layers. Additionally, our observation from the structures with 10% non-carbon elements also contradicts Kipling’s notion that higher sulfur concentrations could promote inter-layer connections; instead, distinct layers simply failed to form, atleast on the timescale of our simulation.
The functional groups in impure amorphous graphite were also identified in coke post-carbonization (see Section 3.1), indicative of their energy stability within carbon layers during coal graphitization [20]. This notion is reinforced by NMR analysis of graphite oxide, revealing stable ether (C–O–C) structures and unstable hydroxyl (C–OH) groups, with the transient C–OH condensing into consolidated C–O–C linkages [57]. Furthermore, a predominant sulfur-doped graphite conformation reported by Li et al. is the theophinic (C–S–C) structure [58].
We analyzed the local structure in impure amorphous graphite using the radial distribution function (Figure 4f and g). Key details about the primary peak, which represents the nearest distance between carbon and non-carbon pairs, are provided in Table 2. Our analysis is limited to this range due to the low impurity concentration in the models, which inherently lacks extensive structural information beyond immediate neighboring atoms. Notably, the nearest neighbor values derived from our models closely correlate with experimental data for the observed functional groups, as discussed earlier. Another feature is the emergence of a distinct peak around 1.24 in the radial distribution function plot of the 5% impurity model (Figure 4f), corresponding to the C=O bond length in carbonyl groups [59]. This peak becomes more prominent in the 10% impurity model’s plot (highlighted by gray dashed lines in Figure 4g), suggesting a higher oxygen concentration encourages the formation of carbonyl functional groups in impure amorphous graphite.
| C–C | C–N | C–O | C=O | C–S |
|---|---|---|---|---|
| 1.42 Å | 1.40 Å | 1.24 Å | 1.38 Å | 1.71 Å |
| 1.42 [60] | 1.47 [61] | 1.23 [59] | 1.43 [62] | 1.73 [63] |
The vibrational signatures in impure amorphous graphite were extracted and compared with that of pristine graphite [28] by computing the vibrational density of states (VDoS) using the harmonic approximation. This entailed calculating the Hessian matrix by evaluating forces from atomic displacements of 0.015 along six directions (x, y, z). The VDoS () is computed as follows:
| (1) |
where is approximated as a Gaussian with a standard deviation of 1.5% of the maximum frequency observed. and represent the number of atoms and the eigen-frequencies of normal modes, respectively. The VDoS for the pristine and impure amorphous graphite have similar structures but with shifts in peak location (refer to Figure 5a). A shoulder appearing at the low-frequency end (around 5 THz) matched in both models. Moreover, the peak with a shoulder around 21 THz in the pristine graphite model was resolved as a single peak in impure amorphous graphite.
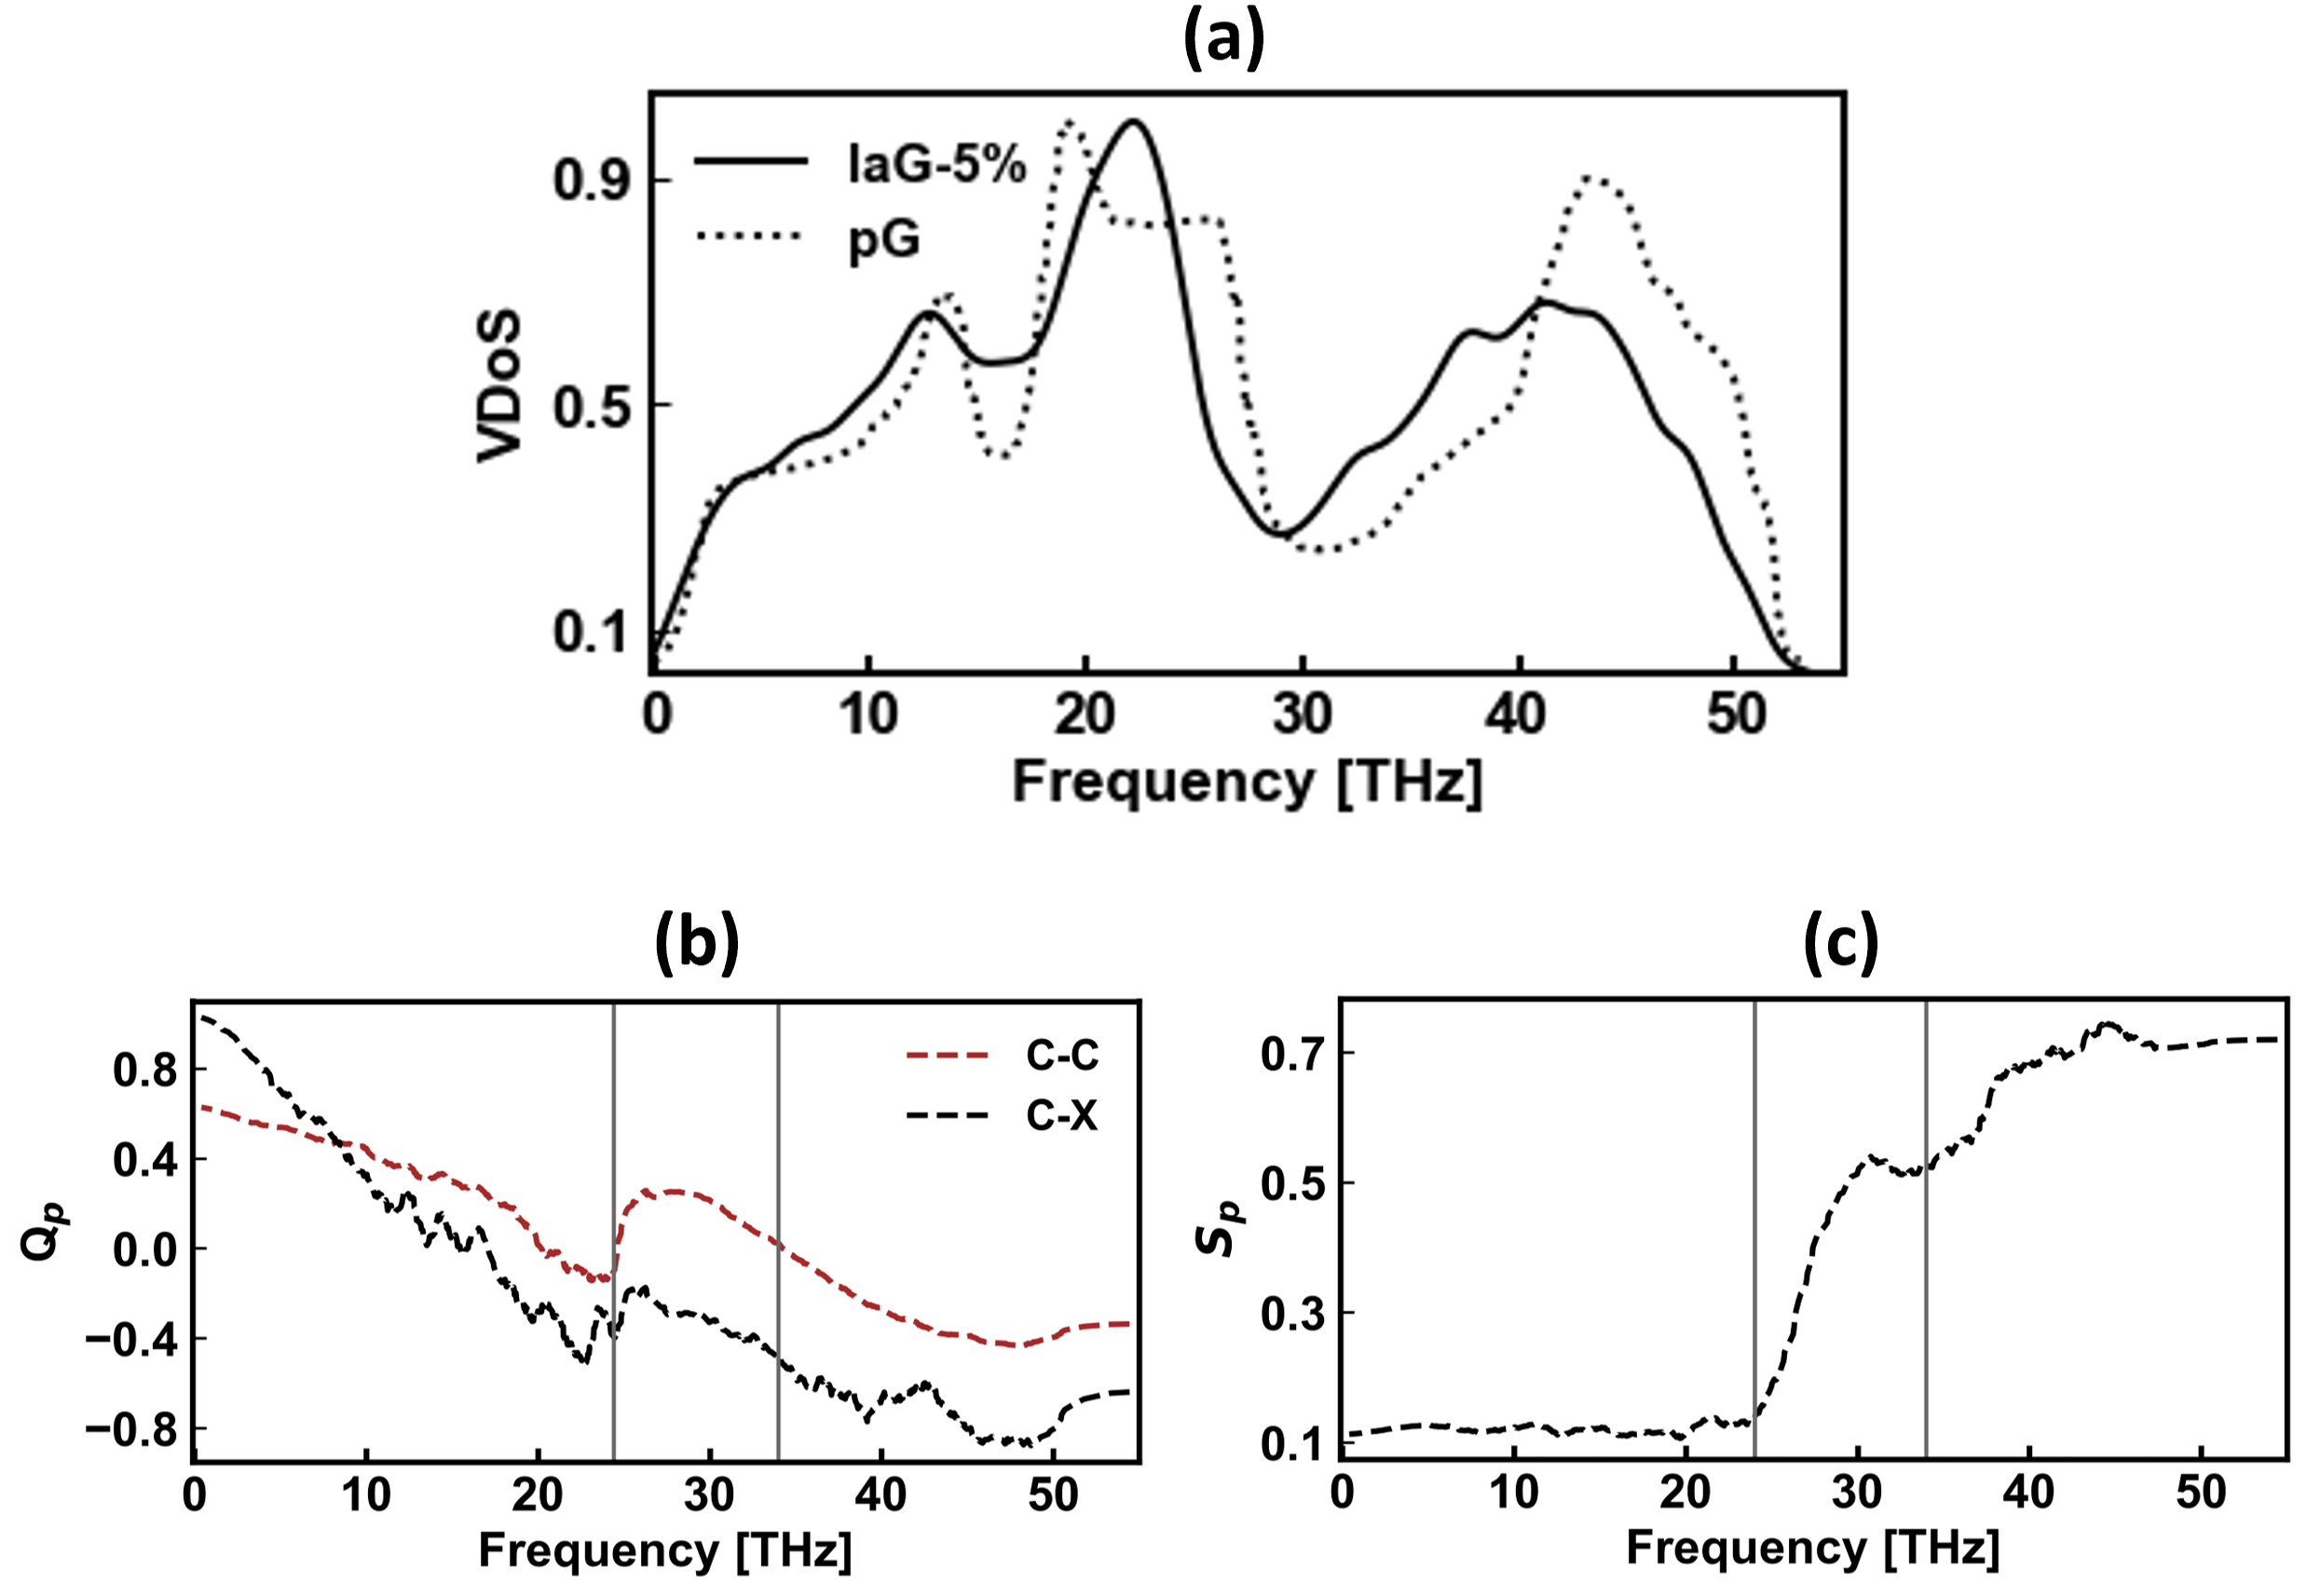
While there are noticeable similarities in the vibrational structures between pristine graphite and impure amorphous graphite, it’s important to recognize that the classification of vibration modes applied to pristine graphite, including acoustic and optical modes, cannot be directly extended to describe amorphous systems. To address this disparity, we rely on the concept of the phase quotient (Qp) [64], which acts as a metric to discern whether vibrations can be characterized as acoustic (+Qp) or optical (-Qp) modes. The phase quotient is derived as [65]:
| (2) |
where is the number of valance bonds, and and are the normalized displacement vectors for the normal mode. The index, , ranges across all carbon atoms, and enumerates neighboring atoms (C, O, N, S) linked to the carbon atom. A purely acoustic (optical) vibration manifests as a phase quotient of +1 (-1).
In Figure 5b, Qp profiles are illustrated as crimson and black curves, representing carbon/carbon (C–C) and carbon/non-carbon (C–X) vibrations. Particularly noteworthy is the stronger in-phase (acoustic mode) coherence of C–X vibrations at very low frequencies, in contrast to C–C vibrations. This coherence in C–X vibrations transitions rapidly to an out-of-phase pattern — akin to optical modes — even surpassing the out-of-phase behavior of C–C vibrations at higher frequencies.
In graphite, the acoustic mode is commonly linked with the low-frequency region 26.8 THz [67]. The Qp for C–C vibration in impure amorphous graphite shifted to the optical mode (-Qp) at 21 THz. However, a local minimum emerged at Qp = -0.15, corresponding to a frequency of 24.4 THz (indicated by the first black line in Figure 5b). The vibration mode briefly reverted to the acoustic mode, peaking at 27 THz (the vibration mode-switching frequency in graphite), before Qp transitioned back towards the optical mode. Qp became negative (optical mode) at 34 THz, indicated by the second black line in Figure 5b. Two potential explanations underlie this behavior. Firstly, the turning point of the phase quotient for C–X, occuring at a lower frequency of 22.6 THz, may have influenced the C–C vibrational mode, inducing a switch from optical to acoustic vibrational behavior. Secondly, the region experiencing a shift in slope within the phase quotient plot corresponds to the transition from bending to stretching vibrational characteristics. This transition is evaluated using the bending/stretching quotient (Sp) proposed by Marinov and Zotov [68]:
| (3) |
Here, and are the same as in Equation 2, and is the unit vector parallel to the mth bond. Sp 0 indicates bond-bending character, and Sp 1 represent predominantly bond-stretching vibrations. The region between 24.4 - 34 THz, marked by two black vertical lines in Figure 5c, signifies a transition from bending to stretching vibrational character. Significantly, this transition aligns with the region of C–C vibration mode switching, as indicated by Qp (see Figure 5b), implying a direct influence of vibrational character transition on vibrational modes in impure amorphous graphite.
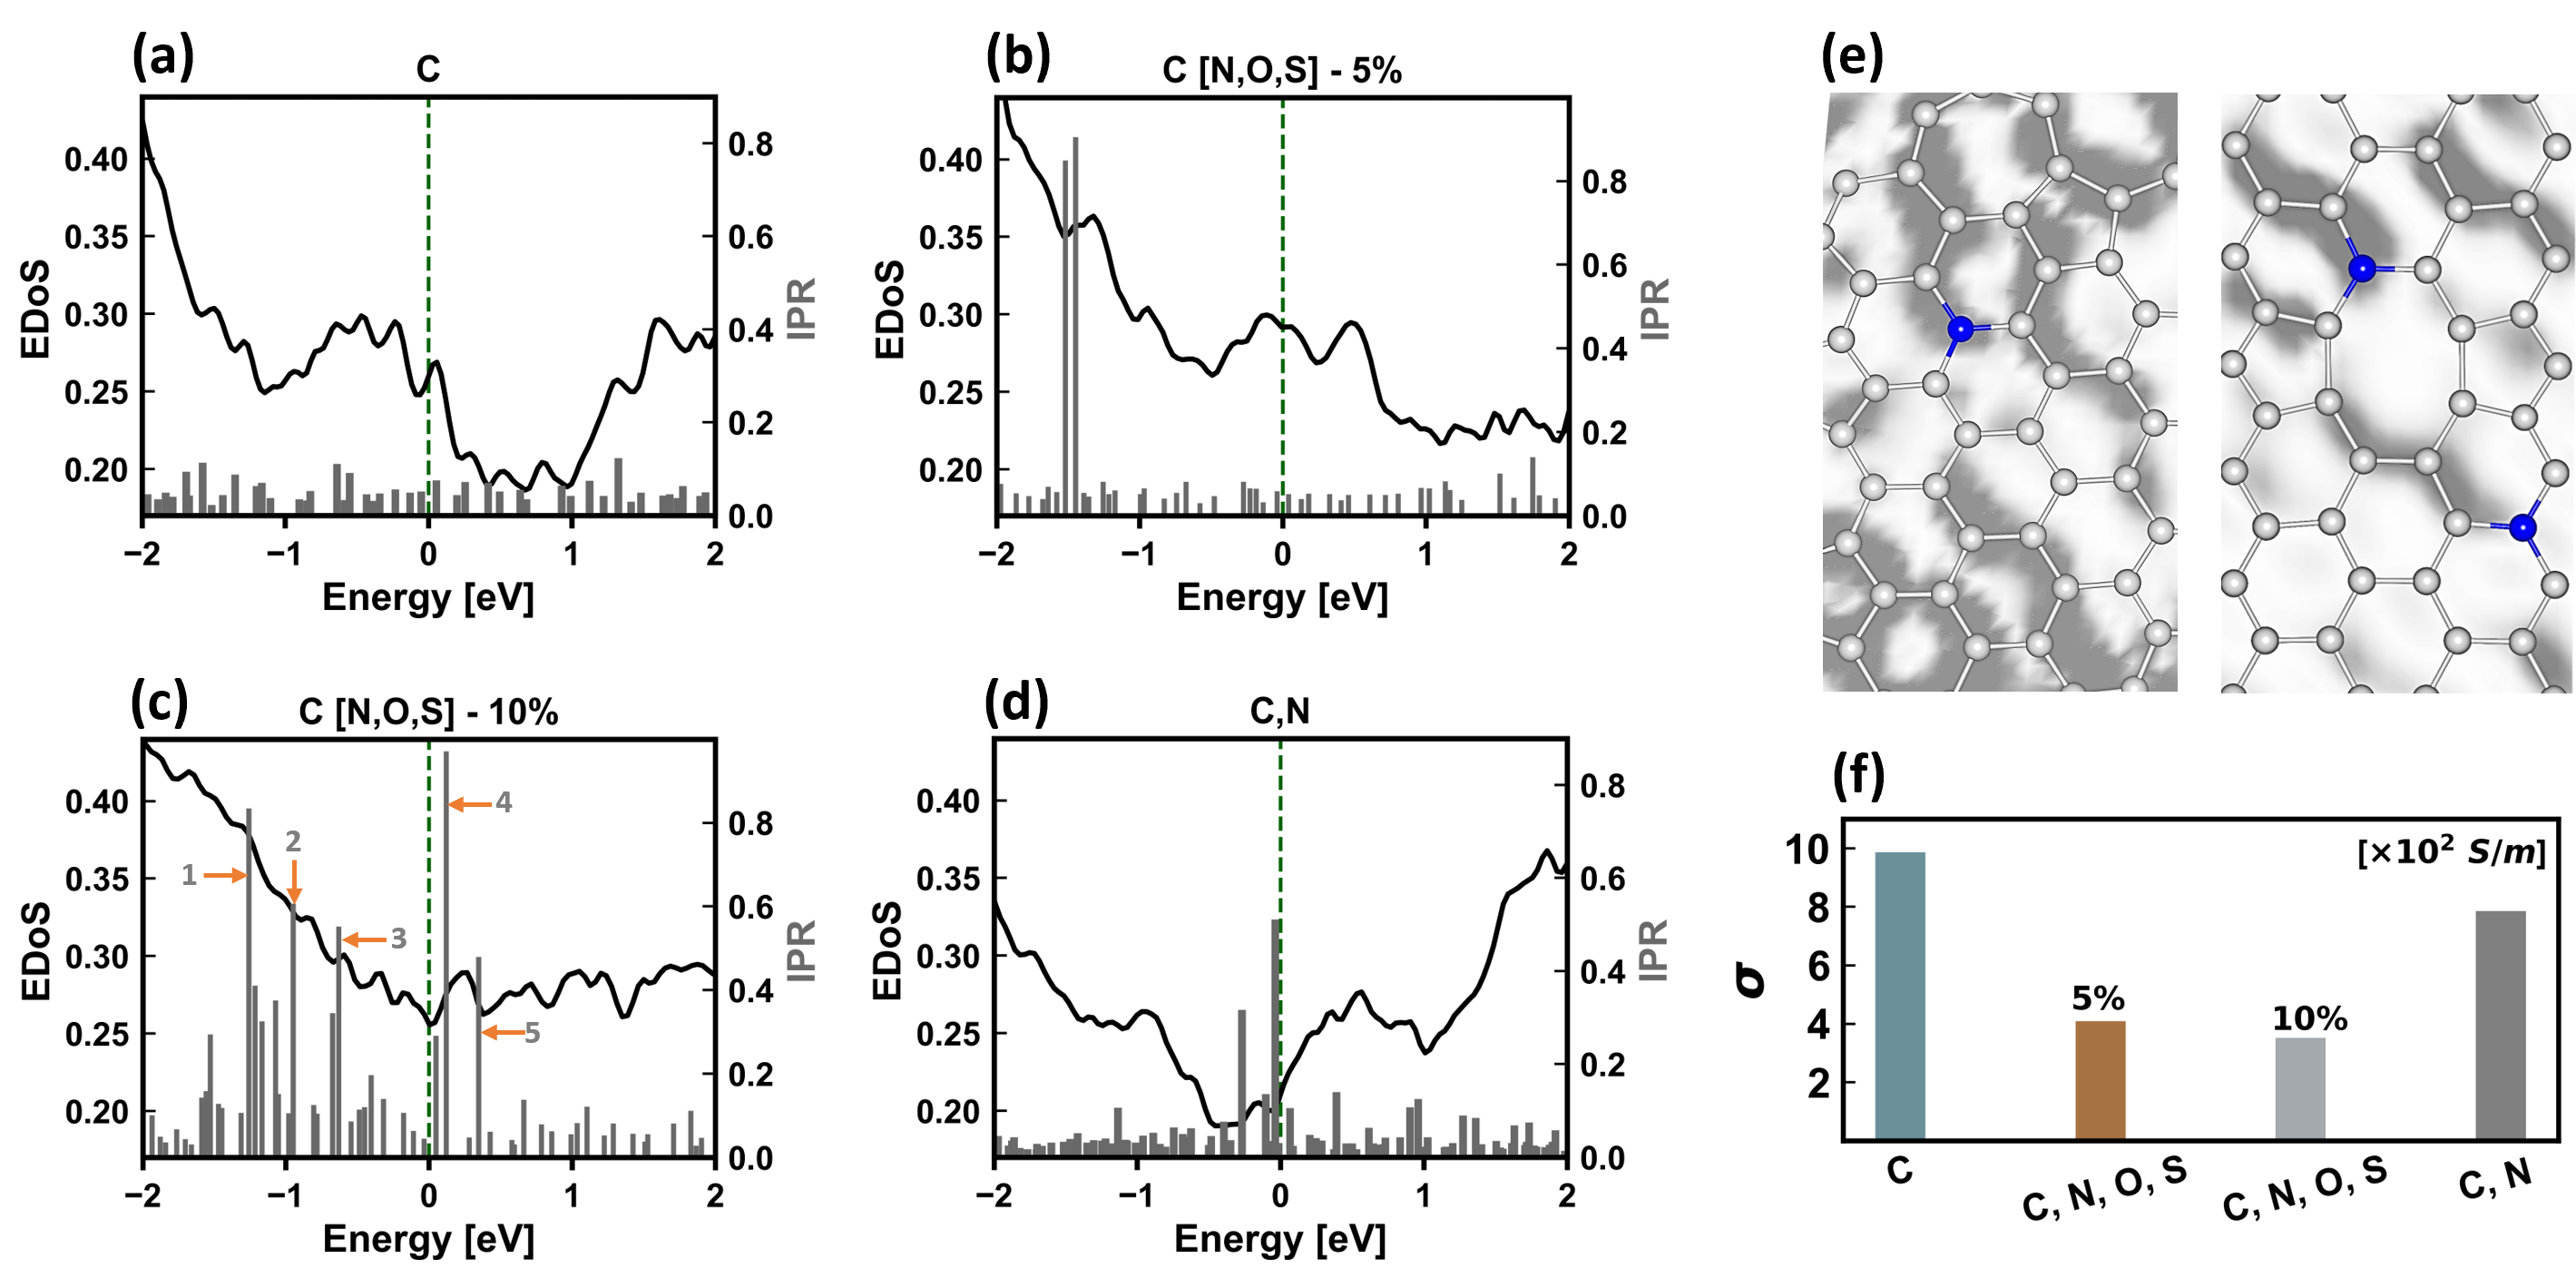
In Figure 6a-c, the electronic density of states (EDoS) is provided for three configurations: (a) amorphous graphite, and impure amorphous graphite with (b) 5% and (c) 10% impurity concentrations. The Fermi level (Ef) in the plots have been shifted to zero (indicated by the green dashed line), and only regions, Ef 2 eV, are displayed here. The complete electronic structures, plotted in Figure S3a, indicate minimal alterations to the overall electronic structure of amorphous graphite, when compared to the impure amorphous graphite in Figure S3b and c for 5% and 10% impurity concentrations. We use the inverse participation ration (IPR) to study localization of the electronic states. The IPR () is defined as:
| (4) |
where represents the contribution of the ith Kohn-Sham state to a given eigenvector (). A high IPR value ( 1) indicates that the wave function is localized on very few atoms. Conversely, a low value ( 0) indicates that the wave function is delocalized (distributed over many atoms).
The gray dashed lines in Figure 6a - c represent the IPR for the electronic bands. In amorphous graphite, the low IPR suggests the absence of localized states near Ef. However, the introduction of impurity elements leads to localized states near Ef (see Figure 6b and c).
We identified the elemental species responsible for the highly localized states in impure amorphous graphite, focusing on IPR values 0.5. In the layered nanostructure with 5% impurity concentration, two such states emerge, separated by 0.07 eV, and they are exclusively associated with a single ketone oxygen atom. When the impurity concentration is increased to 10%, additional localized states surface. In Figure 6c, states 1, 2, and 3 (marked by brown arrows) localize on distinct oxygen atoms forming ketones, while state 4 localizes on a thioketone. State 5, with IPR 0.48, is also centered on the same thioketone as state 4, albeit separated by 0.2 eV
We note that the nitrogen atoms in impure amorphous graphite do not contribute to the localized states around the Fermi energy (). Extensive research has focused on intentionally doping nitrogen into various carbon allotropes [69, 70]. For example, nitrogen has been introduced into graphite (or graphene) to create nitrogen-doped quantum dots [71], and into diamond to form nitrogen-vacancy centers for potential super-computing applications [72]. With this context, we computed the electronic structure for impure amorphous graphite containing 5 weight-percent of only nitrogen atoms, as shown in Figure 6d and Figure S3d. The models were constructed by repeating the simulation protocol detailed in Section 3.2, and a representation of the nitrogen-containing impure amorphous graphite model is provided in Figure S3e.
As shown in Figure S3d, the overall electronic structure of the layered structure with 5% nitrogen, exhibits minimal differences when compared to that of amorphous graphite (see Figure S3a). Notably, two states emerge in proximity to the Fermi level (refer to Figure 6d). However, these states (with IPR values of 0.32 and 0.51) do not exclusively localize on specific atoms; instead, they are distributed across a small number of atoms, implying an absence of true localization. This observation is further illustrated in Figure S3f for the state with the higher IPR value (IPR = 0.51).
Interestingly, while nitrogen atoms substitute for carbon atoms within the sp2 configuration of the layers, they do not contribute to localizing electronic states near . This leads to the question: Does nitrogen merely emulate carbon behavior within the layers, and how does it impact electronic conductivity in this layered nanostructure? To address this, we compute the electronic conduction and transport in the nitrogen-containing impure amorphous graphite, utilizing the space-projected conductivity (SPC) methodology [66].
The SPC framework utilizes the Kubo-Greenwood formula for electronic conductivity [73, 74] and the Kohn-Sham single-particle states () to project the electronic conductivity from a given atomic arrangement onto a spatial grid (see Reference [66] for details on the SPC method). Figure 6e depicts the electronic transport path using a grayscale heatmap within selected nitrogen-containing regions. Darker shades indicate high electronic conduction, while lighter areas indicate limited or absent electronic transport. Notably, the presence of nitrogen atoms along a conduction pathway acts to impede or completely halt electronic transport. To examine the potential impact of structural attributes on electronic conductivity originating from nitrogen within the layered nanostructure, we computed the radial distribution function (RDF) and bond angle distribution (BAD) for nitrogen-containing impure amorphous graphite (Figure S4a and b, respectively). The most prominent RDF peak, representing the average nearest neighbor distance calculated for carbon-carbon (C–C) and carbon-nitrogen (C–N) bonds, were closely aligned - separated by only 0.015 . The bond angle distribution (BAD) for central carbon (C–C–C) and central nitrogen (C–N–C), as depicted in Figure S4b, displayed similar pattern, with both having a maximum peak around 118 (close to the 120 angle in graphite). These suggest that nitrogen substitutions within the layered nanostructure maintain the precise sp2 layered arrangement of the carbon atoms. Consequently, the impedance of electronic conduction pathways by nitrogen atoms does not stem from their structural attributes within impure amorphous graphite.
Our prior research highlighted that electronic conductivity in amorphous graphite favors path with interconnected 6-membered (hexagonal) rings [28]. Building on this understanding, we now observe that the introduction of nitrogen atoms, even within a 6-membered ring arrangement, disrupts electronic conduction within the planes. This insight suggests that purposefully incorporating nitrogen into graphite derived from other carbonaceous materials could provide unique avenues for electronic conduction. The average electrical conductivity () was calculated for both amorphous graphite and impure amorphous graphite with varying impurity weight percentages (see Figure 6f). The electronic conductivity of pure carbon amorphous structure measured significantly lower by a factor of 100 compared to crystalline graphite [28]. The electronic conductivity of nitrogen-containing impure amorphous graphite was 20% lower than that of amorphous graphite. The incorporation of oxygen and sulfur impurities further decreased the conductivity values. In comparison to amorphous graphite, the electronic conductivity dropped by 58% and 64% in impure amorphous graphite with 5% and 10% impurity concentrations, respectively. These estimates are qualitative but indicative of the transport consequences of the impurities.
4 Conclusions
The thrust of this work is to offer a first-of-its-kind, pragmatic perspective into the structure, vibrational behavior, and electronic properties of impure amorphous graphite, derived from coal-like atomistic models through high-temperature transformation.Employing a novel simulation protocol with the REAXFF potential, designed to replicate the initial carbonization stages leading to single-molecule coke formation, this research unveils enduring functional groups containing non-carbon elements during the pyrolysis of bituminous coal at 1200 K. Leveraging ab initio DFT, the graphitization of models featuring coal-like elemental compositions, including carbon atoms with 5 and 10 weight-percent of nitrogen, oxygen, and sulfur atoms, is explored. The findings emphasize the overall vibrational and electronic structure of the impure amorphous graphite bear significant similarity to that of amorphous graphite. However, the presence of nitrogen, particularly in graphitic form, impedes electronic conductivity within layers. This research advances both methodologies and insights for exploring coal’s alternative applications beyond energy production, offering valuable contributions to its integration into cutting-edge electronic technologies.
Acknowledgments
C.U. extends gratitude to Mr. Dan Connell and to CONSOL Energy Inc. for providing the invaluable research internship opportunity (at CONSOL Innovations LLC) which played a pivotal role in facilitating the successful culmination of this work. C.U. also express his appreciation to the Nanoscale & Quantum Phenomena Institute (NQPI) for the financial support conferred through the NQPI research fellowship. The Authors thank Ms. Anna-Theresa Kirchtag for proofreading the manuscript.
This material is based upon work supported by the Department of Energy under Award Number DE-FE0032143. It also used computational resources at Pittsburgh Supercomputing Center (Bridges-2 Regular Memory) through allocations phy230007p and dmr190008p from the Advanced Cyberinfrastructure Coordination Ecosystem: Services & Support (ACCESS), supported by National Science Foundation grants; 2138259, 2138286, 2138307, 2137603, and 2138296.
References
- [1] J. Zhang, C. Liang, J. B. Dunn, Graphite flows in the us: Insights into a key ingredient of energy transition, Environmental Science & Technology 57 (8) (2023) 3402–3414.
- [2] M. Hendryx, K. J. Zullig, J. Luo, Impacts of coal use on health, Annual review of public health 41 (2020) 397–415.
- [3] E. Amster, C. Lew Levy, Impact of coal-fired power plant emissions on children’s health: a systematic review of the epidemiological literature, International Journal of Environmental Research and Public Health 16 (11) (2019) 2008.
- [4] G. A. Edwards, Coal and climate change, Wiley Interdisciplinary Reviews: Climate Change 10 (5) (2019) e607.
- [5] U.S. Department of Energy Releases 2023 Critical Materials Assessment to Evaluate Supply Chain Security for Clean Energy Technologies, www.energy.gov/eere/articles/us-department-energy-releases-2023-critical-materials-assessment-evaluate-supply/, accessed: 2023-08-24.
- [6] E. Gingerich, ” eco-friendly” marketing: Beyond the label, Journal of Applied Business and Economics 17 (3) (2015).
- [7] DOE Invests $6 Million to Develop Useful Products from Coal and Coal Wastes, www.energy.gov/fecm/articles/doe-invests-6-million-develop-useful-products-coal-and-coal-wastes-support-clean, accessed: 2023-08-05.
- [8] materialstoday: Amorphous graphite adds new layer to carbon materials, www.materialstoday.com/carbon/news/amorphous-graphite-layer-carbon-materials/, accessed: 2023-05-20.
- [9] M. Shi, C. Song, Z. Tai, K. Zou, Y. Duan, X. Dai, J. Sun, Y. Chen, Y. Liu, Coal-derived synthetic graphite with high specific capacity and excellent cyclic stability as anode material for lithium-ion batteries, Fuel 292 (2021) 120250.
- [10] M. Bora, D. Bhattacharjya, B. K. Saikia, Coal-derived activated carbon for electrochemical energy storage: Status on supercapacitor, li-ion battery, and li–s battery applications, Energy & Fuels 35 (22) (2021) 18285–18307.
- [11] T. Liu, R. Luo, W. Qiao, S.-H. Yoon, I. Mochida, Microstructure of carbon derived from mangrove charcoal and its application in li-ion batteries, Electrochimica Acta 55 (5) (2010) 1696–1700.
- [12] W.-L. Song, S. Li, G. Zhang, J. Tu, H.-S. Chen, S. Jiao, Cellulose-derived flake graphite as positive electrodes for al-ion batteries, Sustainable Energy & Fuels 3 (12) (2019) 3561–3568.
- [13] Y. A. Al-Majali, C. T. Chirume, E. P. Marcum, D. A. Daramola, K. S. Kappagantula, J. P. Trembly, Coal-filler-based thermoplastic composites as construction materials: a new sustainable end-use application, ACS Sustainable Chemistry & Engineering 7 (19) (2019) 16870–16878.
- [14] United States National Energy technology Laboratory: Carbon Ore Processing, https://netl.doe.gov/resource-sustainability/carbon-ore-processing, accessed: 2023-07-20.
-
[15]
K. N. Subedi, K. Nepal, C. Ugwumadu, K. Kappagantula, D. A. Drabold,
Electronic transport in
copper–graphene composites, Applied Physics Letters 122 (3) (2023)
031903.
doi:10.1063/5.0137086.
URL https://doi.org/10.1063/5.0137086 -
[16]
A. Nittala, J. Smith, B. Gwalani, J. Silverstein, F. F. Kraft, K. Kappagantula,
Simultaneously
improved electrical and mechanical performance of hot-extruded bulk scale
aluminum-graphene wires, Materials Science and Engineering: B 293 (2023)
116452.
doi:https://doi.org/10.1016/j.mseb.2023.116452.
URL https://www.sciencedirect.com/science/article/pii/S0921510723001940 - [17] J. C. Crelling, Coal carbonization, in: Applied Coal Petrology, Elsevier, 2008, pp. 173–192.
- [18] G. Deshpande, P. Solomon, M. Serio, Crosslinking reactions in coal pyrolysis, Prepr Am Chem Soc Div Fuel Chem 33 (2) (1988) 310–321.
- [19] P. R. Solomon, T. H. Fletcher, R. J. Pugmire, Progress in coal pyrolysis, Fuel 72 (5) (1993) 587–597.
- [20] A. Oberlin, S. Bonnamy, K. Oshida, Landmarks for graphitization, Tanso 2006 (224) (2006) 281–298.
- [21] A. Oberlin, Carbonization and graphitization, Carbon 22 (6) (1984) 521–541.
- [22] M. Whittaker, L. Grindstaff, The irreversible expansion of carbon bodies during graphitization, Carbon 7 (5) (1969) 615–621.
- [23] R. E. Franklin, Crystallite growth in graphitizing and non-graphitizing carbons, Proceedings of the Royal Society of London. Series A. Mathematical and Physical Sciences 209 (1097) (1951) 196–218.
- [24] X. Bourrat, A. Oberlin, J. Escalier, Sulphur behaviour during asphalt heat-treatment, Fuel 66 (4) (1987) 542–550.
- [25] S. Potgieter-Vermaak, N. Maledi, N. Wagner, J. Van Heerden, R. Van Grieken, J. Potgieter, Raman spectroscopy for the analysis of coal: a review, Journal of Raman Spectroscopy 42 (2) (2011) 123–129.
- [26] Y. Chen, C. Zou, M. Mastalerz, S. Hu, C. Gasaway, X. Tao, Applications of micro-fourier transform infrared spectroscopy (ftir) in the geological sciences—a review, International journal of molecular sciences 16 (12) (2015) 30223–30250.
- [27] B. Zhou, Q. Liu, L. Shi, Z. Liu, Electron spin resonance studies of coals and coal conversion processes: A review, Fuel Processing Technology 188 (2019) 212–227.
- [28] R. Thapa, C. Ugwumadu, K. Nepal, J. Trembly, D. A. Drabold, Ab initio simulation of amorphous graphite, Phys. Rev. Lett. 128 (2022) 236402. doi:10.1103/PhysRevLett.128.236402.
- [29] C. Ugwumadu, R. Thapa, K. Nepal, D. A. Drabold, Atomistic nature of amorphous graphite, European Journal of Glass Science and Technology Part B 64 (2023) 16–22. doi:10.13036/17533562.64.1.18.
- [30] C. Ugwumadu, K. Nepal, R. Thapa, Y. Lee, Y. Al Majali, J. Trembly, D. Drabold, Simulation of multi-shell fullerenes using machine-learning gaussian approximation potential, Carbon Trends 10 (2023) 100239. doi:https://doi.org/10.1016/j.cartre.2022.100239.
- [31] C. Ugwumadu, R. Thapa, Y. Al-Majali, J. Trembly, D. A. Drabold, Formation of amorphous carbon multi-walled nanotubes from random initial configurations, physica status solidi (b) 260 (3) (2023) 2200527. doi:https://doi.org/10.1002/pssb.202200527.
-
[32]
P. Hohenberg, W. Kohn,
Inhomogeneous
electron gas, Phys. Rev. 136 (1964) B864–B871.
doi:10.1103/PhysRev.136.B864.
URL https://link.aps.org/doi/10.1103/PhysRev.136.B864 - [33] K. Prasai, K. N. Subedi, K. Ferris, P. Biswas, D. A. Drabold, Spatial Projection of Electronic Conductivity: The Example of Conducting Bridge Memory Materials, physica status solidi (RRL) – Rapid Research Letters 12 (9) (2018) 1800238. doi:https://doi.org/10.1002/pssr.201800238.
- [34] K. N. Subedi, K. Prasai, D. A. Drabold, Phys. Status Solidi B 258 (2020) 2000438.
-
[35]
A. C. T. van Duin, S. Dasgupta, F. Lorant, W. A. Goddard,
ReaxFF: a
reactive force field for hydrocarbons, The Journal of Physical Chemistry A
105 (41) (2001) 9396–9409.
doi:10.1021/jp004368u.
URL https://doi.org/10.1021/jp004368u - [36] A. P. Thompson, H. M. Aktulga, R. Berger, D. S. Bolintineanu, W. M. Brown, P. S. Crozier, P. J. in ’t Veld, A. Kohlmeyer, S. G. Moore, T. D. Nguyen, R. Shan, M. J. Stevens, J. Tranchida, C. Trott, S. J. Plimpton, LAMMPS - a flexible simulation tool for particle-based materials modeling at the atomic, meso, and continuum scales, Computer Physics Communications 271 (2022) 108171. doi:https://doi.org/10.1016/j.cpc.2021.108171.
- [37] G. Kresse, J. Furthmüller, Efficient iterative schemes for ab initio total-energy calculations using a plane-wave basis set, Phys. Rev. B 54 (1996) 11169–11186. doi:10.1103/PhysRevB.54.11169.
- [38] W. Shinoda, M. Shiga, M. Mikami, Rapid estimation of elastic constants by molecular dynamics simulation under constant stress, Physical Review B 69 (13) (2004) 134103.
- [39] G. J. Martyna, D. J. Tobias, M. L. Klein, Constant pressure molecular dynamics algorithms, The Journal of chemical physics 101 (5) (1994) 4177–4189.
- [40] M. Parrinello, A. Rahman, Polymorphic transitions in single crystals: A new molecular dynamics method, Journal of Applied physics 52 (12) (1981) 7182–7190.
- [41] P. R. SOLOMON, Coal structure and thermal decomposition, ACS Publications, 1981.
- [42] W. White, C. Bartholomew, W. Hecker, D. Smith, Changes in surface area, pore structure and density during formation of high-temperature chars from representative us coals, Adsorption Science & Technology 7 (4) (1990) 180–209.
- [43] N. L. Allinger, Y. H. Yuh, J. H. Lii, Molecular mechanics. the mm3 force field for hydrocarbons. 1, Journal of the American Chemical Society 111 (23) (1989) 8551–8566.
- [44] J. M. Martínez, L. Martínez, Packing optimization for automated generation of complex system’s initial configurations for molecular dynamics and docking, Journal of computational chemistry 24 (7) (2003) 819–825.
- [45] M. Dalla Torre, R. F. Mählmann, W. Ernst, Experimental study on the pressure dependence of vitrinite maturation, Geochimica et Cosmochimica Acta 61 (14) (1997) 2921–2928.
- [46] Rudolph Olson III (CONSOL Innovations), Private Communication- Certificate of Analysis for Pittsburg seam No. 8 coal from CoalTech Petrographic Associates, Inc. CPA No.: 103084 (2018).
- [47] C. E. Barker, M. J. Pawlewicz, Calculation of vitrinite reflectance from thermal histories and peak temperatures: a comparison of methods, ACS Publications, 1994.
- [48] C. E. Barker, R. H. Goldstein, Fluid-inclusion technique for determining maximum temperature in calcite and its comparison to the vitrinite reflectance geothermometer, Geology 18 (10) (1990) 1003–1006.
- [49] E. Acheson, Production of artificial crystalline carbonaceous materials, US Patent 492 (1893) 767.
- [50] T. Qiu, J.-G. Yang, X.-J. Bai, Preparation of coal-based graphite with different microstructures by adjusting the content of ash and volatile matter in raw coal, Energy Sources, Part A: Recovery, Utilization, and Environmental Effects 42 (15) (2020) 1874–1881.
- [51] T. Qiu, J.-G. Yang, X.-J. Bai, Y.-L. Wang, The preparation of synthetic graphite materials with hierarchical pores from lignite by one-step impregnation and their characterization as dye absorbents, RSC advances 9 (22) (2019) 12737–12746.
- [52] J. P. Perdew, K. Burke, M. Ernzerhof, Generalized gradient approximation made simple, Phys. Rev. Lett. 77 (1996) 3865–3868. doi:10.1103/PhysRevLett.77.3865.
- [53] P. E. Blöchl, Projector augmented-wave method, Phys. Rev. B 50 (1994) 17953–17979. doi:10.1103/PhysRevB.50.17953.
- [54] H. Wang, Y. H. Hu, Effect of oxygen content on structures of graphite oxides, Industrial & engineering chemistry research 50 (10) (2011) 6132–6137.
- [55] J.-J. Adjizian, C. Latham, S. Öberg, P. Briddon, M. Heggie, Dft study of the chemistry of sulfur in graphite, including interactions with defects, edges and folds, Carbon 62 (2013) 256–262.
- [56] J. Kipling, P. Shooter, R. Young, The effect of sulphur on the graphitization of carbons derived from polyvinyl chloride-sulphur systems, Carbon 4 (3) (1966) 333–341.
- [57] H. He, T. Riedl, A. Lerf, J. Klinowski, Solid-state nmr studies of the structure of graphite oxide, The Journal of physical chemistry 100 (51) (1996) 19954–19958.
- [58] F. Li, W. Xu, L. Lu, K. Zhou, Z. Xia, Preparation of sulfur-doped graphite by solid-state microwave method: The effect of reaction conditions on the sulfur-doping process, Chemical Physics Letters 731 (2019) 136615.
- [59] G. Berthier, The chemistry of the Carbonyl Group, Interscience Publishers a division of John Wiley & Sons, 1966.
- [60] J. H. Nelson, K. C. Kemp, B. E. Bursten, H. E. LeMay Jr, Laboratory Experiments for Brown, LeMay and Bursten, Chemistry, the Central Science, Prentice Hall, 1997.
- [61] F. H. Allen, O. Kennard, D. G. Watson, L. Brammer, A. G. Orpen, R. Taylor, Tables of bond lengths determined by x-ray and neutron diffraction. part 1. bond lengths in organic compounds, Journal of the Chemical Society, Perkin Transactions 2 (12) (1987) S1–S19.
- [62] G. Gunbas, N. Hafezi, W. L. Sheppard, M. M. Olmstead, I. V. Stoyanova, F. S. Tham, M. P. Meyer, M. Mascal, Extreme oxatriquinanes and a record c–o bond length, Nature chemistry 4 (12) (2012) 1018–1023.
-
[63]
J. D. Korp, I. Bernal, S. F. Watkins, F. R. Fronczek,
The
stereochemistry of organosulfur compounds. xix. the crystal and molecular
structure of
10-(1,3-dithiolan-2-ylidene)-10h-indeno[1,2-f]-1,2,3,4,5-pentathiepin,
Journal of Heterocyclic Chemistry 19 (3) (1982) 459–462.
doi:https://doi.org/10.1002/jhet.5570190302.
URL https://onlinelibrary.wiley.com/doi/abs/10.1002/jhet.5570190302 -
[64]
R. J. Bell, D. C. Hibbins-Butler,
Acoustic and optical modes
in vitreous silica, germania and beryllium fluoride, Journal of Physics C:
Solid State Physics 8 (6) (1975) 787–792.
doi:10.1088/0022-3719/8/6/009.
URL https://doi.org/10.1088/0022-3719/8/6/009 - [65] C. Ugwumadu, K. Subedi, R. Thapa, P. Apsangi, S. Swain, M. Kozicki, D. Drabold, Structure, vibrations and electronic transport in silicon suboxides: Application to physical unclonable functions, Journal of Non-Crystalline Solids: X 18 (2023) 100179.
-
[66]
K. N. Subedi, K. Prasai, D. A. Drabold,
Space-projected
conductivity and spectral properties of the conduction matrix, physica
status solidi (b) 258 (9) (2021) 2000438.
doi:https://doi.org/10.1002/pssb.202000438.
URL https://onlinelibrary.wiley.com/doi/abs/10.1002/pssb.202000438 -
[67]
X. Tan, H. Shao, T. Hu, G. Liu, J. Jiang, H. Jiang,
High thermoelectric performance
in two-dimensional graphyne sheets predicted by first-principles
calculations, Phys. Chem. Chem. Phys. 17 (2015) 22872–22881.
doi:10.1039/C5CP03466C.
URL http://dx.doi.org/10.1039/C5CP03466C - [68] M. Marinov, N. Zotov, Model investigation of the raman spectra of amorphous silicon, Physical review B 55 (5) (1997) 2938.
- [69] P. Stumm, D. Drabold, Structural and electronic properties of nitrogen doped fourfold amorphous carbon, Solid state communications 93 (7) (1995) 617–621.
- [70] P. Stumm, D. Drabold, P. Fedders, Defects, doping, and conduction mechanisms in nitrogen-doped tetrahedral amorphous carbon, Journal of applied physics 81 (3) (1997) 1289–1295.
- [71] R. Ye, C. Xiang, J. Lin, Z. Peng, K. Huang, Z. Yan, N. P. Cook, E. L. Samuel, C.-C. Hwang, G. Ruan, et al., Coal as an abundant source of graphene quantum dots, Nature communications 4 (1) (2013) 2943.
- [72] H. Dyer, F. Raal, L. Du Preez, J. Loubser, Optical absorption features associated with paramagnetic nitrogen in diamond, Philosophical Magazine 11 (112) (1965) 763–774.
-
[73]
R. Kubo, M. Yokota, S. Nakajima,
Statistical-mechanical theory of
irreversible processes. ii. response to thermal disturbance, Journal of the
Physical Society of Japan 12 (11) (1957) 1203–1211.
doi:10.1143/JPSJ.12.1203.
URL https://doi.org/10.1143/JPSJ.12.1203 -
[74]
D. A. Greenwood, The
Boltzmann Equation in the Theory of Electrical Conduction in Metals,
Proceedings of the Physical Society 71 (4) (1958) 585–596.
doi:10.1088/0370-1328/71/4/306.
URL https://doi.org/10.1088/0370-1328/71/4/306