What drives the wheels of evolution in NGC 1512?
Abstract
Context. Environmental and secular processes play a pivotal role in the evolution of galaxies. These can be due to external processes such as interactions or internal processes due to the action of bar, bulge and spiral structures. Ongoing star formation in spiral galaxies can be affected by these processes. By studying the star formation progression in the galaxy, we can gain insights into the role of different processes that regulate the overall evolution of a galaxy.
Aims. The ongoing interaction between barred-spiral galaxy NGC 1512 and its satellite NGC 1510 offers an opportunity to investigate how galactic interactions and the presence of a galactic bar influence the evolution of NGC 1512. We aim to understand the recent star formation activity in the galaxy pair and thus gain insight into the evolution of NGC 1512.
Methods. The UltraViolet Imaging Telescope (UVIT) onboard AstroSat enables us to characterize the star-forming regions in the galaxy with a superior spatial resolution of 85 pc in the galaxy rest frame. We identified and characterized 175 star-forming regions in the UVIT FUV image of NGC 1512 and correlated with the neutral hydrogen (Hi) distribution. Extinction correction was applied to the estimated photometric magnitude. We traced the star-forming spiral arms of the galaxy and studied the star formation properties across the galaxy in detail.
Results. We detected localized regions of star formation enhancement and distortions in the galactic disk. We found this to be consistent with the distribution of Hi in the galaxy. This is evidence of past and ongoing interactions affecting the star formation properties of the galaxy. We studied the properties of the inner ring. We find that the regions of the inner ring show maximum star formation rate density () near the major axis of the bar, hinting at a possible crowding effect in these regions. The region of the bar in the galaxy is also depleted of UV emission. This absence suggests that the galactic bar may have played an active role in the redistribution of gas and quenching of star formation inside identified bar region. Hence, we suggest that both the secular and environmental factors might be influencing the evolution of NGC 1512.
Key Words.:
galaxies:spiral – interaction – star formation1 Introduction
Galaxies are fundamental building blocks of the Universe. Understanding the evolutionary processes of galaxies requires a comprehensive investigation of the interplay between environmental effects, such as interactions, and internal structures like bars, oval disks, and spiral arms. In the context of the Local Universe, there is a transition occurring in the primary drivers of galactic evolution. In the early Universe, the dominant forces were characterized by violent and rapid processes, such as mergers. However, there is now a discernible shift towards a more gradual restructuring of mass and energy, attributable to the influence of secular evolution (Kormendy & Kennicutt, 2004). Decoding the aspects of a galaxy, such as its gas content, star formation activity, and structural properties, provides valuable insights into its evolution. This understanding can be achieved by recognizing the significant impacts exerted by both secular and environmental factors on these crucial galaxy characteristics (Toomre & Toomre, 1972; Skibba et al., 2009).
One of the observable parameters that can be used to understand the factors influencing the evolution of a galaxy is the star formation activity. By measuring the star formation rate (SFR) and analyzing the spatial distribution of young stars, crucial insights into the galaxy’s evolution can be obtained. The intense ultraviolet continuum radiation emitted by young massive stars of spectral types O, B, and A serves as a direct indicator of ongoing and recent star formation (Kennicutt, 1998). The understanding of star formation goes beyond quantifying the star formation rate (SFR) and requires an exploration of the underlying mechanisms governing this process. At its core, star formation relies on the presence of cold, neutral gas as the fundamental ingredient. The significance of neutral hydrogen (Hi) gas in supporting and sustaining star formation is well-established (Doyle & Drinkwater, 2006; Leroy et al., 2008; Kennicutt & Evans, 2012; Zhou et al., 2018; Parkash et al., 2018). By examining the UV properties of galaxies and analyzing the spatial distribution of Hi gas, valuable insights can be gleaned regarding the mechanisms responsible for recent star formation and, consequently, the evolution of the galaxy. This approach allows for a comprehensive understanding of the interplay between star formation processes and the presence of neutral hydrogen gas, shedding light on the underlying dynamics shaping galactic evolution.
The galaxy pair NGC 1512/1510 is located on the edge of the Local Volume at a distance of 12.60 Mpc (Tully et al., 2016). The massive barred-spiral galaxy NGC 1512 and its satellite, NGC 1510, a Blue Compact Dwarf (BCD), separated by a distance of 14 kpc, are undergoing interaction that started about 400 Myr ago (Koribalski & López-Sánchez, 2009). NGC 1512 hosts a strong bar (bar strength, , Buta et al., 2005, 2006), which might have formed as a result of interactions (Koribalski & López-Sánchez, 2009). It hosts a circumnuclear ring of diameter 16″ 12″and is subjected to intense starbursts. The galaxy also hosts an oval inner ring of diameter 3′ 2′, which is elongated along the major axis of the bar (with the relative angle between the bar and inner major axis 10∘) (Maoz et al., 2001; Meurer et al., 2006). The inner ring is notable for its sharp definition due to an enhanced degree of star formation (Hawarden et al., 1979). The galaxy has spiral arms wound around it, with one of the arms disrupted, possibly due to its interaction with the NGC 1510. Studies have also discussed the possibility of arms being formed due to tidal interactions (Kinman, 1978; Ducci et al., 2014). The properties of the galaxy pair are listed in Table 1. We identify NGC 1512 as the main galaxy and NGC 1510 as the satellite galaxy, based on their mass ratio of 50:1 (Chakrabarti et al., 2011). The galaxy NGC 1512 is, thus, an excellent target for our investigation, as it offers a compelling opportunity to study the combined effects of environmental and secular components.
| Parameter | NGC 1512 | NGC 1510 |
|---|---|---|
| Type | SB(r)a1 | SA0 pec - BCD1 |
| Central RA [hh mm ss] | 04 03 54.281 | 04 03 32.61 |
| Central Dec [dd mm ss] | -43 20 55.91 | -43 24 00.51 |
| Redshift (z) | 0.002992 | 0.003043 |
| Inclination (i) | 42.5∘4 | 47∘1 |
| Position angle (PA) | 40∘4 | 90∘1 |
NGC 1512 possesses a unique combination of location, morphological features, and environmental characteristics that make it an ideal candidate for unraveling the role played by various evolutionary mechanisms in the local Universe. The presence of a bar in NGC 1512 introduces unique dynamics that profoundly impact the galaxy’s structure and evolution, while the close proximity of the galaxy pair offers a unique opportunity to investigate the local impact of the interaction. Limited attention has been given to understanding how the presence of a galactic bar and the interactions with neighboring galaxies contribute to the evolution of NGC 1512 (Hawarden et al., 1979; Kinman, 1978; Li et al., 2008; Koribalski & López-Sánchez, 2009; Ma et al., 2017; Smirnova et al., 2020). GALEX (Martin et al., 2005) has observed the galaxy pair NGC 1512/1510 with a resolution of 5″. However, the UltraViolet Imaging Telescope (UVIT) onboard AstroSat (Kumar et al., 2012) provides higher resolution data (resolution of 1.4″). Thus, we aim to leverage the high-resolution UV data obtained from the UVIT, along with Hi data from MeerKAT (Jonas & MeerKAT Team, 2016; Jonas, 2018), to gain insights into the evolution of NGC 1512.
This study investigates the effects of interaction events and the galactic bar on the evolution of NGC 1512, with the aim of understanding how each of these factors influences star formation activity and galactic morphology. The paper is arranged as follows. The data and analysis are discussed in Section 2. The results and discussion are presented in Section 3. The summary is given in Section 4. We have adopted a flat universe cosmology throughout this paper with = 71 kms-1Mp and (Komatsu et al., 2011). In the galaxy rest frame, 1″corresponds to a distance of 60.9 pc.
2 Data and Analysis
2.1 UVIT Data
To understand the driving mechanisms behind the evolution of the interacting galaxy pair NGC 1512/1510, we use data from UVIT, which is available at the AstroSat ISSDC archive111https://astrobrowse.issdc.gov.in/astro_archive/archive/Home.jsp. UVIT has three bands - Far UltraViolet (FUV; 130-180 nm), Near UltraViolet (NUV; 200-300 nm) and VISible (VIS; 320-550nm), with the capability to observe simultaneously in all three bands. The VIS channel is used to track the drift of the satellite during observations. The instrument has a 28 field of view, spatial resolution of and for FUV and NUV filters, respectively and a plate scale of 0.416″pixel-1. The UVIT, thus, provides a better spatial resolution in UV when compared to its predecessor, GALEX.
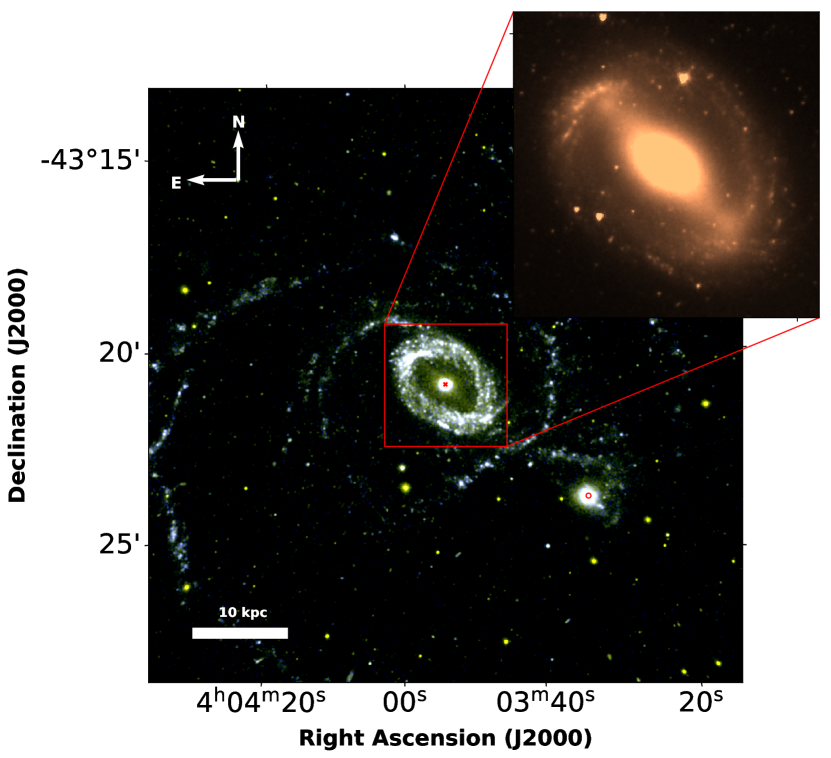
UVIT observed the galaxy pair of NGC 1512/1510 in FUV and NUV channels (PI: Kanak Saha, Obs. ID: ). NGC 1512 has been observed in broadband filters of F154W (FUV, hereafter) and N242W (NUV, hereafter). The observation details are presented in Table 2. We used the software package CCDLab (Postma & Leahy, 2017) to reduce the Level 1 data. Drift correction has been accounted for using the VIS images. Each image is corrected for fixed pattern noise, distortion and drift, and flat fielded using CCDLab (Girish et al., 2017; Postma & Leahy, 2017). Final deep images are produced by combining the corrected images. The astrometric solutions are also made using the same software. Figure 1 represents the UVIT colour composite image of NGC 1512/1510 pair generated using the emission in FUV and NUV. The zero point magnitude values for the FUV and NUV filters are 17.77 and 19.76 mag respectively (Tandon et al., 2017, 2020). The inset shows the IRAC 3.6 m image of the galaxy pair, where the galactic bar in NGC 1512 is visible.
| Facility | Filter | Peak | Date of Obs. | Exp. Time |
|---|---|---|---|---|
| UVIT | FUV | 1541 Å | 30 Aug 2017 | 3276.2s |
| NUV | 2418 Å | 30 Aug 2017 | 3659.2s | |
| MeerKAT | 21 cm | 29 May 2019 | 21600s |
2.2 MeerKAT Data
The neutral hydrogen gas (Hi) is a good tracer of gas distribution and kinematics in a galaxy. Previous Hi observations of nearby galaxies have allowed the investigations of the possible triggering mechanisms of starbursts (Lelli et al., 2014; Zhang et al., 2020). We obtained MeerKAT (Jonas & MeerKAT Team, 2016; Jonas, 2018) L-band raw data from the archive 222https://apps.sarao.ac.za/katpaws/archive-search (Obs. ID: 20190515-0022) for NGC 1512/1510. The log of observations for the galaxy pair is tabulated in Table 2. At a frequency of 1.4 GHz, the telescope has a large field of view of 0.85 deg2, covering the galaxy pair. The source J0408-6545 was employed as the flux density or primary calibrator, while the source J0440-4333 was the gain calibrator. We carried out the data reduction using CARACal (Józsa et al., 2020), which included both continuum and line imaging. We followed the standard data reduction procedure by removing bad channels, automatic removal of radio frequency interference (RFI; Offringa et al., 2012), and carrying out flux, bandpass and gain calibration. We used the SoFiA-2 (Serra et al., 2015) tool for detecting Hi sources and generating the clean mask used in WSClean (Offringa et al., 2014) cube imaging. Further details on the data calibration, imaging, and source finding are summarised in Healy et al. (2021). In this paper, we only utilise MeerKAT data to correlate the distribution of Hi with UV distribution for the galaxy pair. A detailed analysis to understand the Hi dynamics in the galaxy pair is in preparation.
2.3 Extinction
One of the major drawbacks while studying star formation in the UV continuum is its sensitivity to extinction (Kennicutt, 1998). The UV flux determined should therefore be corrected for extinction. We take the rest-frame extinction into account for our studies. The reddening coefficients, c(, is defined as the ratio of the observed flux density of to the unreddened flux density of the same line. This gives us an estimation of reddening caused by the interstellar dust. We crossmatched the star-forming regions identified in López-Sánchez et al. (2015) with the identified star-forming regions in this study for reddening coefficient values. In case of a direct match, we adopted the reddening coefficient values for the identified region. For the regions identified newly in our study, we assumed an average value of the reddening coefficient of the five nearest regions identified in the previous study. We estimated the extinction in FUV by utilizing the extinction value of reported by Schlafly & Finkbeiner (2011) for NGC 1512 and NGC 1510. The total reddening is calculated by taking the sum of rest-frame and Milky Way reddening values, as discussed in Karthick et al. (2014):
| (1) |
We used the Cardelli et al. (1989) extinction law with and utilised the extinction module in Astropy (Astropy Collaboration et al., 2013) to estimate the value of extinction coefficients () for filters of FUV and NUV bands for individual regions. After estimating the total extinction value, we corrected the FUV and NUV magnitudes, which will be used in further analysis.
2.4 Identification of star-forming regions in NGC 1512
Star-forming regions provide important information about the evolutionary sequence of a galaxy. We made use of the ProFound package to identify the brightest regions from the UVIT FUV band images. ProFound is an astronomical data processing tool available in the R programming language (Robotham et al., 2018). Using watershed deblending, ProFound locates the image’s peak flux areas and identifies the source segments. The total photometry is then estimated using iterative expansion (dilation) of the observed segments. Considering the spatial resolution of UVIT FUV filter ( 1.4″, Borgohain et al., 2022), we defined a criterion that the identified regions should cover at least 6 pixels (the minimum number of pixels to cover the a circle with diameter as the spatial resolution of the FUV filter). A skycut of 3 was applied to identify star-forming regions. Details on source identification and background estimation are found in Robotham et al. (2018) and Ujjwal et al. (2022). We identified 241 bright regions in the UVIT FUV image associated with the main galaxy NGC 1512.
2.5 Identification of spiral arms in NGC 1512
We observe the presence of a bright nuclear region and an inner ring in NGC 1512. We try to understand the morphology of the spiral arms in the galaxy. Previous studies on NGC 1512 noted a single spiral arm beginning at the North-East edge of the inner ring and wrapping continuously around NGC 1512 for an azimuthal angle of nearly 540∘ (Thilker et al., 2007; Bresolin et al., 2012).
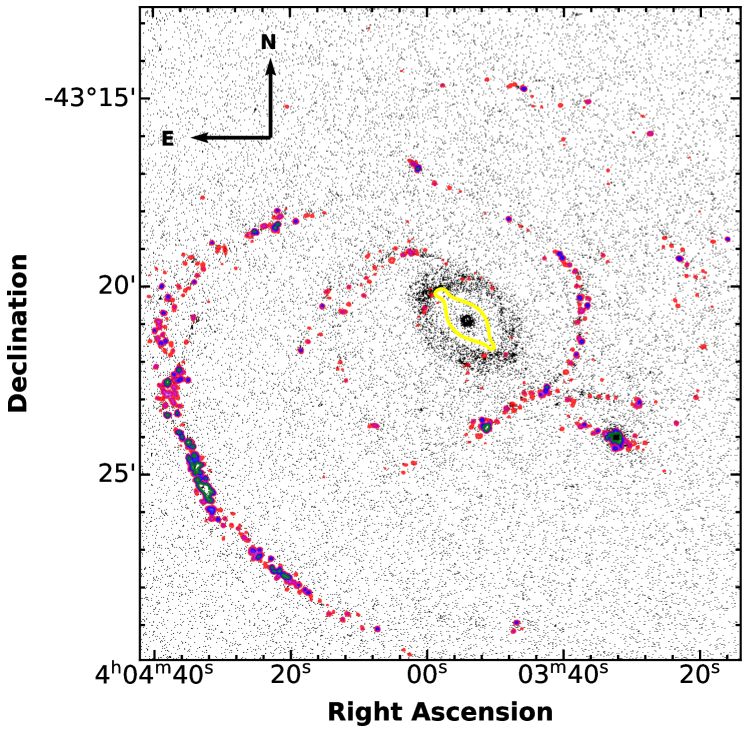
To understand and segregate the identified regions into different arms, we estimated the deprojected distance of the regions along the line of sight by utilising the equations (1-11) provided in Section 2 of van der Marel & Cioni (2001). We observed that the regions arching from the NE of the inner ring of the main galaxy towards the satellite galaxy exhibit a lesser distance along the line of sight compared to the regions in the SW of the inner ring and in the immediate vicinity of the satellite galaxy. The estimated distance difference between the regions originating from NE of the inner ring and those originating from SW of the inner ring was of the order of 20 kpc. The MeerKAT Hi image of the galaxy also showed a similar trend. The regions originating from the NE of the inner ring have a continuous gas distribution and wind around the galaxy, while the regions in the SW of the inner ring and near the satellite galaxy exhibit a distorted Hi distribution that extends outwards, as is visible in Figure 2 (left panel).
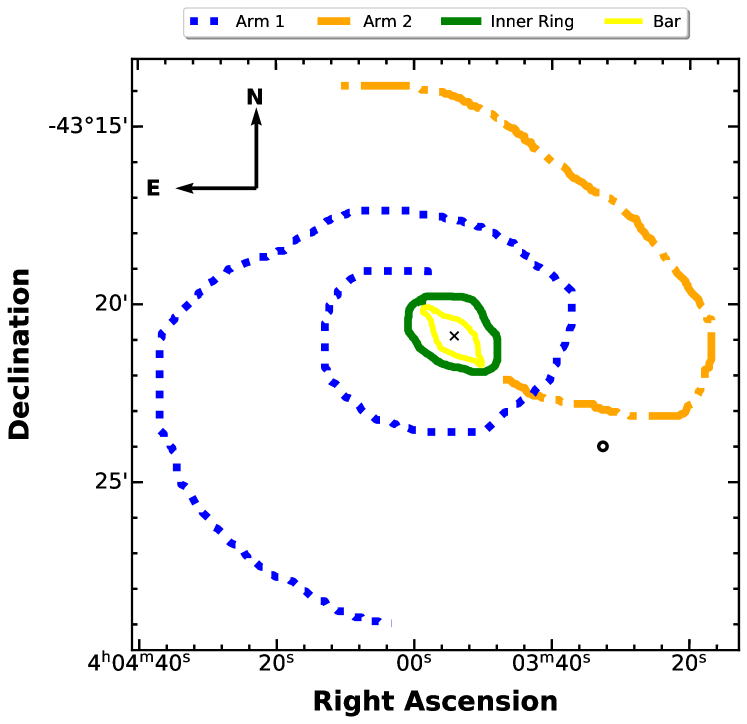
Keeping this distribution in mind, we identify the spiral arms of the galaxy as follows. Arm 1 originates from NE of the inner ring and traces the galaxy for 540∘ azimuthally and Arm 2 originates from the SW region of the inner ring (Figure 2, right panel). Arm 2 undergoes disruption due to the interaction between the galaxy pair. It also shows a tidal bridge-like feature that extends from the main galaxy towards the satellite galaxy, following which it extends outwards. The regions identified as part of Arm 1 have been represented with a dotted line, whereas Arm 2 has been represented with a dash-dotted line. We also detected the galactic bar in NGC 1512 using IRAC 3.6m image (PI: Robert Kennicutt). The identified bar region is shown in yellow colour in the left panel of Figure 2. The half-length of the bar is measured to be (4.4 0.33 kpc) by using the analysis from Peters & Kuzio de Naray (2018). Compared to the previous studies, UVIT allows us to study the star-forming regions individually and, thus, to study the possible effect of interaction in detail.
3 Results and Discussion
3.1 Estimation of SFR
The Profound module provides the number of pixels containing of the flux for all the identified 241 regions. Using this, we calculated the area of each region. The counts for each region were also obtained from the same. The counts in the selected regions were integration time-weighted and converted to magnitude units using the zero point conversion factor, as discussed in Tandon et al. (2020). We corrected for extinction in the obtained magnitudes, in accordance with Section 2.3. We removed star-forming regions with dereddened FUV magnitude, , fainter than 21 mag to exclude regions with photometric errors larger than 0.1 mag (Devaraj et al., 2023). We obtained a final sample of 175 star-forming regions in NGC 1512. Note that with the exception of analysis in Section 3.4, regions of NGC 1510 have not been considered. The corresponding star formation rates are then calculated using equation 4 in Karachentsev & Kaisina (2013) and is as follows.
| (2) |
where SFR is the star formation rate, denotes the total extinction corrected FUV magnitude, and D is the distance to the galaxy in Mpc. The error in counts was estimated using Poisson’s distribution. The errors associated with and SFR were obtained from error propagation (Bevington & Robinson, 1992).
To understand the effects of different galactic properties on determining the star formation rate and the propagation of star formation throughout the galaxy, we have classified the regions according to their position in the galaxy. We made use of the values of distance, the coordinates for the centre of the main galaxy, inclination, and position angle for the galaxy from Table 1 and employed the analysis carried out by van der Marel & Cioni (2001) to estimate galactocentric distance in kpc for each identified region.
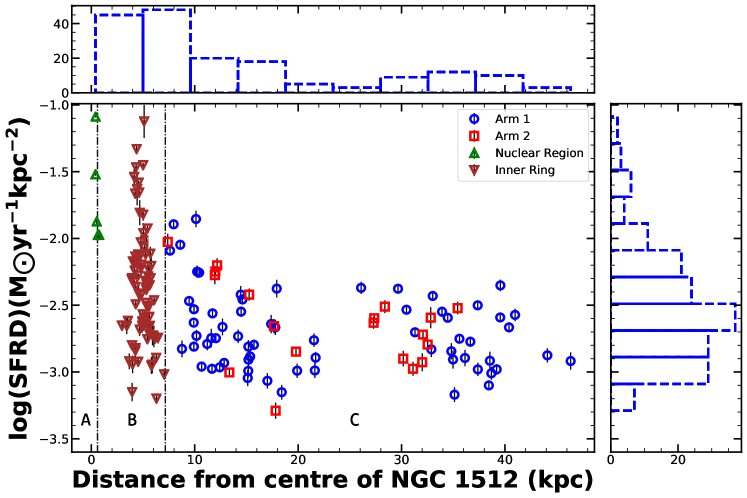
We estimated the star formation rate densities (SFRDs) of identified regions by dividing the estimated SFRs with area of each region (in kpc2). Figure 3 (left panel) is a radial distribution of the logarithmic values of SFRD for the identified regions from the galaxy’s centre. We demarcated different regions of the galaxy as A, B and C on the basis of Figure 2 (right panel) to understand trends in the spatial distribution of SFRD. A denotes the star-forming regions identified in the nuclear region of the galaxy (represented as green triangles), A spans an radial distance of 10 ″( 0.6 kpc) from centre of NGC 1512. B denotes the regions in the inner ring (represented as brown inverted triangles). B excludes the star-forming regions from A and spans an distance from 10″- 115″( 0.6 - 7 kpc). C denotes the regions identified as part of the spiral arms. The blue circles denote regions identified as part of Arm 1, and the red squares denote regions identified as part of Arm 2. We note that the nuclear region of the galaxy (A) exhibits heightened rates of star formation. We also observed higher values of SFRD in the inner ring region (B). This shows enhanced star formation occurring in the nuclear region, the circumnuclear ring and the inner ring of the galaxy. As we move radially outwards, the SFRD decreases along the spiral arm regions (C), which aligns with the expected distribution of star formation in a typical spiral galaxy (Martel et al., 2013). However, some regions, for instance at radial distances of 12 kpc and 30 kpc, show small peaks in the SFRD distribution, as is presented in Figure 3 (left panel). These localized enhancements in star formation present an interesting radial profile, suggesting the presence of additional factors influencing star formation dynamics in specific regions.
3.2 Understanding the effect of interaction on the galaxy
The formation scenario of spiral structures in galaxies has been attributed to different factors that can be secular or environmental in nature. Environmental effects due to interaction, such as tidal effects, may instigate a spiral structure due to the presence of a massive or satellite companion or create distortions in the already existing structures (Toomre & Toomre, 1972; Donner et al., 1991; Struck et al., 2011). Thus, studying the spiral arms of the galaxy will help to understand the role of interactions in shaping the spiral arms of the galaxy. In this context, we study star formation along the spiral arms of NGC 1512. We intend to comprehend and compare the properties of Arm 1 with Arm 2, which were defined in Section 3. This will help us understand the effect of the main galaxy’s interaction with the satellite galaxy. To compare the physical properties of Arm 1 and Arm 2, we performed a two-sample Kolmogorov-Smirnov test (K-S test, Pratt & Gibbons, 1981) on the properties of the star-forming regions to check whether the properties of Arm 1 and Arm 2 are significantly different or not. When the K-S test is performed for the SFRD of the star-forming regions, the p-value is 0.27 for the studied population being of the same distribution. When the test is carried out for assessing the distribution of the identified regions’ area, the p-value is 0.04. Thus, from the K-S test, we note that there may not be significant differences in the overall star formation properties of the identified star-forming regions in the arms. We probe the localized effects of the interaction event on the two spiral arms, if any.
3.2.1 Studying the star formation properties along the spiral arms
The interaction episode of NGC 1512 with NGC 1510 has created disruptions in the spiral arms. The interaction has resulted in disruptions to the regions originating from the SW of the inner ring, which have formed a tidal bridge towards the satellite galaxy. Furthermore, Arm 1 has undergone visible distortions due to interaction, as is visible in Figure 2 (left panel). These observations provide valuable insights into the complex interplay between galaxy interactions and the morphology of spiral galaxies. The distortions observed in the spiral arms of NGC 1512 highlight the effects that interaction events can impose on the intricate structure of a galaxy.
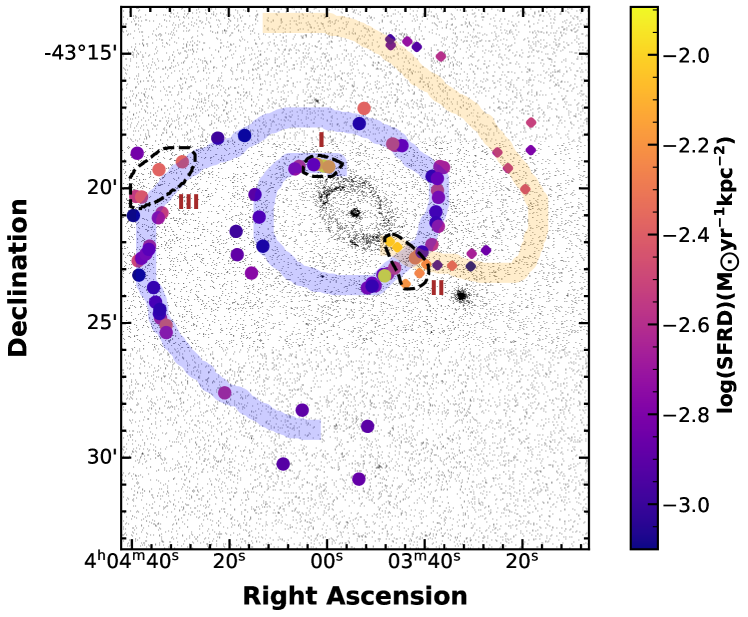
In Figure 3 (right panel), we plot the regions identified in the spiral arms of the galaxy, Arm 1 and Arm 2. The regions are colour-coded based on the intensity of the calculated SFRD. We observe three regions in the arms exhibiting higher SFRD values compared to the other regions in the arms (log(SFRD[M⊙yr-1kpc-2]) ¿ -2.4), which represents the highest percentile in log(SFRD) values. We consider these three regions of interest, labelled as I, II and III in Figure 3 (right panel). These regions have been named in decreasing order of the SFRD values.
We observed heightened SFRD values at the origin of Arm 1, denoted as Region I. The observed enhancement is a possible effect of a combination of orbit crowding, cloud collisions, and gravitational instabilities (Elmegreen, 2009; Urquhart et al., 2021). We estimated a mean log(SFRD[ M⊙yr-1kpc-2]) value of -2.01 0.02 for this region. Numerical simulations by Renaud et al. (2013, 2015) investigated the role of bars in triggering star formation and concluded that the leading edges of the bars favour converging gas flows and large-scale shocks.
Star-forming regions identified in the region of interaction between the main and satellite galaxy (Region II) exhibit higher SFRD values than other regions associated with Arm 2. This observed enhancement exhibits the important role that the interaction with NGC 1510 plays in shaping the main galaxy. Region II has a mean log(SFRD[ M⊙yr-1kpc-2]) value of -2.28 0.03 in comparison to the mean log(SFRD[ M⊙yr-1kpc-2]) value of -2.67 0.04 for star-forming regions in Arm 2, excluding Region II. Thus, the interaction event of NGC 1512 with NGC 1510 has not only disrupted Arm 2 but also might have triggered local bursts of star formation in the vicinity of the interaction. This region is embedded in a high-density region in the Hi column density map (refer to Figure 2 (left panel)), thus showing that the interaction event has created a zone of intense star formation in the region of interaction. We also observed that the Hi has a non-uniform distribution in this region. The observed enhancement in the star formation regions and Hi column density is a possible result of the interaction event between the galaxy pair (Keel, 1991; Struck, 1999).
Di Teodoro & Fraternali (2014) proposed a relation to estimate the gas accretion rate from minor mergers onto star-forming galaxies, which is given as:
| (3) |
where the is the mass accretion rate, denotes the Hi mass of dwarf galaxy and the dynamical time taken for the completion of minor merger event of i dwarf companions with the massive galaxy. For our case, we consider the case of the dwarf galaxy NGC 1510 as a satellite. Since the galaxy pairs are already extremely close to each other ( 14 kpc) and Hi envelopes already interacting, we assume that the minor merger will be completed in about a dynamical time of 1 Gyr. We estimated the Hi mass of NGC 1510 as M⊙ (Barnes et al., 2001). By substituting the values, we estimate the mass accretion rate of Hi gas from the satellite galaxy to be around M⊙yr-1. The estimated accretion rate is one-fifth of the global SFR of NGC 1512 estimated in this study ( 0.11 M⊙yr-1). This suggests that the ongoing accretion event might not be the major contributor to driving the star formation in NGC 1512 (Di Teodoro & Fraternali, 2014). Further analysis might help us understand the other factors influencing star formation in the main galaxy.
Region III belongs to the outer regions of Arm 1. We observe high SFRD values (mean log(SFRD[ M⊙yr-1kpc-2]) value -2.36 0.04) in this region. These regions also exhibit a higher Hi column density compared to other regions identified in the outskirts of Arm 1. These are indicators of ongoing star formation. It is possible that the enhancement in SFRD and higher Hi observed in Region III is a possible effect of previous interaction events or minor mergers that the main galaxy might have undergone over the last few Gyrs. When a galaxy falls into a larger host galaxy, it can bring along gas that fuels star formation in the outskirts of the host galaxy (Malin & Hadley, 1997). In the past, these remnants from merger events became diffused and indistinguishable from the other regions of the galaxy (Martínez-Delgado et al., 2009, 2010). Therefore, we realize that past interactions of NGC 1512 are a possible reason for the observed morphology of spiral arms and local enhancements of star formation on the outskirts of the spiral arms.
Based on the observations of localised enhancements of SFRD and higher Hi column density in NGC 1512, we suggest that past and ongoing interaction events may have instigated local bursts of star formation and contributed to the shaping of the galaxy. The enhanced SFRD and higher Hi column density observed in these regions are potentially a result of interaction episodes: with the satellite galaxy NGC 1510 in Region II and older interaction episodes in the outskirts of Arm 1. Our observations show a positive correlation between the regions exhibiting higher Hi column density and enhancements in SFRD. Therefore, the observed enhancement in star formation and the morphology of the spiral arms in NGC 1512 suggest that interaction events have played a significant role in the evolutionary history of the galaxy. The effects of these interactions may have been long-lasting, with the remnants of past mergers and interactions becoming diffused over time and integrated into the overall structure of the galaxy.
3.3 Star formation in the inner ring
While the interaction with its satellite galaxy has had significant effects on the morphology as well as the star formation properties of NGC 1512, the presence of a strong bar in the galaxy (bar strength of 0.27; Buta et al., 2005, 2006), can influence its evolution.
Schwarz (1981, 1984) discussed the formation of rings in a galaxy as a result of the secular evolution in galaxies due to bar-driven gas flow. The presence of a bar can funnel the cold gas inside the co-rotation radius to the nuclear region, leading to a dearth of cold gas in the co-rotation radius region (Haywood et al., 2016; George et al., 2019, 2020).
Previous studies have been unable to resolve the star-forming regions in the inner ring of NGC 1512. However, owing to the superior resolving power of UVIT, we have been able to resolve individual star-forming regions, allowing us to study the properties of the regions in detail. The inner ring holds the promise of new discoveries as it encircles the bar at 3′ from the galactic centre and has been largely unexplored. Our main goal for this analysis is to study the physical properties of the identified regions in the inner ring and, thus, understand the effect of the galactic bar on the inner ring.
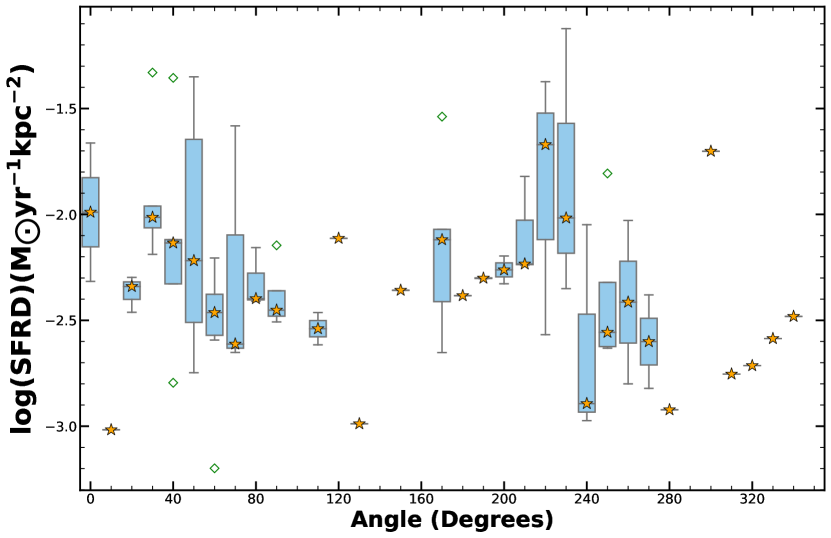
We observed a concentration of star-forming regions in the inner ring region near the major axis of the bar, as is visible in Figure 2 (left panel). We note from Figure 3 (left panel) that the inner ring shows the highest values for SFRD (). The cause for such heightened values of SFRD needs to be understood. We used the deprojected coordinate values for each region such that the major axis of the galaxy coincides with the X-axis. We then estimated the angle subtended by each region with respect to North in the counter-clockwise direction, with 0∘ denoting the positive Y-axis. Figure 4 represents the distribution of SFRD along the angle subtended by the regions with the inner ring of the galaxy. We observe in Figure 4 that the regions lying in the region of the conjunction between the end of the bar and the inner ring, near 45∘ and 225∘ show heightened star formation. There is a clustering of star-forming regions around the major axis of the bar which shows heightened star-formation activity.
The formation of inner ring in galaxies have been explained due to gas being caught at the Ultraharmonic Resonance (UHR) position of the galaxy, preventing it from being funnelled by the bar towards the galactic centre (Schwarz, 1984; Lord & Kenney, 1991; Buta et al., 2004; Byrd et al., 2006). We understand that due to further compression and shocks in the trapped gas, leading to a possible crowding effect, star formation can be enhanced in this region. This is supported by the observed trends in SFRD for the inner ring, with heightened star formation activity around the major axis of the bar.
We studied the star formation activity inside the region of the bar (as identified in the left panel of Figure 2) of the galaxy and found a distinct lack of UV emission in this region. This suggests that there is no ongoing or recent star formation occurring in this region. To further understand the possible reason behind the absence of star formation inside the bar region, we overlaid the Hi column density over the UVIT image in Figure 2 (left panel). Our analysis showed a lack of Hi distribution in this region when compared to the surrounding regions. Such a distribution hints at a possible variation in the distribution of neutral hydrogen gas and a potential deviation from typical gas dynamics in the observed region. This indicates that the Hi gas in the galaxy is being redistributed, and its distribution inside the bar region is affected by the presence of the galactic bar (eg.: George et al., 2019, 2020; Saha et al., 2021). The identified region is also devoid of CO(2-1) gas (Lee et al., 2023). These observations highlight the importance of galactic bars on star formation and Hi gas distribution in galaxies. It is crucial to understand how the presence of galactic bars affects the evolution of galaxies and how it contributes to the overall distribution of Hi gas and star formation in a galaxy.
Based on our analysis, it can be inferred that the galactic bar plays a significant role in driving the secular evolution of NGC 1512. This is in addition to the effects of past and ongoing interaction events that may also be contributing to the observed properties of the galaxy. We find that the galactic bar plays a critical role in redistributing Hi gas in the inner regions of the galaxy and the subsequent quenching of star formation inside the bar radius. The redistribution of the Hi gas in the central regions of the galaxy is likely driven by the non-axisymmetric gravitational potential created by the bar. This is the first study to understand the combined effects of the galactic bar and the interaction with the satellite galaxy on the evolution of NGC 1512.
Our findings demonstrate that the evolution of NGC 1512 is influenced by a combination of secular and environmental factors. The interplay between these effects is crucial in shaping the observed properties and evolution of NGC 1512.
3.4 Star formation in the satellite galaxy, NGC 1510
The satellite galaxy of NGC 1510 is classified as a Blue Compact Dwarf (BCD) galaxy. The satellite galaxy is situated at a distance of ( 18.3 kpc) from the main galaxy. We observed the satellite galaxy to be embedded in a high Hi gas density region (). We identified three star-forming regions in the galaxy with values of ranging from -0.71 to -2.65. We conclude that the satellite galaxy is experiencing enhanced levels of star formation. Hawarden et al. (1979) suggested the observed blue colour of the satellite galaxy was a result of the high Hi column density region it contains. The observed high Hi column density region in which the satellite galaxy is embedded may be due to gas-capture by the satellite galaxy from the main galaxy (Hawarden et al., 1979; Gallagher et al., 2005).
4 Summary
We conducted this study to investigate the impact of interaction events and the galactic bar on the evolution of the interacting galaxy pair NGC 1512/1510. The aim of this study is to provide insight into the driving factors for the observed morphological and star-forming properties of NGC 1512 and to elucidate the mechanisms that govern galactic evolution in the context of interaction and secular processes. A summary of the main results obtained from our study is given below.
-
•
We used the UVIT FUV and NUV observations to identify and characterize the star-forming regions in the galaxy pair.
-
•
We identified 175 star-forming regions in the UVIT FUV image of NGC 1512 using the ProFound package. The calculated magnitudes were extinction corrected.
-
•
We identified regions which exhibited enhanced SFRD. We observed that in addition to the enhancement of star-formation near the origin of Arm 1, enhancement is observed in the region of interaction between the galaxy pair and on the outskirts of Arm 1. These star-forming regions have high Hi density.
-
•
The observed enhancements in SFRD and Hi density in the interaction regions between the galaxy pair and the outskirts of Arm 1 indicate that the evolution of NGC 1512 is intimately linked to its interaction history.
-
•
We observed heightened star formation activity in the inner ring near the ends of the galactic bar. The conspicuous lack of both UV and Hi emissions detected within the bar radius points towards the redistribution of gas in the central regions of the galaxy. This action is seen to force the gas to migrate inwards towards the central regions of the galaxy, causing a depletion of gas supply and can eventually lead to a suppression of star formation activity.
-
•
Our study found enhanced star formation in NGC 1510. This is consistent with the high Hi column density region ( cm-2) within the galaxy.
We conclude that the galaxy NGC 1512 owes its present state to different evolutionary factors, both environmental and secular. To further quantify the effect of each of these factors in galactic evolution, numerical simulations will be crucial. These simulations can help us understand the details of the gas dynamics and star formation history of the galaxy and provide more insight on how each factor has influenced the evolution of NGC 1512.
Acknowledgements
We thank the anonymous referee for the valuable comments and suggestions that have improved the quality of the paper. We acknowledge the financial support from the Indian Space Research Organisation (ISRO) under the AstroSat archival data utilization program (No. DS-2B-13013(2)/6/2019) and the Department of Science and Technology (DST) for the INSPIRE FELLOWSHIP (IF180855). We thank our colleagues Shridharan Baskaran, Akhil Krishna R, Cysil Tom Baby and Belinda Damian for their valuable comments on the manuscript. This publication uses the data from the UVIT, which is part of the AstroSat mission of the ISRO, archived at the Indian Space Science Data Centre (ISSDC). We gratefully thank all the individuals involved in the various teams for supporting the project from the early stages of the design to launch and observations with it in orbit. We thank Joseph Postma, University of Calgary, for his consistent support during the process of UVIT data reduction. We thank the Center for Research, CHRIST (Deemed to be University) for all their support during the course of this work. This research has used the NASA/IPAC Extragalactic Database (NED), funded by the National Aeronautics and Space Administration and operated by the California Institute of Technology.
References
- Astropy Collaboration et al. (2013) Astropy Collaboration, Robitaille, T. P., Tollerud, E. J., et al. 2013, A&A, 558, A33
- Barnes et al. (2001) Barnes, D. G., Staveley-Smith, L., de Blok, W. J. G., et al. 2001, MNRAS, 322, 486
- Bevington & Robinson (1992) Bevington, P. R. & Robinson, D. K. 1992, Data reduction and error analysis for the physical sciences
- Borgohain et al. (2022) Borgohain, A., Saha, K., Elmegreen, B., et al. 2022, Nature, 607, 459
- Bresolin et al. (2012) Bresolin, F., Kennicutt, R. C., & Ryan-Weber, E. 2012, ApJ, 750, 122
- Buta et al. (2006) Buta, R., Laurikainen, E., Salo, H., Block, D. L., & Knapen, J. H. 2006, AJ, 132, 1859
- Buta et al. (2005) Buta, R., Vasylyev, S., Salo, H., & Laurikainen, E. 2005, AJ, 130, 506
- Buta et al. (2004) Buta, R. J., Byrd, G. G., & Freeman, T. 2004, AJ, 127, 1982
- Byrd et al. (2006) Byrd, G. G., Freeman, T., & Buta, R. J. 2006, AJ, 131, 1377
- Cardelli et al. (1989) Cardelli, J. A., Clayton, G. C., & Mathis, J. S. 1989, ApJ, 345, 245
- Chakrabarti et al. (2011) Chakrabarti, S., Bigiel, F., Chang, P., & Blitz, L. 2011, ApJ, 743, 35
- de Vaucouleurs et al. (1991) de Vaucouleurs, G., de Vaucouleurs, A., Corwin, Herold G., J., et al. 1991, Third Reference Catalogue of Bright Galaxies
- Devaraj et al. (2023) Devaraj, A., Joseph, P., Stalin, C. S., Tandon, S. N., & Ghosh, S. K. 2023, ApJ, 946, 65
- Di Teodoro & Fraternali (2014) Di Teodoro, E. M. & Fraternali, F. 2014, A&A, 567, A68
- Donner et al. (1991) Donner, K. J., Engstrom, S., & Sundelius, B. 1991, A&A, 252, 571
- Doyle & Drinkwater (2006) Doyle, M. T. & Drinkwater, M. J. 2006, MNRAS, 372, 977
- Ducci et al. (2014) Ducci, L., Kavanagh, P. J., Sasaki, M., & Koribalski, B. S. 2014, A&A, 566, A115
- Elmegreen (2009) Elmegreen, B. G. 2009, in The Galaxy Disk in Cosmological Context, ed. J. Andersen, Nordströara, B. m, & J. Bland-Hawthorn, Vol. 254, 289–300
- Gaia Collaboration et al. (2022) Gaia Collaboration, Vallenari, A., Brown, A. G. A., et al. 2022, arXiv e-prints, arXiv:2208.00211
- Gallagher et al. (2005) Gallagher, J. S., Grebel, E. K., & Smith, L. J. 2005, in IAU Colloq. 198: Near-fields cosmology with dwarf elliptical galaxies, ed. H. Jerjen & B. Binggeli, 151–155
- George et al. (2019) George, K., Joseph, P., Mondal, C., et al. 2019, A&A, 621, L4
- George et al. (2020) George, K., Joseph, P., Mondal, C., et al. 2020, A&A, 644, A79
- Girish et al. (2017) Girish, V., Tandon, S. N., Sriram, S., Kumar, A., & Postma, J. 2017, Experimental Astronomy, 43, 59
- Hawarden et al. (1979) Hawarden, T. G., van Woerden, H., Mebold, U., Goss, W. M., & Peterson, B. A. 1979, A&A, 76, 230
- Haywood et al. (2016) Haywood, M., Lehnert, M. D., Di Matteo, P., et al. 2016, A&A, 589, A66
- Healy et al. (2021) Healy, J., Deb, T., Verheijen, M. A. W., et al. 2021, A&A, 654, A173
- Jonas (2018) Jonas, J. 2018, in Proceedings of MeerKAT Science: On the Pathway to the SKA — PoS(MeerKAT2016), Vol. 277, 001
- Jonas & MeerKAT Team (2016) Jonas, J. & MeerKAT Team. 2016, in MeerKAT Science: On the Pathway to the SKA, 1
- Józsa et al. (2020) Józsa, G. I. G., White, S. V., Thorat, K., et al. 2020, in Astronomical Society of the Pacific Conference Series, Vol. 527, Astronomical Data Analysis Software and Systems XXIX, ed. R. Pizzo, E. R. Deul, J. D. Mol, J. de Plaa, & H. Verkouter, 635
- Karachentsev & Kaisina (2013) Karachentsev, I. D. & Kaisina, E. I. 2013, AJ, 146, 46
- Karthick et al. (2014) Karthick, M. C., López-Sánchez, Á. R., Sahu, D. K., Sanwal, B. B., & Bisht, S. 2014, MNRAS, 439, 157
- Keel (1991) Keel, W. C. 1991, in Dynamics of Galaxies and Their Molecular Cloud Distributions, ed. F. Combes & F. Casoli, Vol. 146, 243
- Kennicutt (1998) Kennicutt, Robert C., J. 1998, ARA&A, 36, 189
- Kennicutt & Evans (2012) Kennicutt, R. C. & Evans, N. J. 2012, ARA&A, 50, 531
- Kinman (1978) Kinman, T. D. 1978, AJ, 83, 764
- Komatsu et al. (2011) Komatsu, E., Smith, K. M., Dunkley, J., et al. 2011, ApJS, 192, 18
- Koribalski & López-Sánchez (2009) Koribalski, B. S. & López-Sánchez, Á. R. 2009, MNRAS, 400, 1749
- Koribalski et al. (2004) Koribalski, B. S., Staveley-Smith, L., Kilborn, V. A., et al. 2004, AJ, 128, 16
- Kormendy & Kennicutt (2004) Kormendy, J. & Kennicutt, Robert C., J. 2004, ARA&A, 42, 603
- Kumar et al. (2012) Kumar, A., Ghosh, S. K., Hutchings, J., et al. 2012, in Society of Photo-Optical Instrumentation Engineers (SPIE) Conference Series, Vol. 8443, Proc. SPIE, 84431N
- Lee et al. (2023) Lee, J. C., Sandstrom, K. M., Leroy, A. K., et al. 2023, ApJ, 944, L17
- Lelli et al. (2014) Lelli, F., Verheijen, M., & Fraternali, F. 2014, MNRAS, 445, 1694
- Leroy et al. (2008) Leroy, A. K., Walter, F., Brinks, E., et al. 2008, AJ, 136, 2782
- Li et al. (2008) Li, C., Kauffmann, G., Heckman, T. M., White, S. D. M., & Jing, Y. P. 2008, MNRAS, 385, 1915
- Lord & Kenney (1991) Lord, S. D. & Kenney, J. D. P. 1991, ApJ, 381, 130
- López-Sánchez et al. (2015) López-Sánchez, A. R., Westmeier, T., Esteban, C., & Koribalski, B. S. 2015, Monthly Notices of the Royal Astronomical Society, 450, 3381
- Ma et al. (2017) Ma, C., de Grijs, R., & Ho, L. C. 2017, ApJS, 230, 14
- Maeda et al. (2023) Maeda, F., Egusa, F., Ohta, K., Fujimoto, Y., & Habe, A. 2023, ApJ, 943, 7
- Malin & Hadley (1997) Malin, D. & Hadley, B. 1997, PASA, 14, 52
- Maoz et al. (2001) Maoz, D., Barth, A. J., Ho, L. C., Sternberg, A., & Filippenko, A. V. 2001, AJ, 121, 3048
- Martel et al. (2013) Martel, H., Kawata, D., & Ellison, S. L. 2013, MNRAS, 431, 2560
- Martin et al. (2005) Martin, D. C., Fanson, J., Schiminovich, D., et al. 2005, ApJ, 619, L1
- Martínez-Delgado et al. (2010) Martínez-Delgado, D., Gabany, R. J., Crawford, K., et al. 2010, AJ, 140, 962
- Martínez-Delgado et al. (2009) Martínez-Delgado, D., Pohlen, M., Gabany, R. J., et al. 2009, ApJ, 692, 955
- Mathewson & Ford (1996) Mathewson, D. S. & Ford, V. L. 1996, ApJS, 107, 97
- Meurer et al. (2006) Meurer, G. R., Hanish, D. J., Ferguson, H. C., et al. 2006, ApJS, 165, 307
- Offringa et al. (2014) Offringa, A. R., McKinley, B., & Hurley-Walker, N. 2014, MNRAS, 444, 606
- Offringa et al. (2012) Offringa, A. R., van de Gronde, J. J., & Roerdink, J. B. T. M. 2012, A&A, 539
- Parkash et al. (2018) Parkash, V., Brown, M. J. I., Jarrett, T. H., & Bonne, N. J. 2018, ApJ, 864, 40
- Peters & Kuzio de Naray (2018) Peters, W. & Kuzio de Naray, R. 2018, MNRAS, 476, 2938
- Postma & Leahy (2017) Postma, J. E. & Leahy, D. 2017, Publications of the Astronomical Society of the Pacific, 129, 115002
- Pratt & Gibbons (1981) Pratt, J. W. & Gibbons, J. D. 1981, in Concepts of nonparametric theory (Springer), 318–344
- Renaud et al. (2015) Renaud, F., Bournaud, F., Emsellem, E., et al. 2015, MNRAS, 454, 3299
- Renaud et al. (2013) Renaud, F., Bournaud, F., Emsellem, E., et al. 2013, MNRAS, 436, 1836
- Robotham et al. (2018) Robotham, A. S. G., Davies, L. J. M., Driver, S. P., et al. 2018, Monthly Notices of the Royal Astronomical Society, 476, 3137–3159
- Saha et al. (2021) Saha, K., Dhiwar, S., Barway, S., Narayan, C., & Tandon, S. 2021, Journal of Astrophysics and Astronomy, 42, 59
- Schlafly & Finkbeiner (2011) Schlafly, E. F. & Finkbeiner, D. P. 2011, ApJ, 737, 103
- Schwarz (1981) Schwarz, M. P. 1981, ApJ, 247, 77
- Schwarz (1984) Schwarz, M. P. 1984, MNRAS, 209, 93
- Serra et al. (2015) Serra, P., Westmeier, T., Giese, N., et al. 2015, MNRAS, 448, 1922
- Skibba et al. (2009) Skibba, R. A., Bamford, S. P., Nichol, R. C., et al. 2009, MNRAS, 399, 966
- Smirnova et al. (2020) Smirnova, K. I., Wiebe, D. S., Moiseev, A. V., & Jozsa, G. I. G. 2020, Astrophysical Bulletin, 75, 234
- Struck (1999) Struck, C. 1999, Phys. Rep, 321, 1
- Struck et al. (2011) Struck, C., Dobbs, C. L., & Hwang, J.-S. 2011, MNRAS, 414, 2498
- Tandon et al. (2020) Tandon, S. N., Postma, J., Joseph, P., et al. 2020, AJ, 159, 158
- Tandon et al. (2017) Tandon, S. N., Subramaniam, A., Girish, V., et al. 2017, AJ, 154, 128
- Thilker et al. (2007) Thilker, D. A., Bianchi, L., Meurer, G., et al. 2007, ApJS, 173, 538
- Toomre & Toomre (1972) Toomre, A. & Toomre, J. 1972, The Astrophysical Journal, 178, 623
- Toomre & Toomre (1972) Toomre, A. & Toomre, J. 1972, ApJ, 178, 623
- Tully et al. (2016) Tully, R. B., Courtois, H. M., & Sorce, J. G. 2016, AJ, 152, 50
- Ujjwal et al. (2022) Ujjwal, K., Kartha, S. S., Subramanian, S., et al. 2022, MNRAS, 516, 2171
- Urquhart et al. (2021) Urquhart, J. S., Figura, C., Cross, J. R., et al. 2021, MNRAS, 500, 3050
- van der Marel & Cioni (2001) van der Marel, R. P. & Cioni, M.-R. L. 2001, AJ, 122, 1807
- Zhang et al. (2020) Zhang, H.-X., Smith, R., Oh, S.-H., et al. 2020, ApJ, 900, 152
- Zhou et al. (2018) Zhou, Z., Wu, H., Zhou, X., & Ma, J. 2018, PASP, 130, 094101