A large sample of newly-identified carbon-deficient red giants from APOGEE
Abstract
Based on the APOGEE survey we conducted a search for carbon-deficient red giants (CDGs). We found 103 new CDGs, increasing the number in the literature by more than a factor of 3. CDGs are very rare, representing per cent of giants. They appear as an extended tail off the normal carbon distribution. We show that they are found in all components of the Galaxy, contrary to previous findings. The location of CDGs in the Hertzsprung-Russell diagram (HRD) shows that they are primarily intermediate-mass stars (). Their extended distribution may indicate that CDGs can also sometimes have . We attempted to identify the evolutionary phases of the CDGs using stellar model tracks. We found that the bulk of the CDGs are likely in the subgiant branch or red clump phase, whereas other CDGs may be in the red giant branch or early asymptotic giant branch phases. Degeneracy in the HRD makes exact identification difficult. We examined their C, N, and O compositions and confirmed previous studies showing that the envelope material has undergone extensive hydrogen burning through the CN(O) cycle. The new-CDGs have [C+N+O/Fe] that generally sum to zero, indicating that they started with scaled-solar composition. However, the previously known-CDGs generally have [C+N+O/Fe, indicating that some He-burning products were added to their envelopes. As to the site(s) in which this originally occurred, we do not find a convincing solution.
keywords:
surveys – stars: abundances – stars: carbon – stars: chemically peculiar1 Introduction
The weak G-band (wGb) giants are a rare class of chemically peculiar stars. More than a century ago Cannon1912 noticed the unusual spectrum of the red giant star HR 885 in which the G-band, the CH molecular absorption, was not well defined, unlike in spectra of other G- and K-type stars. Bidelman1951 examined the spectrum of HR 885 in detail and found that the G-band was absent. Since the star had other spectral features compatible with its spectral type (G5 III), he suggested that HR 885 “may be a unique case of low carbon abundance". Bidelman1973 searched for more wGb stars among a sample of bright giants and found a total of 34 wGb giants based on how weak the CH G-band was. Subsequent detailed abundance analysis based on high-resolution spectra revealed that wGb stars are extremely carbon-deficient, nitrogen-enriched, and in some cases, overabundant in lithium (see, e.g. Sneden1978; Rao1978; Cottrell1978; Parthasarathy1980; Lambert1984; Parthasarathy1984). Hereafter, we refer to wGb red giant stars as carbon-deficient giants (CDGs).
After a long hiatus of about three decades, a renewed interest was found in decoding the puzzling nature of the peculiar chemical composition of the CDGs. Recent studies analysed the high-resolution spectra of the known-CDGs (; Adamczak2013; Palacios2016) with modern tools incorporating the latest stellar model atmospheres, and atomic and molecular data for accurate stellar parameters, abundances, and isotopic ratios. Results from these studies are in good agreement with each other – the carbon abundances of CDGs are under-abundant by about a factor of 20 when compared to normal giants, the carbon isotopic ratios are close to the equilibrium value of , and the nitrogen abundances are highly enhanced. In some cases, the CDGs are also found to be overabundant in Li and Na. Studies also reached a consensus on their masses: the CDGs are of intermediate-mass ranging from . Currently, there is no consensus on any particular scenario which explains the chemical composition of the CDGs. Some favour in-situ origin, that is, internal nucleosynthesis and non-standard mixing in stars (Adamczak2013), and others favour external origin such as pollution of stellar atmospheres during stars’ main sequence or pre-main sequence evolution by the CN-processed material (Palacios2016).
To date, there are not many wGb giants known, just 44 in the literature, according to the latest compilation (Bidelman1951; Bidelman1973; Bond2019). Increasing the sample size may help identify the evolutionary link with the carbon deficiency, identifying their progenitors or descendants. The work by Bidelman1973 laid a foundation for finding more of these peculiar stars. Bond2019 recently added 5 CDGs based on spectroscopy to the initial list of CDGs. Since then, no new CDGs based on spectroscopy have been identified. Recent studies by Adamczak2013, Palacios2016, and especially Bond2019 highlighted the need for a larger number of CDGs to understand their origin.
With the advent of high-resolution spectroscopic surveys, it is now possible to systematically search for carbon-deficient giants among a large sample of giants. The current study aims to significantly increase the sample of CDGs by taking advantage of these new surveys. We also include an initial analysis of the new CDG sample. Our next paper provides a deeper analysis by including asteroseismic data. This is the largest systematic search for CDGs since the initial spectroscopic survey among bright stars by Bidelman1973.
2 Sample Selection
We used sample stars from data release 17 (DR17; Abdurrouf2022) of the Apache Point Observatory Galactic Evolution Experiment (APOGEE; Majewski2017), which is a large-scale near-IR (H-band), high-resolution () spectroscopic survey. DR17 is the final data release and contains data from the northern and southern hemispheres. The survey uses twin high-resolution spectrographs (Wilson2019) mounted on Apache Point Observatory’s m Sloan Telescope (Gunn2006) and Las Campanas Observatory’s m du Pont telescope (Bowen1973). Data was reduced using automatic reduction pipelines (Nidever2015). The data release contains derived radial velocities, stellar parameters (, log ), and elemental abundances of 20 species from C to Ce for 733,901 stars across the Milky Way (APOGEE Stellar Parameters and Chemical Abundance Pipeline, ASPCAP; Garcia2016).
Intending to increase the probability of detecting carbon-deficient giants, we restricted the sample to stellar parameters encompassing the known-CDGs in the literature. We restricted our sample to disk metallicities ([Fe/H] dex; Tomkin1995) to be consistent with that of the known-CDGs. The known-CDGs are evolved off the main sequence; hence we restricted the sample to surface gravity, log dex. The catalogue had many stars from LMC and SMC, which were removed using the criterion given in Hasselquist2021. Further, we culled all the giants with at least one uncertain parameter flagged in the catalogue as STAR_BAD or STAR_WARN. ‘STAR_BAD’ is set if any of TEFF (effective temperature), LOGG (surface gravity), CHI2 (poor matches to synthetic spectra), COLORTE (photometric temperature), ROTATION (rotation/broad lines), SN (signal-to-noise) is bad or any individual parameter is near grid edge. The STAR_WARN is set if any of TEFF, LOGG, CHI2, COLORTE, ROTATION, SN is uncertain. The carbon abundances in the catalog (C_FE) are determined from CO and CN molecular lines (primarily CO lines; Å, Å, Å, Å, Å; Li2015). We picked giants only bearing C_FE_FLAG = 0 for high-quality carbon-to-iron abundance ratio measurements. The abundances in the APOGEE catalog are flagged111https://www.sdss4.org/dr17/irspec/abundances/ (X_FE_FLAG), with zero being the most reliable (Jonsson2020). With these constraints, we obtained a final sample of 315,789 giants with quality abundances (hereafter, ‘APOGEE giants’).
3 Analysis and Results
3.1 [C/Fe] Distribution & CDG identification
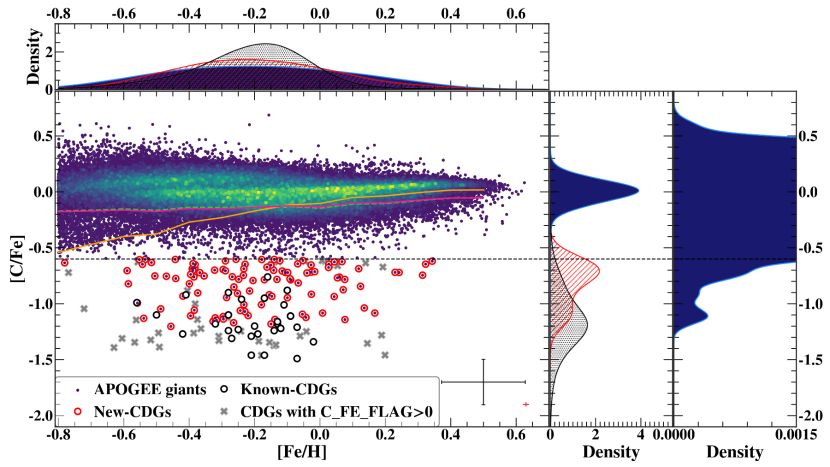
The final sample from APOGEE that made it through the quality criteria discussed in Section 2 is shown in the [C/Fe]-[Fe/H] plane in Fig. 1. We show the kernel density estimation (KDE) distribution of [C/Fe] in the right panel of the figure. The bulk of the giants falls in a main peak at [C/Fe dex with 1 dispersion of dex. The distribution also shows a tail to very low [C/Fe].
To check the theoretically expected range of [C/Fe] in giants, we used stellar models from the MIST database (MESA isochrones and Stellar Tracks; Dotter2016; Choi2016). In Fig. 1, we plot lines representing the carbon abundances at the tip of the red giant branch (RGB) for giants of three different masses, 1, 2, and 3 M, for a range of metallicity values. It can be seen that the intermediate-mass models, with shallow convective envelopes, show only a modest depletion of carbon (due to the first dredge-up) with decreasing [Fe/H] reaching [C/Fe dex. However, in low-mass models (e.g. 1 M), carbon depletion increases with decreasing metallicity, reaching as low as [C/Fe dex at [Fe/H dex. Considering this, we adopt a conservative limit of [C/Fe dex as the defining line for CDGs. That is, all giants with [C/Fe dex are classified as CDGs. We note that the limit is away from the peak of the main [C/Fe] component (Fig. 1). Between the values of [C/Fe dex and dex, there are still several giants, particularly at the metal-rich regime, which are mildly deficient in carbon compared to model predictions. Many of these probably fall under the category of CDGs. But, in this study, we have not considered them as CDGs to avoid possible contamination with normal giants from the main distribution.
With the adopted criteria, we identify 103 new-CDGs222The weak CH band in the spectra of one of our new-CDGs, with APOGEE ID 2M16405512+6435204, was previously noted by Keenan&McNeil1989. We thank the referee for pointing this out. We discuss the Keenan&McNeil1989 study in Section 3.1.. This finding increases the CDG sample to more than a factor of three from the 44 known-CDGs in the literature (Cannon1912; Bidelman1951; Roman1952; Bidelman1957; Greenstein1958; Spinrad1969; Bidelman1973; Bond2019). Of the known-CDGs, only 29 have carbon abundances from high-resolution optical spectra (Adamczak2013; Palacios2016), so our new sample represents an increase by a factor of 4.6 in this sense. The new-CDGs are listed in Table 1.
| Star | R.A. | Dec. | H | V | E(B-V) | [Fe/H] | log | [C/FE] | [N/FE] | [O/FE] | ||
|---|---|---|---|---|---|---|---|---|---|---|---|---|
| (J2000) | (J2000) | (K) | ||||||||||
| HD 40402 | 89.32889 | 6.47 | 8.61 | 0.05 | 2.160.05 | 5005 | 2.80 | |||||
| HD 124721 | 214.10232 | 7.19 | 9.54 | 0.11 | 2.130.04 | 5107 | 2.64 | |||||
| 37 Com | 195.06861 | 2.38 | 4.84 | 0.00 | 2.660.05 | 4610 | 2.50 | |||||
| HR 885 | 44.95745 | 3.19 | 5.47 | 0.00 | 2.150.04 | 5198 | 2.65 | |||||
| HR 1023 | 50.91246 | 4.57 | 6.42 | 0.12 | 2.390.06 | 5310 | 1.60 | |||||
| HR 1299 | 62.69113 | 4.23 | 6.44 | 0.01 | 2.380.04 | 4690 | 2.20 | |||||
| HD 28932 | 68.38199 | 5.57 | 7.95 | 0.08 | 2.300.04 | 4915 | 2.50 | |||||
| HD 31869 | 74.54692 | 7.11 | 9.29 | 0.03 | 2.300.05 | 4800 | 1.80 | |||||
| HD 49960 | 102.41893 | 5.99 | 8.35 | 0.11 | 2.280.06 | 5030 | 2.61 | |||||
| HD 67728 | 122.15687 | 5.15 | 7.54 | 0.01 | 2.820.05 | 4827 | 2.28 | |||||
| … | … | … | … | … | … | … | … | … | … | … | … | … |
| 2M04403830+2554274 | 70.15962 | 9.48 | 16.22 | 1.69 | 1.780.06 | 4992 | 2.41 | |||||
| 2M12261419-6325497 | 186.55916 | 9.81 | 15.52 | 3.45 | 4.660.10 | 4667 | 2.01 | |||||
| 2M20244529+3712196 | 306.18875 | 12.19 | 22.15 | 1.75 | 0.060.33 | 4908 | 2.11 | |||||
| 2M05481354+2926231 | 87.05644 | 10.24 | 13.88 | 0.59 | 2.190.07 | 4720 | 2.12 | |||||
| 2M00344095+5804544 | 8.67067 | 12.01 | 14.34 | 0.37 | 2.000.09 | 5089 | 2.82 | |||||
| 2M12254845-6228451 | 186.4519 | 10.31 | 15.14 | 4.22 | 2.730.06 | 4820 | 2.43 | |||||
| 2M01450782+6445416 | 26.28262 | 9.47 | 14.95 | 0.88 | 2.290.07 | 4392 | 1.63 | |||||
| 2M19055092+3745351 | 286.46221 | 9.02 | 11.28 | 0.10 | 2.170.05 | 5007 | 2.28 | |||||
| 2M04222073+4844377 | 65.58641 | 12.01 | 17.43 | 1.19 | 1.160.16 | 5137 | 2.60 | |||||
| 2M16405512+6435204 | 250.22971 | 2.33 | 4.84 | 0.02 | 2.830.04 | 4591 | 2.02 | |||||
| … | … | … | … | … | … | … | … | … | … | … | … | … |
Notes.
Binary/ Multiple system.
The 2MASS catalog (Cutri2003)
All the stellar designations beginning with ‘2M’ denote the APOGEE ID of the new carbon-deficient giants.
This star has been previously identified as a weak CH star by Keenan&McNeil1989.