Asymmetry of AMOC Hysteresis in a State-of-the-Art Global Climate Model
Abstract
We study hysteresis properties of the Atlantic Meridional Overturning Circulation (AMOC) under a slowly-varying North Atlantic (20∘N – 50∘N) freshwater flux forcing in state-of-the-art Global Climate Model (GCM), the Community Earth System Model. Results are presented of a full hysteresis simulation ( model years) and show that there is a hysteresis width of about Sv. This demonstrates that an AMOC collapse and recovery do not only occur in conceptual and idealised climate models, but also in a state-of-the-art GCM. The AMOC recovery is about a factor six faster than the AMOC collapse and this asymmetry is due to the major effect of the North Atlantic sea-ice distribution on the AMOC recovery. The results have implications for projections of possible future AMOC behaviour and for explaining relatively rapid climate transitions in the geological past.
Geophysical Research Letters
Institute for Marine and Atmospheric research Utrecht, Department of Physics, Utrecht University, Princetonplein 5,3584 CC Utrecht, the Netherlands Centre for Complex Systems Studies, Department of Physics, Utrecht University, Leuvenlaan 4, 3584 CE Utrecht, the Netherlands
René M. van Westenr.m.vanwesten@uu.nl
A wide AMOC hysteresis is found in a state-of-the-art global climate model
The AMOC recovery is about six times faster than the AMOC collapse
The North Atlantic sea-ice cover plays a dominant role in the hysteresis asymmetry
Plain Language Summary
The Atlantic Meridional Overturning Circulation (AMOC) is considered to be a tipping element in the climate system. We here simulate AMOC tipping events by slowly varying the North Atlantic freshwater forcing in a state-of-the-art Global Climate Model. The AMOC collapses when this forcing is sufficiently large and, when reversing this forcing, the recovery occurs at much smaller values of the forcing than the collapse, giving rise to hysteresis behaviour. The AMOC changes are much faster during its recovery than during its collapse and this asymmetry is caused by the effect of the North Atlantic sea-ice distribution on the AMOC recovery. The results demonstrate that AMOC tipping does not only occur in simplified climate models, but in a large hierarchy of climate models.
1 Introduction
The future development of the Atlantic Meridional Overturning Circulation (AMOC) under climate change is a hot topic of research [Ditlevsen \BBA Ditlevsen (\APACyear2023)]. The AMOC, as part of the global ocean circulation is crucial in maintaining the meridional heat transport in Earth’s climate [Srokosz \BBA Bryden (\APACyear2015)]. Models of the Climate Model Intercomparison Project phase 6 (CMIP6) project that the AMOC strength will gradually decrease by the end of this century, with relatively little differences between the various Shared Socioeconomic Pathway scenarios [Weijer \BOthers. (\APACyear2020)]. However, the AMOC has also been recognised as a climate tipping element [Armstrong McKay \BOthers. (\APACyear2022)], with a possible abrupt change in AMOC strength having severe global impacts [Orihuela-Pinto \BOthers. (\APACyear2022)]. Strong fluctuations in AMOC strength have occurred in the geological past, for example during the so-called Dansgaard-Oeschger events, leading to local temperature variations of more than 10∘C on Greenland [Lynch-Stieglitz (\APACyear2016)].
First ideas on AMOC tipping were proposed already in the 1960s [Stommel (\APACyear1961)] using a highly conceptual model of the AMOC in which the ocean circulation was only represented by the flow between two boxes. In this conceptual view, the present-day AMOC state is sensitive to changes to its North Atlantic surface freshwater flux due to the so-called salt-advection feedback. Freshwater anomalies in the North Atlantic will decrease the strength of the AMOC, thereby decreasing the northward salt transport and hence amplifying the original freshwater anomaly [Marotzke (\APACyear2000)]. In conceptual models, AMOC tipping is induced by increasing the freshwater flux forcing and transitions occur between multiple equilibrium AMOC states which exist for the same freshwater forcing conditions [Cessi (\APACyear1994)].
In more detailed climate models, there is evidence of multiple AMOC equilibrium states due to the appearance of hysteresis behaviour. When the freshwater forcing in the North Atlantic is increased very slowly, such that the AMOC remains in near-equilibrium, the AMOC is found [Rahmstorf \BOthers. (\APACyear2005)] to collapse in many Earth system Models of Intermediate Complexity (EMICs). When reversing the freshwater forcing, the AMOC recovery occurs at much smaller freshwater forcing strengths than when it collapsed, giving rise to hysteresis behaviour. Such hysteresis behaviour has been found in relatively coarse climate models, such as the FAMOUS model [Hawkins \BOthers. (\APACyear2011)] and in an early version of the Community Climate System Model [Hu \BOthers. (\APACyear2012)].
However, in state-of-the-art Global Climate Models (GCMs) the computation of such hysteresis behaviour is very costly and so far only transient experiments with large freshwater perturbations have been performed to force AMOC collapses [Weijer \BOthers. (\APACyear2019), Jackson \BOthers. (\APACyear2022)]. Substantially weaker (or collapsed) AMOC states have been found in these transient simulations [Stouffer \BOthers. (\APACyear2006), Mecking \BOthers. (\APACyear2016), Jackson \BBA Wood (\APACyear2018\APACexlab\BCnt2)], but it has been difficult to identify a freshwater forcing regime where hysteresis behaviour occurs [Jackson \BBA Wood (\APACyear2018\APACexlab\BCnt1)]. Hence, one might conclude that AMOC tipping does not occur in state-of-the-art GCMs, because these models include many more (in particular, negative) feedbacks than idealized climate models such as EMICs and FAMOUS [Gent (\APACyear2018)].
Here we show results from a full hysteresis numerical simulation with a state-of-the-art GCM, the Community Earth System Model (CESM), using a configuration that is shortly described in Section 2. The results in Section 3 show a large hysteresis width with a strong asymmetry in the collapse and recovery of the AMOC. The analysis of these results, in particular the asymmetry of the hysteresis, show the important role for sea ice in the AMOC recovery. Implications of the results are discussed in Section 4.
2 Methods
We use the CESM version 1.0.5 (the f19_g16 configuration) with horizontal resolutions of 1∘ for the ocean/sea ice and 2∘ for the atmosphere/land components. The simulation was branched off from the end (model year 2,800) of the pre-industrial CESM control simulation described in \citeABaatsen2020. There it is shown that the upper 1,000 m of the ocean is well equilibrated after 2,800 years of model integration. We first linearly increased the surface freshwater forcing between latitudes 20∘N and 50∘N (inset in Figure 1a) with a rate Sv yr-1 up to model year 2,200, reaching a freshwater flux forcing of Sv. This freshwater flux anomaly is compensated over the rest of the domain to conserve salinity. Starting from the end of that simulation (model year 2,200) we linearly decreased the freshwater flux forcing back to zero with a rate of Sv yr-1. The rate of change is comparable to that in \citeAHu2012, who used Sv yr-1, also over the same area in the North Atlantic.
In the results below, we use the following diagnostics. The AMOC strength is defined as the total meridional volume transport at 26∘N over the upper 1,000 m:
| (1) |
The freshwater transport by the overturning (AMOC) component () and azonal (gyre) component () as a function of the meridional coordinate are determined as:
| (2) | |||||
| (3) |
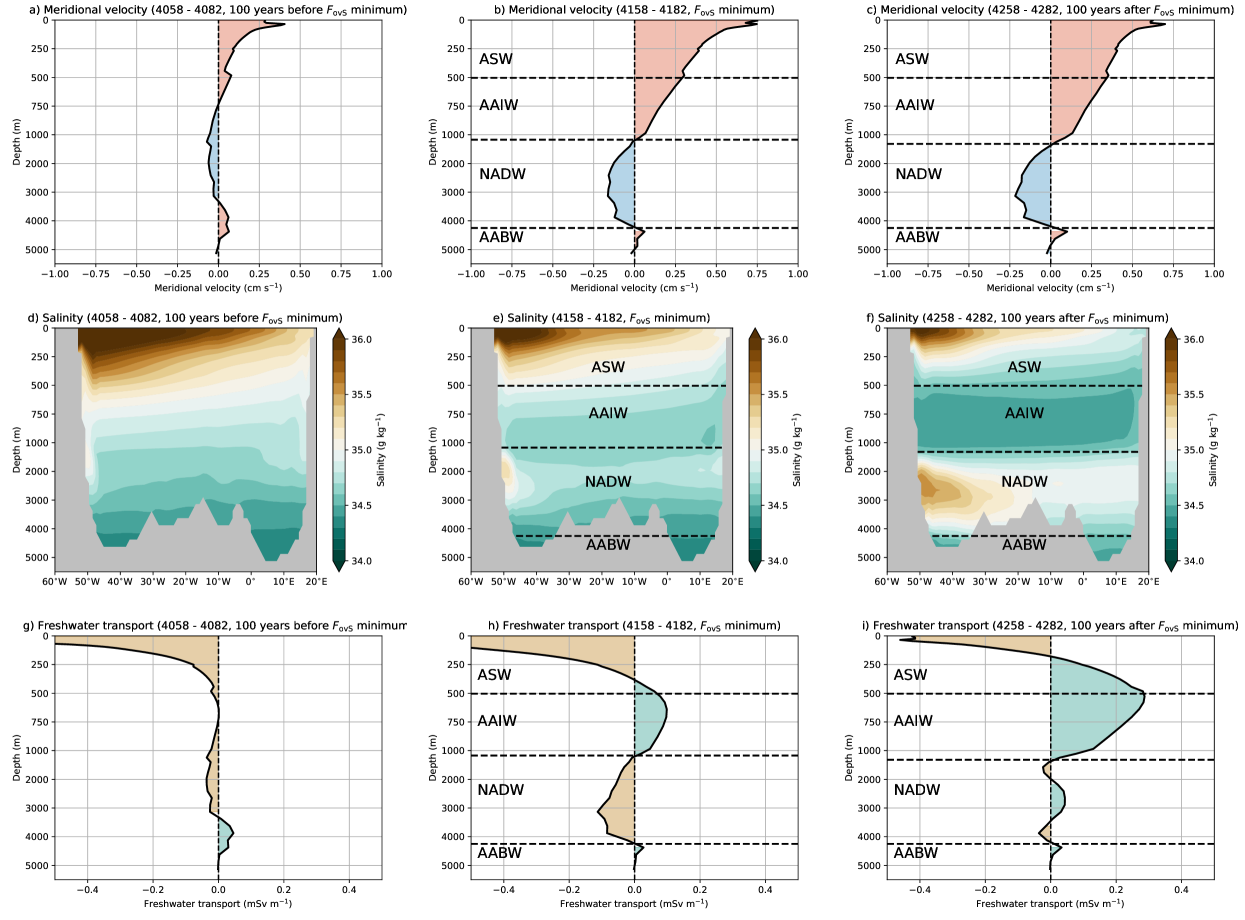
where g kg-1 is a reference salinity. Here, indicates the baroclinic velocity and is defined as , where is the meridional velocity and the barotropic meridional velocity (i.e., the section spatially-averaged meridional velocity). The quantity indicates the zonally-averaged salinity and primed quantities ( and ) are deviations from their respective zonal averages [Jüling \BOthers. (\APACyear2021)]. We will use S) and N, with similar expressions for and , respectively.
3 Results
3.1 AMOC Hysteresis
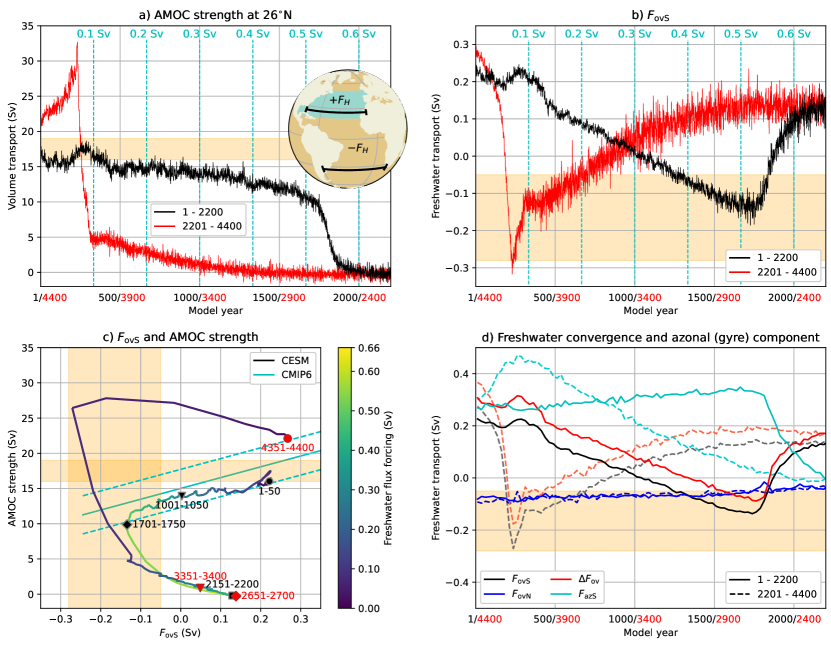
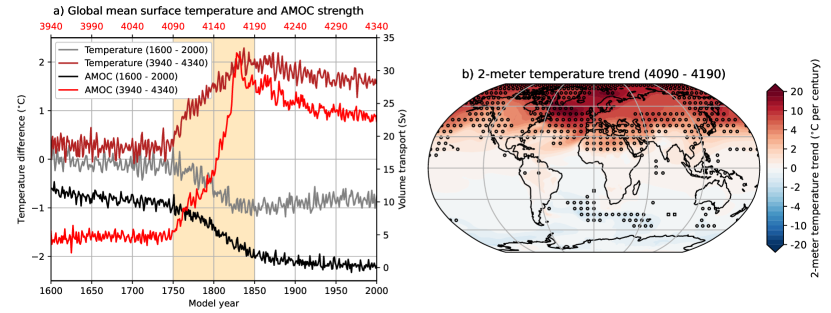
The hysteresis behaviour for the AMOC strength is shown in Figure 1a, where the black curve is the forward simulation (increasing freshwater flux forcing) and the red curve is the reversed simulation. We display time on the horizontal axis as we follow a quasi-equilibrium approach and the magnitude of the freshwater flux over time is indicated by the cyan-coloured dashed lines. The initial AMOC strength is about 17 Sv and the AMOC pattern is shown in Figure 2a. In the forward simulation, the AMOC collapses near model year 1,750 from about 10 Sv (Figure 2b) to about 2 Sv (model year 1850) and it is near zero Sv at model year 2,200. The freshwater transport carried by AMOC at 34∘S, , decreases in the forward experiment, goes through zero at model year 1,000 and after the AMOC collapse it becomes positive (Figure 1b). The details of the AMOC collapse, its climate impact and its early warning signals were presented elsewhere [van Westen \BOthers. (\APACyear2023)].
In the reversed simulation, years 2,200 to 4,400, the AMOC stays near zero Sv to about model year 3,100 (Figure 2c). A weak and shallow ( m) northward overturning cell develops 400 years later (Figure 2d) and the AMOC strength (at 1,000 m and 26∘N) is about 1.5 Sv. This overturning cell strengthens over time (Figure 2e) and there is a clear northward overturning cell present prior to (full) AMOC recovery, the AMOC strength (at 1,000 m and 26∘N) is about 4 Sv. This gradual AMOC increase of about 5 Sv over a 1,000-year period is followed by AMOC recovery between model years 4,090 and 4,170 (Figure 1a) where its strength increases from about 5 Sv to a maximum of 33 Sv and thereafter slowly decreases again. Hence, there is a broad interval in the freshwater flux forcing ( varies from about 0.1 to 0.5 Sv) which determines the hysteresis width (about 0.4 Sv). In the reversed simulation, gradually decreases with decreasing freshwater flux forcing from a positive value at model year 2,200 to about -0.12 Sv prior to AMOC recovery. Then steeply decreases to minimum of -0.32 Sv in model year 4,170 and afterwards strongly increases.
It is interesting to compare the responses in the different freshwater transport components under the varying freshwater flux forcing (Figure 1d) with those expected from the bifurcation analyses from idealised ocean-climate model studies [Dijkstra (\APACyear2007), Huisman \BOthers. (\APACyear2010)]. Based on these idealised model results, one expects that the AMOC has one steady state for , the + superscript indicating its value on the forward simulation. The multiple equilibrium regime would be entered by model year 1,000 (where changes sign) and hence AMOC recovery would be expected near Sv, which is around model year 3,400 in the reversed simulation. Note that some delay in recovery can be expected due to the quasi-equilibrium approach [Hawkins \BOthers. (\APACyear2011)], but the AMOC recovery in the CESM, is 700 years later than expected. Hence, at first sight, this is substantially different from what idealised model studies [Dijkstra (\APACyear2007), Huisman \BOthers. (\APACyear2010)] would suggest.
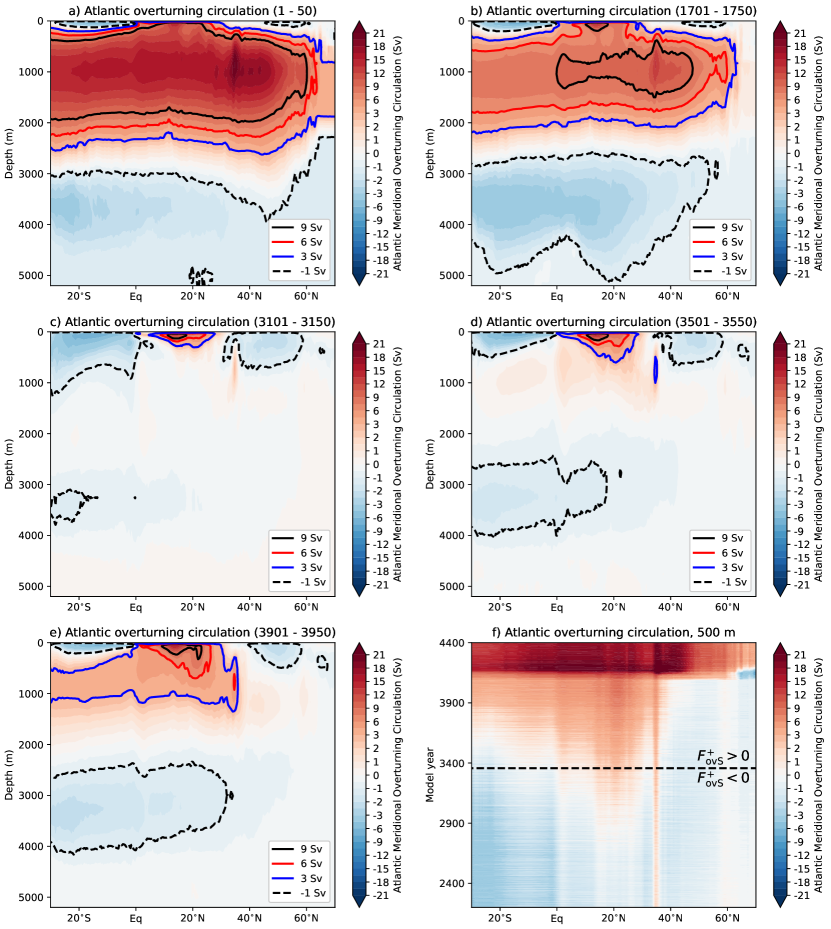
However, the Hovmöller diagram for AMOC at 500 m depth (Figure 2f) shows the development of the northward overturning cell (from 30∘S to 40∘N) from model year 3,500 and onwards; the Hovmöller diagrams between 500 m and 1,000 m depths show similar results (not shown). The timing for the development of the northward overturning cell aligns well with the sign change in . Prior to the full AMOC recovery, the AMOC strength remains fairly low ( Sv) and the overturning cell has a maximum meridional extent to 40∘N (Figure 2f). When the AMOC fully recovers (from model year 4,090), the northward overturning cell extends to higher latitudes (60∘N). This suggest that between the model years and , there are processes in the CESM that prevent a larger meridional extent of the overturning cell and delay a full AMOC recovery; details are discussed in the next subsection.
The minimum at model year 4,170 can be understood from the different adjustment time scales for the salinity and velocity fields at 34∘S (Figure S1). The velocity fields adjust faster to the changing forcing than the salinity fields and velocity changes then control the magnitude of . Prior to AMOC recovery, is negative and hence the AMOC transports salt into the Atlantic basin. Surface velocities increase rapidly, as the AMOC increases during its recovery, and hence more salt is transported into the Atlantic basin, reducing the value of . Eventually, the salinity fields adjust to the recovered ocean circulation state and becomes positive again. The value at the end of the simulation is slightly higher than its initial value, because the 34∘S salinity profiles are still different than the initial profiles. It is expected that AMOC and eventually recover to their initial state (Figure 1c) when extending the simulation beyond model year 4,400 under zero anomalous freshwater flux forcing ( Sv), but we did not perform a simulation to check this.
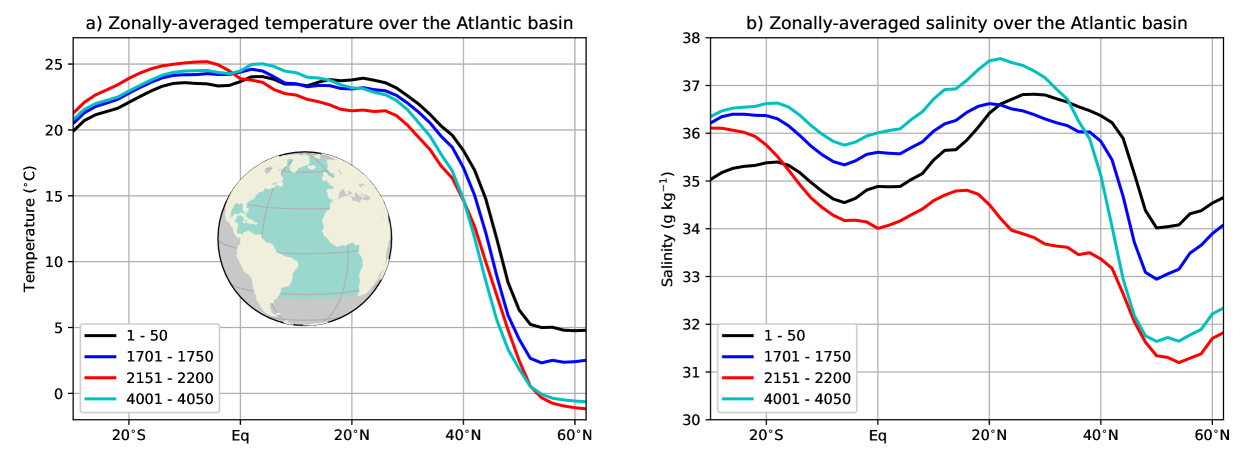
During its recovery, the AMOC strongly overshoots and its maximum (32.7 Sv in model year 4,168) is about twice as strong compared to its initial value. This overshoot is expected because meridional temperature and salinity gradients are (strongly) different when comparing those to the initial state (Figure S2) and favour a (temporarily) stronger AMOC state. The transient response is also larger during AMOC recovery than during AMOC collapse (Figure 3a) and when comparing two 100-year periods (model years 1,750 – 1,850 versus 3,090 – 3,190) the (absolute) linear trends differ by a factor of 3.6 for AMOC strength. Over this 100-year period, however, the AMOC strength shows a non-linear change (in particular for the AMOC recovery) and when determining the trends over a 20-year sliding window we find maximum (absolute) changes of 0.12 Sv yr-1 (AMOC collapse) and 0.76 Sv yr-1, which is about a factor 6 difference.
The patterns in 2-meter atmospheric surface temperature trends are very similar between collapse and recovery (Figure 3b) but of course differ by the sign of the trend. The magnitudes of the trends are, however, larger during AMOC recovery (in particular for the Northern Hemisphere) and the globally-averaged trend is a factor 1.5 larger during AMOC recovery than during collapse. Note that, during AMOC collapse and recovery, the changes in freshwater forcing are very small ( Sv), meaning that the transient responses are mainly driven by internal feedbacks.
3.2 AMOC Recovery: Role of sea ice
To explain the delay in AMOC recovery, we consider the sea-ice distribution in the North Atlantic, which has undergone a vast expansion after the AMOC collapse [van Westen \BOthers. (\APACyear2023)]. From a recent CMIP6 model study it was shown that sea ice suppresses air-sea fluxes and a relatively large sea-ice cover results in a general weaker upper ocean mixing and AMOC strength [Lin \BOthers. (\APACyear2023)]. In the CESM simulation here, this effect of sea ice on air-sea fluxes and upper ocean mixing also occurs over the Irminger basin (region of deep convection) during and after the AMOC collapse (Figure 4c). The sea-ice cover in the CESM is actually quite large compared to many CMIP6 models [Lin \BOthers. (\APACyear2023)] and explains the weak AMOC state ( Sv). The sea-ice edge of the collapsed state extends down to 45∘N in the Atlantic Ocean (blue curve in Figure 4a) and this restricts the meridional extent of the northward overturning cell to 40∘N (Figure 2d).
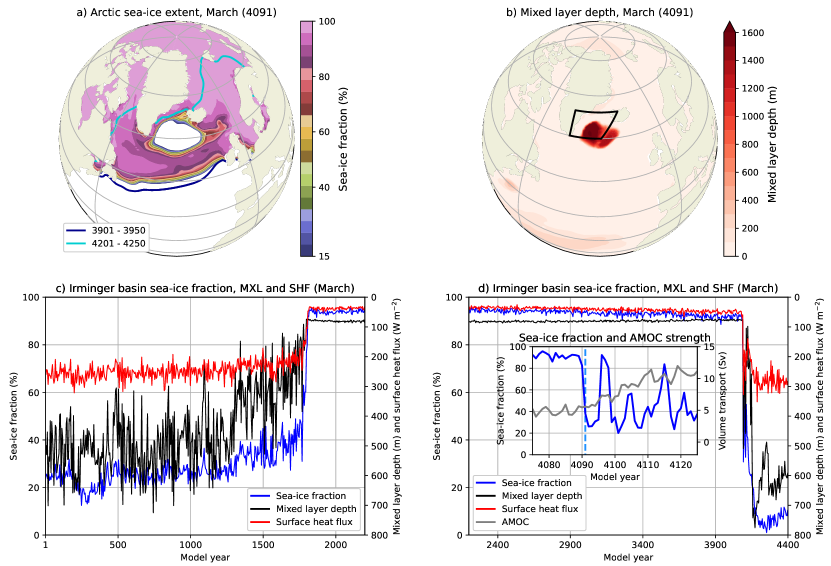
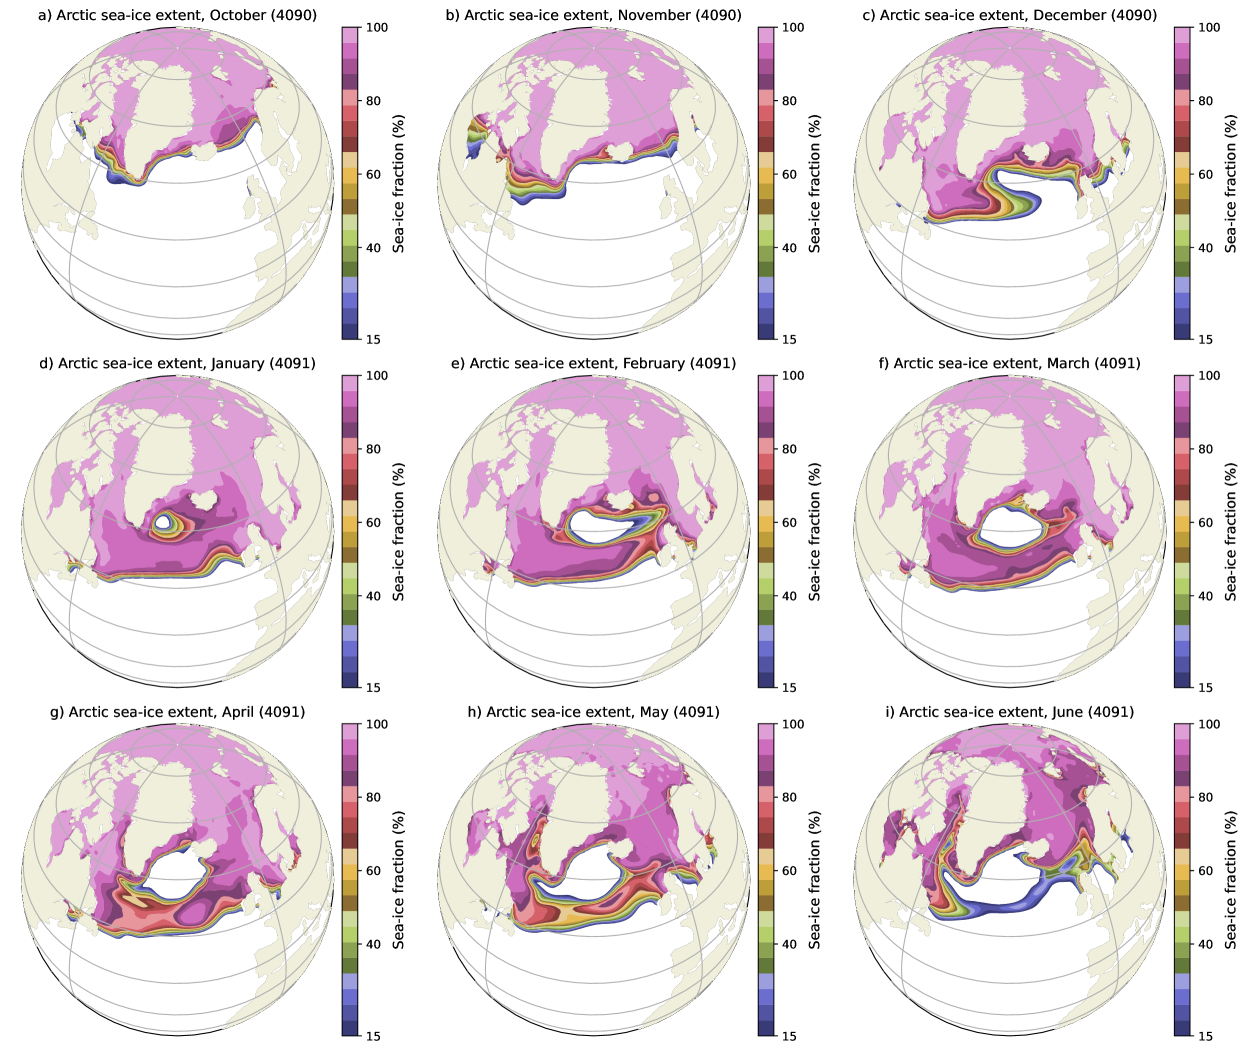
During the gradual spin-up of the northward overturning cell from model year 3,500 and onwards, more heat is transported northward leading to less favourable sea-ice formation conditions over time. During the winter of model years 4,090/4,091, a few years before the full AMOC recovery, the seasonally-varying Arctic sea ice advances southward (Figure S3). The enhanced meridional heat transport prevents the Irminger basin from (fully) freezing over and a small polynya, i.e., a sea-ice free region (with sea-ice fractions lower than 15%) within the sea-ice pack, forms. The sea-ice free ocean surface is strongly cooled by the atmosphere resulting in buoyancy loss and deep convection. Deep convection mixes relatively warm water from greater depth to the surface and this prevents the polynya from freezing over. The polynya starts to grow in the following months and in March model year 4,091 the polynya has a surface area of km2 (Figure 4a) and the mixed layer depth extends down to 1,600 m (Figure 4b).
The next winter (model years 4,091/4,092) the ocean surface near the Irminger basin remains relatively warm (from the deep convection of the polynya). This prevents again a complete sea-ice coverage over the Irminger basin (inset in Figure 4d) and the sea-ice free region induces again deep convection. These deep convection events during the winter months start to spin-up the AMOC and, from model year 4,094, the AMOC strength strongly increases (inset in Figure 4d). The stronger AMOC results in more meridional heat transport leading to less sea-ice cover and more deep convection (Figure 4d) which further increases the AMOC strength. Eventually the sea-ice cover retreats further northward (cyan curve in Figure 4a) and hardly influences deep convection anymore over the Irminger basin (and Labrador basin).
In summary, the strong effect of North Atlantic sea-ice on the AMOC is responsible for the delay in the AMOC recovery. The AMOC restarts around model year 3,400 when switches sign (Figure 2f), but remains weak due to the extensive sea-ice cover. Only when passing a critical value of the AMOC strength, which depends on the sea-ice distribution, the recovery is completed. The Irminger basin polynya during the winter of model years 4,090/4,091 marks the point in time when AMOC recovery is inevitable. This explains why such sea-ice induced AMOC recovery delay is not found in models where there is no sea-ice component [Rahmstorf (\APACyear1996), Dijkstra (\APACyear2007), Huisman \BOthers. (\APACyear2010)]. It also implies that in CMIP6 models, which have a strong sea-ice model dependency [Lin \BOthers. (\APACyear2023)], it is expected that the timing of AMOC recovery is quite model dependent.
4 Discussion
The Atlantic Meridional Overturning Circulation (AMOC) is considered to be a tipping element in the climate system [Armstrong McKay \BOthers. (\APACyear2022)]. We have shown here a first full AMOC hysteresis simulation in the Community Earth System Model, a state-of-the-art Global Climate Model. This result indicates that AMOC tipping does not only occur in conceptual [Stommel (\APACyear1961)] and idealised climate models [Rahmstorf \BOthers. (\APACyear2005)], but actually in the full hierarchy of climate models. The shape of the hysteresis is also relatively smooth and without sharp strong local transitions as occur in ocean-only models [Rahmstorf (\APACyear1996), Lohmann \BOthers. (\APACyear2023)].
The hysteresis width, measured as the difference in freshwater forcing between collapse and recovery, found in the CESM (about 0.4 Sv) is quite large compared to that found in many EMICs [Rahmstorf \BOthers. (\APACyear2005)], also much larger than that in CCSM [Hu \BOthers. (\APACyear2012)], but similar to that in FAMOUS [Hawkins \BOthers. (\APACyear2011)]. We have shown here that the Northern Hemisphere sea-ice distribution has a substantial effect on the recovery of the AMOC. The fact that sea ice inhibits air-sea fluxes, and hence convection, appears important [Lin \BOthers. (\APACyear2023)] for the recovery of the AMOC in the CESM and hence for the hysteresis width. The sea ice is the main reason for the strong asymmetry in the hysteresis, where the recovery is a factor six faster than the collapse. This strong asymmetry is likely relevant for explaining proxy records of the Dansgaard-Oeschger events [Rahmstorf (\APACyear2002), Henry \BOthers. (\APACyear2016), Lynch-Stieglitz (\APACyear2016)]. These events clearly show that warming is much faster than the cooling, consistent with that AMOC recovery occurs on (much) shorter time scales than its collapse.
What is intriguing is that the AMOC collapse [van Westen \BOthers. (\APACyear2023)] and recovery can be connected to theory about the role of the AMOC induced freshwater transport at the southern boundary of the Atlantic, , on AMOC stability. In idealised global ocean models, the recovery tipping point is connected to a sign change in on the northward overturning AMOC state. At this point, a change from the AMOC exporting salt to exporting freshwater occurs [Dijkstra (\APACyear2007)]. In the CESM simulation here, the AMOC indeed restarts when there is this sign change in , but the AMOC strength remains low due to the effect of the sea ice. These results indicate that the AMOC hysteresis can be captured in a low-dimensional dynamical context giving more weight to the results of conceptual and idealized AMOC models.
The CESM version used here has substantial biases in freshwater forcing in its pre-industrial reference state [van Westen \BOthers. (\APACyear2023)], which is the reason that the initial value of is positive. It has been shown using the global ocean model as used in \citeADijkstra2007 that this shifts the AMOC tipping points associated with collapse and recovery to higher values of the freshwater forcing [Dijkstra \BBA van Westen (\APACyear2023)]. Assuming that the CESM will show a similar qualitative behaviour, this implies that collapse and recovery, when biases are corrected, will likely occur for much smaller values of the freshwater forcing than used in the simulation here. Combined with the change from pre-industrial to present-day forcing, and including climate change, it remains to be investigated whether the AMOC can tip before the year 2100 [Ditlevsen \BBA Ditlevsen (\APACyear2023)] and assess the probability of such a transition. The results here have demonstrated that this is an important line of research as such tipping behaviour occurs in models which are considered to adequately represent the development of Earth’s large-scale climate.
Open Research Section
All model output and code to generate the results are available [van Westen \BBA Dijkstra (\APACyear2023\APACexlab\BCnt1)] from https://doi.org/10.5281/zenodo.8262424.
Acknowledgements.
We thank Michael Kliphuis (IMAU, UU) for performing the CESM simulation. The model simulation and the analysis of all the model output was conducted on the Dutch National Supercomputer (Snellius) within NWO-SURF project 17239. R.M.v.W. and H.A.D. are funded by the European Research Council through the ERC-AdG project TAOC (project 101055096).References
- Armstrong McKay \BOthers. (\APACyear2022) \APACinsertmetastarArmstrong2022{APACrefauthors}Armstrong McKay, D\BPBII., Staal, A., Abrams, J\BPBIF., Winkelmann, R., Sakschewski, B., Loriani, S.\BDBLLenton, T\BPBIM. \APACrefYearMonthDay2022. \BBOQ\APACrefatitleExceeding 1.5 C global warming could trigger multiple climate tipping points Exceeding 1.5 C global warming could trigger multiple climate tipping points.\BBCQ \APACjournalVolNumPagesScience3776611eabn7950. \PrintBackRefs\CurrentBib
- Baatsen \BOthers. (\APACyear2020) \APACinsertmetastarBaatsen2020{APACrefauthors}Baatsen, M., Von Der Heydt, A\BPBIS., Huber, M., Kliphuis, M\BPBIA., Bijl, P\BPBIK., Sluijs, A.\BCBL \BBA Dijkstra, H\BPBIA. \APACrefYearMonthDay2020. \BBOQ\APACrefatitleThe middle to late Eocene greenhouse climate modelled using the CESM 1.0.5 The middle to late Eocene greenhouse climate modelled using the CESM 1.0.5.\BBCQ \APACjournalVolNumPagesClimate of the Past1662573–2597. \PrintBackRefs\CurrentBib
- Cessi (\APACyear1994) \APACinsertmetastarCessi1994{APACrefauthors}Cessi, P. \APACrefYearMonthDay1994. \BBOQ\APACrefatitleA simple box model of stochastically forced thermohaline flow A simple box model of stochastically forced thermohaline flow.\BBCQ \APACjournalVolNumPagesJournal of Physical Oceanography241911–1920. \PrintBackRefs\CurrentBib
- Dijkstra (\APACyear2007) \APACinsertmetastarDijkstra2007{APACrefauthors}Dijkstra, H\BPBIA. \APACrefYearMonthDay2007. \BBOQ\APACrefatitleCharacterization of the multiple equilibria regime in a global ocean model Characterization of the multiple equilibria regime in a global ocean model.\BBCQ \APACjournalVolNumPagesTellus A: Dynamic Meteorology and Oceanography595695–705. \PrintBackRefs\CurrentBib
- Dijkstra \BBA van Westen (\APACyear2023) \APACinsertmetastarDijkstra2023{APACrefauthors}Dijkstra, H\BPBIA.\BCBT \BBA van Westen, R\BPBIM. \APACrefYearMonthDay2023. \BBOQ\APACrefatitleThe effect of model freshwater flux biases on the multi-stable regime of the AMOC The effect of model freshwater flux biases on the multi-stable regime of the AMOC.\BBCQ \APACjournalVolNumPages1–22. {APACrefDOI} https://doi.org/10.48550/arXiv.2308.11751 \PrintBackRefs\CurrentBib
- Ditlevsen \BBA Ditlevsen (\APACyear2023) \APACinsertmetastarDitlevsen2023{APACrefauthors}Ditlevsen, P.\BCBT \BBA Ditlevsen, S. \APACrefYearMonthDay2023. \BBOQ\APACrefatitleWarning of a forthcoming collapse of the Atlantic meridional overturning circulation Warning of a forthcoming collapse of the Atlantic meridional overturning circulation.\BBCQ \APACjournalVolNumPagesNature Communications1414254. \PrintBackRefs\CurrentBib
- Garzoli \BOthers. (\APACyear2013) \APACinsertmetastarGarzoli2013{APACrefauthors}Garzoli, S\BPBIL., Baringer, M\BPBIO., Dong, S., Perez, R\BPBIC.\BCBL \BBA Yao, Q. \APACrefYearMonthDay2013. \BBOQ\APACrefatitleSouth Atlantic meridional fluxes South Atlantic meridional fluxes.\BBCQ \APACjournalVolNumPagesDeep Sea Research Part I: Oceanographic Research Papers7121–32. \PrintBackRefs\CurrentBib
- Gent (\APACyear2018) \APACinsertmetastarGent2018{APACrefauthors}Gent, P\BPBIR. \APACrefYearMonthDay2018. \BBOQ\APACrefatitleA commentary on the Atlantic meridional overturning circulation stability in climate models A commentary on the Atlantic meridional overturning circulation stability in climate models.\BBCQ \APACjournalVolNumPagesOcean Modelling12257–66. \PrintBackRefs\CurrentBib
- Hawkins \BOthers. (\APACyear2011) \APACinsertmetastarHawkins2011{APACrefauthors}Hawkins, E., Smith, R\BPBIS., Allison, L\BPBIC., Gregory, J\BPBIM., Woollings, T\BPBIJ., Pohlmann, H.\BCBL \BBA De Cuevas, B. \APACrefYearMonthDay2011\APACmonth05. \BBOQ\APACrefatitleBistability of the Atlantic overturning circulation in a global climate model and links to ocean freshwater transport Bistability of the Atlantic overturning circulation in a global climate model and links to ocean freshwater transport.\BBCQ \APACjournalVolNumPagesGeophysical Research Letters3810L10605. \PrintBackRefs\CurrentBib
- Henry \BOthers. (\APACyear2016) \APACinsertmetastarHenry2016{APACrefauthors}Henry, L\BPBIG., McManus, J\BPBIF., Curry, W\BPBIB., Roberts, N\BPBIL., Piotrowski, A\BPBIM.\BCBL \BBA Keigwin, L\BPBID. \APACrefYearMonthDay2016. \BBOQ\APACrefatitleNorth Atlantic ocean circulation and abrupt climate change during the last glaciation North Atlantic ocean circulation and abrupt climate change during the last glaciation.\BBCQ \APACjournalVolNumPagesScience3536298470–474. {APACrefDOI} 10.1126/science.aaf5529 \PrintBackRefs\CurrentBib
- Hu \BOthers. (\APACyear2012) \APACinsertmetastarHu2012{APACrefauthors}Hu, A., Meehl, G\BPBIA., Han, W., Timmermann, A., Otto-Bliesner, B., Liu, Z.\BDBLWu, B. \APACrefYearMonthDay2012. \BBOQ\APACrefatitleRole of the Bering Strait on the hysteresis of the ocean conveyor belt circulation and glacial climate stability Role of the Bering Strait on the hysteresis of the ocean conveyor belt circulation and glacial climate stability.\BBCQ \APACjournalVolNumPagesProceedings of the National Academy of Sciences109176417–6422. {APACrefDOI} 10.1073/pnas.1116014109 \PrintBackRefs\CurrentBib
- Huisman \BOthers. (\APACyear2010) \APACinsertmetastarHuisman2010{APACrefauthors}Huisman, S\BPBIE., Den Toom, M., Dijkstra, H\BPBIA.\BCBL \BBA Drijfhout, S. \APACrefYearMonthDay2010. \BBOQ\APACrefatitleAn indicator of the multiple equilibria regime of the Atlantic meridional overturning circulation An indicator of the multiple equilibria regime of the atlantic meridional overturning circulation.\BBCQ \APACjournalVolNumPagesJournal of Physical Oceanography403551–567. \PrintBackRefs\CurrentBib
- Jackson \BOthers. (\APACyear2022) \APACinsertmetastarJackson2022{APACrefauthors}Jackson, L\BPBIC., Biastoch, A., Buckley, M\BPBIW., Desbruyères, D\BPBIG., Frajka-Williams, E., Moat, B.\BCBL \BBA Robson, J. \APACrefYearMonthDay2022. \BBOQ\APACrefatitleThe evolution of the North Atlantic meridional overturning circulation since 1980 The evolution of the North Atlantic meridional overturning circulation since 1980.\BBCQ \APACjournalVolNumPagesNature Reviews Earth & Environment34241–254. \PrintBackRefs\CurrentBib
- Jackson \BBA Wood (\APACyear2018\APACexlab\BCnt1) \APACinsertmetastarJackson2018b{APACrefauthors}Jackson, L\BPBIC.\BCBT \BBA Wood, R\BPBIA. \APACrefYearMonthDay2018\BCnt1. \BBOQ\APACrefatitleHysteresis and resilience of the AMOC in an eddy-permitting GCM Hysteresis and resilience of the AMOC in an eddy-permitting GCM.\BBCQ \APACjournalVolNumPagesGeophysical Research Letters45168547–8556. \PrintBackRefs\CurrentBib
- Jackson \BBA Wood (\APACyear2018\APACexlab\BCnt2) \APACinsertmetastarJackson2018a{APACrefauthors}Jackson, L\BPBIC.\BCBT \BBA Wood, R\BPBIA. \APACrefYearMonthDay2018\BCnt2. \BBOQ\APACrefatitleTimescales of AMOC decline in response to fresh water forcing Timescales of AMOC decline in response to fresh water forcing.\BBCQ \APACjournalVolNumPagesClimate Dynamics5141333–1350. \PrintBackRefs\CurrentBib
- Jüling \BOthers. (\APACyear2021) \APACinsertmetastarJuling2021{APACrefauthors}Jüling, A., Zhang, X., Castellana, D., Von Der Heydt, A\BPBIS.\BCBL \BBA Dijkstra, H\BPBIA. \APACrefYearMonthDay2021. \BBOQ\APACrefatitleThe Atlantic’s freshwater budget under climate change in the Community Earth System Model with strongly eddying oceans The Atlantic’s freshwater budget under climate change in the Community Earth System Model with strongly eddying oceans.\BBCQ \APACjournalVolNumPagesOcean Science173729–754. \PrintBackRefs\CurrentBib
- Lin \BOthers. (\APACyear2023) \APACinsertmetastarLin2023{APACrefauthors}Lin, Y\BHBIJ., Rose, B\BPBIE.\BCBL \BBA Hwang, Y\BHBIT. \APACrefYearMonthDay2023. \BBOQ\APACrefatitleMean state AMOC affects AMOC weakening through subsurface warming in the Labrador Sea Mean state AMOC affects AMOC weakening through subsurface warming in the Labrador Sea.\BBCQ \APACjournalVolNumPagesJournal of Climate36123895–3915. \PrintBackRefs\CurrentBib
- Lohmann \BOthers. (\APACyear2023) \APACinsertmetastarLohmann2023{APACrefauthors}Lohmann, J., Dijkstra, H\BPBIA., Jochum, M., Lucarini, V.\BCBL \BBA Ditlevsen, P\BPBID. \APACrefYearMonthDay2023. \BBOQ\APACrefatitleMultistability and Intermediate tipping of the Atlantic Ocean Circulation Multistability and Intermediate tipping of the Atlantic Ocean Circulation.\BBCQ \APACjournalVolNumPages1–26. {APACrefDOI} https://doi.org/10.48550/arXiv.2304.05664 \PrintBackRefs\CurrentBib
- Lynch-Stieglitz (\APACyear2016) \APACinsertmetastarLynch-Stieglitz2017{APACrefauthors}Lynch-Stieglitz, J. \APACrefYearMonthDay2016. \BBOQ\APACrefatitleThe Atlantic Meridional Overturning Circulation and Abrupt Climate Change The Atlantic Meridional Overturning Circulation and Abrupt Climate Change.\BBCQ \APACjournalVolNumPagesAnnual Review of Marine Science9183–104. {APACrefDOI} 10.1146/annurev-marine-010816-060415 \PrintBackRefs\CurrentBib
- Marotzke (\APACyear2000) \APACinsertmetastarMarotzke2000{APACrefauthors}Marotzke, J. \APACrefYearMonthDay2000. \BBOQ\APACrefatitleAbrupt climate change and thermohaline circulation: Mechanisms and Predictability Abrupt climate change and thermohaline circulation: Mechanisms and Predictability.\BBCQ \APACjournalVolNumPagesProc. Natl. Acad. Sci.971347–1350. \PrintBackRefs\CurrentBib
- Mecking \BOthers. (\APACyear2017) \APACinsertmetastarMecking2017{APACrefauthors}Mecking, J., Drijfhout, S., Jackson, L.\BCBL \BBA Andrews, M. \APACrefYearMonthDay2017. \BBOQ\APACrefatitleThe effect of model bias on Atlantic freshwater transport and implications for AMOC bi-stability The effect of model bias on Atlantic freshwater transport and implications for AMOC bi-stability.\BBCQ \APACjournalVolNumPagesTellus A: Dynamic Meteorology and Oceanography6911299910. \PrintBackRefs\CurrentBib
- Mecking \BOthers. (\APACyear2016) \APACinsertmetastarMecking2016{APACrefauthors}Mecking, J., Drijfhout, S\BPBIS., Jackson, L\BPBIC.\BCBL \BBA Graham, T. \APACrefYearMonthDay2016. \BBOQ\APACrefatitleStable AMOC off state in an eddy-permitting coupled climate model Stable amoc off state in an eddy-permitting coupled climate model.\BBCQ \APACjournalVolNumPagesClimate Dynamics472455–2470. \PrintBackRefs\CurrentBib
- Orihuela-Pinto \BOthers. (\APACyear2022) \APACinsertmetastarOrihuela2022{APACrefauthors}Orihuela-Pinto, B., England, M\BPBIH.\BCBL \BBA Taschetto, A\BPBIS. \APACrefYearMonthDay2022. \BBOQ\APACrefatitleInterbasin and interhemispheric impacts of a collapsed Atlantic Overturning Circulation Interbasin and interhemispheric impacts of a collapsed atlantic overturning circulation.\BBCQ \APACjournalVolNumPagesNature Climate Change126558–565. \PrintBackRefs\CurrentBib
- Rahmstorf (\APACyear1996) \APACinsertmetastarRahmstorf1996{APACrefauthors}Rahmstorf, S. \APACrefYearMonthDay1996. \BBOQ\APACrefatitleOn the freshwater forcing and transport of the Atlantic thermohaline circulation On the freshwater forcing and transport of the Atlantic thermohaline circulation.\BBCQ \APACjournalVolNumPagesClimate Dynamics12799–811. \PrintBackRefs\CurrentBib
- Rahmstorf (\APACyear2002) \APACinsertmetastarRahmstorf2002{APACrefauthors}Rahmstorf, S. \APACrefYearMonthDay2002. \BBOQ\APACrefatitleOcean circulation and climate changes during the past 120,000 years Ocean circulation and climate changes during the past 120,000 years.\BBCQ \APACjournalVolNumPagesNature419207–214. \PrintBackRefs\CurrentBib
- Rahmstorf \BOthers. (\APACyear2005) \APACinsertmetastarRahmstorf2005{APACrefauthors}Rahmstorf, S., Crucifix, M., Ganopolski, A., Goosse, H., Kamenkovich, I., Knutti, R.\BDBLWeaver, A\BPBIJ. \APACrefYearMonthDay2005. \BBOQ\APACrefatitleThermohaline circulation hysteresis: a model intercomparison Thermohaline circulation hysteresis: a model intercomparison.\BBCQ \APACjournalVolNumPagesGeophysical Research LettersL236051–5. \PrintBackRefs\CurrentBib
- Santer \BOthers. (\APACyear2000) \APACinsertmetastarSanter2000{APACrefauthors}Santer, B\BPBID., Wigley, T., Boyle, J., Gaffen, D\BPBIJ., Hnilo, J., Nychka, D.\BDBLTaylor, K. \APACrefYearMonthDay2000. \BBOQ\APACrefatitleStatistical significance of trends and trend differences in layer-average atmospheric temperature time series Statistical significance of trends and trend differences in layer-average atmospheric temperature time series.\BBCQ \APACjournalVolNumPagesJournal of Geophysical Research: Atmospheres105D67337–7356. \PrintBackRefs\CurrentBib
- Smeed \BOthers. (\APACyear2018) \APACinsertmetastarSmeed2018{APACrefauthors}Smeed, D\BPBIA., Josey, S., Beaulieu, C., Johns, W., Moat, B\BPBII., Frajka-Williams, E.\BDBLothers \APACrefYearMonthDay2018. \BBOQ\APACrefatitleThe North Atlantic Ocean is in a state of reduced overturning The North Atlantic Ocean is in a state of reduced overturning.\BBCQ \APACjournalVolNumPagesGeophysical Research Letters4531527–1533. \PrintBackRefs\CurrentBib
- Srokosz \BBA Bryden (\APACyear2015) \APACinsertmetastarSrokosz2015{APACrefauthors}Srokosz, M\BPBIA.\BCBT \BBA Bryden, H\BPBIL. \APACrefYearMonthDay201506. \BBOQ\APACrefatitleObserving the Atlantic Meridional Overturning Circulation yields a decade of inevitable surprises. Observing the Atlantic Meridional Overturning Circulation yields a decade of inevitable surprises.\BBCQ \APACjournalVolNumPagesScience34862411255575 – 1255575. {APACrefDOI} 10.1126/science.1255575 \PrintBackRefs\CurrentBib
- Stommel (\APACyear1961) \APACinsertmetastarStommel1961{APACrefauthors}Stommel, H. \APACrefYearMonthDay1961. \BBOQ\APACrefatitleThermohaline convection with two stable regimes of flow Thermohaline convection with two stable regimes of flow.\BBCQ \APACjournalVolNumPagesTellus132224–230. \PrintBackRefs\CurrentBib
- Stouffer \BOthers. (\APACyear2006) \APACinsertmetastarStouffer2006{APACrefauthors}Stouffer, R\BPBIJ., Yin, J., Gregory, J\BPBIM., Dixon, K\BPBIW., Spelman, M\BPBIJ., Hurlin, W.\BDBLWeber, S\BPBIL. \APACrefYearMonthDay2006. \BBOQ\APACrefatitleInvestigating the causes of the response of the thermohaline circulation to past and future climate changes Investigating the causes of the response of the thermohaline circulation to past and future climate changes.\BBCQ \APACjournalVolNumPagesJournal of Climate191365-1387. \PrintBackRefs\CurrentBib
- van Westen \BBA Dijkstra (\APACyear2023\APACexlab\BCnt1) \APACinsertmetastarvanWesten2023d{APACrefauthors}van Westen, R\BPBIM.\BCBT \BBA Dijkstra, H\BPBIA. \APACrefYearMonthDay2023\BCnt1. \BBOQ\APACrefatitleModel results and post-processing codes [Software] Model results and post-processing codes [Software].\BBCQ {APACrefURL} https://doi.org/10.5281/zenodo.8262424 \PrintBackRefs\CurrentBib
- van Westen \BBA Dijkstra (\APACyear2023\APACexlab\BCnt2) \APACinsertmetastarvanWesten2023b{APACrefauthors}van Westen, R\BPBIM.\BCBT \BBA Dijkstra, H\BPBIA. \APACrefYearMonthDay2023\BCnt2. \BBOQ\APACrefatitlePersistent Climate Model Biases in the Atlantic Ocean’s Freshwater Transport Persistent Climate Model Biases in the Atlantic Ocean’s Freshwater Transport.\BBCQ \APACjournalVolNumPagesEGUsphere1–29. {APACrefDOI} 10.5194/egusphere-2023-1502 \PrintBackRefs\CurrentBib
- van Westen \BOthers. (\APACyear2023) \APACinsertmetastarvanWesten2023c{APACrefauthors}van Westen, R\BPBIM., Kliphuis, M.\BCBL \BBA Dijkstra, H\BPBIA. \APACrefYearMonthDay2023. \BBOQ\APACrefatitleNew Physics-Based Early Warning Signal shows AMOC is on Tipping Course New Physics-Based Early Warning Signal shows AMOC is on Tipping Course.\BBCQ \APACjournalVolNumPages1–29. {APACrefDOI} https://doi.org/10.48550/arXiv.2308.01688 \PrintBackRefs\CurrentBib
- Weijer \BOthers. (\APACyear2019) \APACinsertmetastarWeijer2019{APACrefauthors}Weijer, W., Cheng, W., Drijfhout, S\BPBIS., Fedorov, A\BPBIV., Hu, A., Jackson, L\BPBIC.\BDBLZhang, J. \APACrefYearMonthDay2019. \BBOQ\APACrefatitleStability of the Atlantic Meridional Overturning Circulation: A review and synthesis Stability of the Atlantic Meridional Overturning Circulation: A review and synthesis.\BBCQ \APACjournalVolNumPagesJournal of Geophysical Research: Oceans12485336–5375. \PrintBackRefs\CurrentBib
- Weijer \BOthers. (\APACyear2020) \APACinsertmetastarWeijer2020{APACrefauthors}Weijer, W., Cheng, W., Garuba, O\BPBIA., Hu, A.\BCBL \BBA Nadiga, B\BPBIT. \APACrefYearMonthDay2020. \BBOQ\APACrefatitleCMIP6 Models Predict Significant 21st Century Decline of the Atlantic Meridional Overturning Circulation CMIP6 Models Predict Significant 21st Century Decline of the Atlantic Meridional Overturning Circulation.\BBCQ \APACjournalVolNumPagesGeophysical Research Letters4712e2019GL08607. {APACrefDOI} 10.1029/2019gl086075 \PrintBackRefs\CurrentBib
- Worthington \BOthers. (\APACyear2021) \APACinsertmetastarWorthington2021{APACrefauthors}Worthington, E\BPBIL., Moat, B\BPBII., Smeed, D\BPBIA., Mecking, J\BPBIV., Marsh, R.\BCBL \BBA McCarthy, G\BPBID. \APACrefYearMonthDay2021. \BBOQ\APACrefatitleA 30-year reconstruction of the Atlantic meridional overturning circulation shows no decline A 30-year reconstruction of the Atlantic meridional overturning circulation shows no decline.\BBCQ \APACjournalVolNumPagesOcean Science171285–299. \PrintBackRefs\CurrentBib