Ubiquitous Late Radio Emission from Tidal Disruption Events
Abstract
We present radio observations of optically-discovered tidal disruption events (TDEs) on timescales of about days post-discovery. We detect 9 new TDEs that did not have detectable radio emission at earlier times, indicating a late-time brightening after several hundred (and up to 2300 days); an additional 6 TDEs exhibit radio emission whose origin is ambiguous or may be attributed to the host galaxy or an AGN. We also report new rising components in two TDEs previously detected in the radio (iPTF16fnl and AT2019dsg) at days. While the radio emission in some of the detected TDEs peaked on a timescale of years, more than half of the sample still shows rising emission. The range of luminosities for the sample is erg s-1, about two orders of magnitude below the radio luminosity of the relativistic TDE Sw1644+57. Our data set indicates that about 40% of all optical TDEs are detected in the radio hundreds to thousands of days after discovery, and that this is probably more common than early radio emission peaking at days. Using an equipartition analysis, we find evidence for a delayed launch of the radio-emitting outflows, with delay timescales of days, inferred velocities of , and kinetic energies of erg. We rule out off-axis relativistic jets as a viable explanation for this population, and conclude delayed outflows are a more likely explanation, such as from delayed disk formation. Finally, we find comparable densities in the circumnuclear environments of these TDEs as for those with early radio emission, and find the TDEs still rising in luminosity are consistent with free expansion. We conclude that late radio emission marks a fairly ubiquitous but heretofore overlooked phase of TDE evolution.
1 Introduction
Optical/UV and X-ray emissions from TDEs are generally thought to track the mass fallback (e.g., Stone et al. 2013; Guillochon & Ramirez-Ruiz 2013) and cooling (e.g., Metzger 2022) of the bound stellar debris onto the central supermassive black hole. Radio observations, on the other hand, can reveal and characterize outflows from TDEs (Alexander et al., 2020), including the presence of relativistic jets (e.g. Zauderer et al., 2011; Giannios & Metzger, 2011; De Colle et al., 2012; Andreoni et al., 2022).
To date, rapid follow-up of TDEs within the first days to weeks after discovery has led to the radio detection of several events. These include most prominently Swift J1644+57 (Sw J1644+57), whose radio and mm emission are powered by a relativistic outflow with an energy of erg and an initial Lorentz factor of , first detected in radio days after its initial discovery in gamma-rays (Zauderer et al., 2011; Metzger et al., 2012; Berger et al., 2012; Zauderer et al., 2013; Eftekhari et al., 2018; Cendes et al., 2021b). Other events, such as ASASSN-14li and AT2019dsg, have instead exhibited evidence for non-relativistic outflows, with erg and , with first radio detections within a few weeks of discovery (e.g., Alexander et al. 2020; Pasham & van Velzen 2018; Alexander et al. 2016; Cendes et al. 2021a; Stein et al. 2021).
Currently, most studies of radio TDEs primarily focus on the detection of radio emission at time in days days, and emission is detected in of cases (Alexander et al., 2020). Recently, however, four TDEs have been reported to show radio emission with a delay relative to the time of optical discovery. AT2018hyz was first detected at days post-discovery, despite several constraining upper limits at earlier times (including at 705 days), and has been increasing at a steep rise of relative to the time of optical discovery (Cendes et al., 2022b). This delay and rapid rise have been interpreted as either due to a delayed, mildly relativistic outflow launched d after optical discovery, or an off-axis jet which was launched promptly at the time of optical discovery and whose emitting area and angle have increased over time (Cendes et al., 2022b; Matsumoto & Piran, 2023). ASASSN-15oi was first detected days after optical discovery with a luminosity that exceeded earlier radio limits by a factor of (Horesh et al., 2021a); this emission subsequently declined until about 550 days, and then exhibited a second rapid rise with a detection at 1400 days with an even higher luminosity than the first peak; see Figure 1. iPTF16fnl was first detected days after optical discovery, with a luminosity about a factor of 8 times larger than earlier limits (extending to 63 days) and appeared to slowly brighten to about 417 days (Horesh et al., 2021b). The initial abrupt rise in ASASSN-15oi seems to differ from the radio light curve of AT2019dsg, although both reach their peak radio luminosity on a similar timescale and at a similar level. The gradual rise and much lower peak luminosity of iPTF16fnl ( erg s-1), on the other hand, may indicate that it is simply a less energetic example of typical radio-emitting TDEs. Finally, it is possible that TDEs with prompt detections can exhibit a secondary re-brightening after emission has faded: in the case of AT2020vwl, which was first detected in radio days post-disruption, the source declined in emission to days and is now increasing in brightness 900 days post-optical discovery (Goodwin et al., 2023b, a).
Here, we present radio observations of a sample of 23 optically detected TDEs on a timescale of about 500 to 2500 days post disruption, which show of these TDEs have radio detections at these late times despite no emission detected at earlier times. Our extensive multi-frequency data allow us to present detailed physical parameters for this TDE population in energetics, densities, and luminosities. This more than doubles the number of radio-detected TDEs to date, and allow us to show an increasing diversity in the TDE landscape, particularly at these later time scales.
Our paper is structured as follows. In §2, we present our radio observations. In §3, we discuss our results for individual TDEs in our study, including radio luminosity and evolution for individual TDEs and the rate of late-time TDE radio emission. In §4 we discuss equipartition analysis for TDEs where multi-frequency data is available and estimated launch dates of the radio outflows. In §5 we discuss our findings in the context of the TDE population, with additional analysis presented in our companion paper, Alexander et al. 2023. We summarize our conclusions in §6.
2 Sample Selection & Observations
We observed 24 optically-selected TDEs, extending to , discovered between January 2014 and October 2020. The targets were drawn from the samples of van Velzen et al. (2020) and Hammerstein et al. (2022), supplemented with a few additional events from the literature. The sample of events is presented in Table 1. All TDEs were years post-discovery at the time of our observations. We emphasize that one of these TDEs, AT2018hyz, showed an especially dramatic radio brightening starting at years post optical discovery and was presented in detail in a previous paper (Cendes et al., 2022b). The properties of all 24 TDEs in our sample are provided in Table 5.
We obtained radio observations with the Karl G. Jansky Very Large Array (VLA), the MeerKAT radio telescope, and the Australian Telescope Compact Array (ATCA). VLA observations were first obtained in C-band (6 GHz), followed by multi-frequency observation in L- to K-band ( GHz) in the event of a detection (Program IDs: 20A-492 PI: Alexander; 21A-303 PI: Hajela; 21B-360 PI: Cendes; 22B-205 PI: Cendes). We processed the data using standard data reduction procedures in the Common Astronomy Software Application package (CASA; McMullin et al. 2007), using tclean on the calibrated measurement sets available in the NRAO archive. We obtained all flux densities and uncertainties using the imtool fitsrc command within the pwkit package (Williams et al., 2017)111https://github.com/pkgw/pwkit. We assumed a point source fit, as preferred by the data. The resulting flux density measurements are provided in Table 5.
We obtained MeerKAT observations in L-band (1.36 GHz) and U-band (0.88 GHz; Program IDs: DDT-20200911-YC-01 PI: Cendes; SCI-20210212-YC-01 PI: Cendes; DDT-20220414-YC-01 PI: Cendes; SCI-20220822-YC-01 PI: Cendes; SCI-20220822-MB-03 PI: Bietenholz). We used the standard calibrated MeerKAT pipeline images available via the SARAO Science Data Processor (SDP)222https://skaafrica.atlassian.net/wiki/spaces/ESDKB/pages/338723406/, with the exception of data from SCI-20220822-MB-03 which was processed by OxKAT (Heywood, 2020). We confirmed via the secondary SDP products that the other sources in the MeerKAT images also in the NRAO VLA Sky Survey (NVSS; Condon et al., 1998) were within in expected flux. We then obtained all flux densities and uncertainties using the imtool fitsrc command within pwkit. The resulting flux density measurements are provided in Table 5.
We obtained ATCA observations in S to Ku band ( GHz; Program IDs: C3472 PI: Cendes; C3325 PI: Alexander). We analyzed the data using the MIRIAD package with the respective calibrators for absolute flux-density and band-pass, and to correct short term gain and phase changes. The invert, mfclean and restor tasks were used to make deconvolved wideband, natural weighted images in each frequency band. Fluxe densities were determined by fitting a point source model using the Miriad imfit tasks; for any upper limits, the image value at the expected location was used. The resulting flux density measurements are provided in Table 5.
Additionally, we obtained archival images from the Very Large Array Sky Survey (VLASS; Lacy et al., 2020), and from the Variables and Slow Transients Survey (VAST; Murphy et al., 2021) where available; VLASS images are taken in S-band (3 GHz) and VAST images in UHF band (0.88 GHz). We measured the flux densities in these images with the imtool fitsrc command within pwkit. We also checked the NRAO data archive, MeerKAT data archive, and the Australia Telescope National Facility (ATNF) Data Archives and include any unpublished observations of our TDE sample, with the relevant project codes listed in Table 5.
For all TDEs, we define the times of our observations relative to the date of the TDE discovery (). In the case of a non-detection, we report a upper limit. We note that the uncertainties listed in Table 5 are statistical only and do not include an expected systematic uncertainty in the overall flux density calibration; we account for this systematic uncertainty in our subsequent modeling (§4.)
| Object | Distance | Discovery Date | TDE Class | Discovery | |
|---|---|---|---|---|---|
| (Mpc) | (UT) | Paper | |||
| TDEs with Previously-Known Radio Emission | |||||
| iPTF16fnl | 0.0163 | 71 | 2016 Aug 29 | TDE-H+He | Blagorodnova et al. (2017) |
| AT2019dsg | 0.0512 | 230 | 2019 Apr 9 | TDE-H+He | Hammerstein et al. (2023) |
| AT2020mot∗ | 0.070 | 317 | 2020 Jun 14 | TDE-H+He | Hammerstein et al. (2023) |
| TDEs with Newly-Detected Radio Emission | |||||
| ASASSN-14ae | 0.0436 | 200 | 2014 Jan 25 | TDE-H+He† | Holoien et al. (2014) |
| PS16dtm | 0.0804 | 368 | 2016 Aug 12 | TDE-H | Blanchard et al. (2017) |
| OGLE17aaj∗ | 0.116 | 540 | 2017 Jan 2 | TDE-H+He | Gromadzki et al. (2019) |
| AT2018zr | 0.071 | 323 | 2018 Mar 2 | TDE-H+He† | van Velzen et al. (2021) |
| AT2018dyb | 0.018 | 79 | 2018 Jul 11 | TDE-Bowen | Holoien et al. (2020) |
| AT2018bsi∗ | 0.051 | 228 | 2018 Apr 9 | TDE-H+He | van Velzen et al. (2021) |
| AT2018hco | 0.088 | 404 | 2018 Oct 4 | TDE-H | van Velzen et al. (2021) |
| AT2018hyz | 0.046 | 205 | 2018 Oct 14 | TDE-H+He† | Gomez et al. (2020); Short et al. (2020) |
| AT2019ehz | 0.074 | 338 | 2019 Apr 29 | TDE-H | van Velzen et al. (2021) |
| AT2019eve | 0.081 | 372 | 2019 May 5 | TDE-H | van Velzen et al. (2021) |
| AT2019teq | 0.087 | 404 | 2019 Oct 20 | TDE-H+He | Hammerstein et al. (2023) |
| AT2020nov∗ | 0.084 | 385 | 2020 Jun 27 | TDE-H+He | Frederick et al. (2020) |
| AT2020neh | 0.062 | 280 | 2020 Jun 19 | TDE-H+He | Angus et al. (2022) |
| AT2020pj∗ | 0.068 | 308 | 2020 Jan 2 | TDE-H+He | Hammerstein et al. (2023) |
| AT2020wey∗ | 0.027 | 120 | 2020 Oct 8 | TDE-H+He | Hammerstein et al. (2023) |
| TDEs with No Detected Radio Emission | |||||
| DES14C1kia | 0.162 | 782 | 2014 Nov 11 | TDE-He | Foley et al. (2015) |
| iPTF15af | 0.079 | 360 | 2015 Jan 15 | TDE-H+He | Blagorodnova et al. (2019) |
| iPTF16axa | 0.108 | 503 | 2016 May 29 | TDE-H+He | Hung et al. (2017) |
| AT2017eqx | 0.109 | 508 | 2017 Jun 7 | TDE-H+He | Nicholl et al. (2019) |
| AT2018fyk | 0.059 | 264 | 2018 Sept 8 | TDE-H+He | Wevers et al. (2019) |
| AT2018lna | 0.091 | 419 | 2018 Dec 28 | TDE-H+He | van Velzen et al. (2021) |
Note. — For this table and throughout this paper we assume a flat CDM cosmology with H0 = 69.6 km s-1 Mpc-1, = 0.286, and =0.714 (Wright, 2006).
∗ TDEs for which radio emission was detected in our observations, but the nature of the emission is ambiguous, or due to star formation or AGN (see §3.1.3).
†These TDEs showed only H lines in their initial classification spectra, leading to their labeling as TDE-H in some references. However, Holoien et al. (2014) report the emergence of He II in ASASSN-14ae in later epochs, which eventually becomes stronger than the H Balmer lines. Similarly, although AT2018hyz was classified by van Velzen et al. (2021) as a TDE-H, Short et al. (2020) report the presence of both He I and He II emission lines (the latter appearing at d). AT2018zr had the most delayed appearance of He II emission, at d post-discovery (Hung et al., 2019). We therefore list all three objects as TDE-H+He.
3 Results
3.1 Radio Luminosity and Time Evolution
Of the 24 TDEs in our full sample (including AT2018hyz), 17 are detected in our observations on a timescale of days. A detailed description of each TDE is provided in §3.1.1. Of the 17 detected TDEs, 3 were detected in the radio at earlier times: iPTF16fnl (Horesh et al., 2021b), AT2019dsg (Cendes et al., 2022b), and AT2020mot (Liodakis et al., 2022). Additionally, in 6 of the 17 detected TDEs the nature of the radio emission is ambiguous, namely they do not exhibit significant time evolution and/or lack constraining early limits; the radio emission in these cases may be due to a pre-existing AGN or star formation in the host galaxy. This leaves 10 TDEs with definitive late-time radio emission well in excess of non-detections at early times (including AT2018hyz), requiring significant brightening hundreds of days post optical discovery.
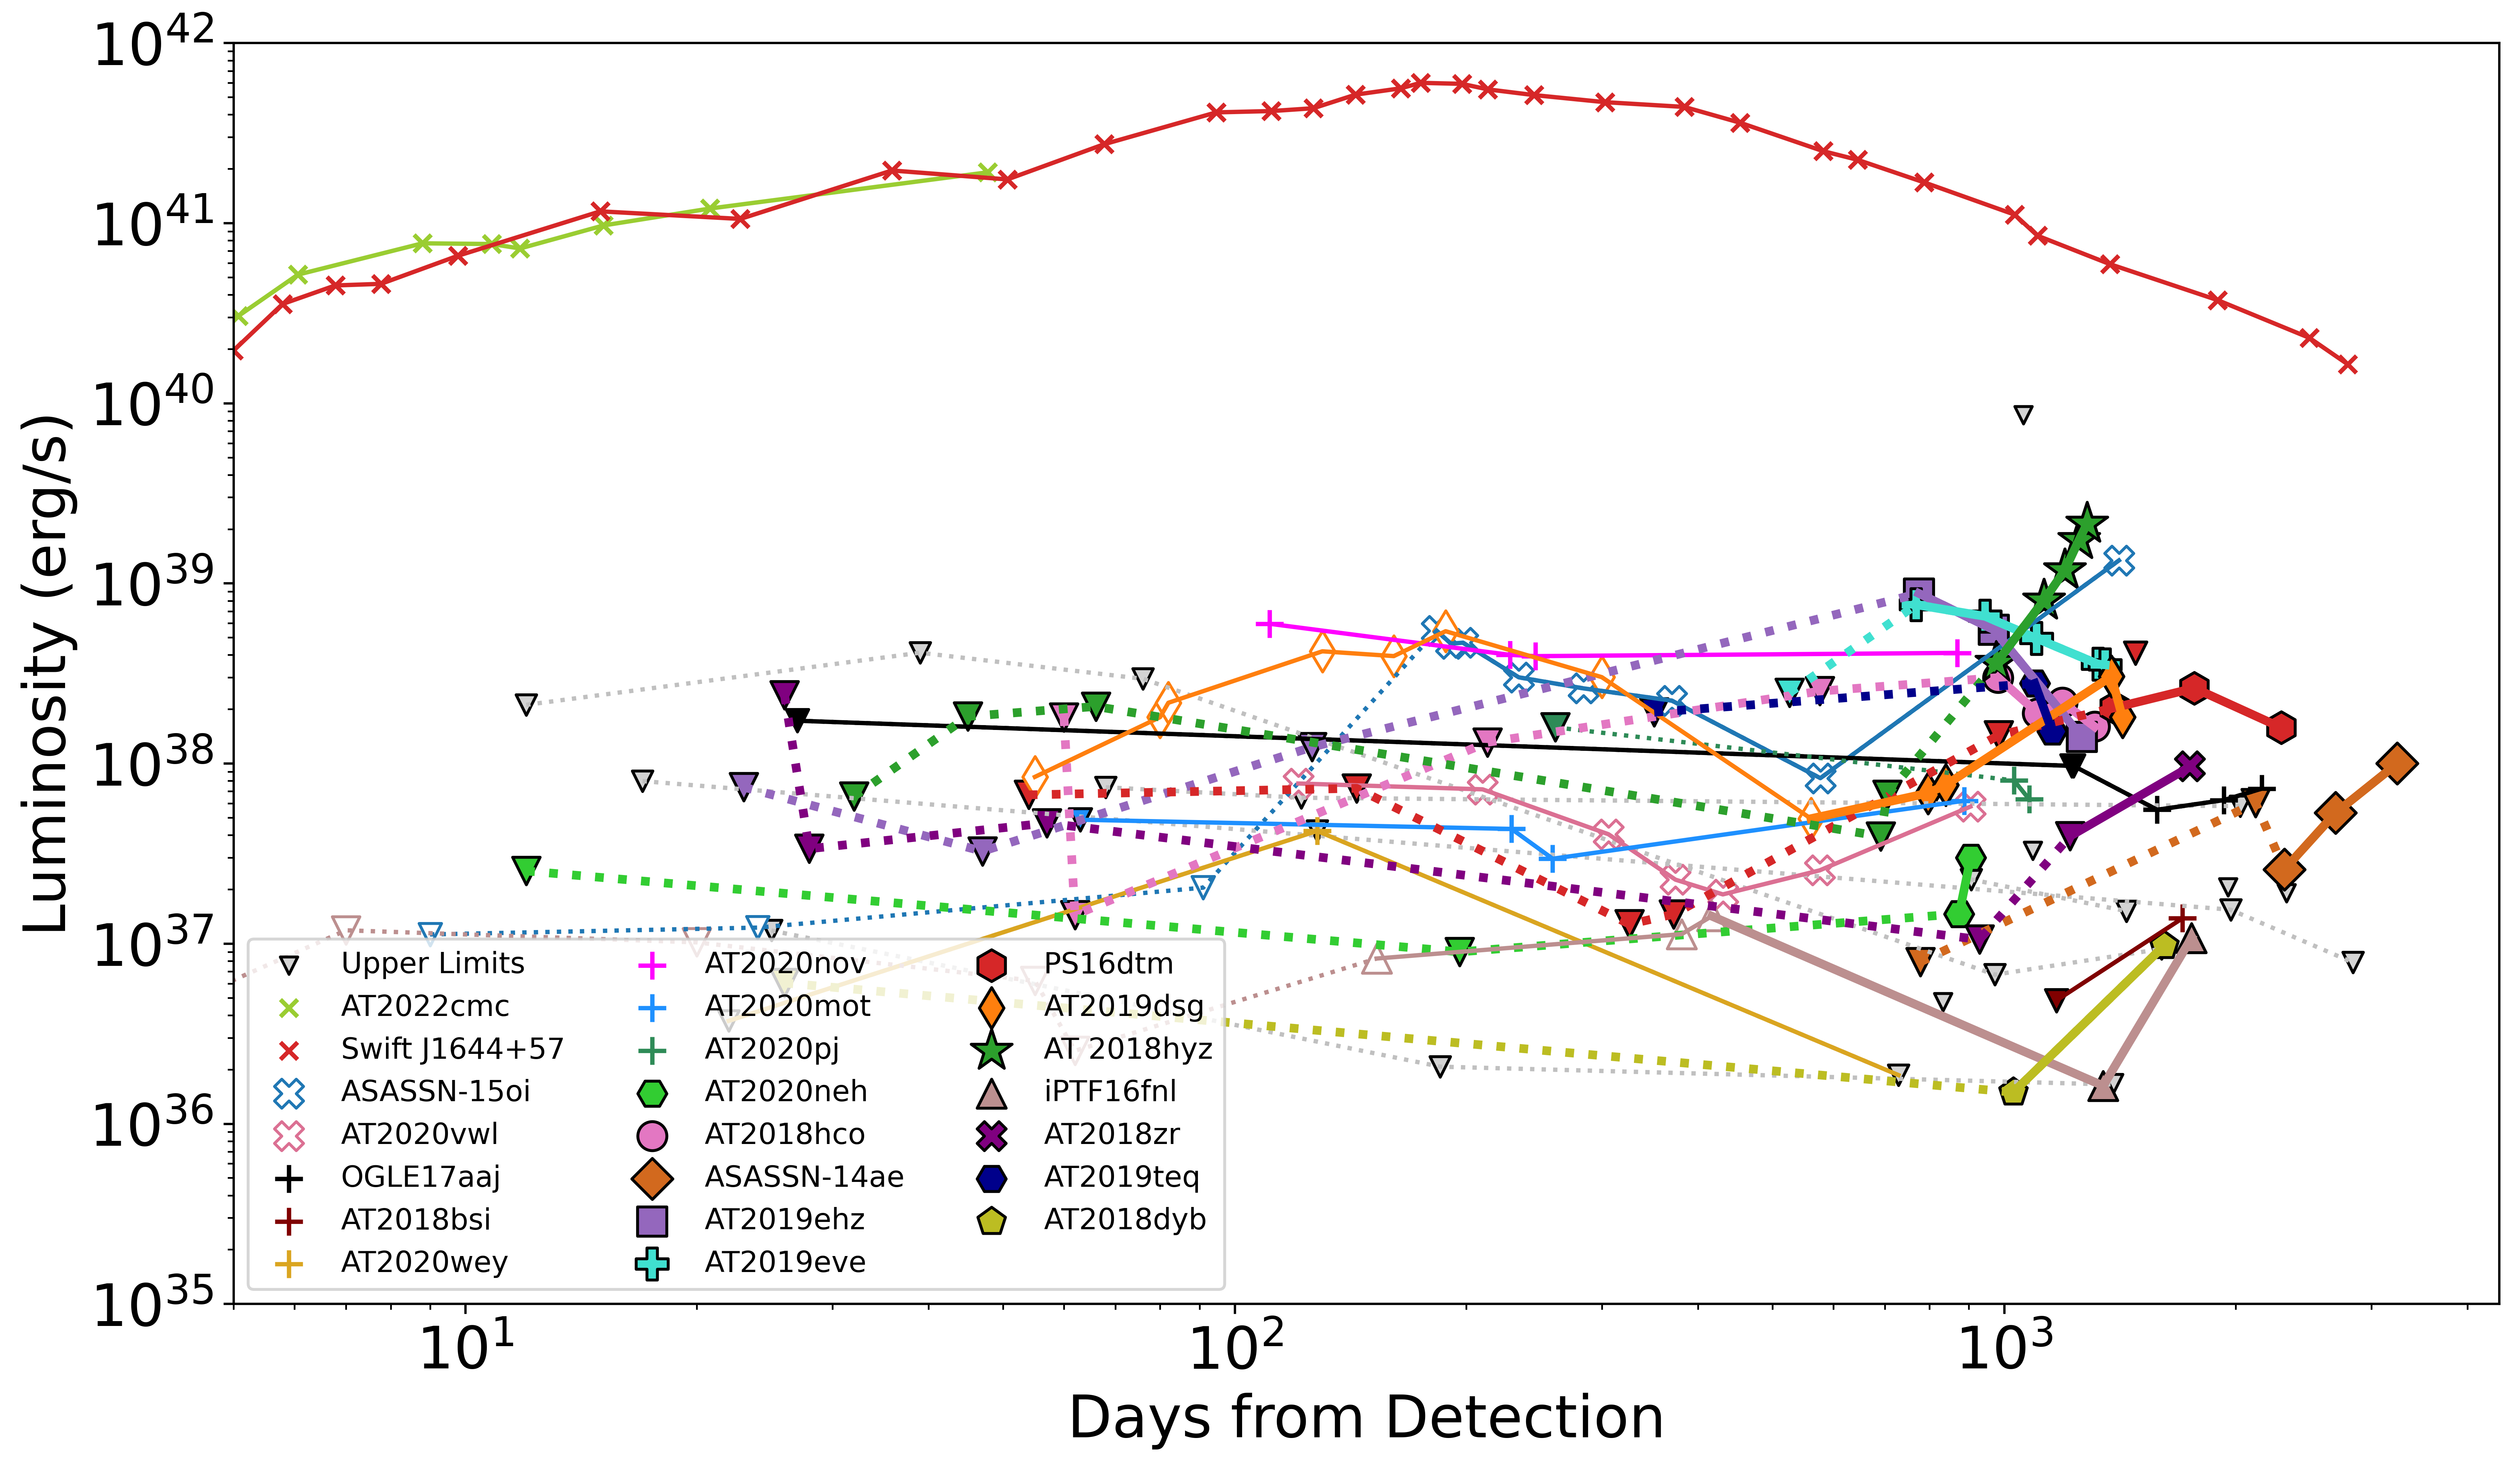
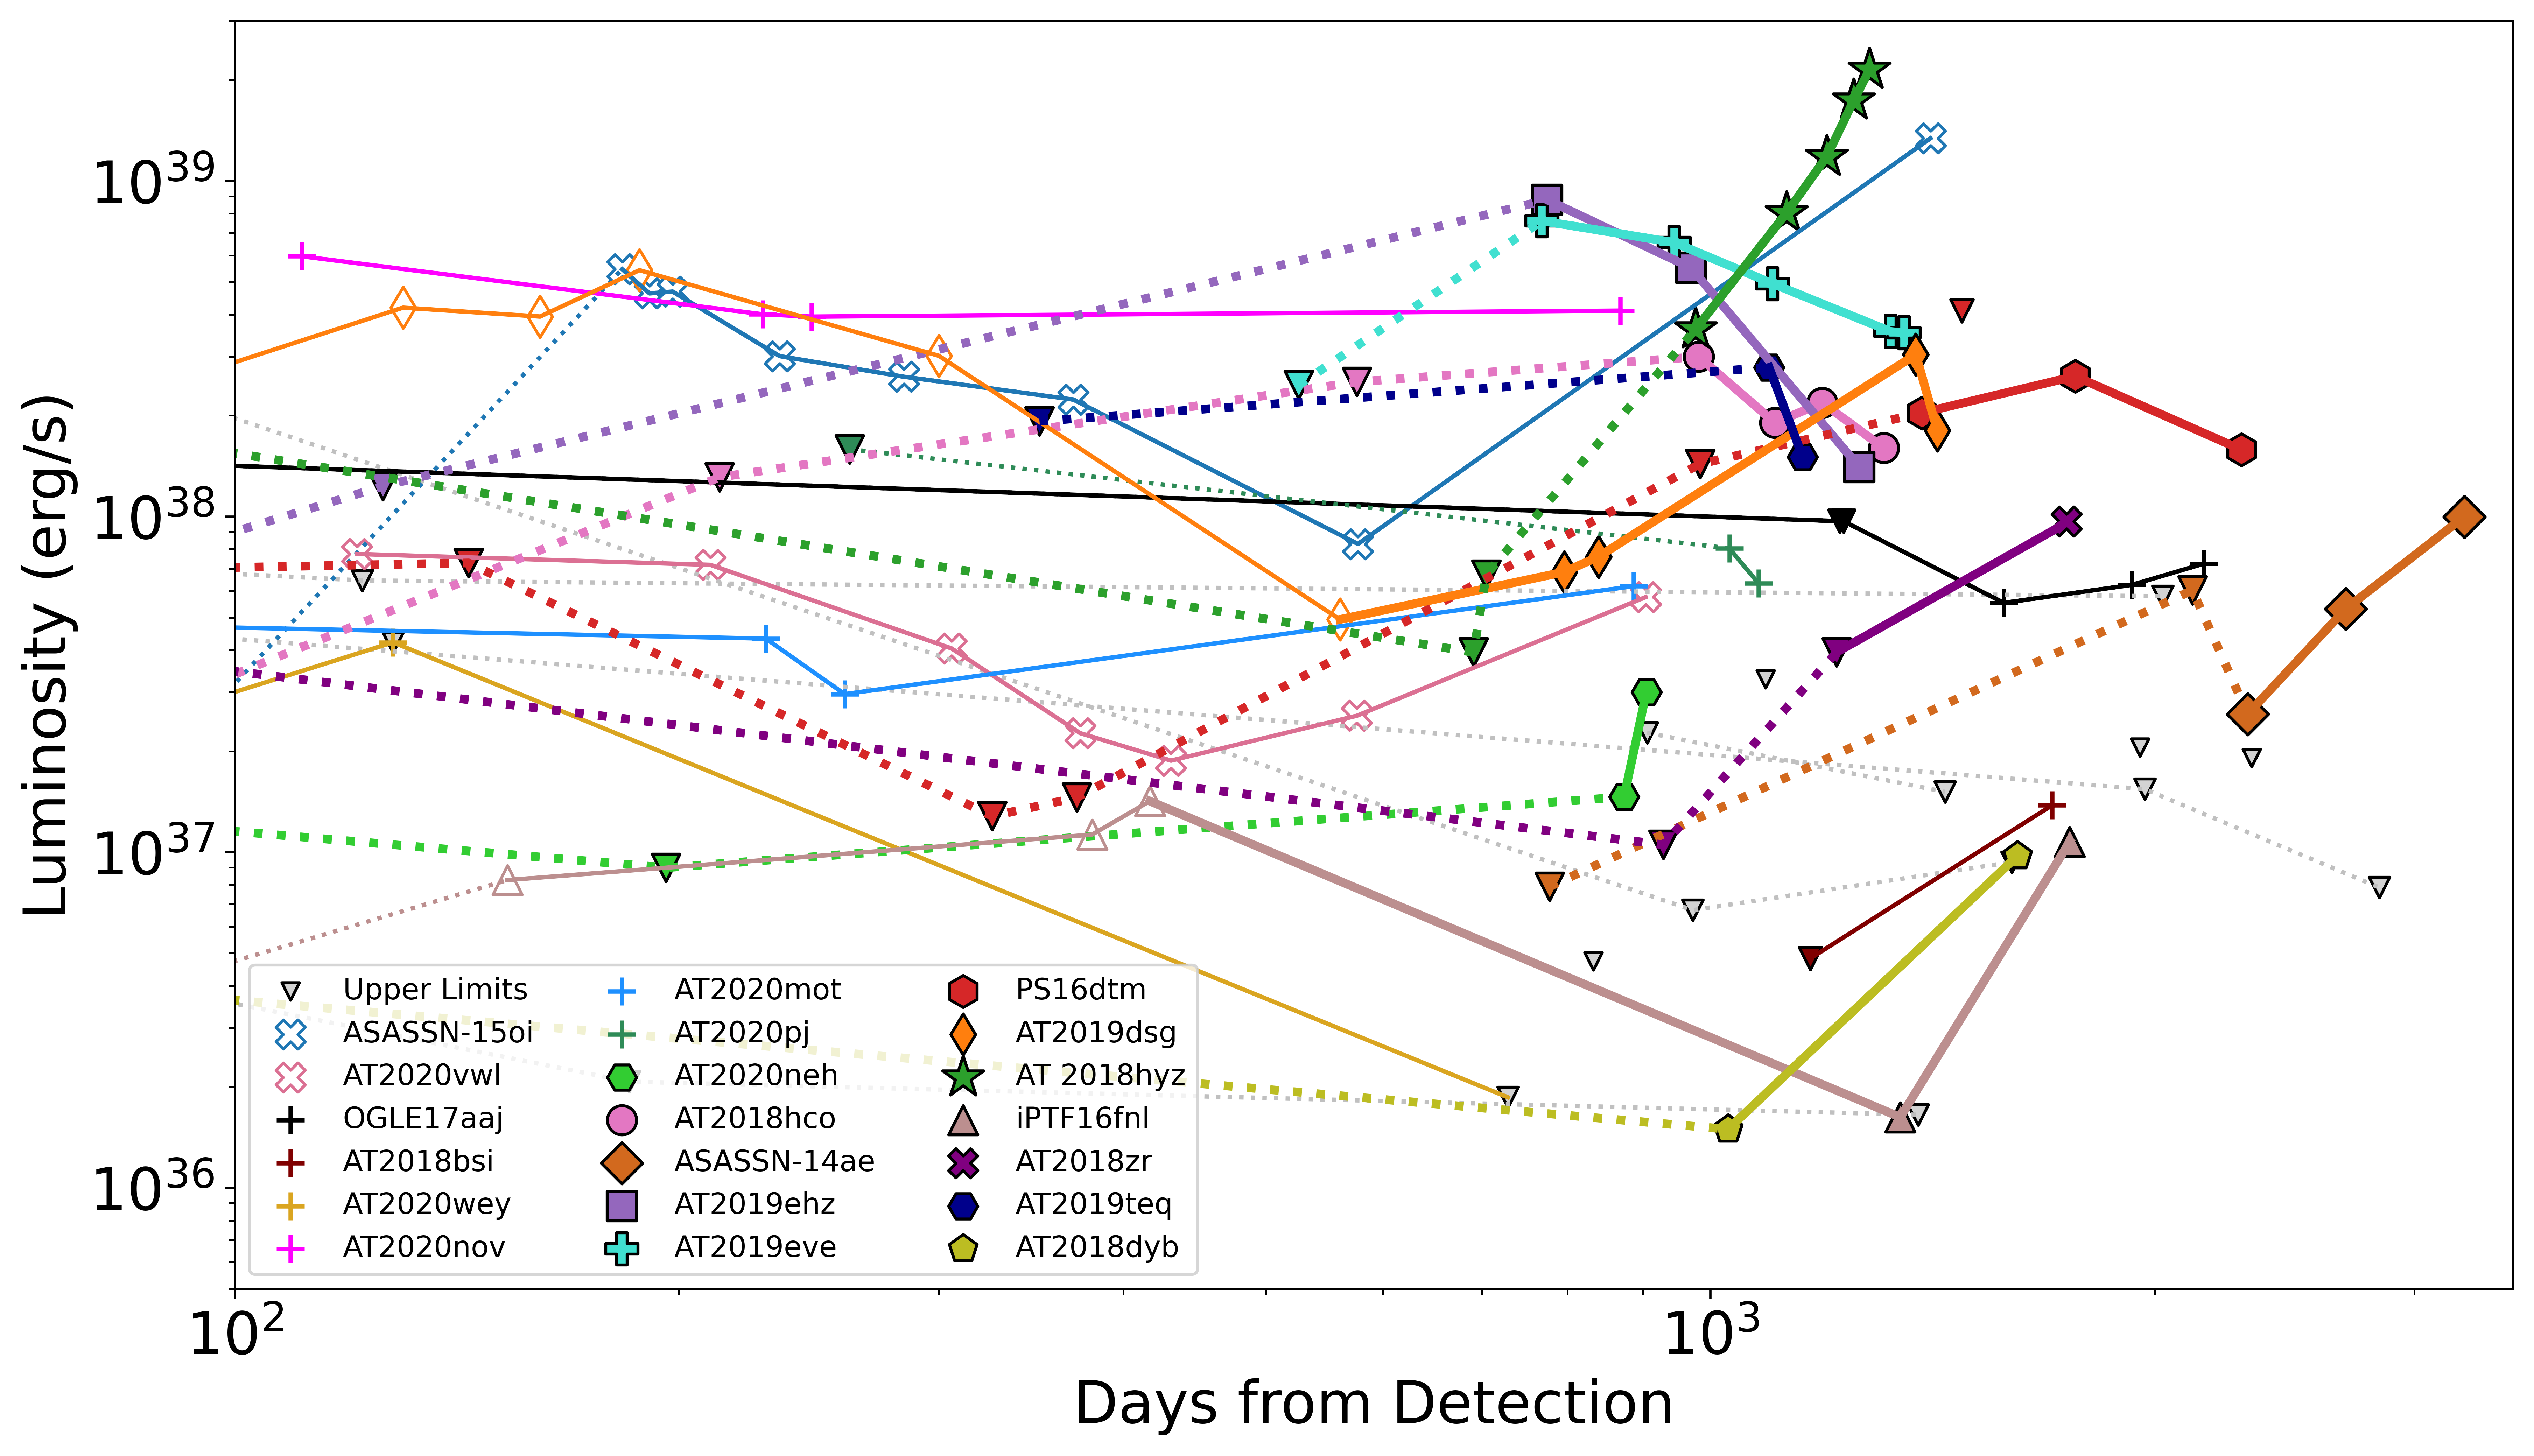
We present the radio light curves for all 24 sources in this full sample, including upper limits, in Figure 1. For the purpose of comparison, we also include the radio light curves of the jetted TDEs SwJ1644+57 (Eftekhari et al., 2018; Cendes et al., 2021b) and AT2022cmc (Andreoni et al., 2022), and two previous TDEs with late radio emission, ASASSN-15oi (Horesh et al., 2021a) and AT2020vwl (Goodwin et al., 2023b, a). We also include previously published data for iPTF16fnl (Blagorodnova et al., 2017; Horesh et al., 2021b), AT2018dyb (Holoien et al., 2020), iPTF15af (Blagorodnova et al., 2019), PS16dtm (Blanchard et al., 2017), AT2018hco (Horesh et al., 2018), AT2020mot (Liodakis et al., 2022), AT2018hyz (Cendes et al., 2022b) and AT2019dsg (Stein et al., 2021; Cendes et al., 2021a). In all cases where multi-frequency observations are available, we use data in C-band (6 GHz).
3.1.1 TDEs with Newly-Discovered Late Radio Emission
We report 9 new TDEs with late-time radio emission identified based on our observations and constraining earlier non-detections (from targeted or survey data). Below we briefly describe the radio light curve properties of each event.
-
•
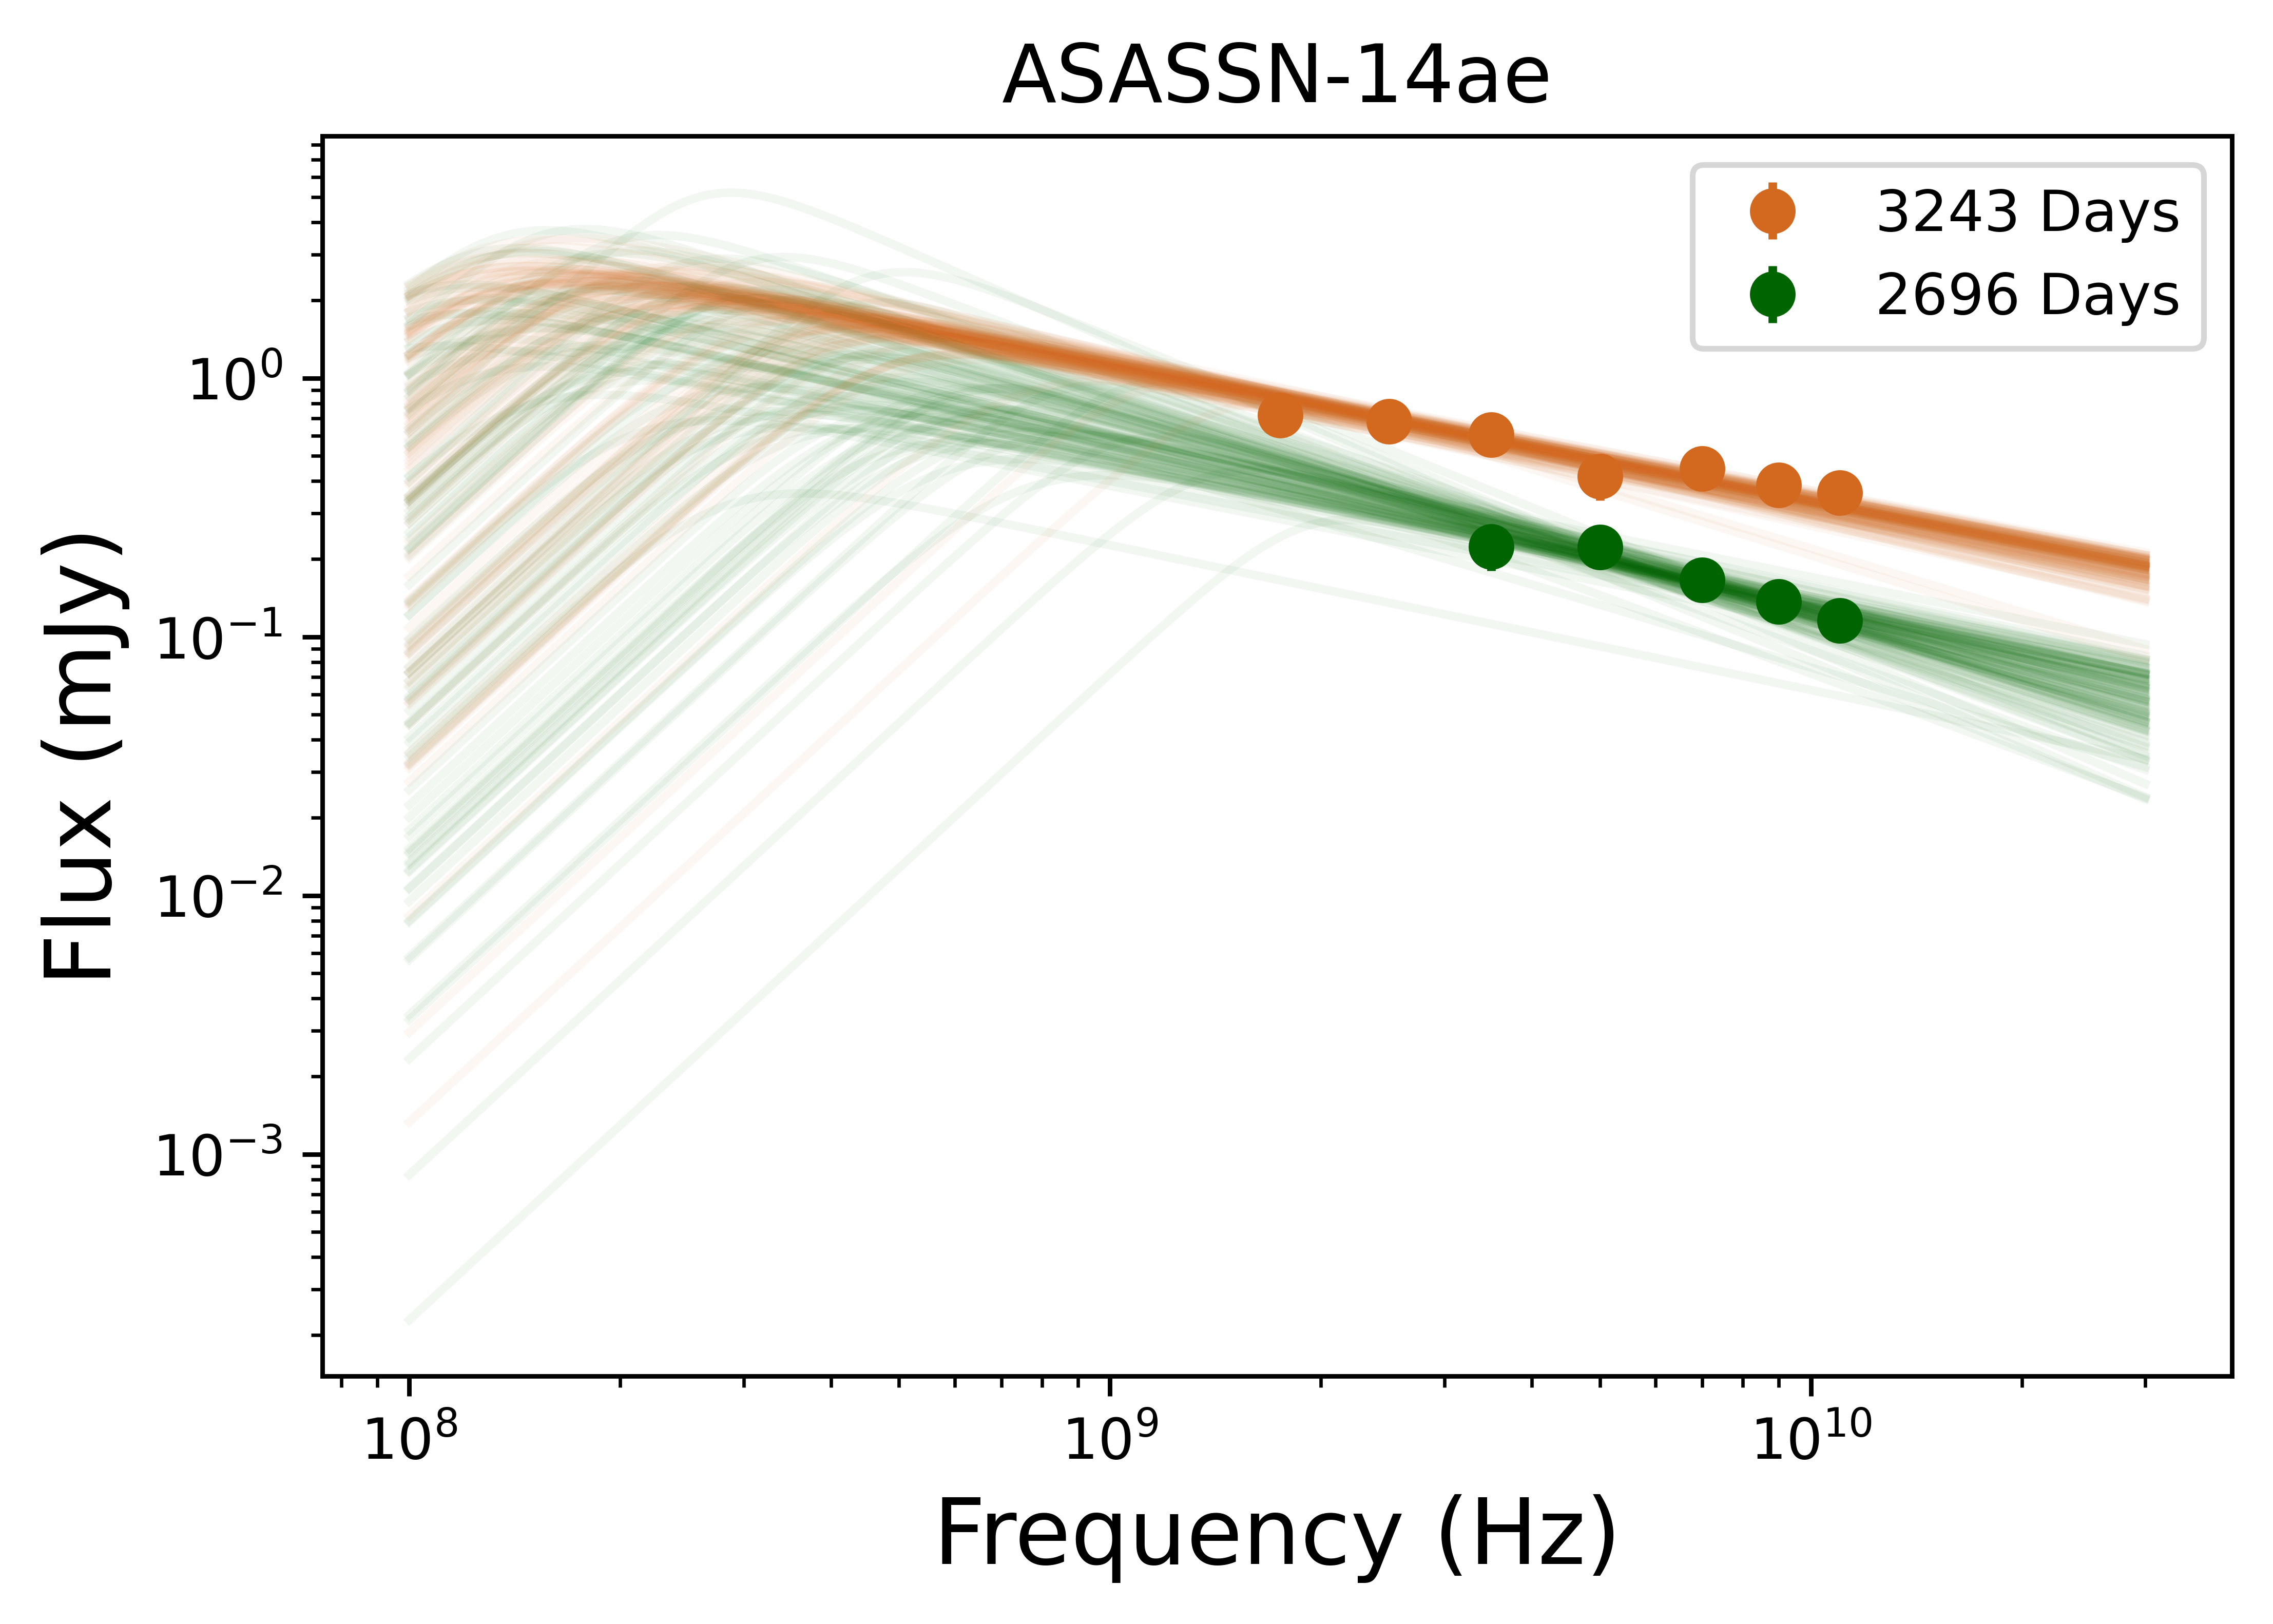
ASASSN-14ae was optically discovered on 2014 January 25 at a redshift of (Holoien et al., 2014), making it the oldest TDE in our sample. A VLA observation at 778 days yielded an upper limit of mJy at 6 GHz, and a VLASS observation at 2122 days yielded an upper limit of mJy at 3 GHz. We first detected ASASSN-14ae at 2313 days when it was mJy at 6 GHz, and found a steady (and on-going) rise in its light curve over subsequent observations to mJy at 3243 days, or a luminosity of erg s-1. This corresponds with a factor of increase in luminosity since detection, with a steep power law rise () with . Continued observations of the rising light curve are on-going.
-
•
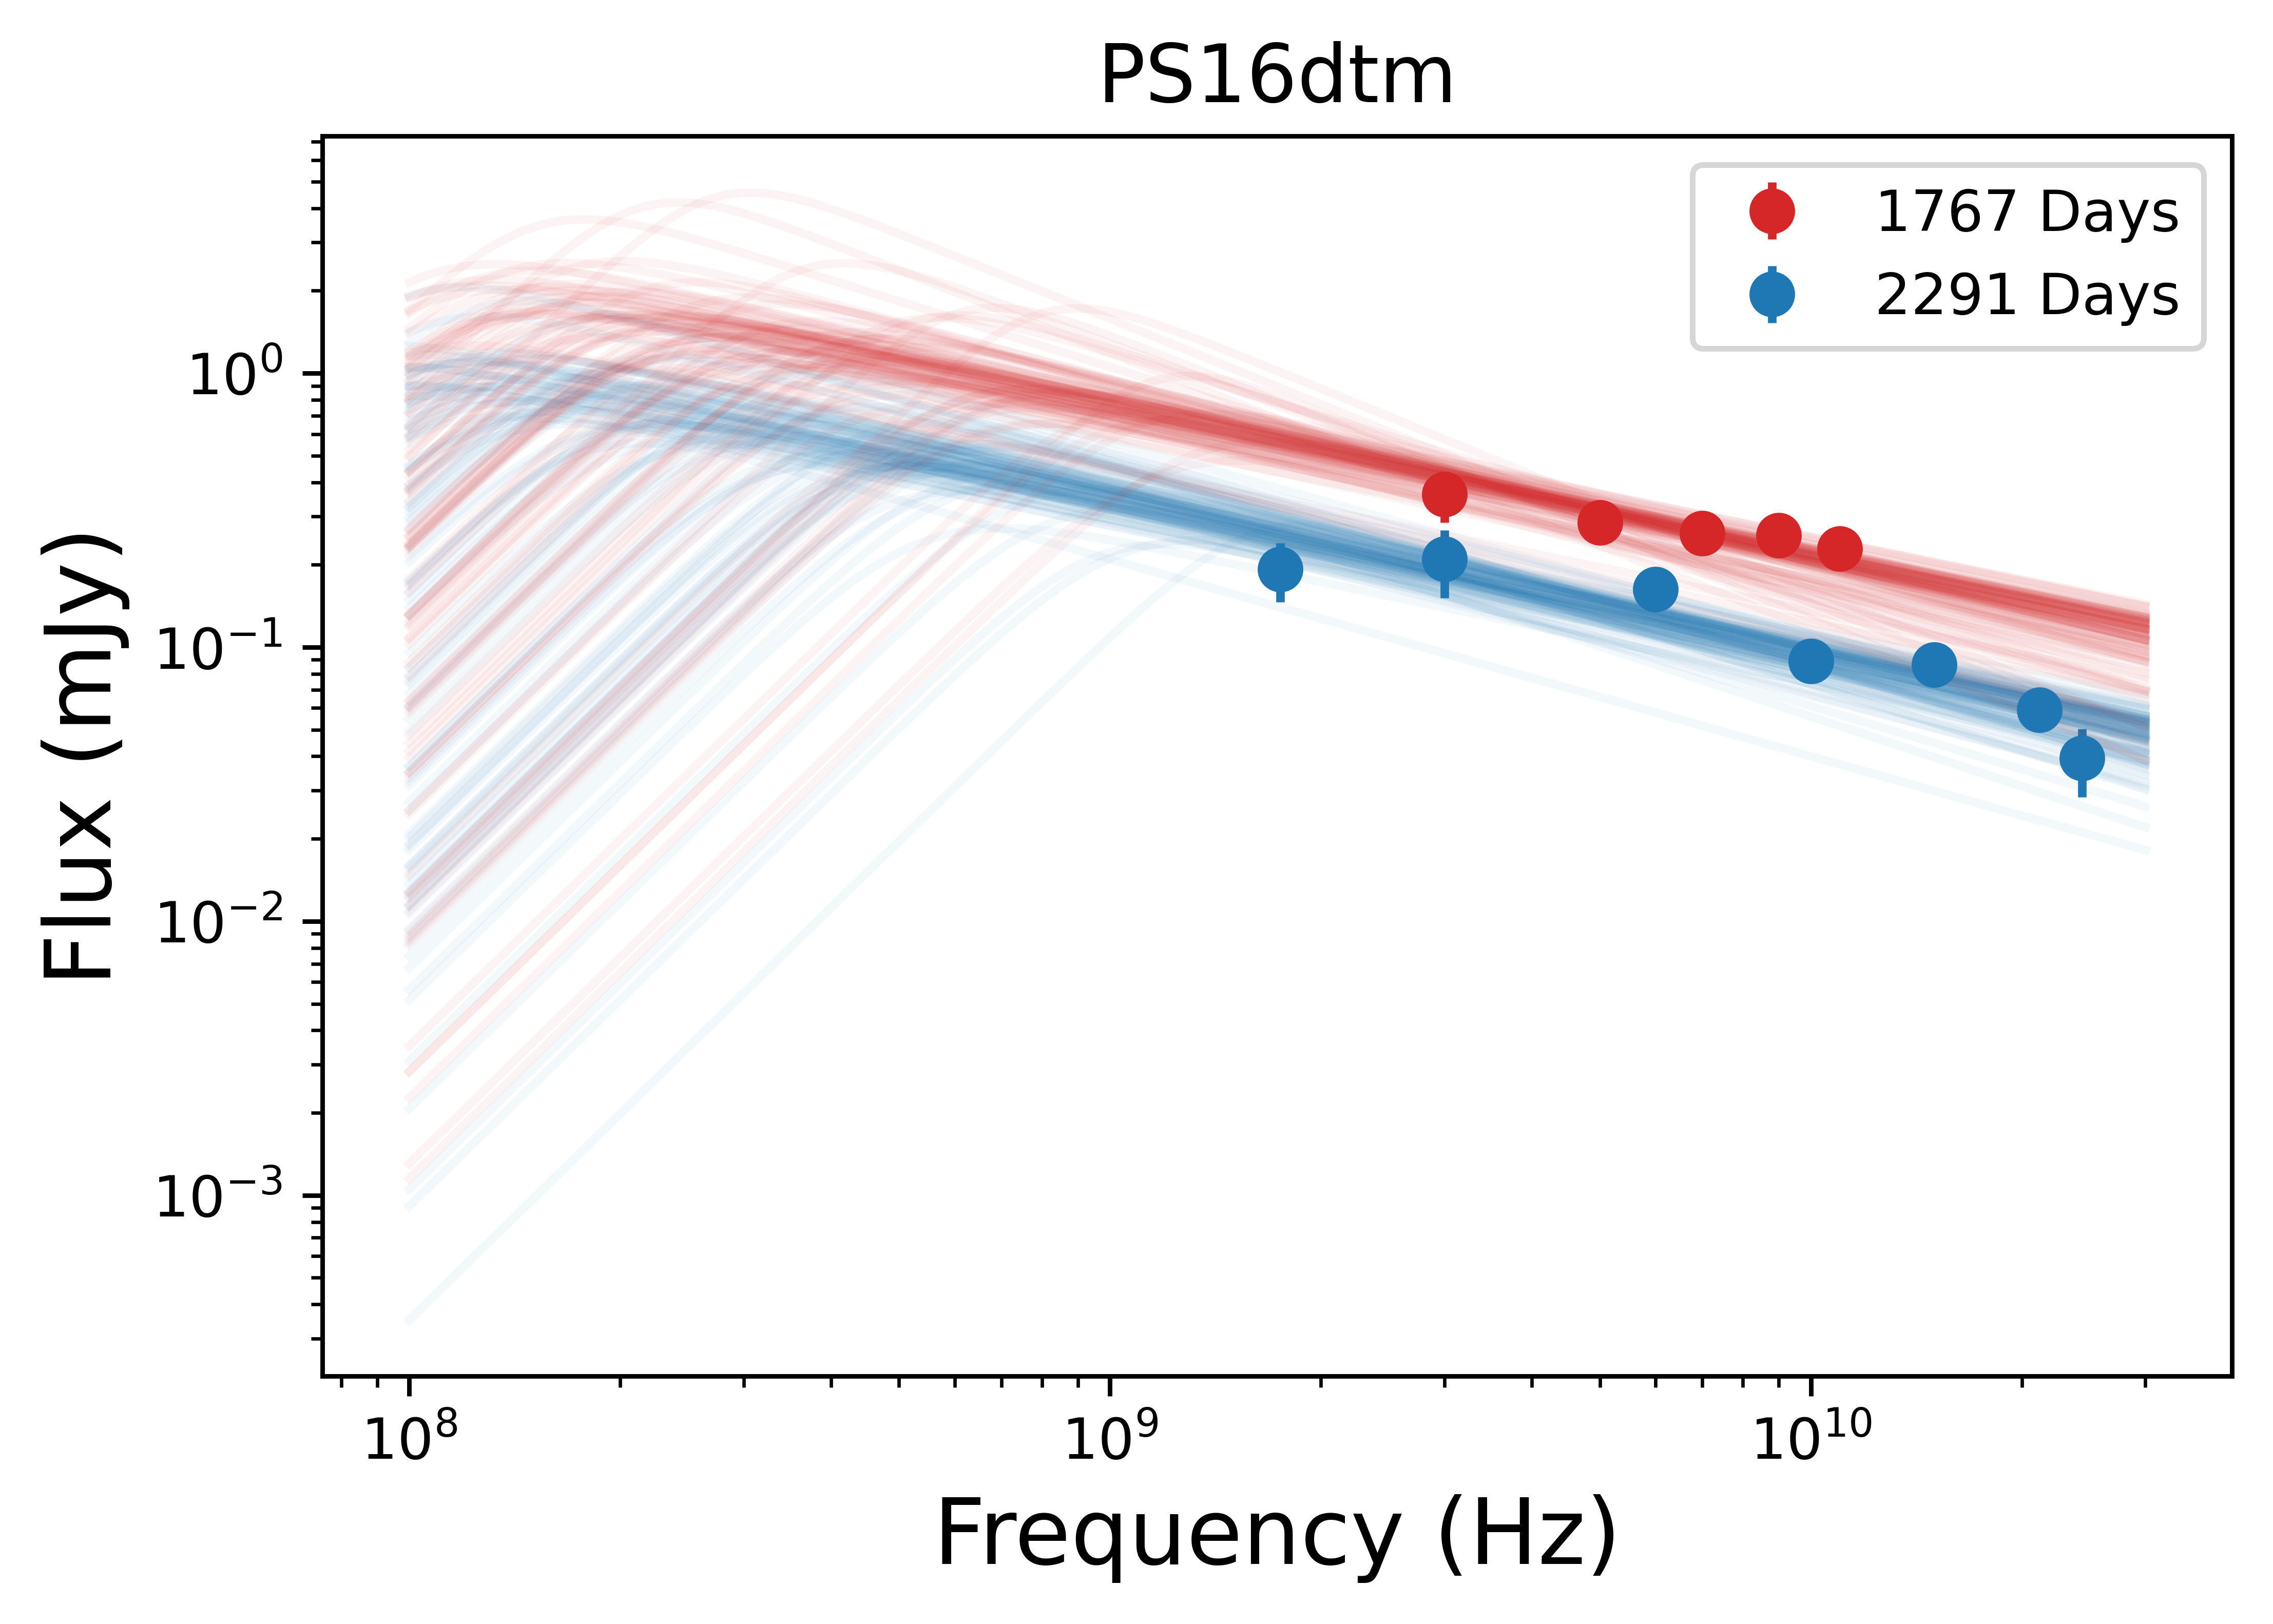
PS16dtm was optically discovered on 2016 August 12 at a redshift of (Blanchard et al., 2017; Jiang et al., 2017; Petrushevska et al., 2023). Four radio observations in the first resulted in non-detections, with the first non-detection at 54 days and the latest non-detection at 372 days, when it was mJy at 6 GHz (Blanchard et al., 2017). It should be noted that PS16dtm had a pre-existing AGN; however with several non-detections in radio it is expected that the AGN contribution to radio emission was minimal (Blanchard et al., 2017). We first detected PS16dtm at 1391 days with mJy at 6 GHz ( erg s-1). The light curve rose to a peak of mJy ( erg s-1) at 1767 days, and faded to mJy ( erg s-1) by 2291 days.
-
•
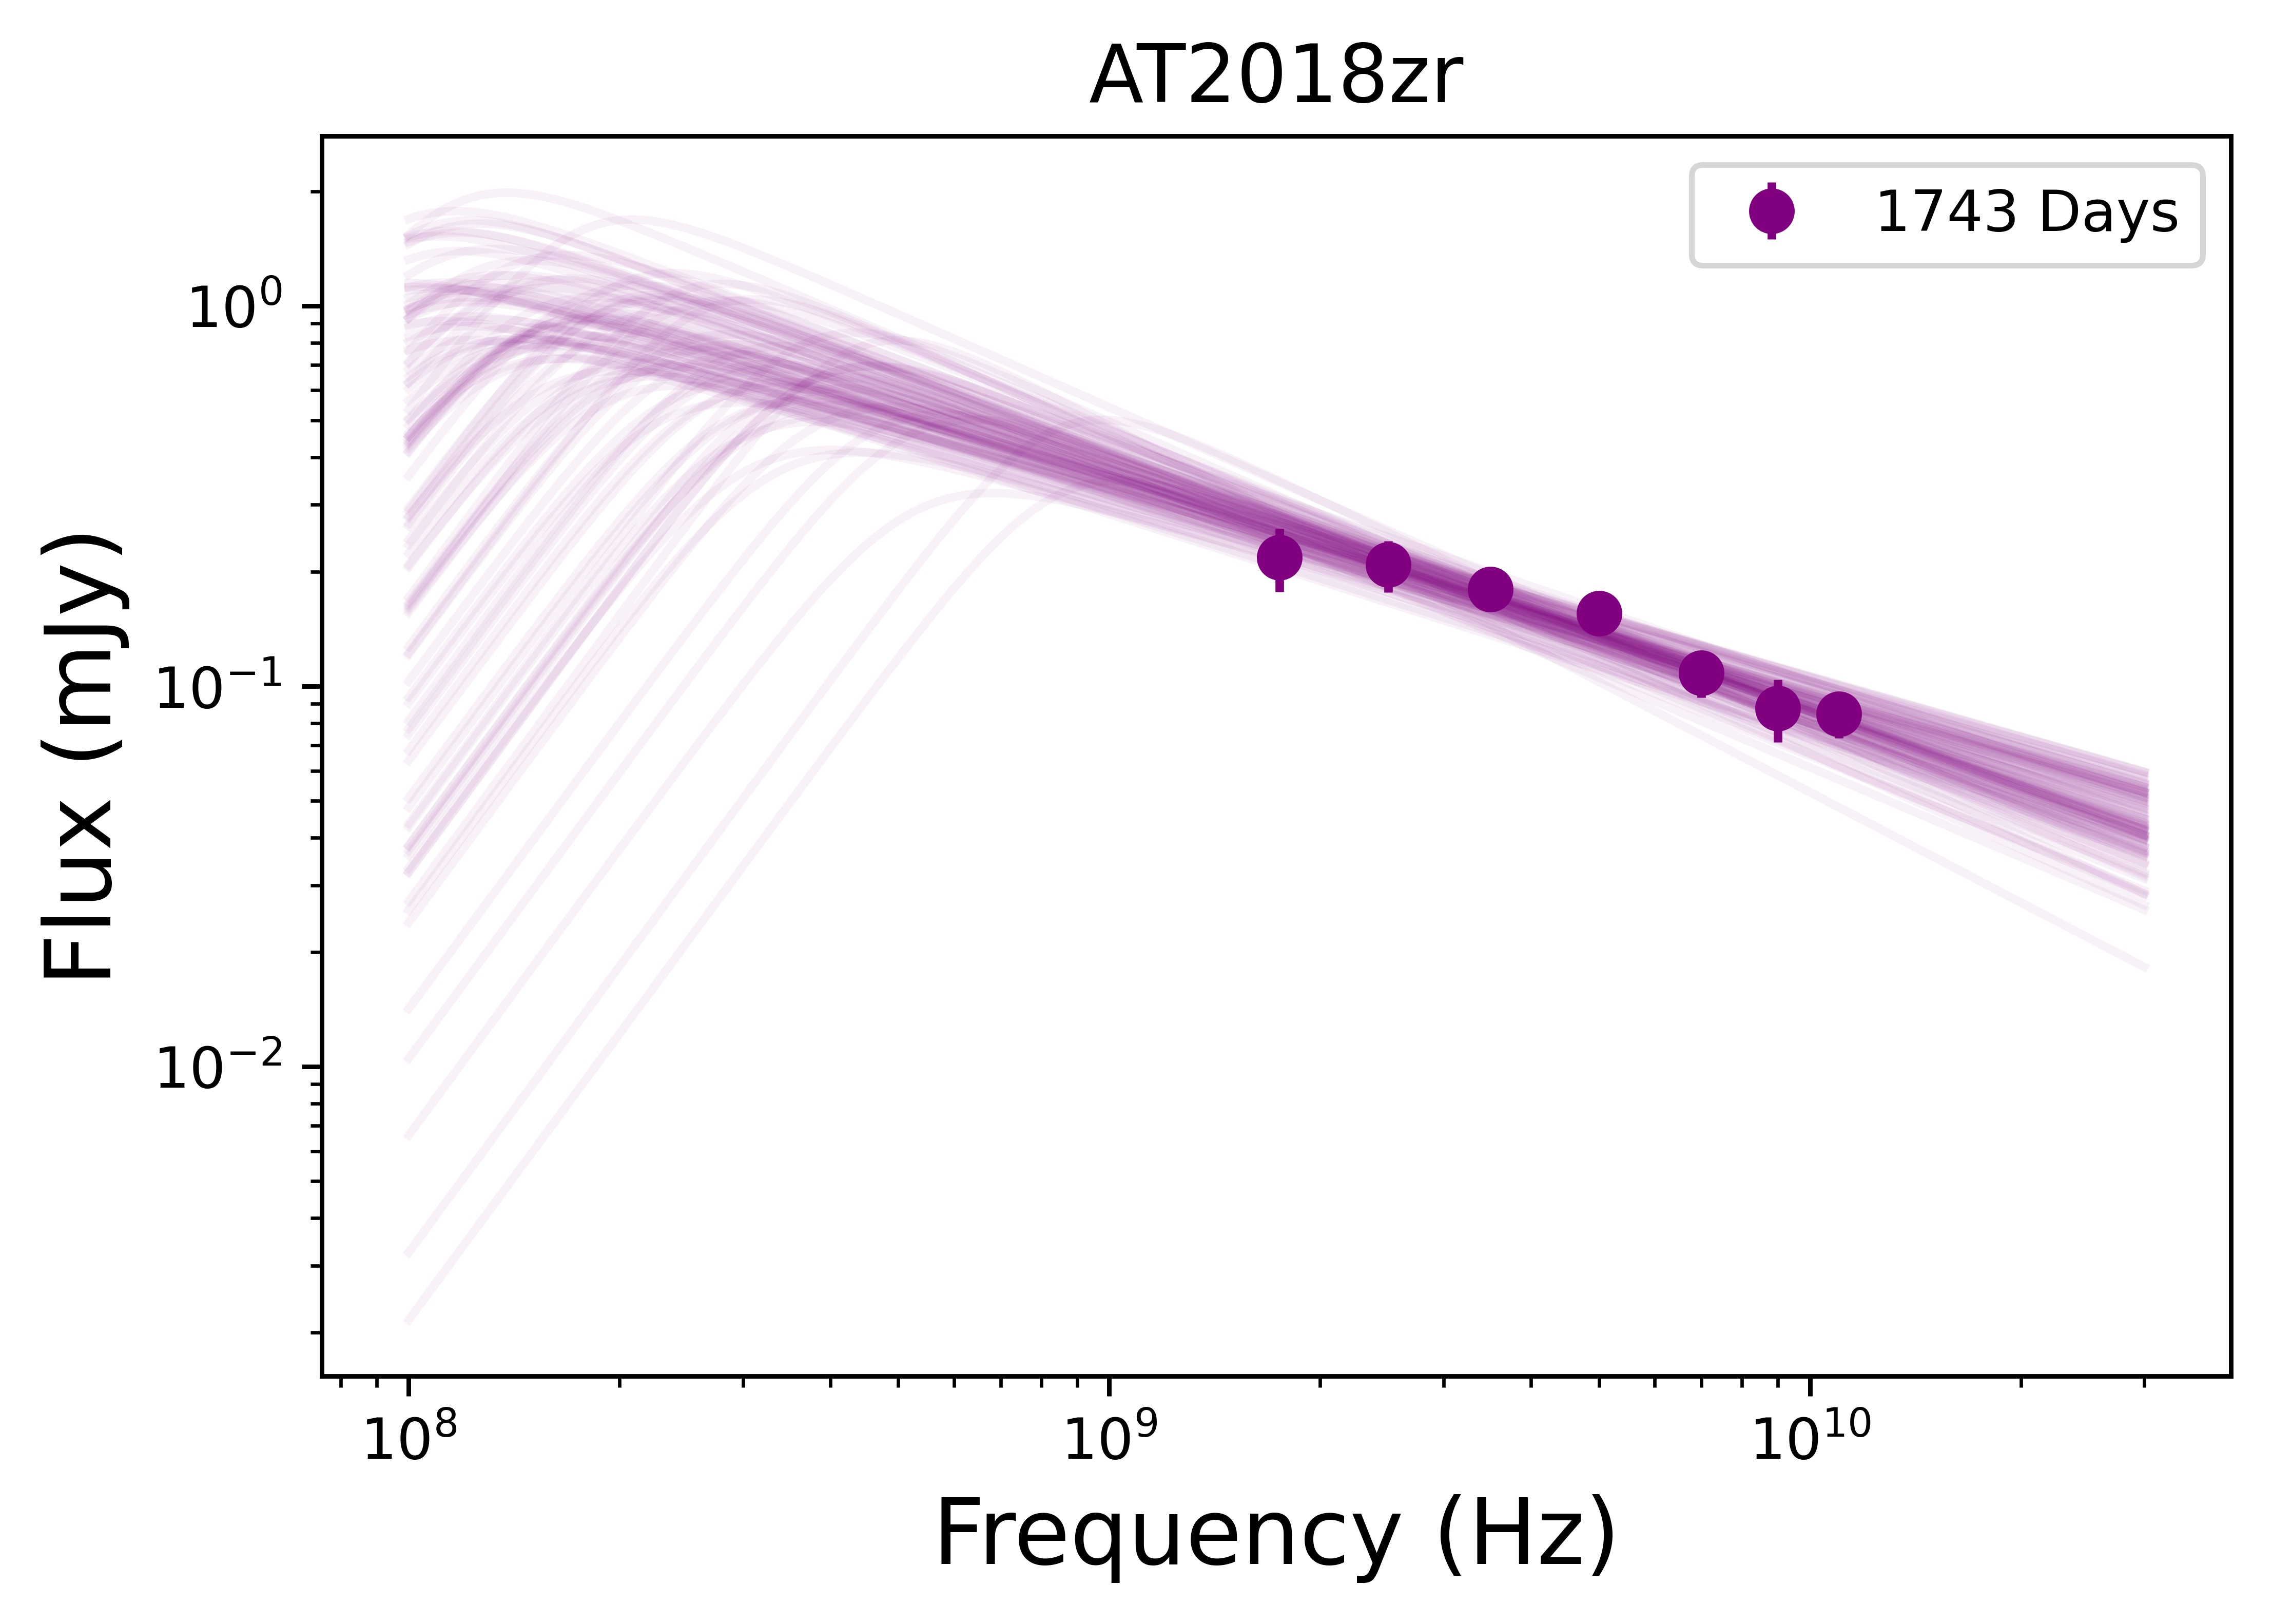
AT2018zr (also known as PS18kh) was discovered optically on 2018 March 2 at (Hung et al., 2019). Initial observations with the Arcminute Microkelvin Imager (AMI) at 16 GHz and the VLA at 10 GHz at days yielded no detections (van Velzen et al., 2019); observations from our program at 929 and 1218 days at 6 GHz yielded upper limits of and mJy, respectively. The source was then detected at 1713 days, with mJy at 6 GHz, and had risen to mJy 30 days later. This corresponds to a rise in luminosity of from the last upper limit ( erg s-1 to erg s-1), corresponding to a power law index of . The TDE was at peak luminosity in our last observation, and future observations will allow us to determine the evolution of this TDE.
-
•
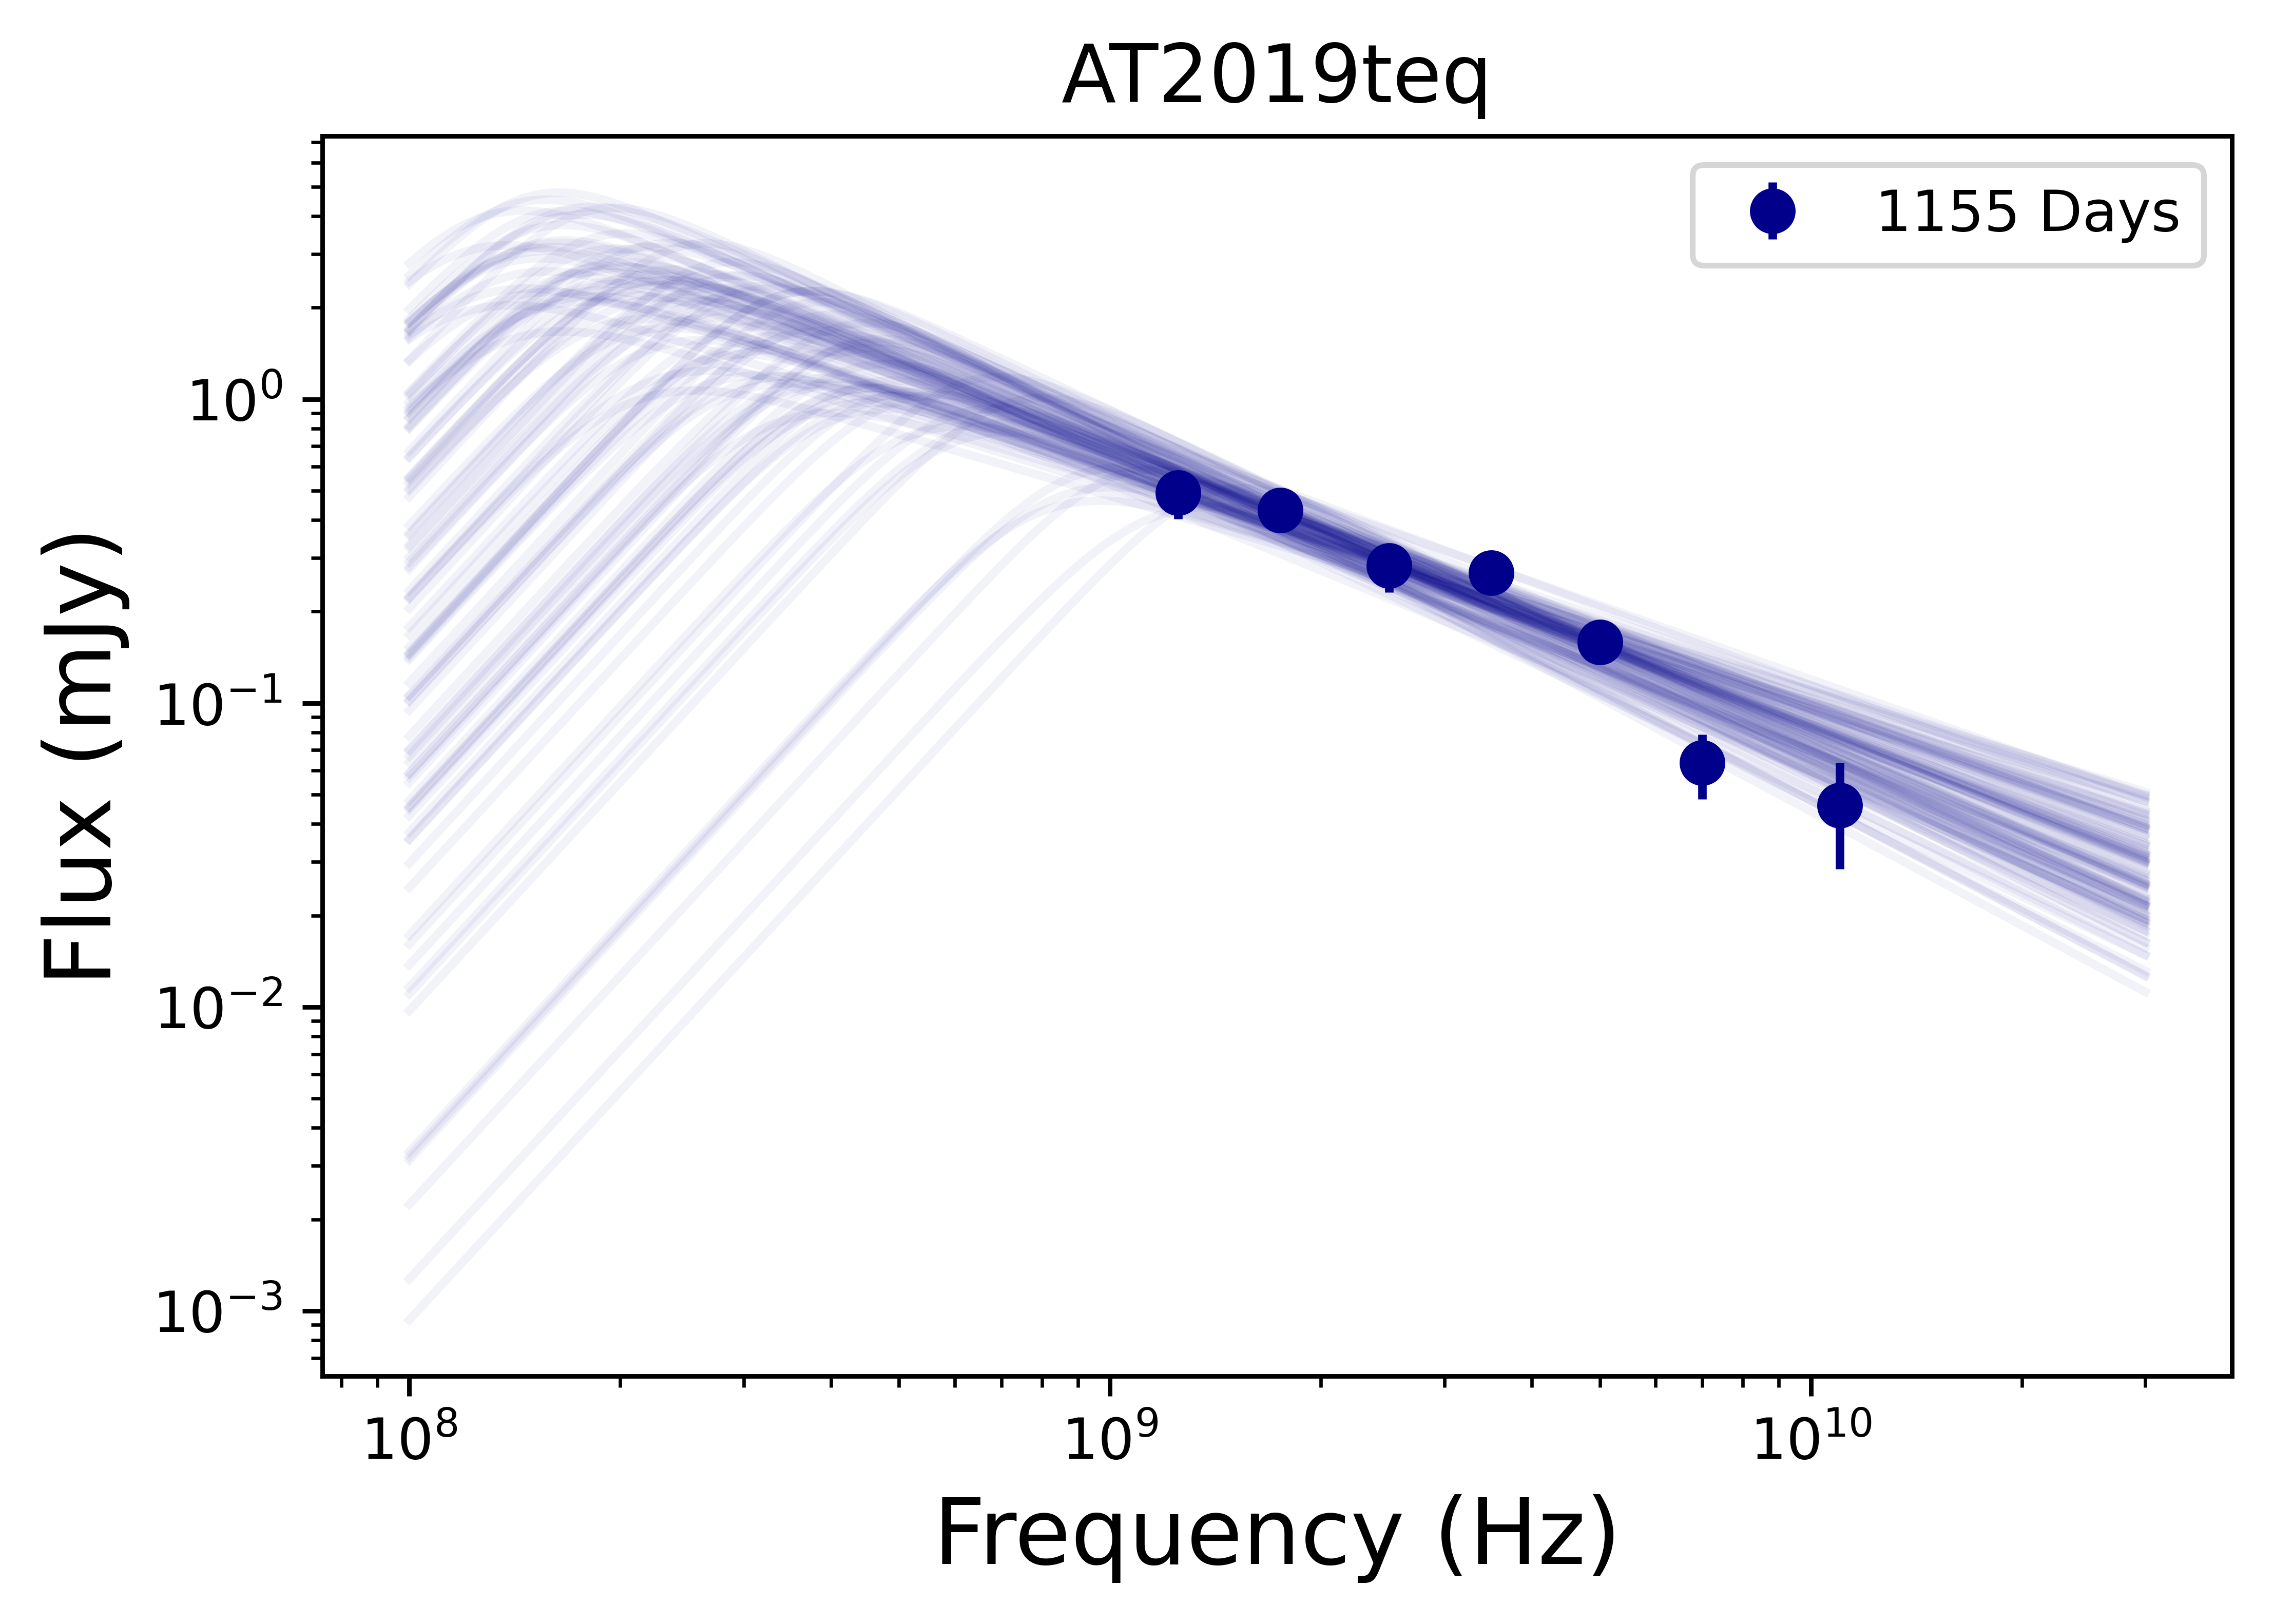
AT2019teq was optically discovered on 2019 October 20 at (Hammerstein et al., 2022). Yao & Guolo (2022) reported an X-ray brightening and hardening of this TDE on 2022 September 8 (1050 days), which was confirmed by NICER observations on 2022 October 18-21 (1100 days). No prior radio observations of AT2019teq exist except for a VLASS observation at 351 days with an upper limit of mJy at 3 GHz. Our VLA observation at 1096 days at 6 GHz resulted in a detection with mJy (Cendes et al., 2022a), and the emission subsequently faded at 1155 days to mJy. Given the decline between our two observations, and the earlier non-detection, we conclude that the radio emission peaked at days; the lower limit on the peak radio luminosity is erg s-1.
-
•
AT2018dyb (ASASSN-18pg) was optically discovered on 2018 July 11, at (Holoien et al., 2020; Leloudas et al., 2019). Radio observations at 26 days led to an upper limit of mJy at 19 GHz. Our first observation took place at 1028 days and led to a detection with mJy at 1.3 GHz. The emission then dramatically brightened at 1615 days to mJy ( erg s-1), corresponding to a power law index of . Future observations will allow us to determine the evolution of this TDE.
-
•
AT2018hco was optically discovered on 2018 October 4 at (van Velzen et al., 2020). Radio non-detections were obtained with AMI at 15.5 GHz at 60 days ( mJy; Horesh et al., 2018). We also identified a VLA archival observation at 62 days leading to a limit of mJy at 6 GHz (18A-373 PI: van Velzen), a VLASS observation at 213 days with mJy, and a limit of mJy at 0.88 GHz with the ASKAP VAST survey. We first detected radio emission at 982 days with mJy at 6 GHz, or a luminosity of erg s-1. The emission then fades in subsequent observations to mJy at 5 GHz at 1191 days, and we then see the source fading over time, to mJy at 5.5 GHz with ATCA on 1311 days ( erg s-1). We note the dip in luminosity at 1106 days is due to the use of VLASS observation at 3 GHz compared to 6 GHz for the other data points. The decline in luminosity from the first to the last detection has a power law index of . We estimate that the light curve peak occurred at d.
-
•
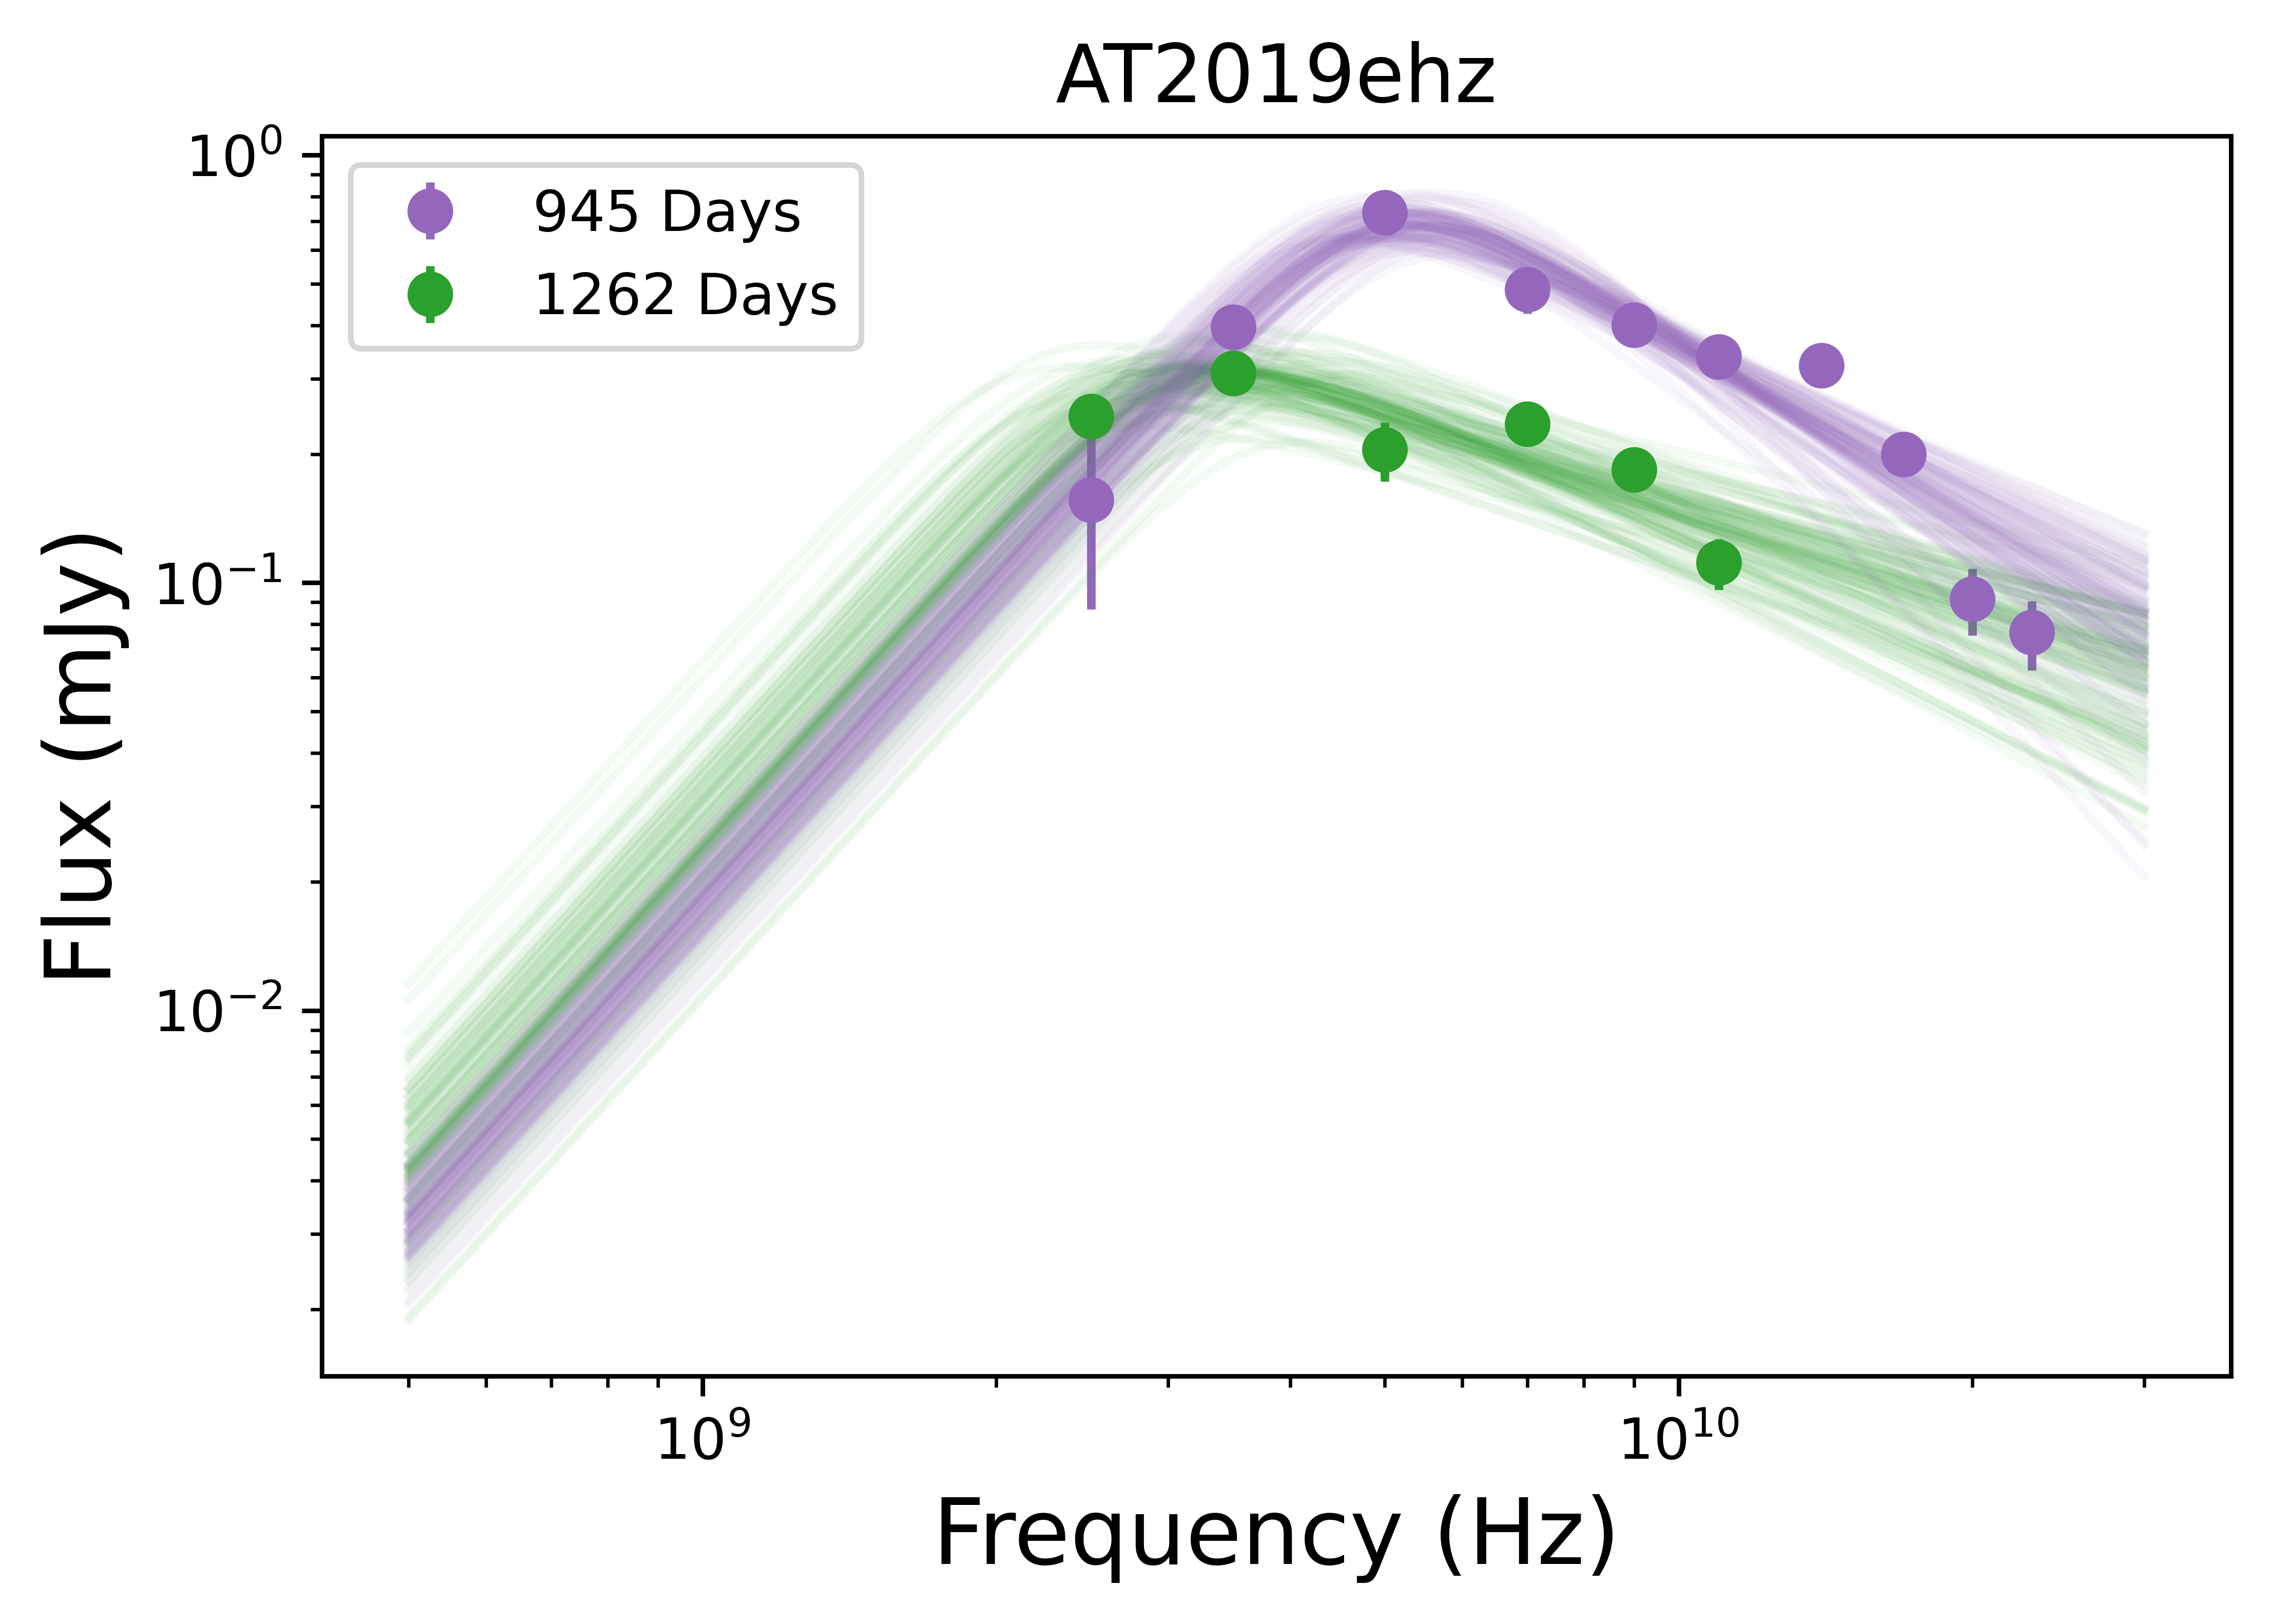
AT2019ehz was optically discovered on 2019 April 29 at (van Velzen et al., 2021). We obtained early limits from unpublished archival VLA data at 23 and 47 days (19A-395; PI: van Velzen) with resulting limits of and mJy, respectively, at 9 GHz. There is also a VLASS non-detection at 126 days with mJy. We first detected radio emission at 775 days, with mJy at 6 GHz, or a luminosity of erg s-1. The emission subsequently faded in observations at 970 and 1262 days, to mJy, corresponding to a power law decline of . Since the emission is declining and the last upper limit before detection is at 126 days, we conclude that the light peak occurred at days. However, we note with the inferred steep decline in luminosity, it is more likely the peak was actually much closer to the time of first detection. This could have implications for the launch of the outflow; for example, if the time of the delayed launch was at days the power law index would be about -1. We discuss this further in Section 4.3.
-
•
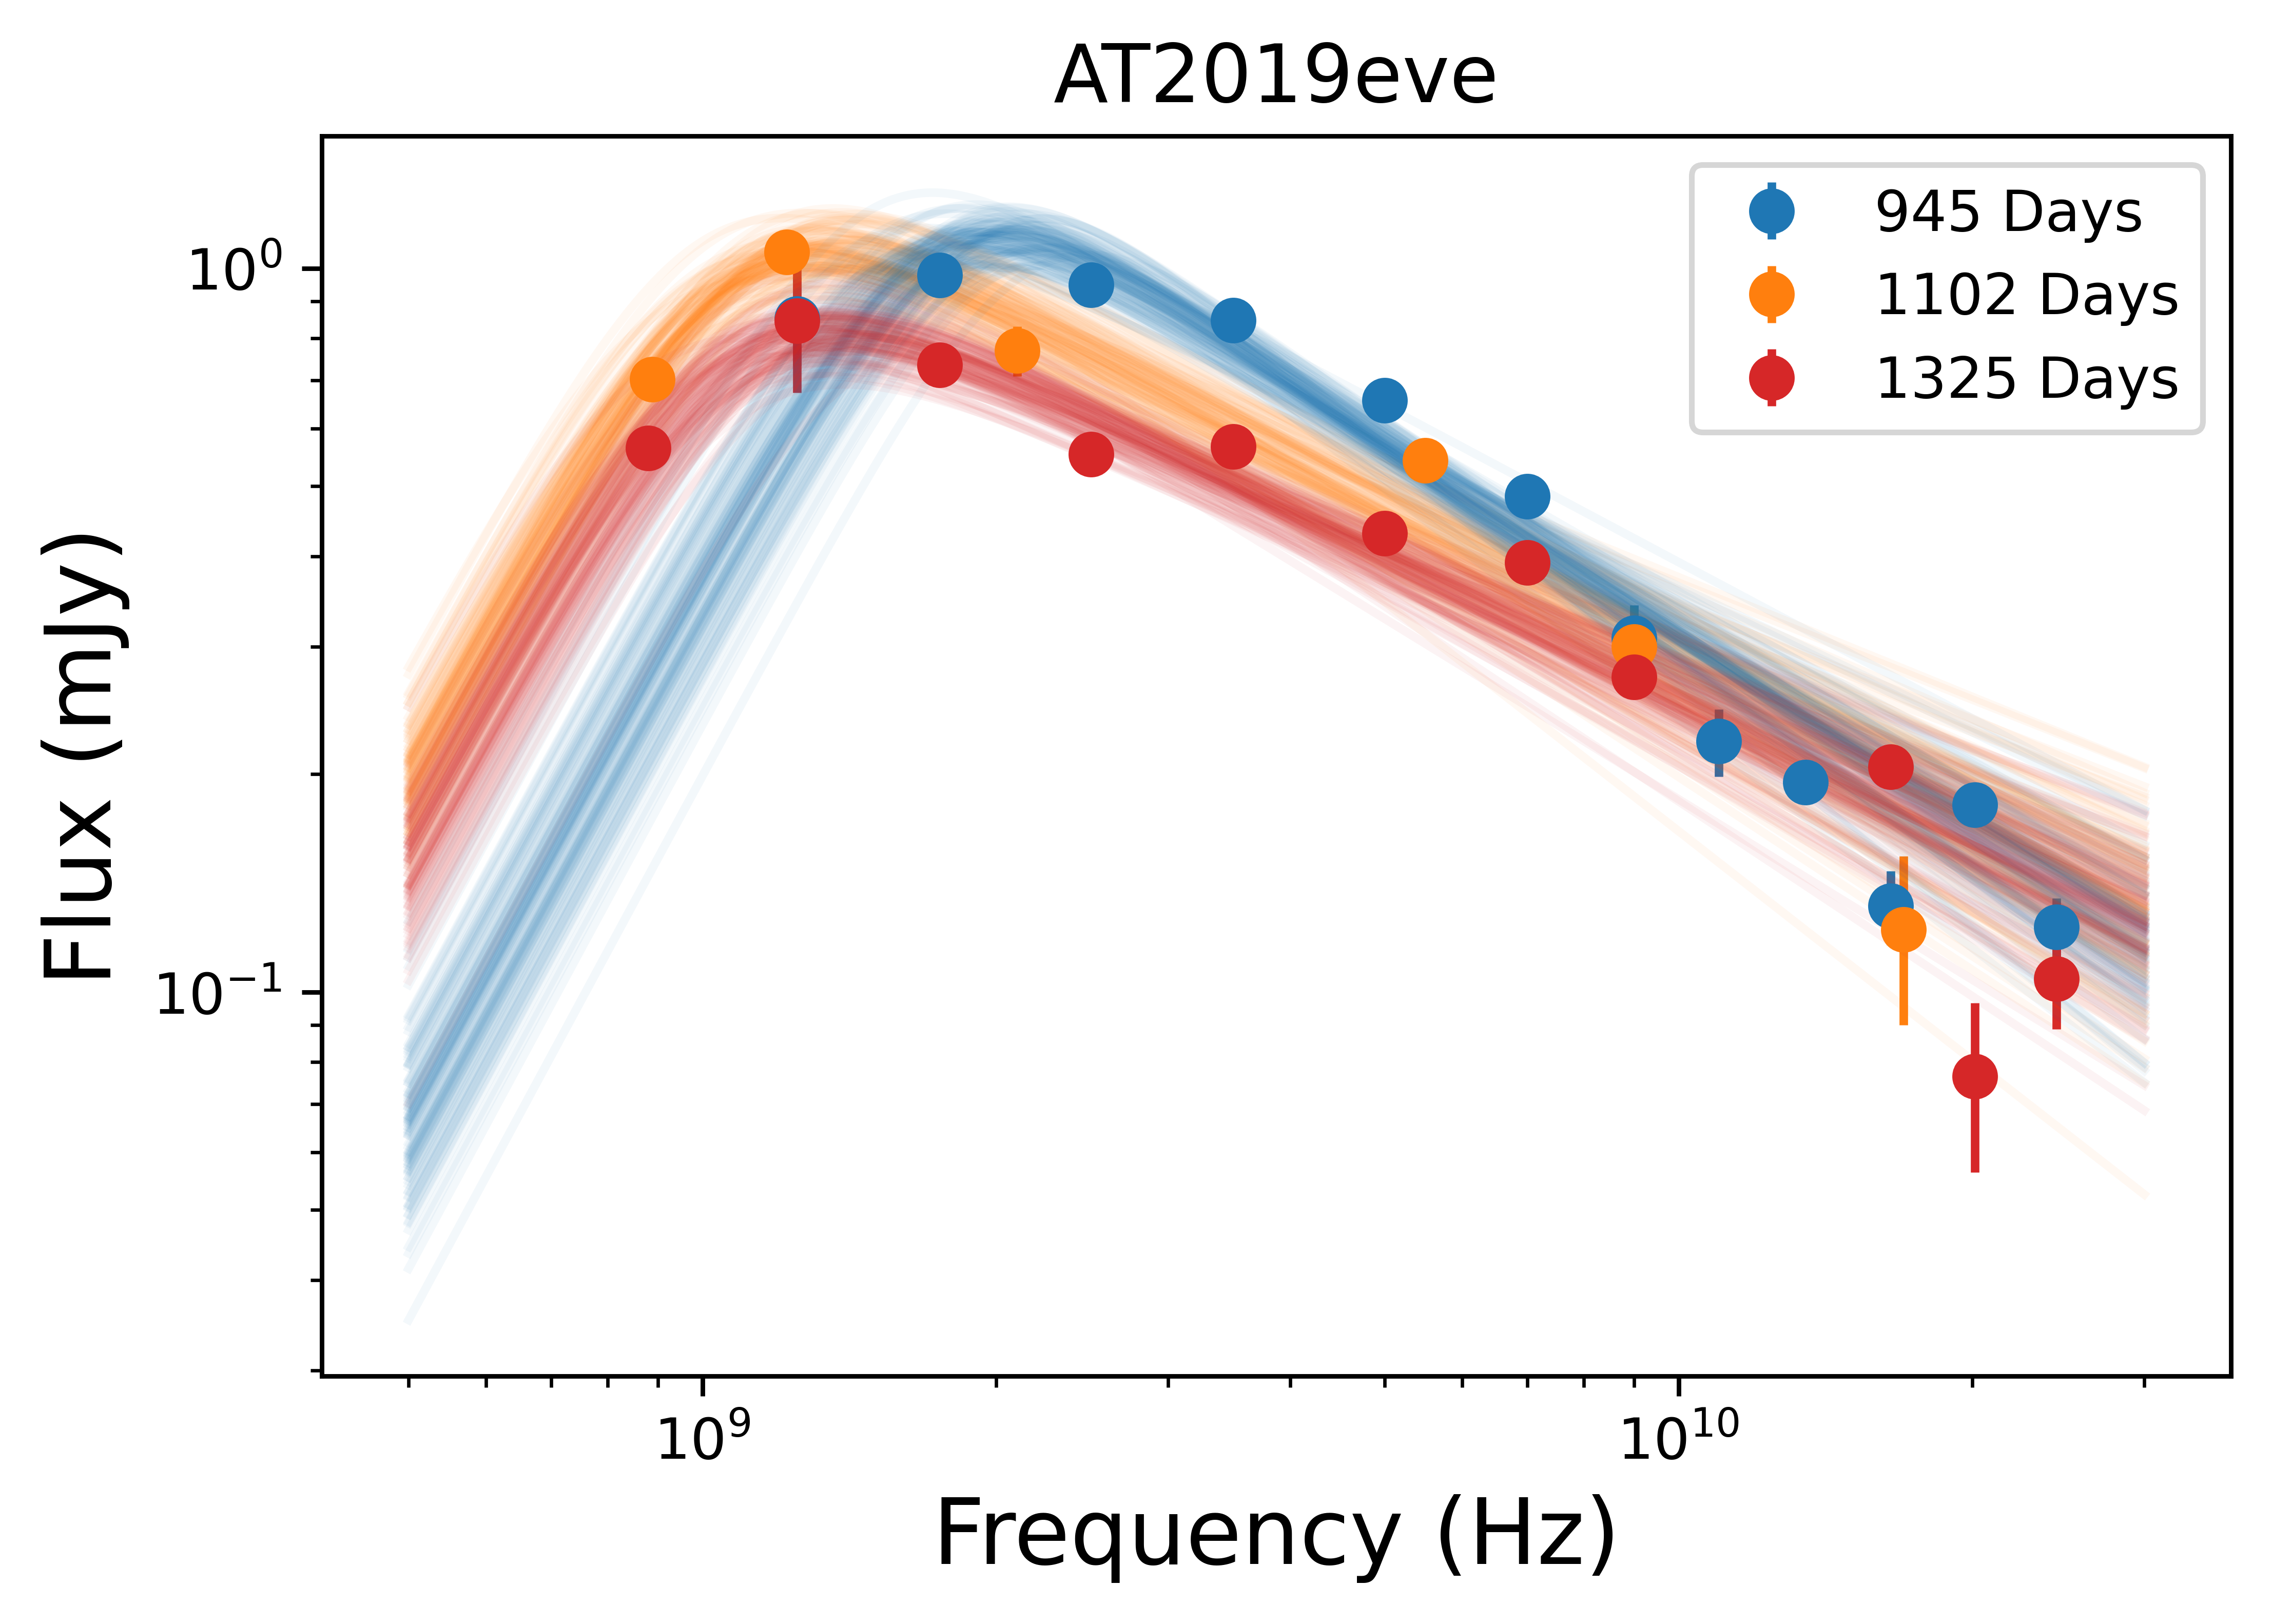
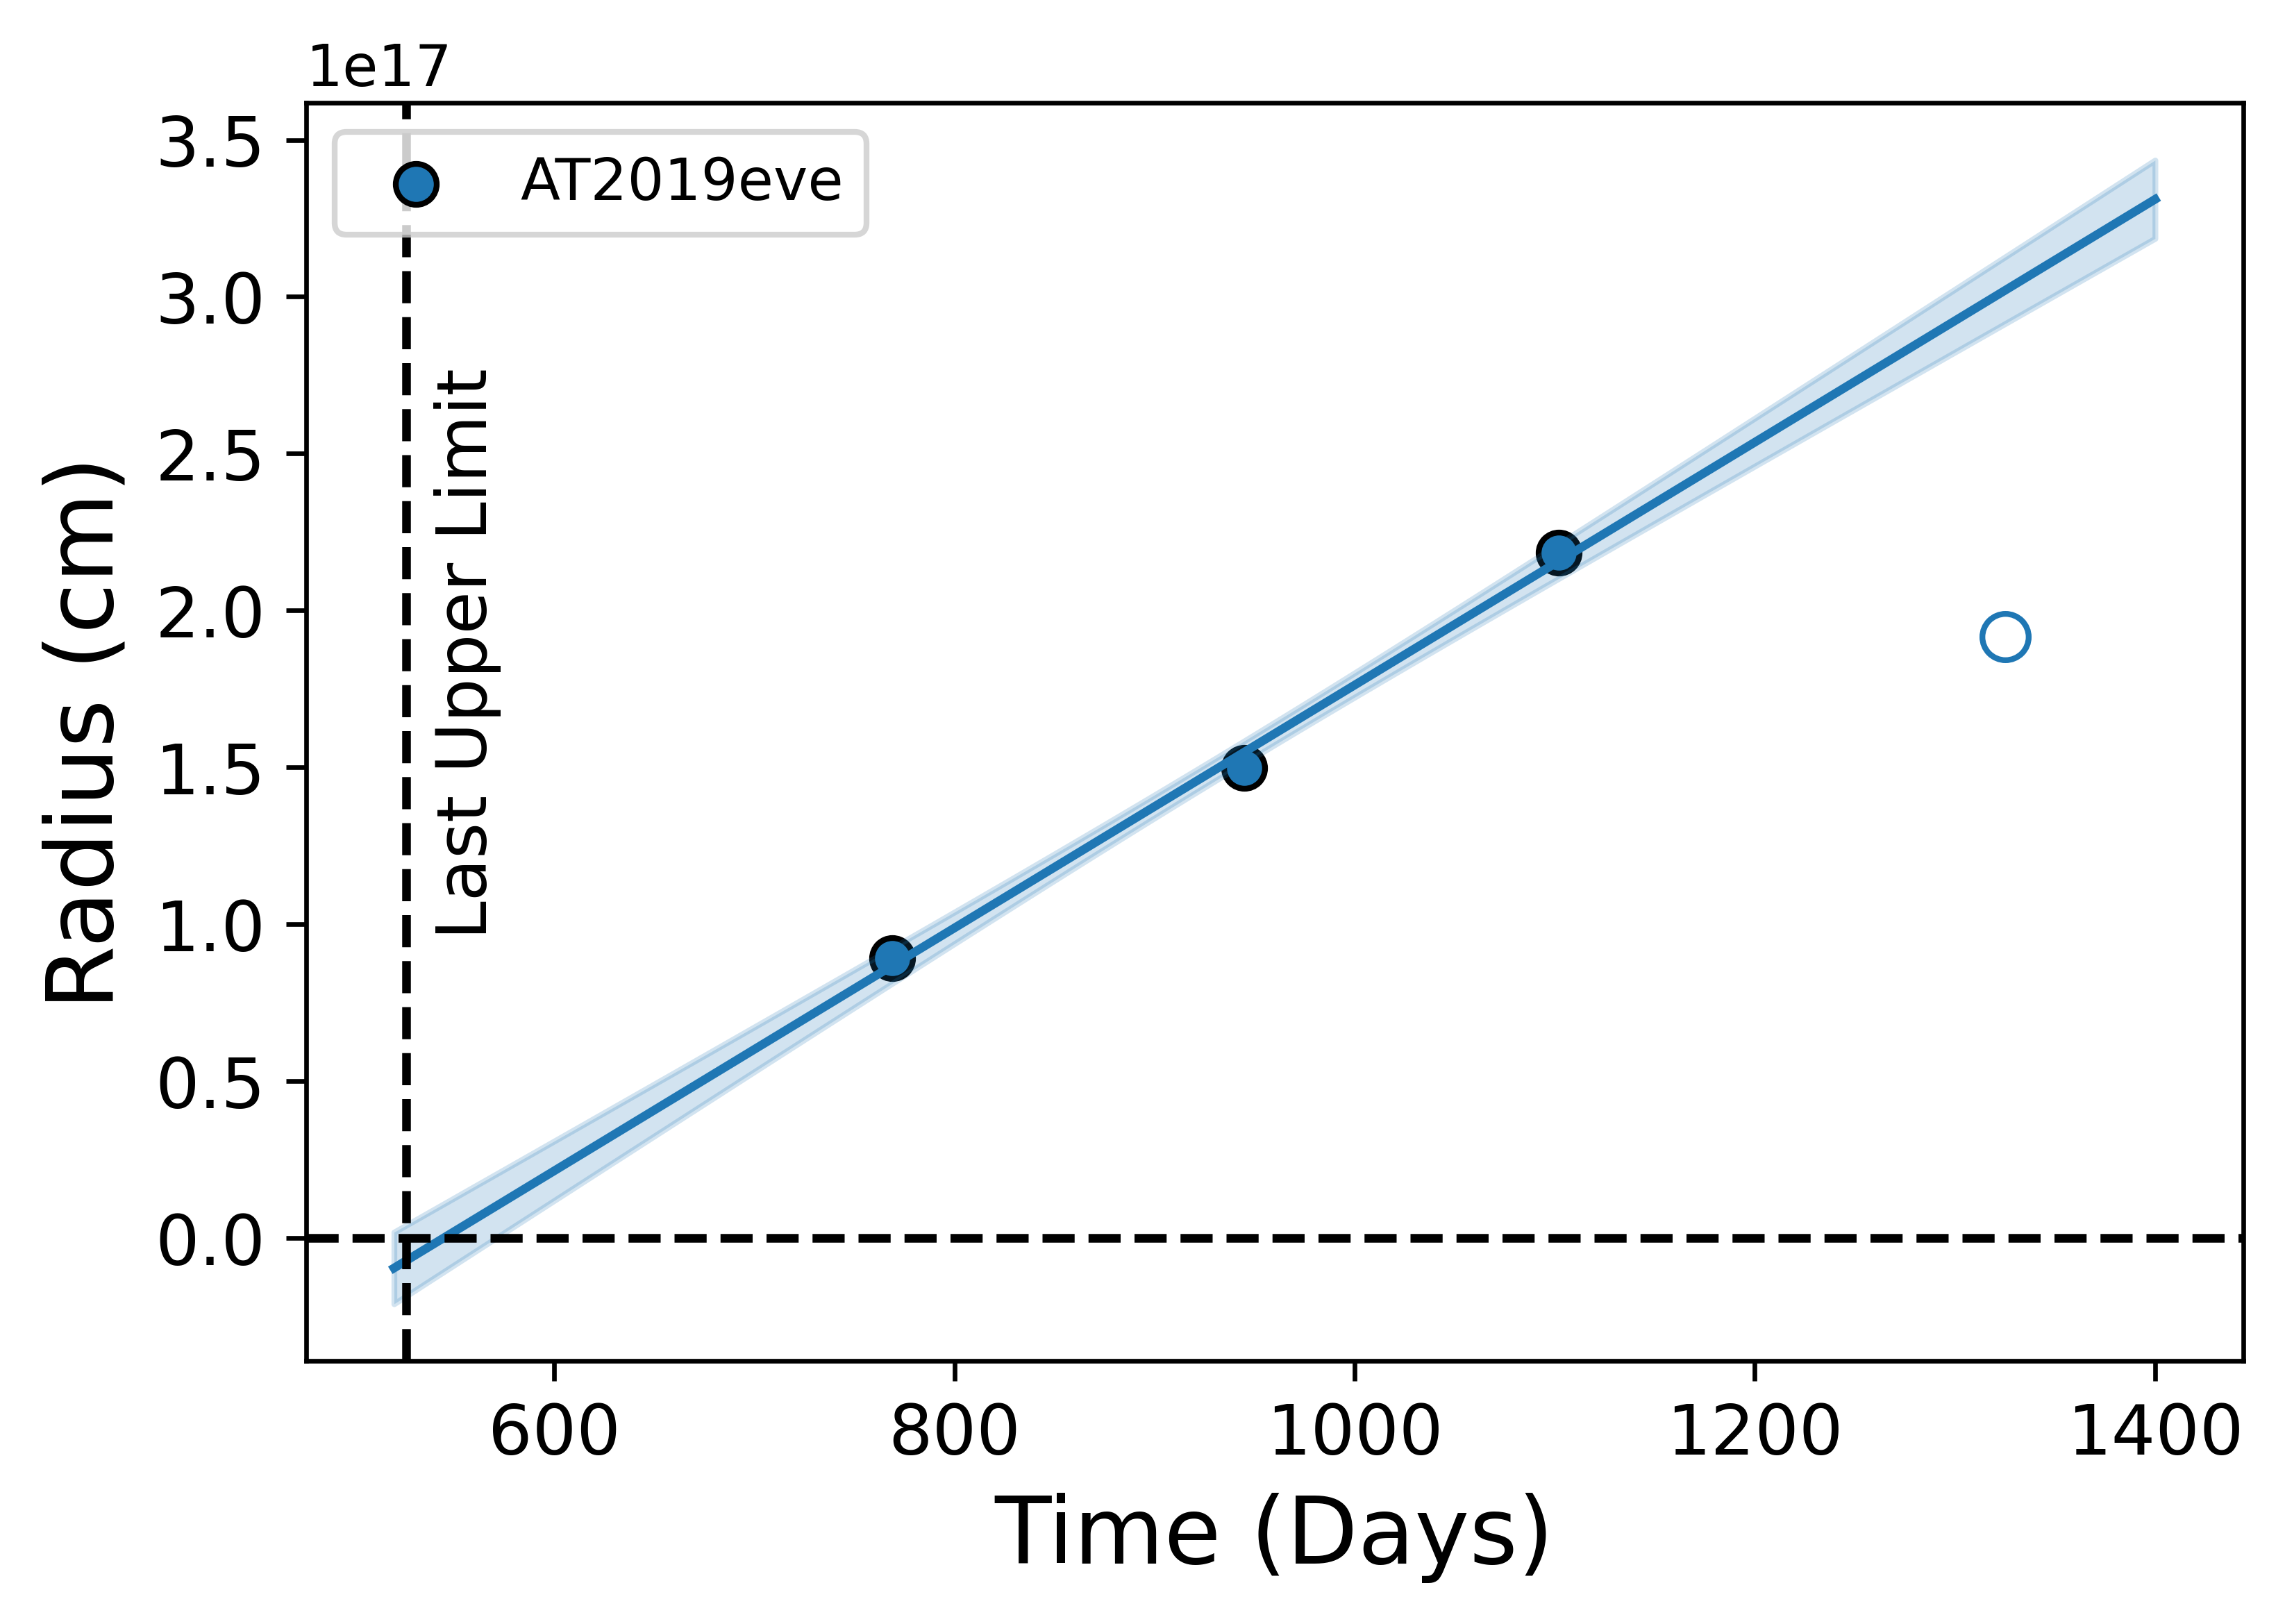
AT2019eve was optically discovered on 2019 May 5 at (van Velzen et al., 2021). A VLASS observation at 526 days yielded a non-detection of mJy. We detected this source at 769 days with mJy at 6 GHz, or a luminosity of erg s-1. Subsequent observations to days indicate steady fading to a final flux density of mJy. The power law index for the rise is , while for the decline it is . The light curve peak occurred at days.
-
•
AT2020neh was optically detected on 2020 June 19 at (Angus et al., 2022). Radio observations at 12 and 196 days led to non-detections with mJy and mJy, respectively, at 15 GHz (Angus et al., 2022). Our first detection is at 874 days with mJy at 6 GHz, followed about 30 days later by a rise to ( erg s-1), or . Despite the apparent rapid rise, the faintness of the emission precluded multi-frequency observations. Future observations will allow us to determine the evolution of this TDE.
3.1.2 TDEs with Previously-Known Radio Emission
We identify distinct late-time radio re-brightenings in two TDEs that exhibited early radio emission with fading behavior prior to our observations. Below we briefly describe the radio light curve properties of each event.
-
•
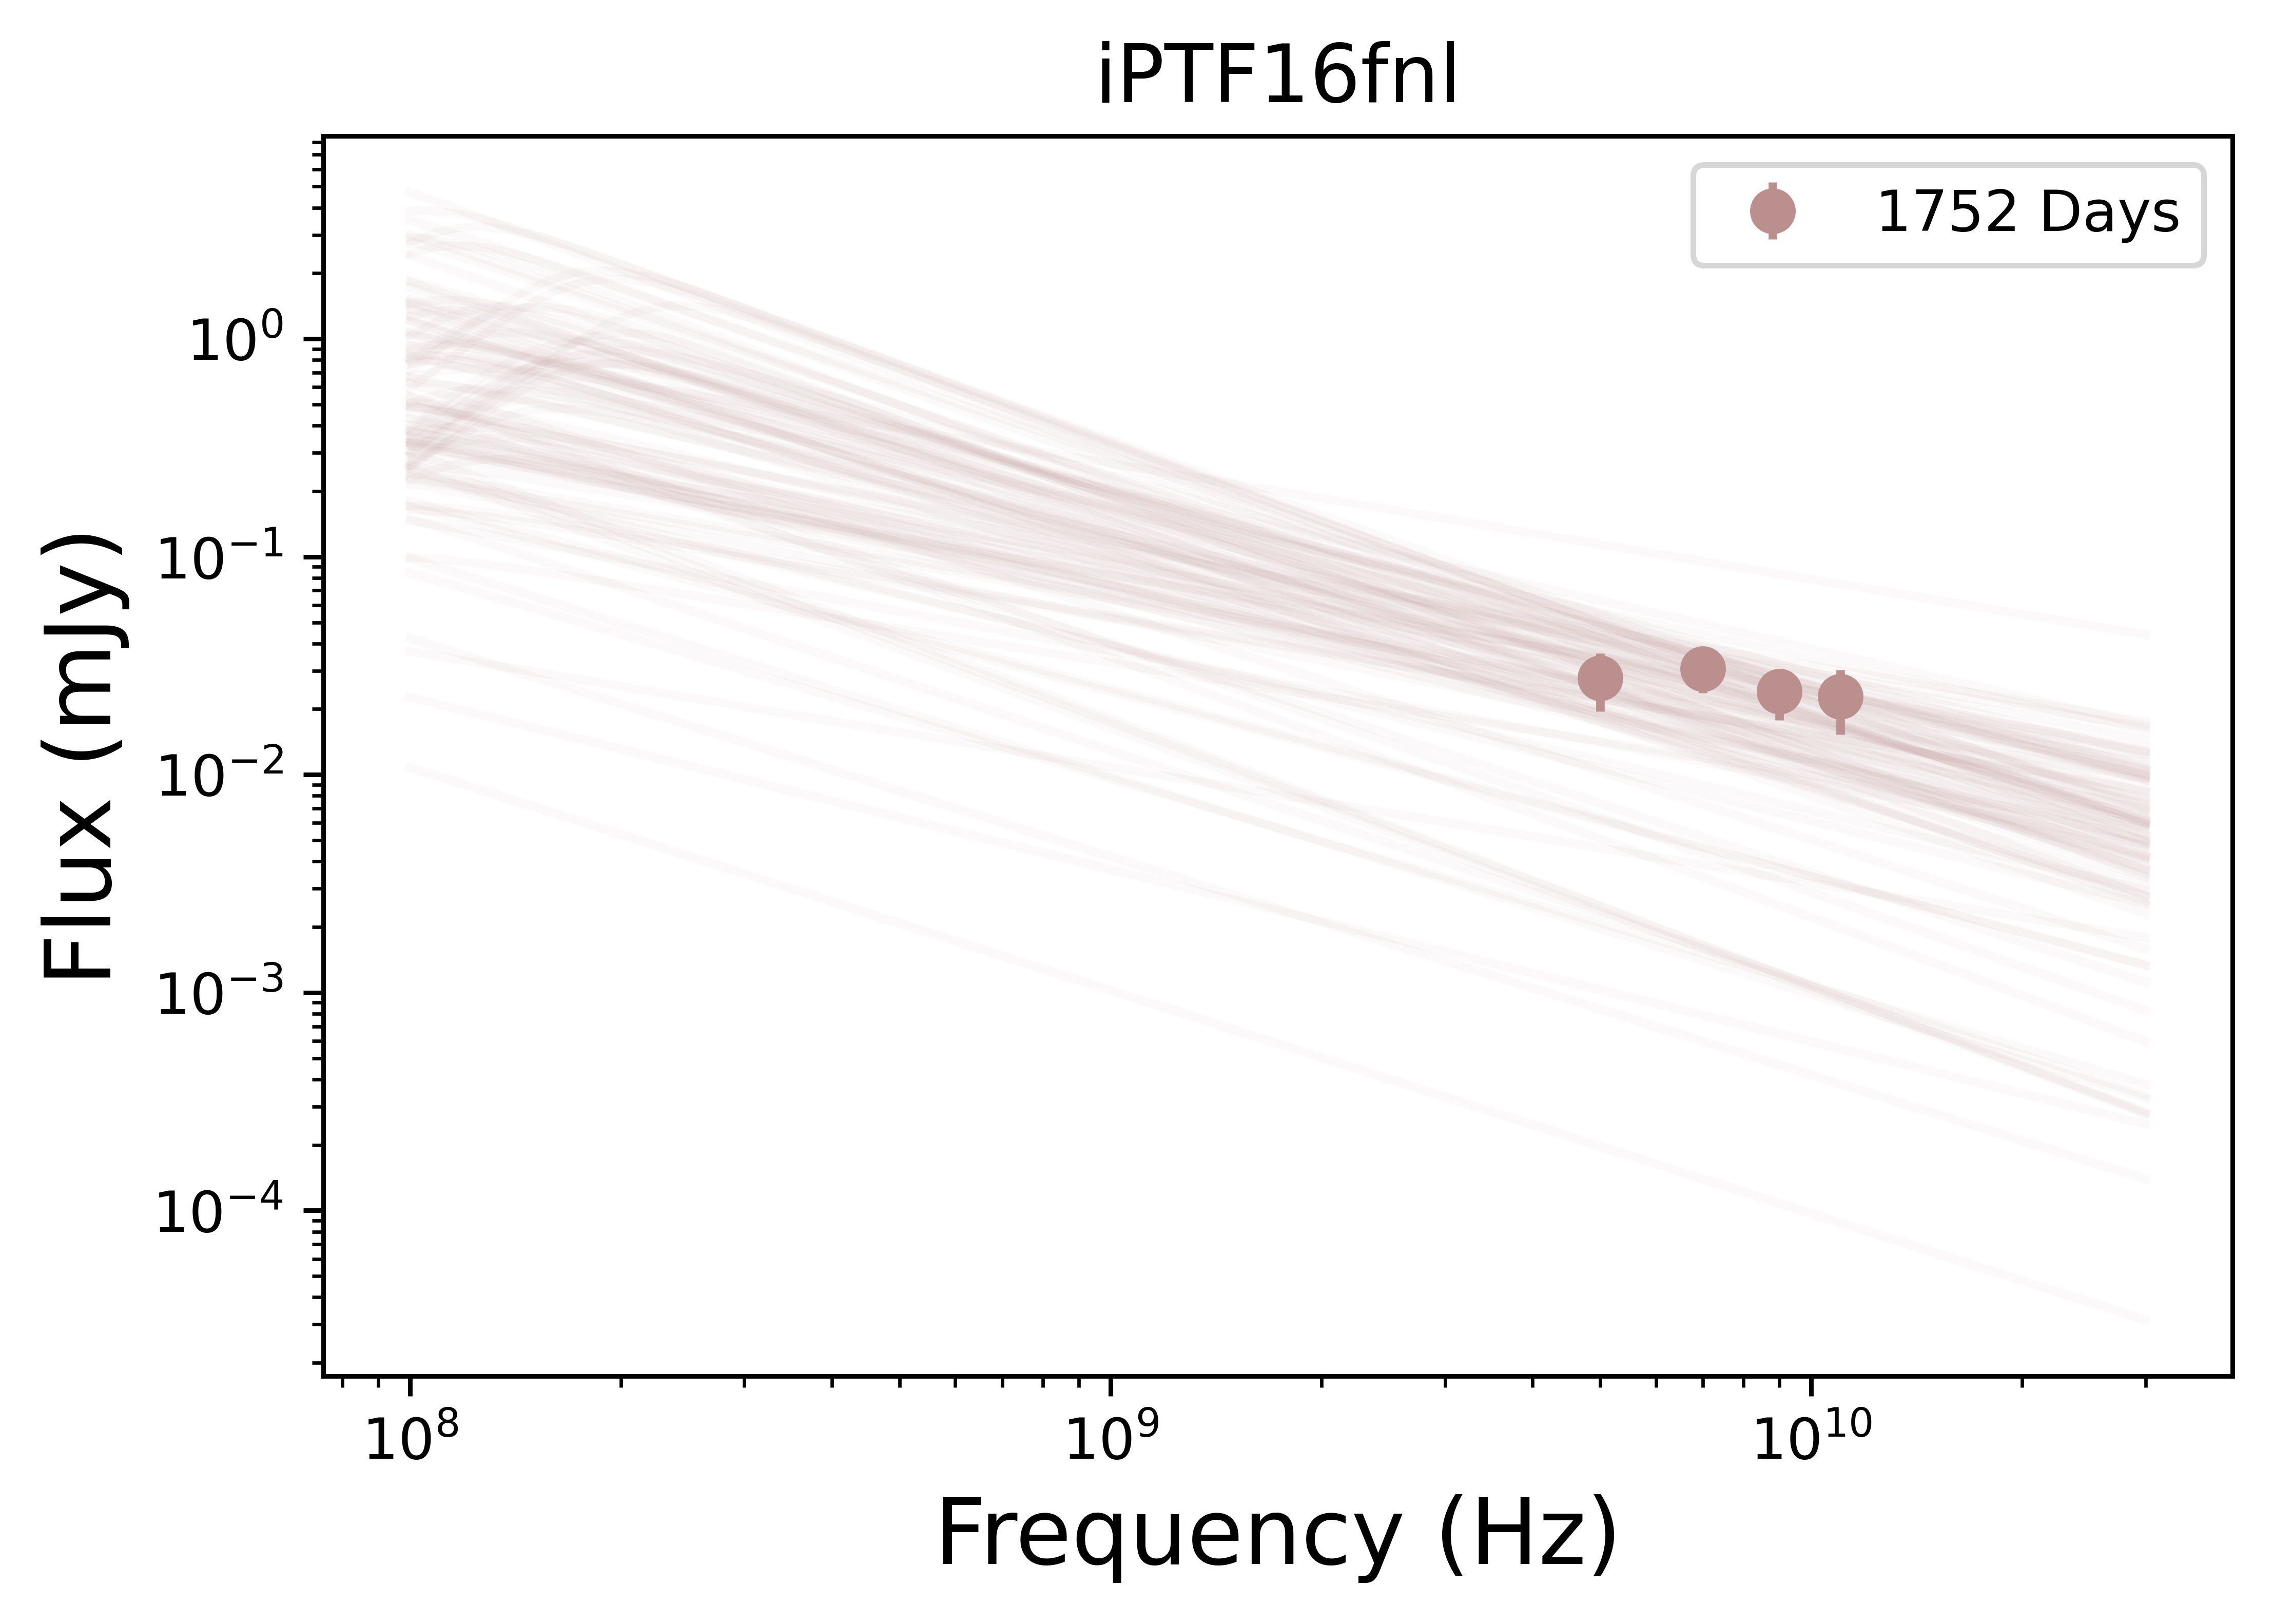
iPTF16fnl was optically discovered on 2016 August 29 at (Blagorodnova et al., 2017). There were several radio non-detections at days with mJy at 15 GHz ( erg s-1), followed by detections at 15 GHz at days, with a peak luminosity at 417 days of erg s-1 (Horesh et al., 2021b). We observed iPTF16fnl at 1345 days at 6 GHz and found that the source had faded to mJy, erg s-1. However, our subsequent observation at 1752 days reveals significant brightening to mJy at 6 GHz ( erg s-1), corresponding to a power law index of . Given the rapid increase in brightness we consider this as evidence for a separate emission component than the initial peak at days; continued observations will delineate the time evolution of this component.
-
•
AT2019dsg was optically discovered on 2019 April 9 at (van Velzen et al., 2020). Radio emission was first detected at 52 days, steadily rose to a peak at days with a luminosity of erg s-1, and then steadily declined through 560 days, to erg s-1 (Cendes et al., 2021a; Stein et al., 2021). Our new VLA observations at 796 days revealed a slight re-brightening, with erg s-1 at 6 GHz; this is about an order of magnitude brighter than expected from continued steady decline. A follow-up MeerKAT observation at 1378 days had a flux density of mJy at 1.36 GHz. Extrapolating to 6 GHz assuming the same spectral energy distribution as observed at 1170 days leads to an estimated flux density of mJy ( erg s-1), or a power law index of . A final observation on 1437 days at 1.36 GHz indicated the source had faded to mJy, extrapolated to 6 GHz as mJy ( erg s-1). Thus, we conclude that AT2019dsg has evidence for a separate emission component than its initial peak; continued observations will delineate this TDE’s time evolution.
3.1.3 TDEs with Ambiguous or Host/AGN Radio Emission
We identify radio emission in an additional 6 TDEs, but we cannot definitively ascertain its nature, due to an absence of earlier deep upper limits or a lack of significant time evolution during our observations. We exclude these sources from subsequent detailed analysis of our TDE sample and treat them in §3.2 as upper limits. Below we provide relevant information for completeness; the radio data for these TDEs are provided in Table 6.
-
•
OGLE17aaj was discovered on 2017 January 2 at (Gromadzki et al., 2019). We detect this source for the first time with MeerKAT at 1581 days at 1.6 GHz, with a flux density of mJy. We have also identified observations of this source as part of the ASKAP VAST survey at 1.42 GHz at 1224 and 1231 days, but these lead to non-constraining upper limits of mJy (). In subsequent observations with MeerKAT and ATCA at 2161 days we find that the radio emission remains fairly steady (). This, combined with the lack of a constraining upper limit at earlier times, leads us to conclude that the radio emission from OGLE17aaj is unlikely to be related to the TDE.
-
•
AT2018bsi was optically discovered on 2018 April 9 at (van Velzen et al., 2020). We first observed this source with the VLA at 1169 days at 6 GHz, and found an upper limit of mJy. A subsequent observation at 1705 days led to a significant detection at 6 GHz, with mJy. We note that VLASS observations, on May 24, 2019 and October 26, 2021 respectively, were non-constraining upper limits of mJy. However, due to the faintness of the emission, we are presently unable to obtain multi-frequency follow-up, and we therefore classify the radio emission as ambiguous until additional observations can be taken.
-
•
AT2020pj was optically discovered on 2020 January 2 at (Hammerstein et al., 2022). The first available radio observation was at 261 d from VLASS, leading to an upper limit of mJy at 3 GHz. We subsequently detected the TDE at 6 GHz on 1030 d with a flux density of mJy, and on 1078 d with mJy. Due to the initial shallow upper limit, and the marginal variability we cannot determine if the radio emission is due to the TDE. Continued monitoring will help to ascertain the nature of this emission.
-
•
AT2020mot was optically discovered on 2020 June 14 at (Liodakis et al., 2022). It was first observed at 67 days at 15 GHz, with an upper limit of mJy (Liodakis et al., 2022), but was subsequently detected at 229 days with mJy and 259 days with mJy at 6 GHz by Liodakis et al. (2022) who concluded that the emission was likely due to star formation activity in the host galaxy. We detected the source at 887 days with mJy at 6 GHz, and conclude that the variations in flux are more consistent with an AGN than star formation activity, but likely unrelated to the TDE.
-
•
AT2020nov was optically discovered on 2020 June 27 at (Frederick et al., 2020). Radio emission was first detected at 111 days at 15 GHz with a flux density of 0.2240.009 mJy (VLA program 20A-372, PI: Alexander), and the source had subsequent detections at 228 and 246 days at 6 GHz, when it was 0.3760.010 mJy and 0.3700.01 mJy, respectively. In our own program, we observed AT2020nov at d at 6 GHz and found the source to be mJy, which is consistent with a steady luminosity at earlier times. Due to a lack of variability, we conclude this emission is likely due to non-TDE related emission in the host galaxy, such as star formation.
-
•
AT2020wey was optically discovered on 2020 October 8 at (Hammerstein et al., 2023). A radio observation 22 days post-discovery had an upper limit of mJy at 15 GHz, followed by a detection at 128 days at 6 GHz of mJy (VLA program 20A-372, PI: Alexander). Our program observed this source at 6 GHz at , and yielded a non-detection of mJy. Due to the weak detection at 128 days, and a lack of follow-up detections, we cannot conclude the radio emission is due to the TDE. We will continue monitoring this TDE to ascertain the nature of this emission in the future.
3.2 The Incidence Rate and Properties of Late-Time Radio Emission
Our sample of TDEs with radio observations is the largest to date: we observed 24 optically-selected TDEs (of which AT2018hyz was the subject of a separate paper: Cendes et al. 2022b). In this paper we identify 9 new TDEs that had constraining radio upper limits at early times, and then exhibit brighter radio emission hundreds of days post optical discovery; this excludes the 6 events with radio emission that is either ambiguous in origin or unlikely to be associated with the TDE (§3.1.3), and 2 events with prior radio emission (§3.1.2). Including AT2018hyz, this corresponds to a high detection fraction of or . Alternatively, if we count distinct late-time brightenings in AT2019dsg and iPTF16fnl we obtain a detection fraction of or . Thus, regardless of the exact accounting we conclude that about half of all optically-selected TDEs exhibit radio emission that rises on timescales of hundreds of days. This high fraction is particularly striking when compared to the published statistics of early radio detections of optically-selected TDEs ( days) of (Alexander et al., 2020).
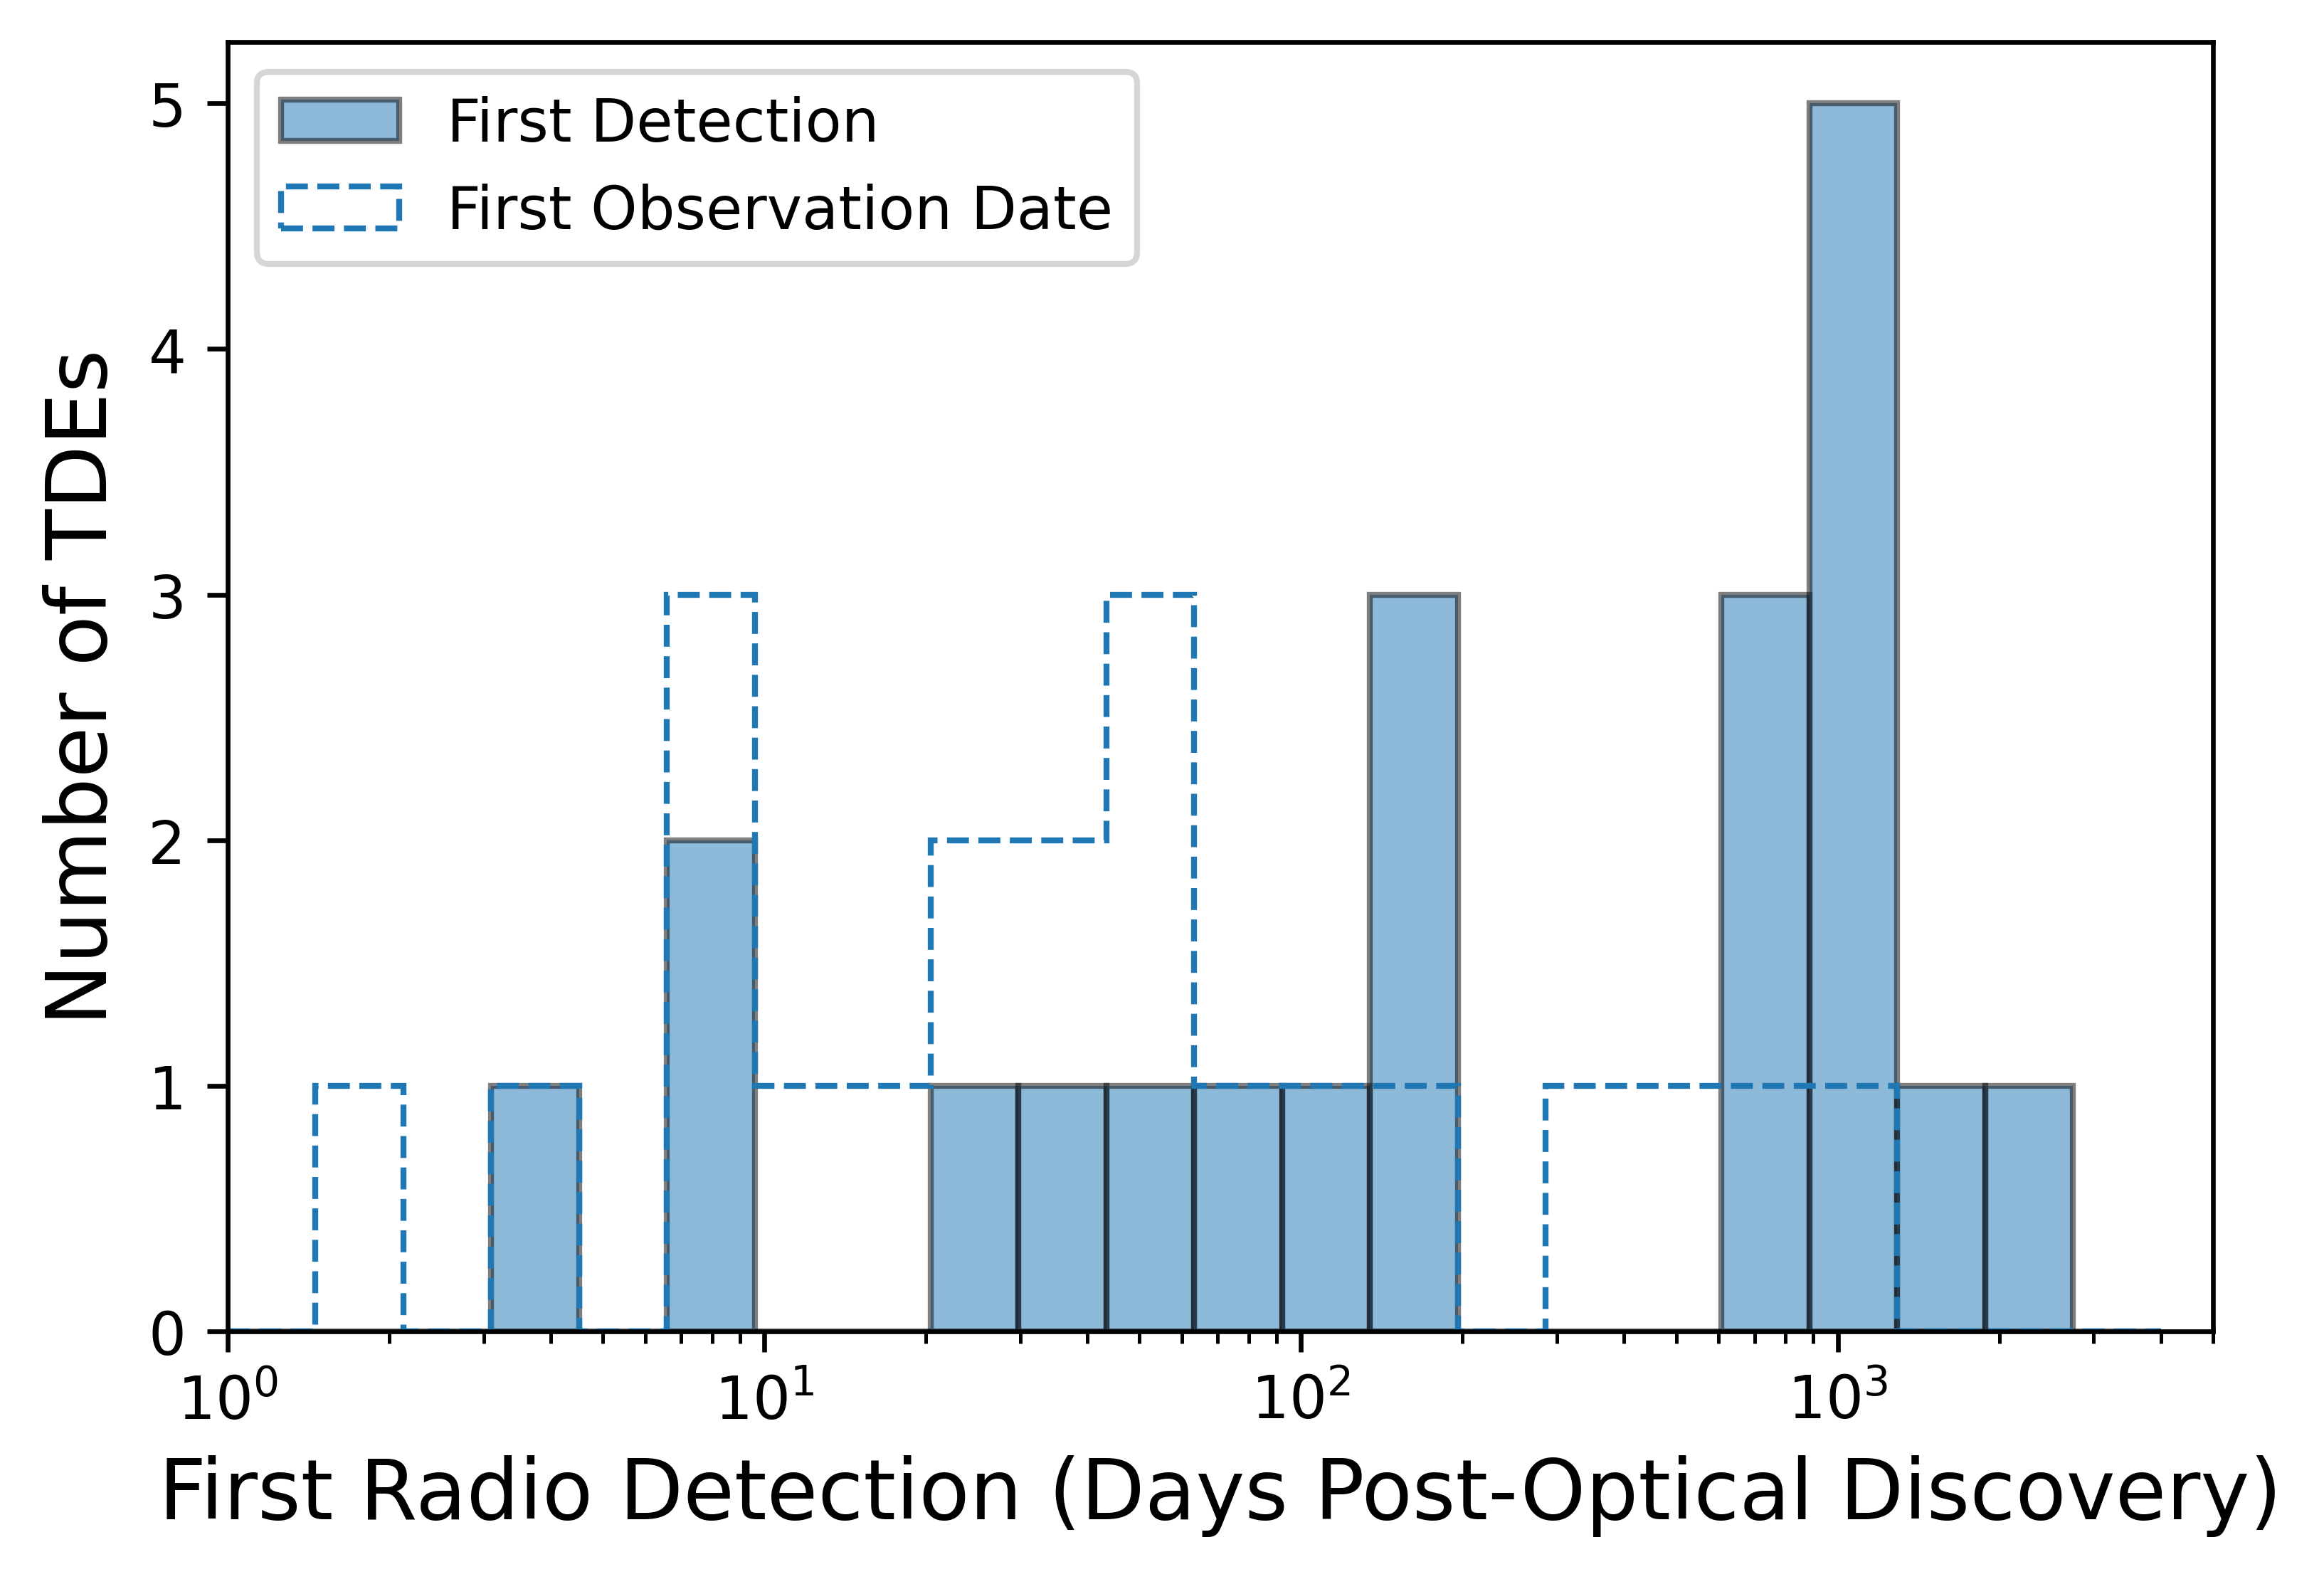
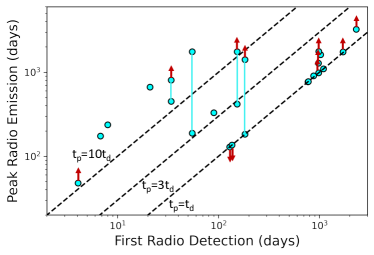
In Figure 2 we explore the turn-on and peak timescales of detected radio emission in the full TDE population with radio detections. The left panel of Figure 2 shows the timescale at which radio emission is first detected. We find a broad range of timescales, spanning from a few days to days. We note that some TDEs without current radio detections may yet turn on at even later timescales, as highlighted by the case of ASASSN-14ae with a first detection at days, and is still rising. The overall distribution of turn-on timescales appears to exhibit three groupings. First, at d are the jetted TDEs (Sw J1644+57, AT2022cmc), which are detected early due to the combination of rapid triggering and luminous radio emission from a relativistic jet, as well as the rapidly-evolving AT2019qiz, which was detected in the radio at 8 days (Nicholl et al., 2020). Second, at days we find 8 TDEs333We note that this grouping includes ASASSN-15oi with a first detection at 183 days and iPTF16fnl with a first detection at 153 days, which were referred to as “late” emission by Horesh et al. (2021a) and Horesh et al. (2021b), respectively, but which we clearly see here are more typical of TDEs with early radio emission, and are distinct from the population of TDEs with radio emission only at days identified here.). Finally, identified here for the first time, we find that about half of all TDEs with radio emission are detected only at days, with a peak at days. We note that the gap at days may be due to observing gaps, so it is possible that there is a more continuous distribution of turn-on times; however, it is clear that turn-on timescales of days are at least (or more) common than at days. We also show in the left panel of Figure 2 the distribution of timescales of the first radio observation of each TDE. We note that for about of the TDEs, the first observation led to the first detection (e.g., ASASSN-14li, AT2019dsg; Alexander et al. 2016; Stein et al. 2021), and it is therefore likely that a first radio detection would have been possible even earlier; for the remaining TDEs there is at least one non-detection prior to the first detection.
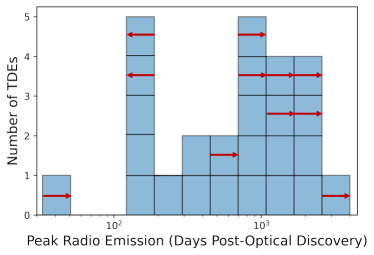
While the turn-on timescale is informative, and clearly hints at a distinction between early- ( d) and late-rising ( d) radio emission, the time of first detection is at least in part affected by any delays in the first observation. An additional relevant timescale is that of peak radio emission, shown in the right panel of Figure 2; we use the time of peak at GHz for uniformity. We note that in some cases the radio light curve is already declining at the time of discovery so only an upper limit on the peak timescale is available; conversely, in other cases the emission is still rising in our latest observations leading to a lower limit on the peak timescale. We further note that for the 4 TDEs with a clear double-peaked structure (ASASSN-15oi, iPTF16fnl, AT2020vwl and AT2019dsg) we include both peaks in the distribution. The overall distribution is somewhat more uniform than the distribution of first detections, but we still note a bimodality, with peaks at d and d (especially when we consider upper and lower limits). Regardless of the exact structure of the distribution, we find that of TDEs with radio emission peak at days. This is further highlighted in the bottom panel of Figure 2, where we plot the peak timescale versus the time of first detection, indicating that for events with early emission the peak emission timescale is typically times higher than the time of first detection; while the events with first detections at d have mostly not reached their peak, if they had similar ratios they would peak on timescales.
Investigating the radio luminosities of the late emission, we find a range of to erg s-1, but we stress that for several TDEs the emission is still rising, so both the lower and upper ranges may shift higher once all sources reach their peak. Overall, these radio luminosities are comparable to those of TDEs with early radio emission, but are times less luminous than Sw1644+57 at a comparable timescale. We note that in the cases where the peak luminosity is well constrained by our detections and preceding upper limits (i.e., PS16dtm, AT2019eve, AT2019ezh, AT2018hco) the peak luminosities are erg s-1, compared to erg s-1 for Sw1644+57, and it is therefore unlikely that their radio emission is due to initially off-axis jets; we return to this point in §5.2. On the other hand, the radio emission is still rising in some TDEs (i.e., ASASSN-14ae, iPTF16fnl, AT2018dyb, AT2018zr, AT2019dsg) although we note that those too currently have much lower luminosities than Sw1644+57.
In Table 1 we include the TDE spectroscopic sub-classes as outlined by van Velzen et al. (2020), namely TDE-H, TDE-H+He, and TDE-He. We find that all events in our sample classified as TDE-H exhibit delayed radio emission. We also find that we have two detections of TDE-H+He events (AT2019teq, AT2020neh), but the majority of our non-detections are of the TDE-H+He class. We will explore possible connections between the radio emission properties and the multi-wavelength properties in a companion paper (Alexander et al. in prep).
Finally, it is worth noting that the TDEs with no radio detections may in fact turn on at a later time than the observations presented here. For example, ASASSN-14ae is the oldest TDE in our sample and its first detection was at days. Regular monitoring of the TDE population is crucial for determining the distribution of turn-on timescales; for example, in our own study, AT2018zr was not detected by two dedicated observations at 929 and 1218 days, but was then detected in a third observation at 1713 days. VLASS data was not constraining for this source, and without our prior deep upper limits it would have been difficult to constrain the timescale at which radio emission turned on.
| TDE | ||||
|---|---|---|---|---|
| (d) | (mJy) | (GHz) | ||
| ASASSN-14ae∗ | 2696 | >0.329 | <2.5 | |
| ASASSN-14ae∗ | 3243 | >0.720 | <1.75 | |
| iPTF16fnl∗ | 1752 | >0.028 | <5.0 | |
| PS16dtm∗ | 1767 | >0.361 | <3.0 | |
| PS16dtm∗ | 2291 | >0.193 | <1.75 | |
| AT2018dyb | 1615 | |||
| AT2018hco | 1191 | |||
| AT2018hco | 1311 | |||
| AT2018zr∗ | 1743 | >0.218 | <1.75 | |
| AT2019dsg | 1171 | |||
| AT2019ehz | 970 | |||
| AT2019ehz | 1262 | |||
| AT2019eve | 945 | |||
| AT2019eve | 1102 | |||
| AT2019eve | 1325 | |||
| AT2019teq∗ | 1155 | >0.492 | <1.25 |
Note. — ∗ Indicates SEDs in which the model peak is at or near the lowest frequency data point, and the resulting values of and are lower and upper limits, respectively. We have combined data for some SEDs taken with different telescopes at roughly the same time for broader frequency coverage, and note these instances in §4.1.
4 Spectral Energy Distribution Modeling and Analysis
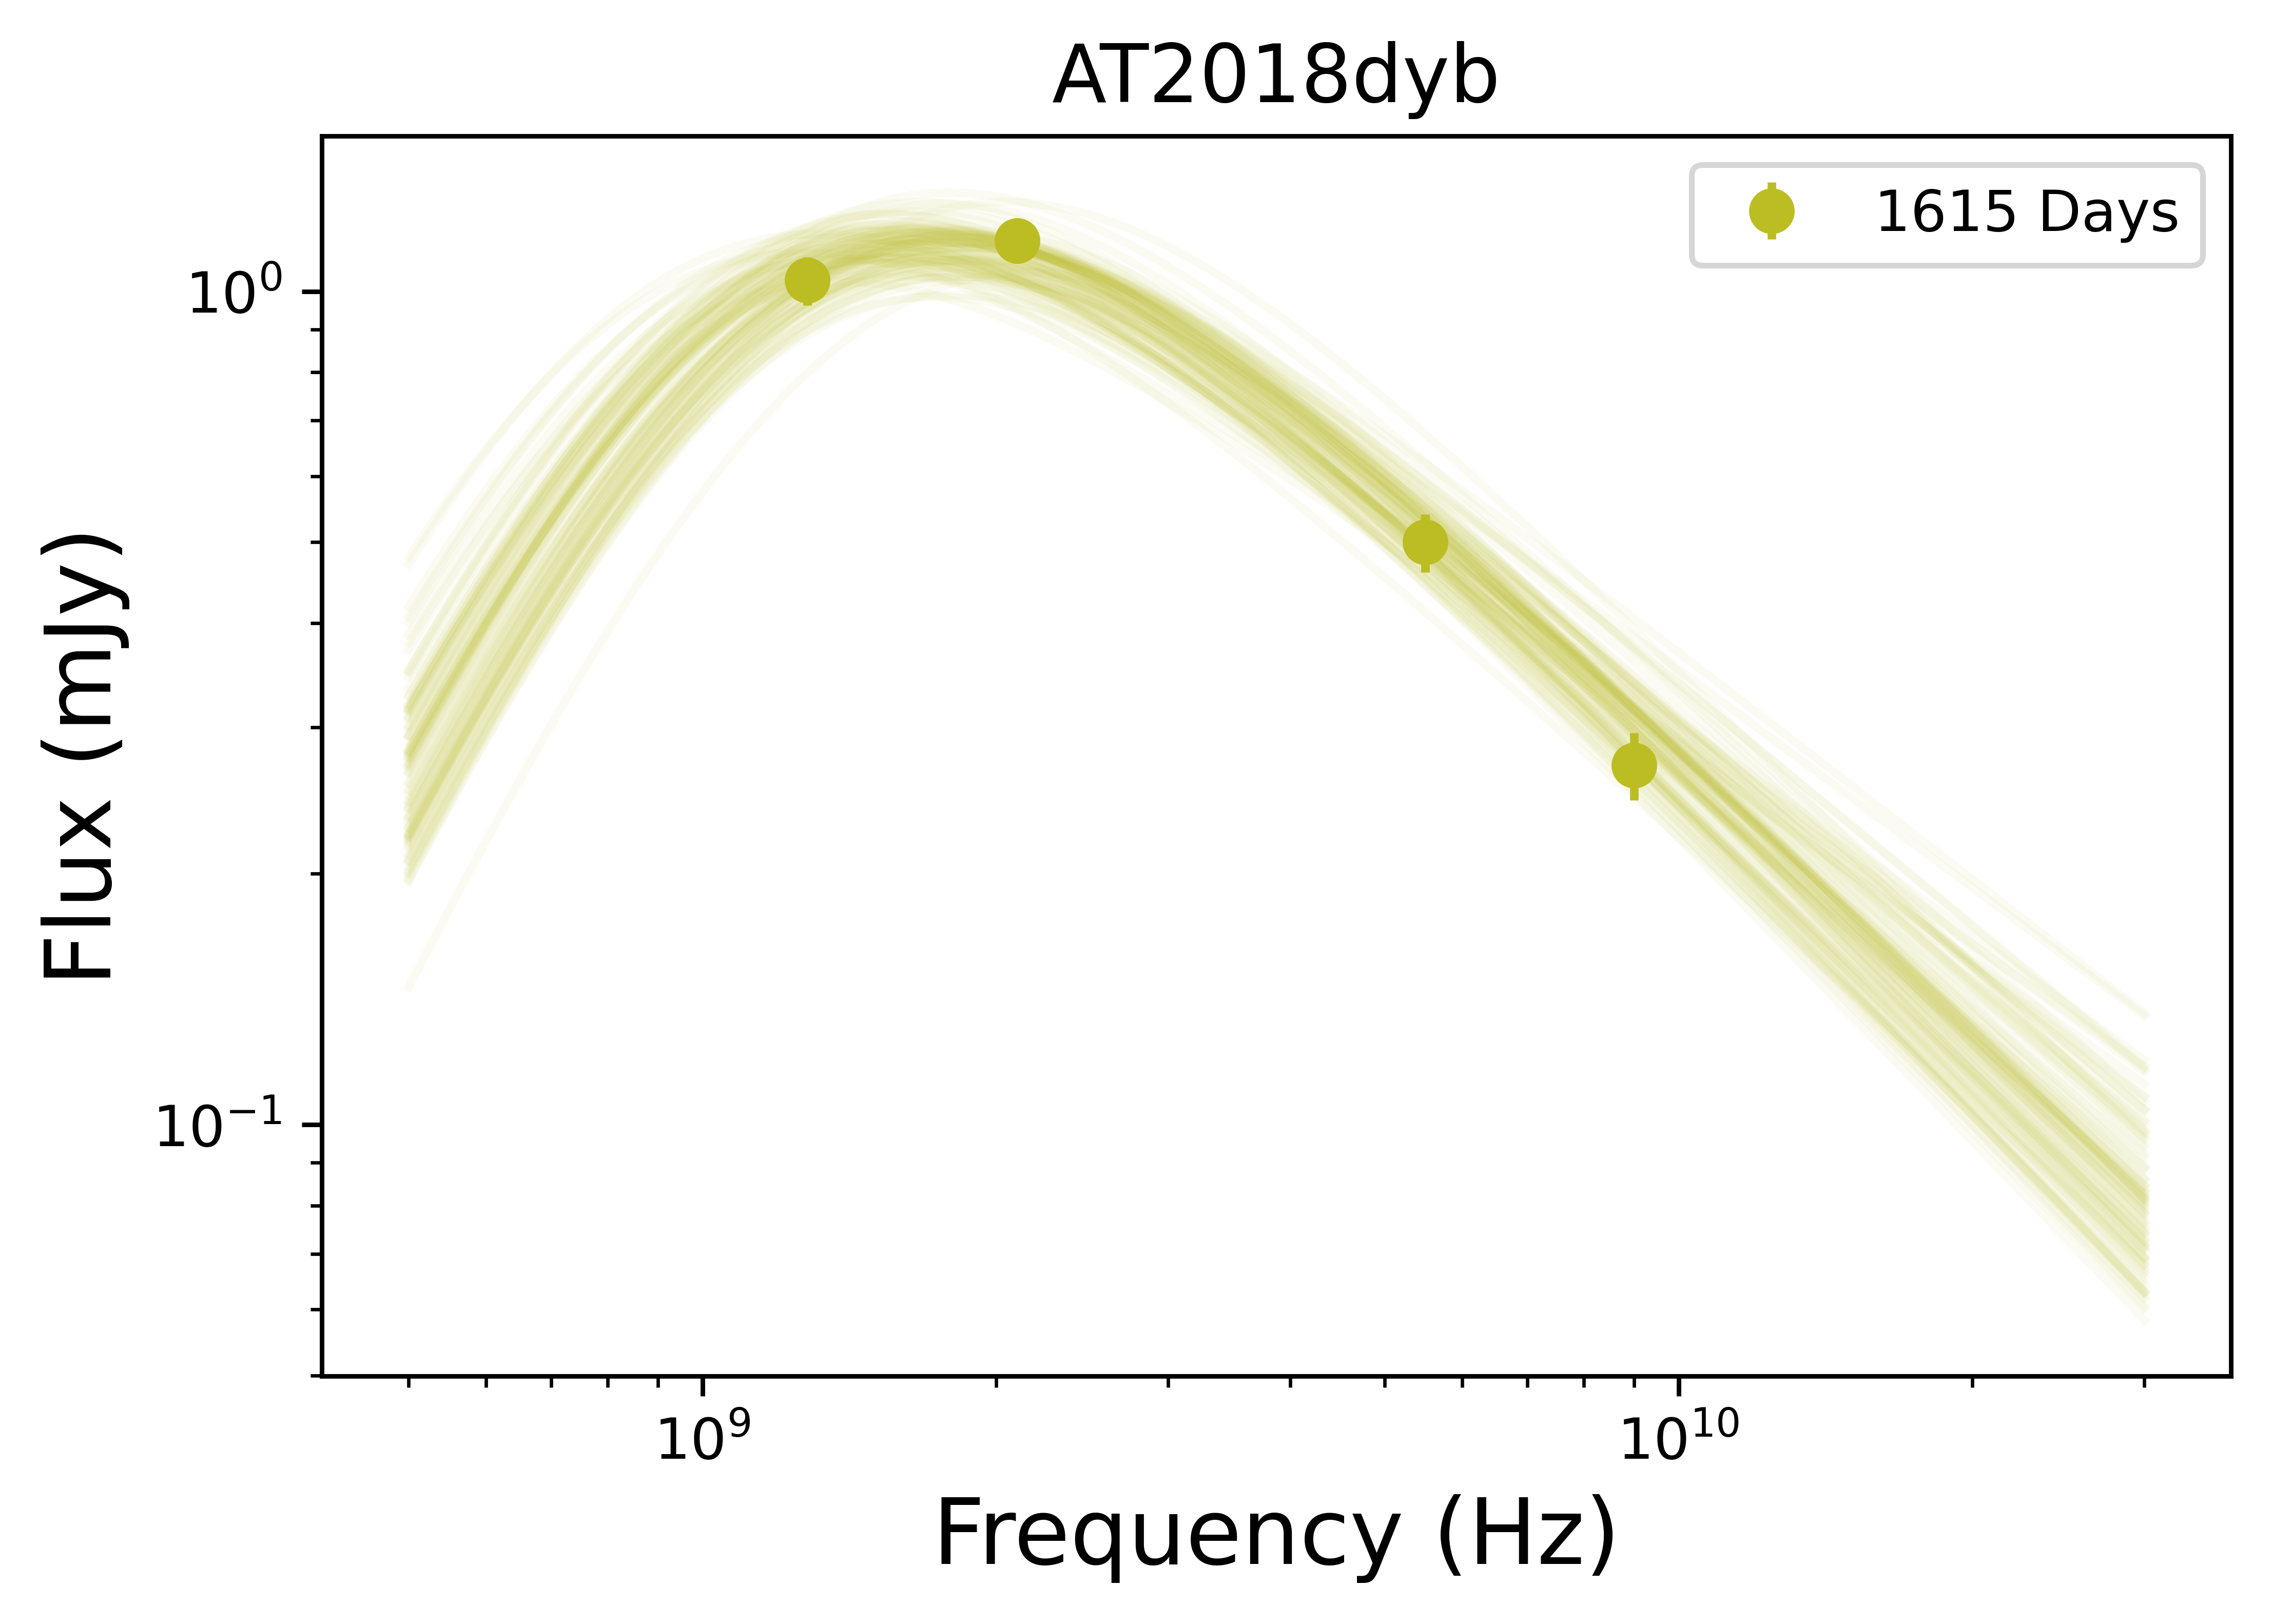
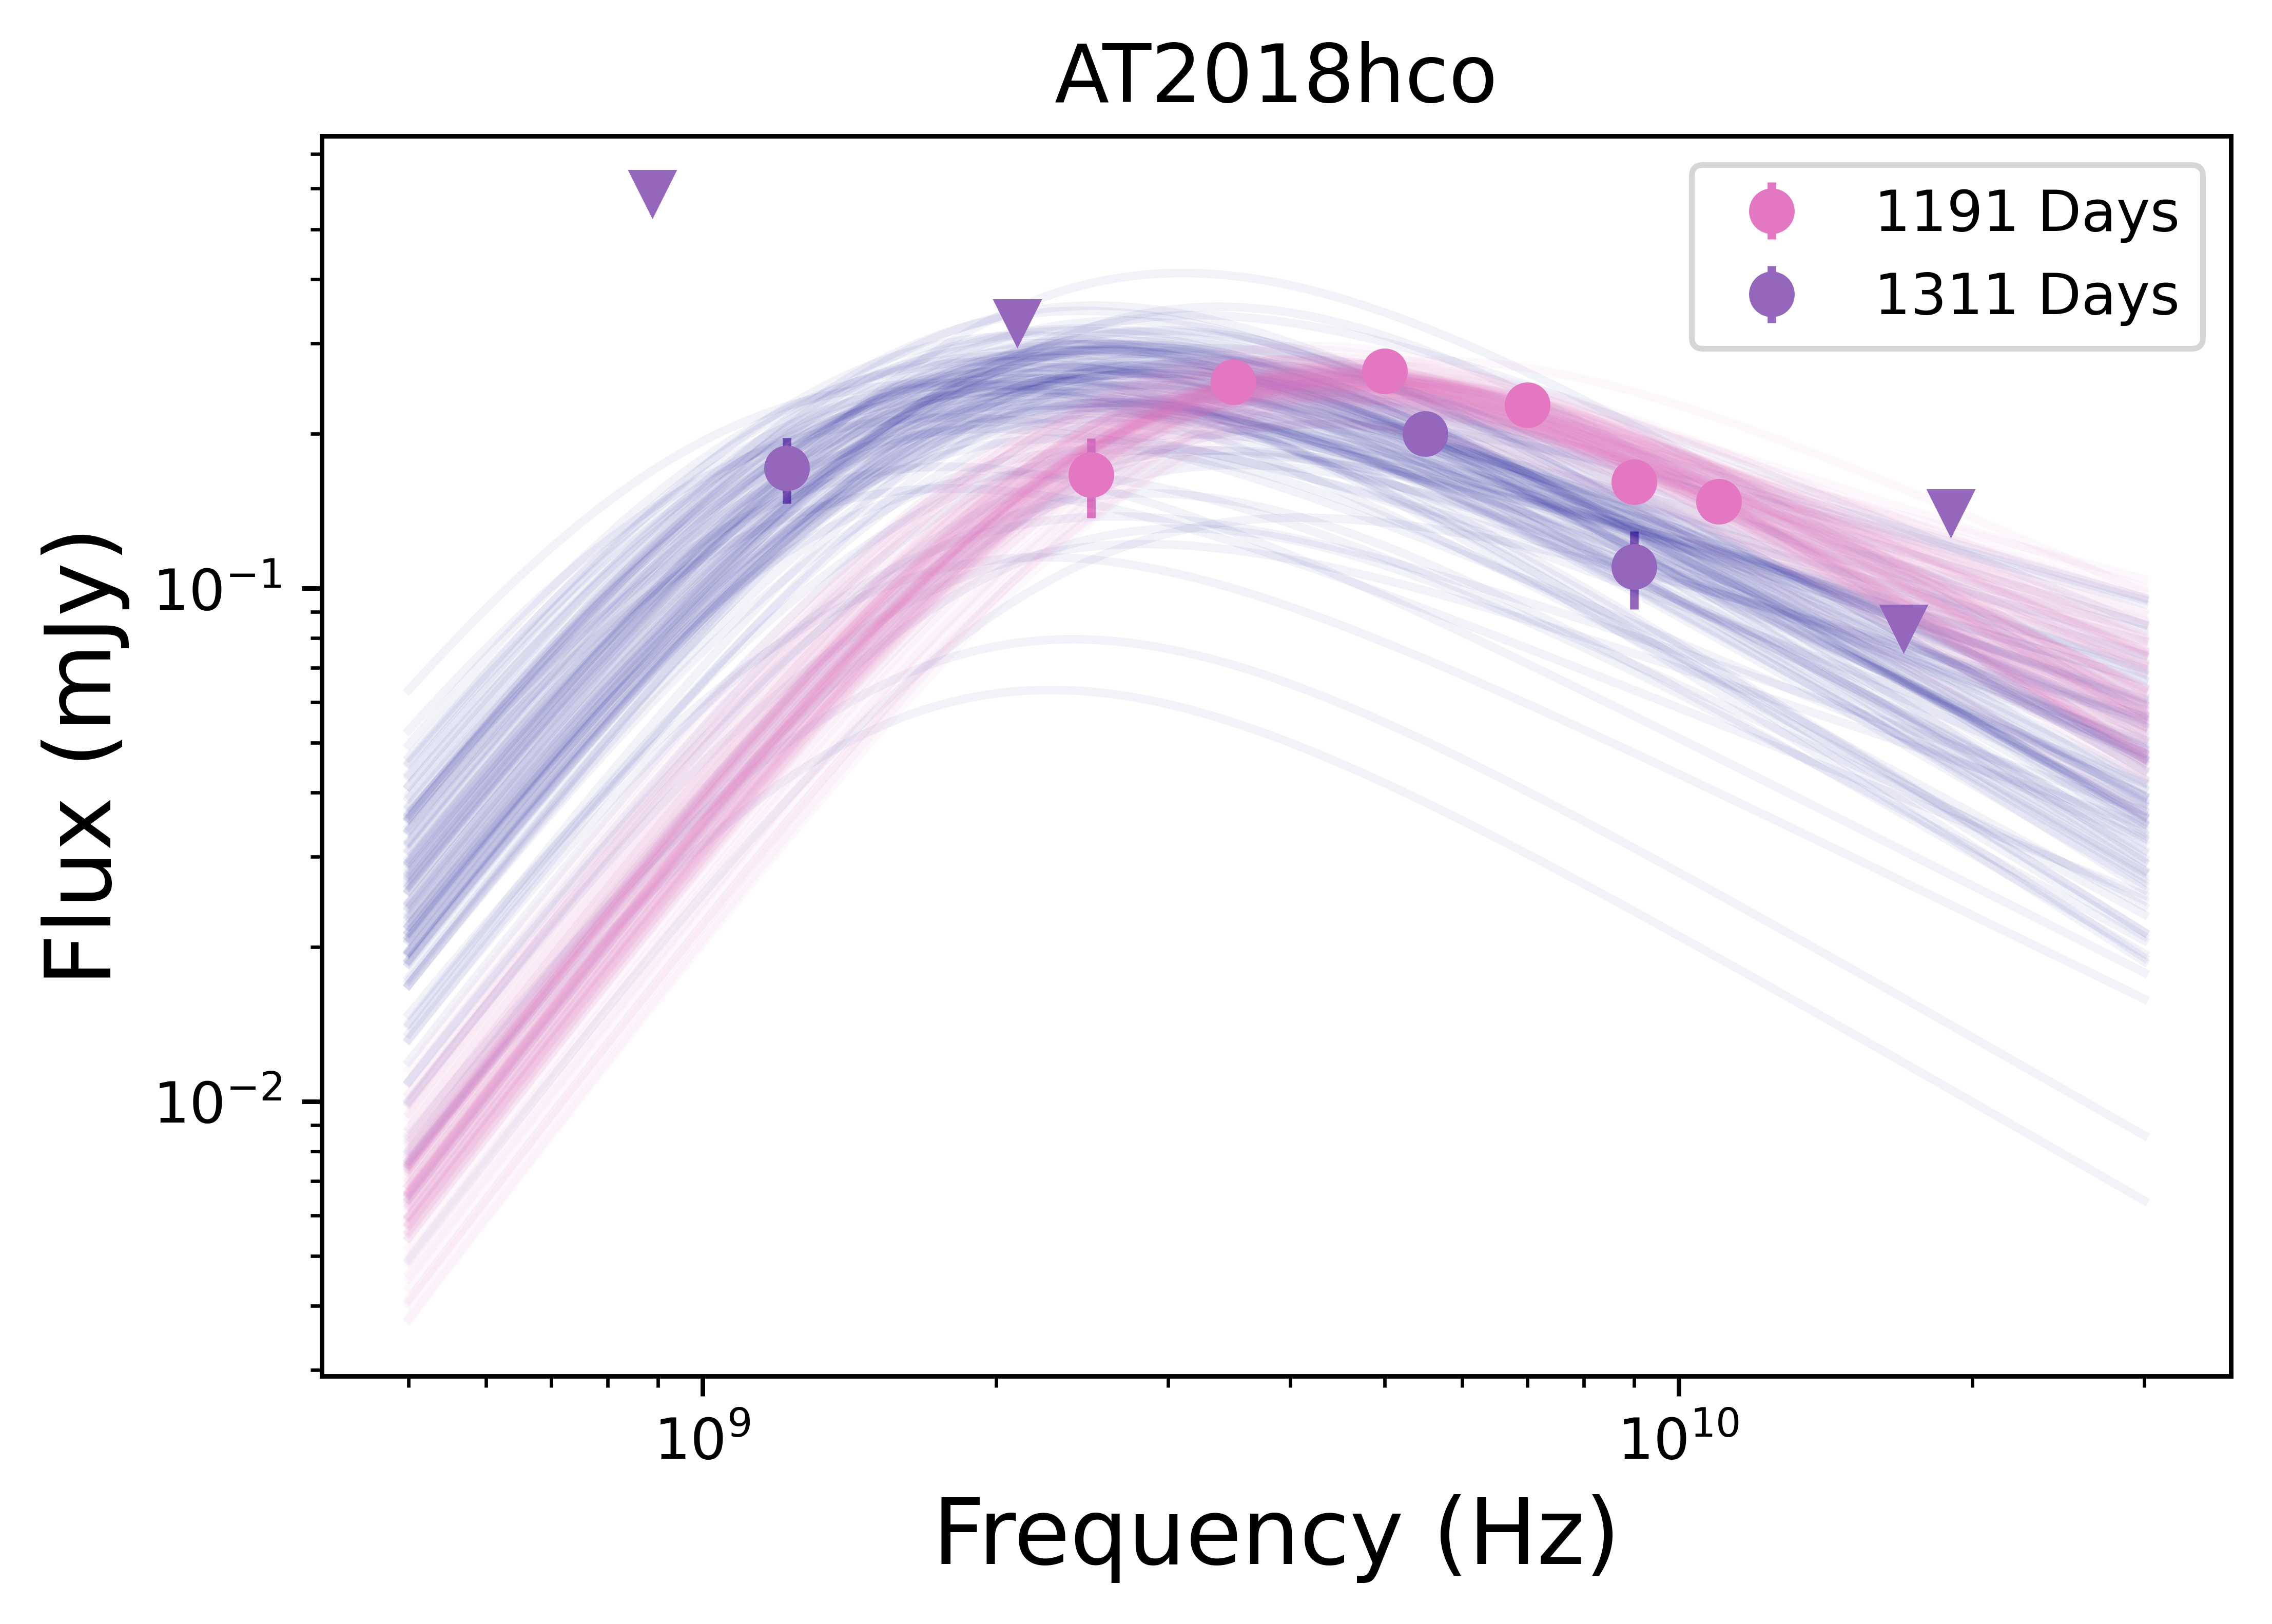
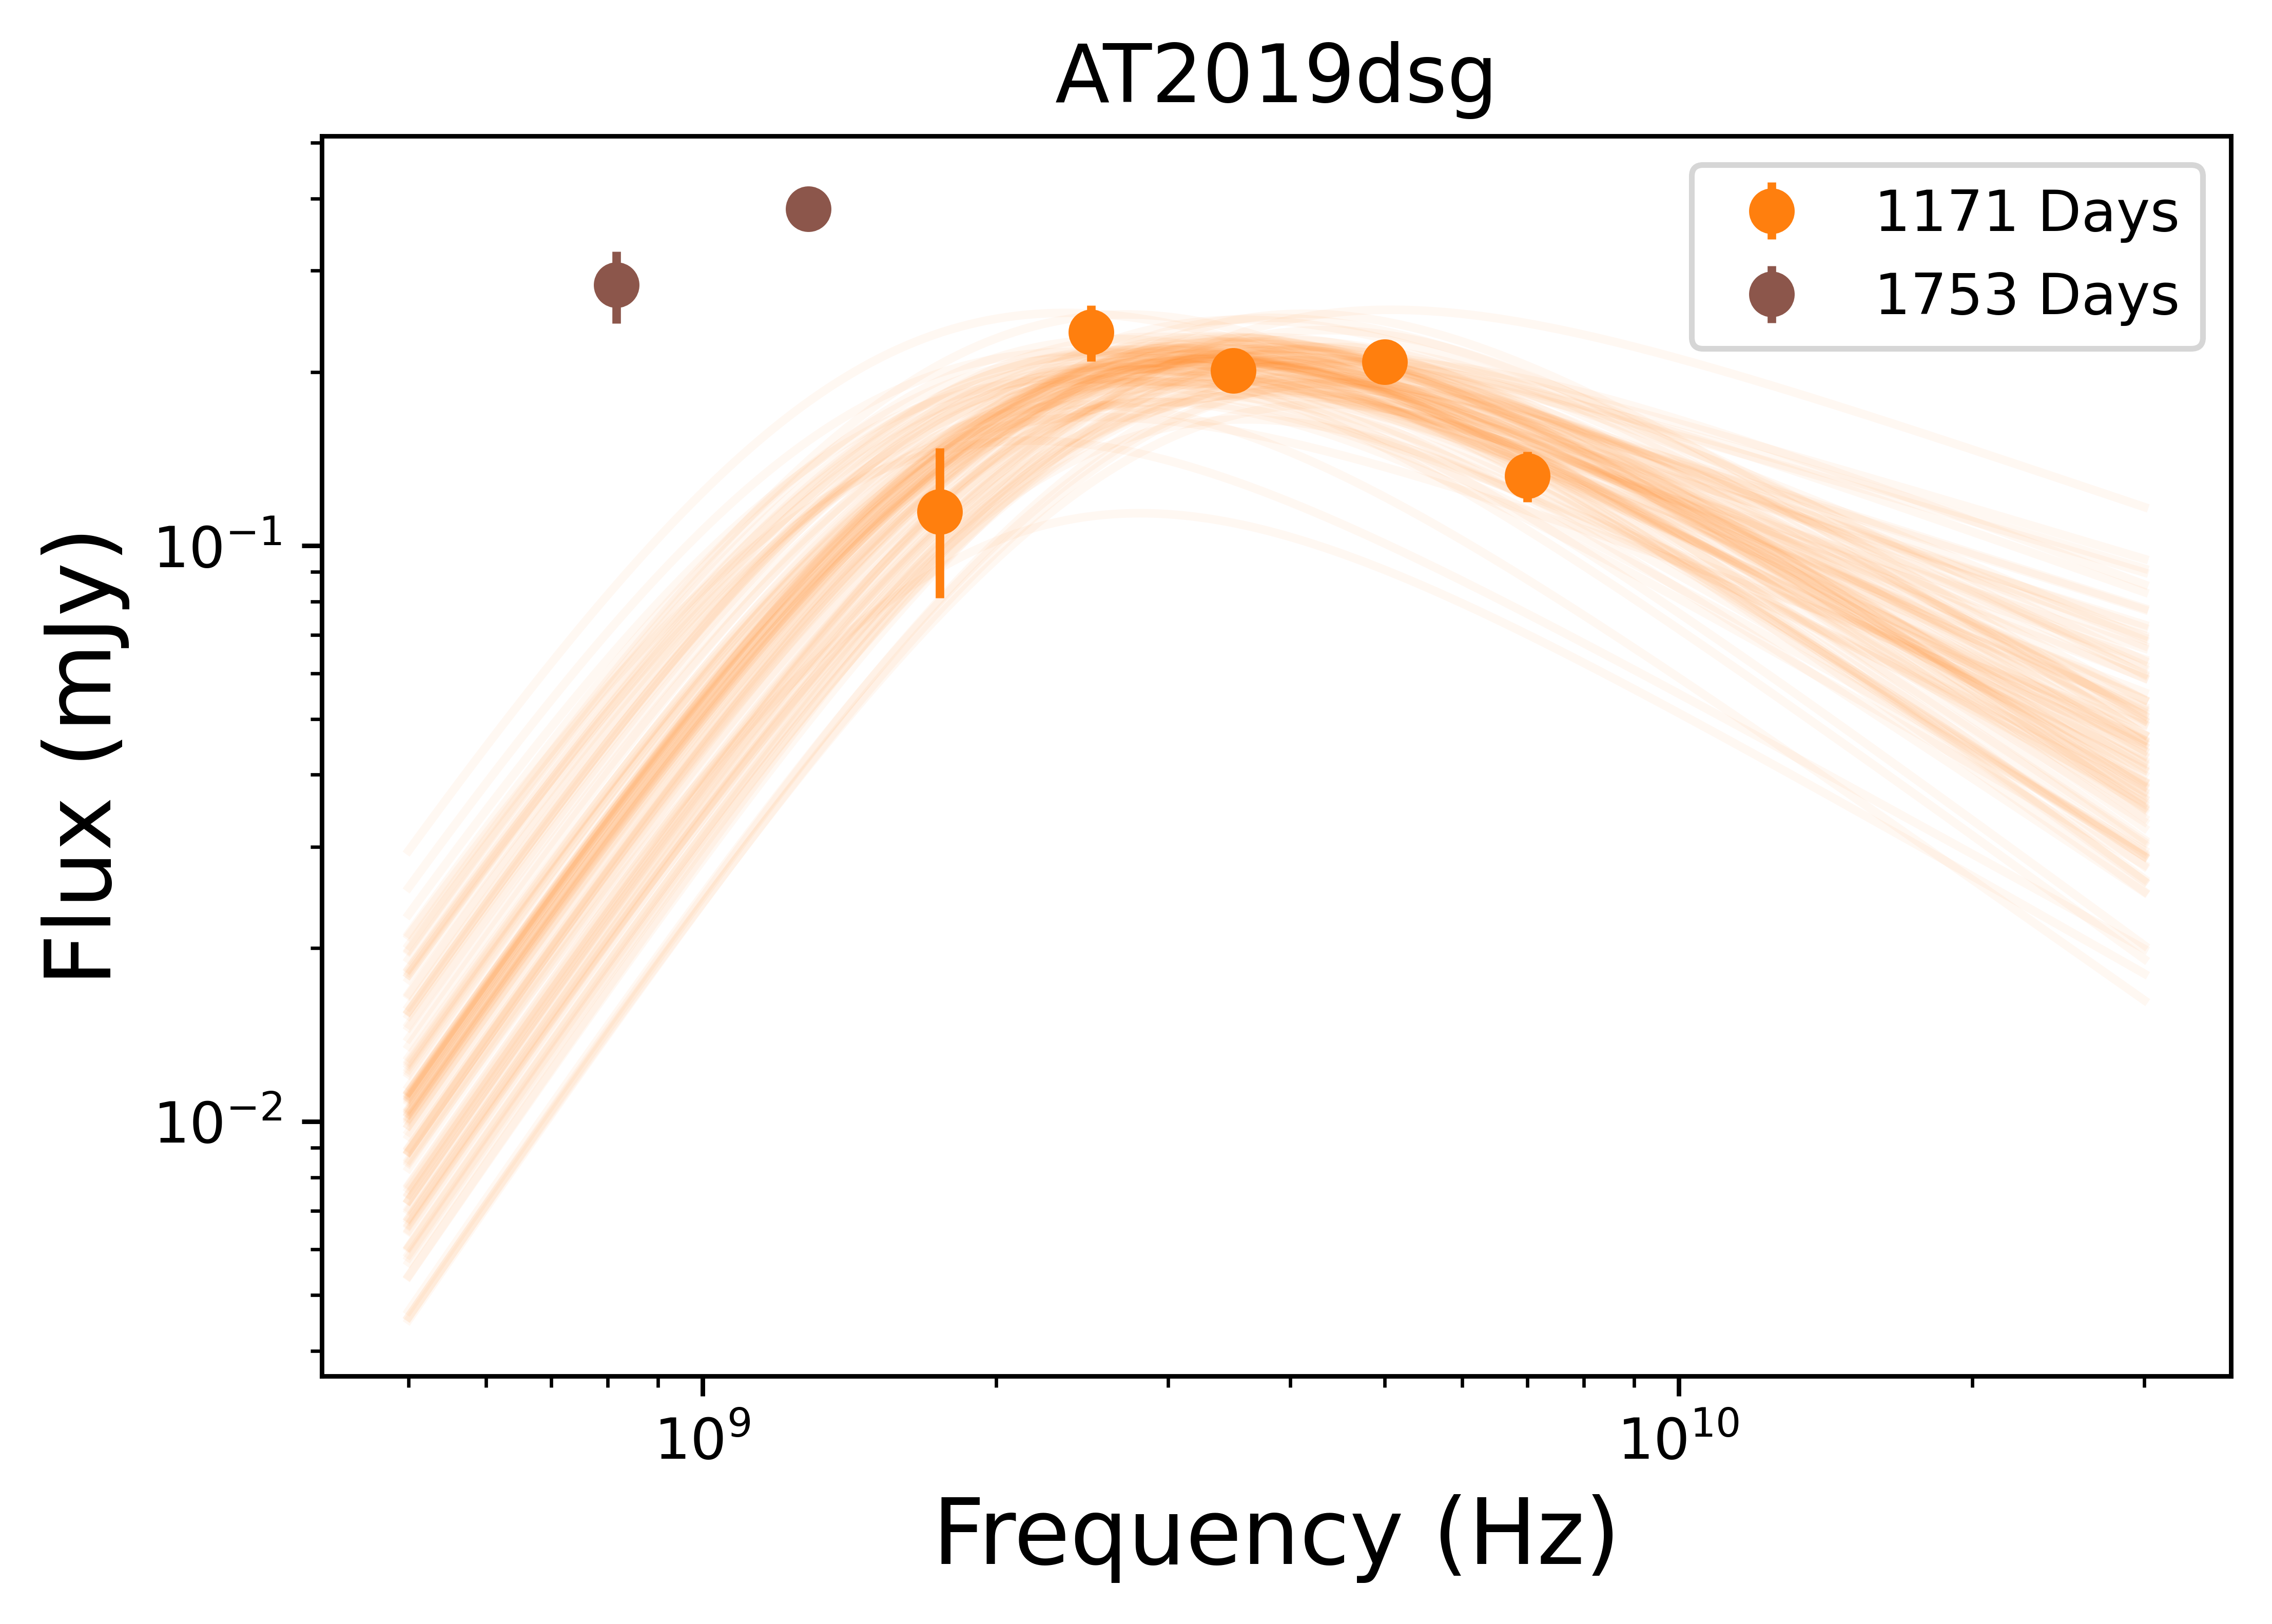
Beyond the light curve data discussed in the previous section, we have also obtained multi-frequency data for 10 TDEs with late-time radio emission 444We also obtained SEDs for OGLE17aaj and AT2020pj, but the origin of the radio emission in these sources is ambiguous (§3.1.3). We exclude these sources from our analysis, but provide the data for completeness in Table 6., allowing us to model their spectral energy distributions (SEDs) and extract physical properties of the outflows. The SEDs are characteristic of self-absorbed synchrotron emission, with (in some cases) a well defined peak frequency () and peak flux density (), and a spectral shape of below (Figure 3). In several cases we find that the SED peak is below our lowest available frequency; we assume a self-absorbed synchrotron emission for these cases as well, and use the lowest-frequency data point as an upper limit on and a lower limit on (Figure 4). For 6 TDEs, we have 2 or 3 epochs of multi-frequency observations, while for 4 sources we have only a single epoch.
We fit the SEDs with the model of Granot & Sari (2002), developed for synchrotron emission from gamma-ray burst (GRB) afterglows, and previously applied to the radio emission from TDEs (e.g., Zauderer et al. 2011; Cendes et al. 2021b, 2022b), using specifically the regime of :
| (1) |
where , , , and (as in Eftekhari et al., 2018; Cendes et al., 2021a). Here, is the electron energy distribution power law index, for , is the frequency corresponding to , is the synchrotron self-absorption frequency, and is the flux normalization at .
We determine the best fit parameters of the model — , , and — using the Python Markov Chain Monte Carlo (MCMC) module emcee (Foreman-Mackey et al., 2013), assuming a Gaussian likelihood where the data have a log distribution for the parameters and , and a lower limit of GHz (where the upper range for GHz, based on the existing frequency for the individual SED). For we use a uniform prior of . We also include in the model a parameter that accounts for additional systematic uncertainty beyond the statistical uncertainty on the individual data points, , which is this a fractional error added to each data point. The posterior distributions are sampled using 100 MCMC chains, which were run for 3,000 steps, discarding the first 2,000 steps to ensure the samples have sufficiently converged by examining the sampler distribution.
4.1 Notes on Individual TDEs
The SED model fits are shown in Figures 3 and 4 and provide a good match to the data, although in the cases in 4 we do not constrain . In these cases, we adopt the lowest frequency data point as an upper limit, and the flux measured at that data point as a lower limit. The resulting model parameters are listed in Table 2. Below we summarize key results for the individual TDEs.
-
•
ASASSN-14ae has two SEDs obtained with the VLA at 2696 days and 3243 days. In both cases, the SEDs peak below the lowest observed frequency. We thus use the lowest frequency data point for each observation for the values of as a lower limit and as an upper limit. We use a mean value of in the subsequent equipartition analysis.
-
•
PS16dtm has two SEDs obtained with the VLA at 1767 and 2291 days. In both cases the SEDs peak below the lowest observed data point, so we use the lowest data point for and , and they are considered as upper and lower limits, respectively. We use a mean value of in the subsequent equipartition analysis.
-
•
AT2018hco has two SEDs at 1191 days (VLA) and 1311 days (combined ATCA on 2022 April 22 and MeerKAT on 2022 May 7). We find that remained steady between the two observations, while decreased by about a factor of 1.6. We use a mean value of in the subsequent equipartition analysis.
-
•
AT2019dsg had a single SED at 1171 days (VLA), and a partial SED at 1753 days (MeerKAT). While the latter does not allow for a full SED fit, it clearly indicates a brightening by a factor of at low frequencies. At 1171 days, we find , consistent with the radio SEDs at earlier times (Cendes et al., 2021a). However, while exhibits a continued decline, increases to GHz at 1171 days, while it was GHz at 561 days (Cendes et al., 2021a); this increase creates the rise at 6 GHz seen in Figure 1.
-
•
AT2019ehz had two SEDs at 970 and 1262 days obtained with the VLA. We find that decreases by about a factor of 2 while decreases by about a factor of 1.5. We also find a decline in the value of from about 3.6 to 2.6, and adopt a mean value of in the subsequent equipartition analysis.
-
•
AT2019eve has 3 SEDs at 945 (VLA), 1102 (combined ATCA on 2022 April 30 and MeerKAT on 2022 May 10), and 1325 (combined VLA on 2022 December 19 and MeerKAT on 2023 January 4) days. We note that remains steady at 945 and 1102 days, and then declines at 1325 days, while declines at 945 and 1102 days, but remains steady at 1325 days. We also find a decline in the value of from about 2.75 to 2.3, and we use a mean value of in the subsequent equipartition analysis.
-
•
iPTF16fnl has a single SED at 1752 days taken with the VLA. The SED is flat, with below our lowest data point, so we thus adopt these values for and . We use in the subsequent equipartition analysis.
-
•
AT2018dyb has a single SED at 1615 days (combined MeerKAT on 2022 December 11 and ATCA on 2023 January 22). We find mJy, GHz, and .
-
•
AT2018zr has a single SED at 1743 days obtained with the VLA. We find the SED peaks below our lowest observed frequency, and thus adopt , GHz, and .
-
•
AT2019teq has a single SED at 1155 days obtained with the VLA. We find the SED peaks at the lowest observed frequency, indicating that the values of and may be considered as limits, and thus adopt mJy, GHz, and .
4.2 Equipartition Analysis
| Object | log() | log() | log() | log() | log() | log() | ||
|---|---|---|---|---|---|---|---|---|
| (d) | (cm) | (erg) | (G) | (cm-3) | (Hz) | |||
| ASASSN-14ae∗ | 2696 | >16.61 | >47.70 | < | >53.02 | <2.54 | >0.006 | >9.10 |
| ASASSN-14ae∗ | 3423 | >16.92 | >48.26 | < | >53.59 | <2.16 | >0.010 | >9.15 |
| iPTF16fnl∗ | 1752 | >15.37 | >44.79 | < | >50.55 | <3.79 | >0.0005 | >8.24 |
| PS16dtm∗ | 1767 | >16.77 | >48.10 | < | >52.68 | <1.72 | >0.014 | >9.59 |
| PS16dtm | 2291 | >16.86 | >47.99 | < | >52.57 | <1.32 | >0.013 | >9.96 |
| AT2018dyb | 1615 | |||||||
| AT2018hco | 1191 | 9.48 | ||||||
| AT2018hco | 1311 | |||||||
| AT2018zr∗ | 1743 | >16.84 | >47.91 | < | >52.51 | <1.34 | >0.016 | >10.21 |
| AT2019dsg | 1171 | |||||||
| AT2019ehz | 970 | 0.017 | ||||||
| AT2019ehz | 1262 | 0.014 | ||||||
| AT2019eve | 945 | |||||||
| AT2019eve | 1102 | |||||||
| AT2019eve | 1325 | |||||||
| AT2019teq∗ | 1155 | >17.23 | >48.65 | < | >53.31 | <0.97 | >0.06 | >11.21 |
Note. — Values in this table are calculated using an outflow launch time based on the optical discovery date. ∗ Indicates an unconstrained SED, where the resulting values can be considered as limits.
Using the inferred values of , and (Table 2), we can now derive the physical properties of the outflows and ambient medium using an equipartition analysis. We assume the conservative case of a non-relativistic spherical outflow; in §5.2 we demonstrate that none of the TDEs are in the regime where an off-axis relativistic jet interpretation can be supported (i.e., using the criterion in Matsumoto & Piran 2023). In the non-relativistic spherical case the radius and kinetic energy are given by (see Equations 27 and 28 in Barniol Duran et al., 2013):
| (2) |
| (3) |
where is the luminosity distance; is the redshift; and are the area and volume filling factors, respectively, where we assume that the emitting region is a shell of thickness ; and is the minimum Lorentz factor as relevant for non-relativistic sources, and , where and are the proton and electron masses, respectively. (Barniol Duran et al., 2013). The factors of and for the radius and energy, respectively, arise from corrections to the isotropic number of radiating electrons () in the non-relativistic case. We further assume that the fraction of post-shock energy in relativistic electrons is , which leads to correction factors of and in and , respectively, with . Finally, we parameterize any deviation from equipartition with a correction factor , where = 0.1 is the fraction of post-shock energy in magnetic fields.
Using we can also determine additional parameters of the outflow and environment (Barniol Duran et al., 2013): the magnetic field strength (), the Lorentz factor of electrons radiating at (), and the number of radiating electrons ():
| (4) |
| (5) |
| (6) |
We note an additional factor of 4 and a correction factor of are added to for the non-relativistic regime (Barniol Duran, private communication). We determine the ambient density assuming a strong shock and an ideal monoatomic gas as , where the factor of 4 is due to the shock jump conditions and is the volume of the emitting region as defined above.
Finally, the synchrotron cooling frequency, , is given by (Sari et al., 1998):
| (7) |
where refers to the age of the system, and here . The inferred values for are listed in Table 3. In several cases (e.g., AT2018hco, AT2019ehz) the value of is within the frequency range of our data, but we do not observe a cooling break. This may be indicative of an incorrect value for in Equation 7 due to a delayed outflow, as we discuss in §4.3. Another possibility is that the value of is lower than our fiducial assumption of , and hence the outflow may not be in equipartition.
The inferred equipartition values for the 9 new TDEs with SEDs reported in this paper, and for the two TDEs with distinct late-time components (iPTF16fnl, AT2019dsg) are listed in Table 3. Using the inferred values of we calculate the mean expansion velocity at each epoch, , assuming that the outflow was launched at the time of optical discovery.
4.3 Estimated Outflow Launch Timescales
Using the time of optical discovery as an initial estimate for the outflow launch date, the inferred velocities are in the range (Table 3), with the lowest velocities inferred for the older TDEs in our sample. However, for TDEs that have more than one SED where we directly measure the peak (AT2019eve, AT2019ehz, and AT2018hco), we find higher values for by comparing radius measurements between SED epochs than what we infer from individual epochs with the assumption that the outflow began at the time of optical discovery. This indicates that the assumption of a launch date that roughly coincides with the optical discovery is incorrect, as also indicated by non-detections at earlier times.
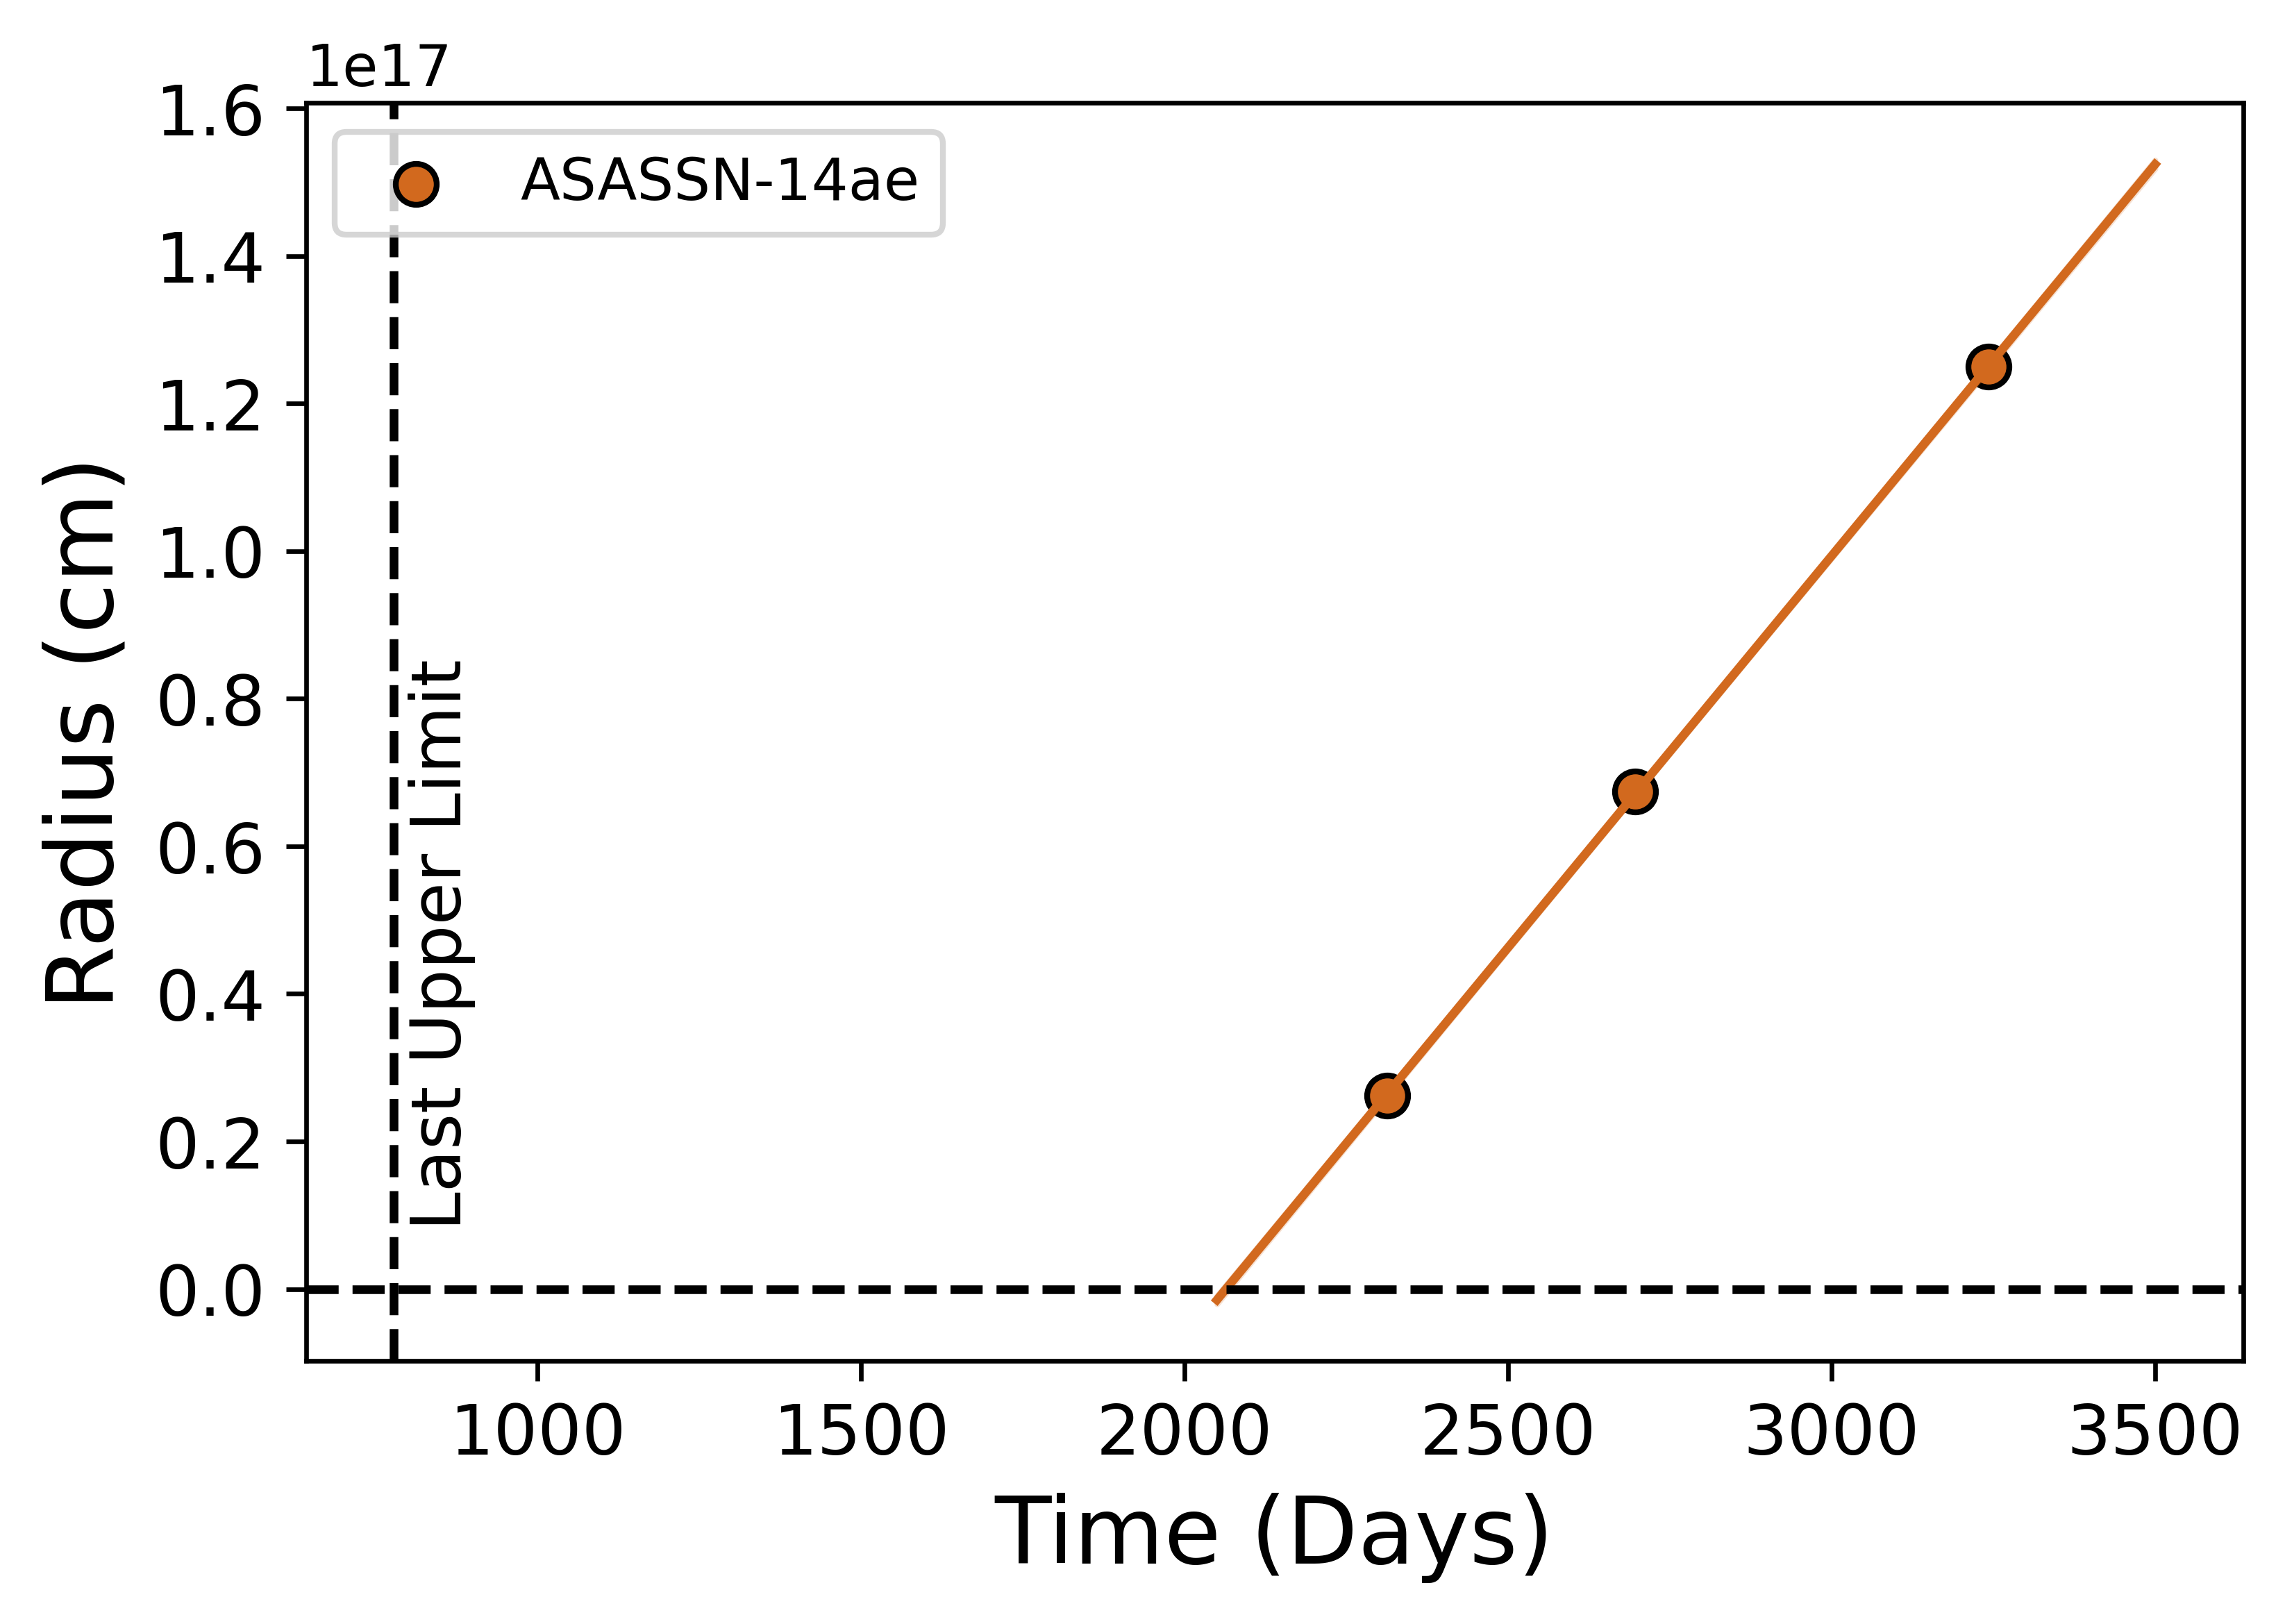
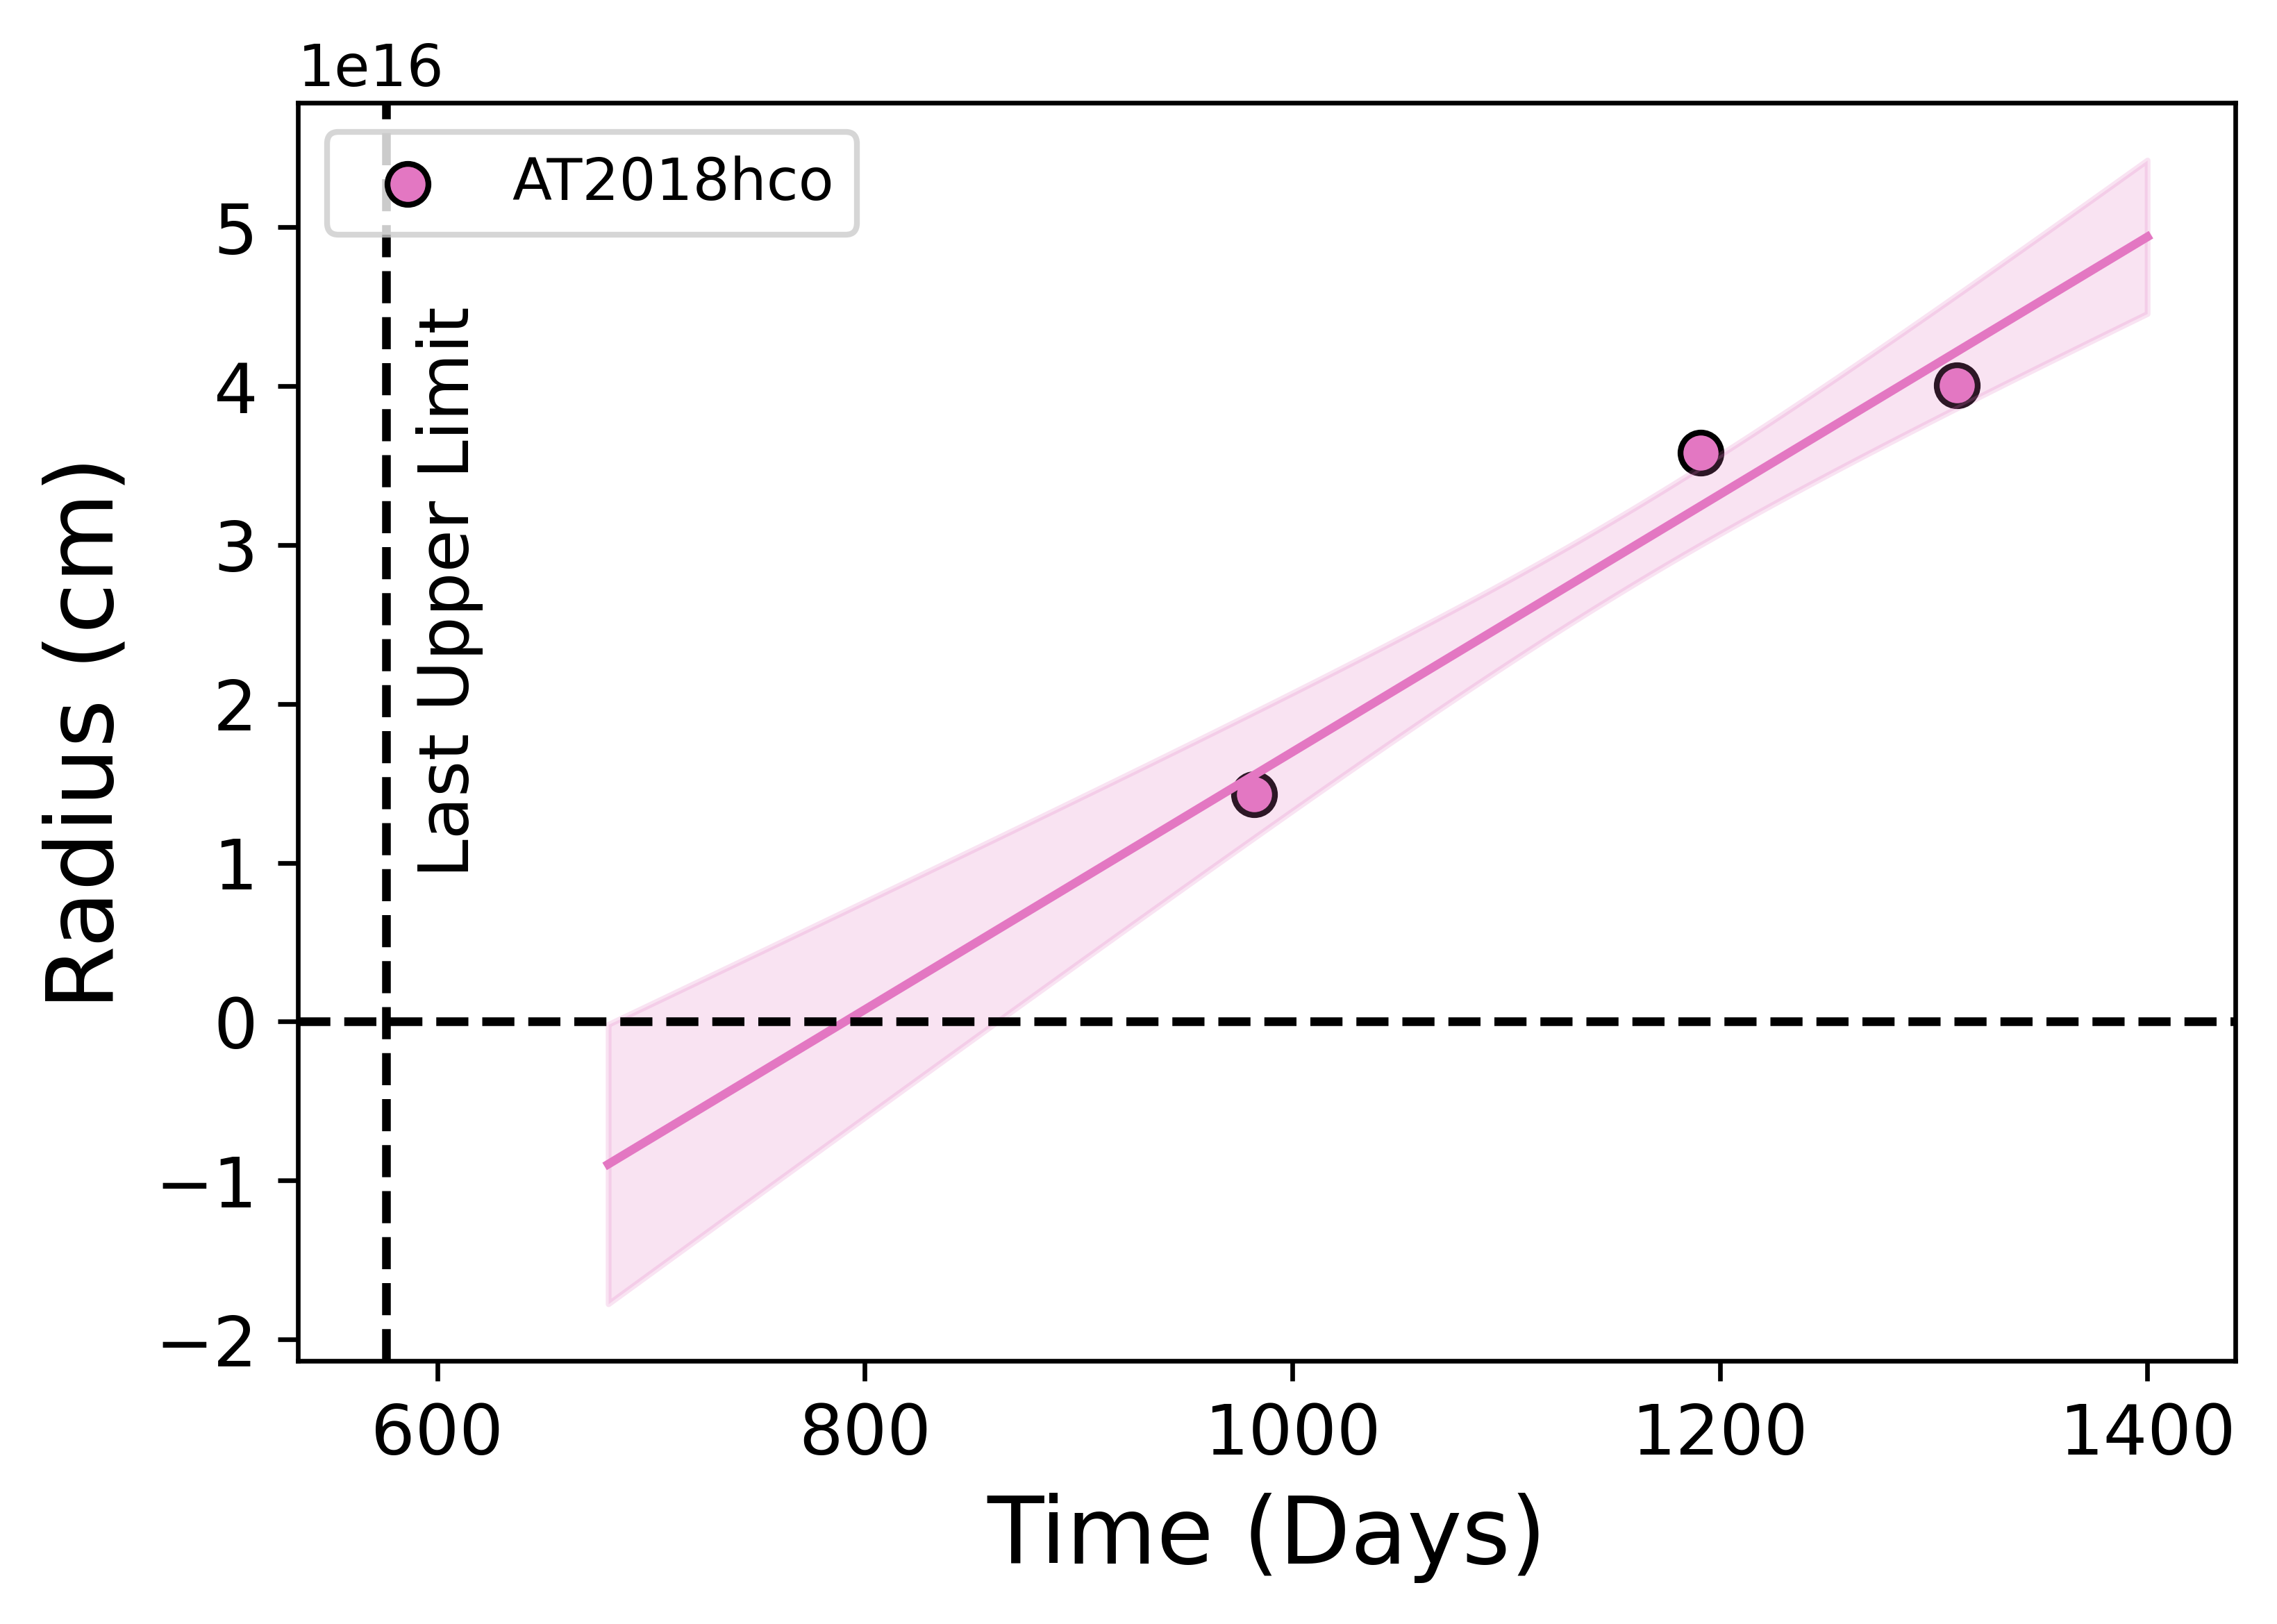
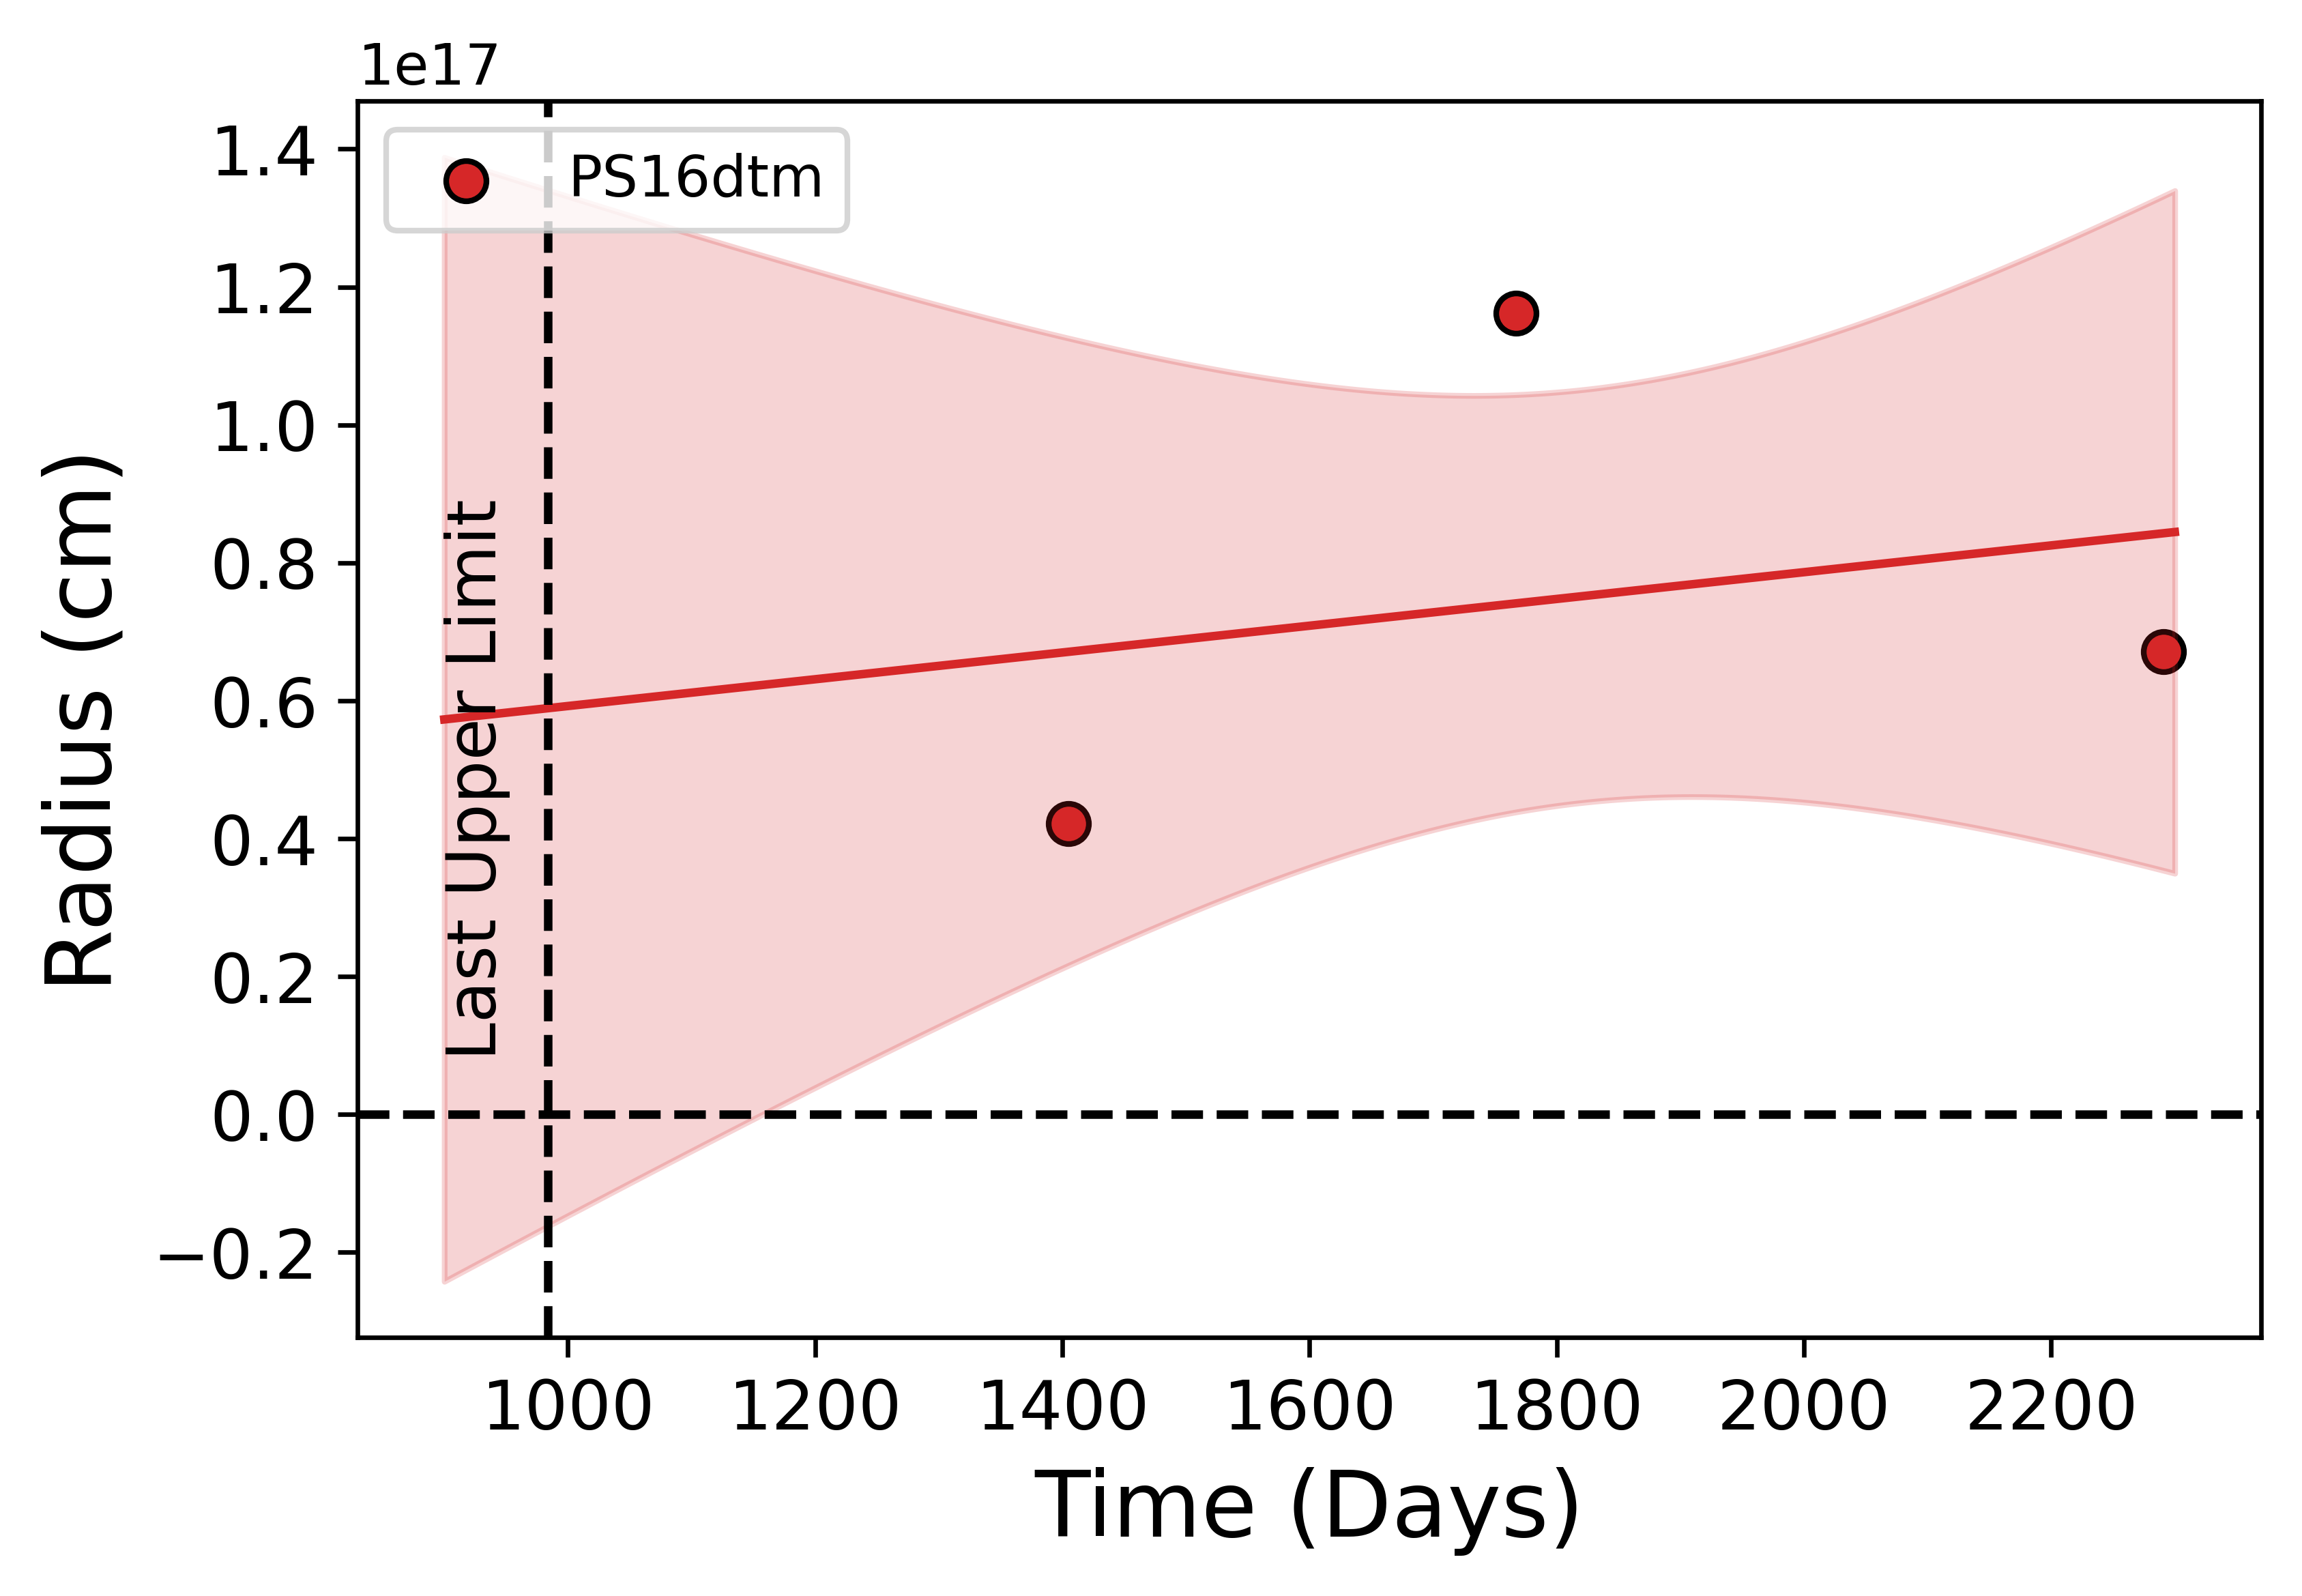
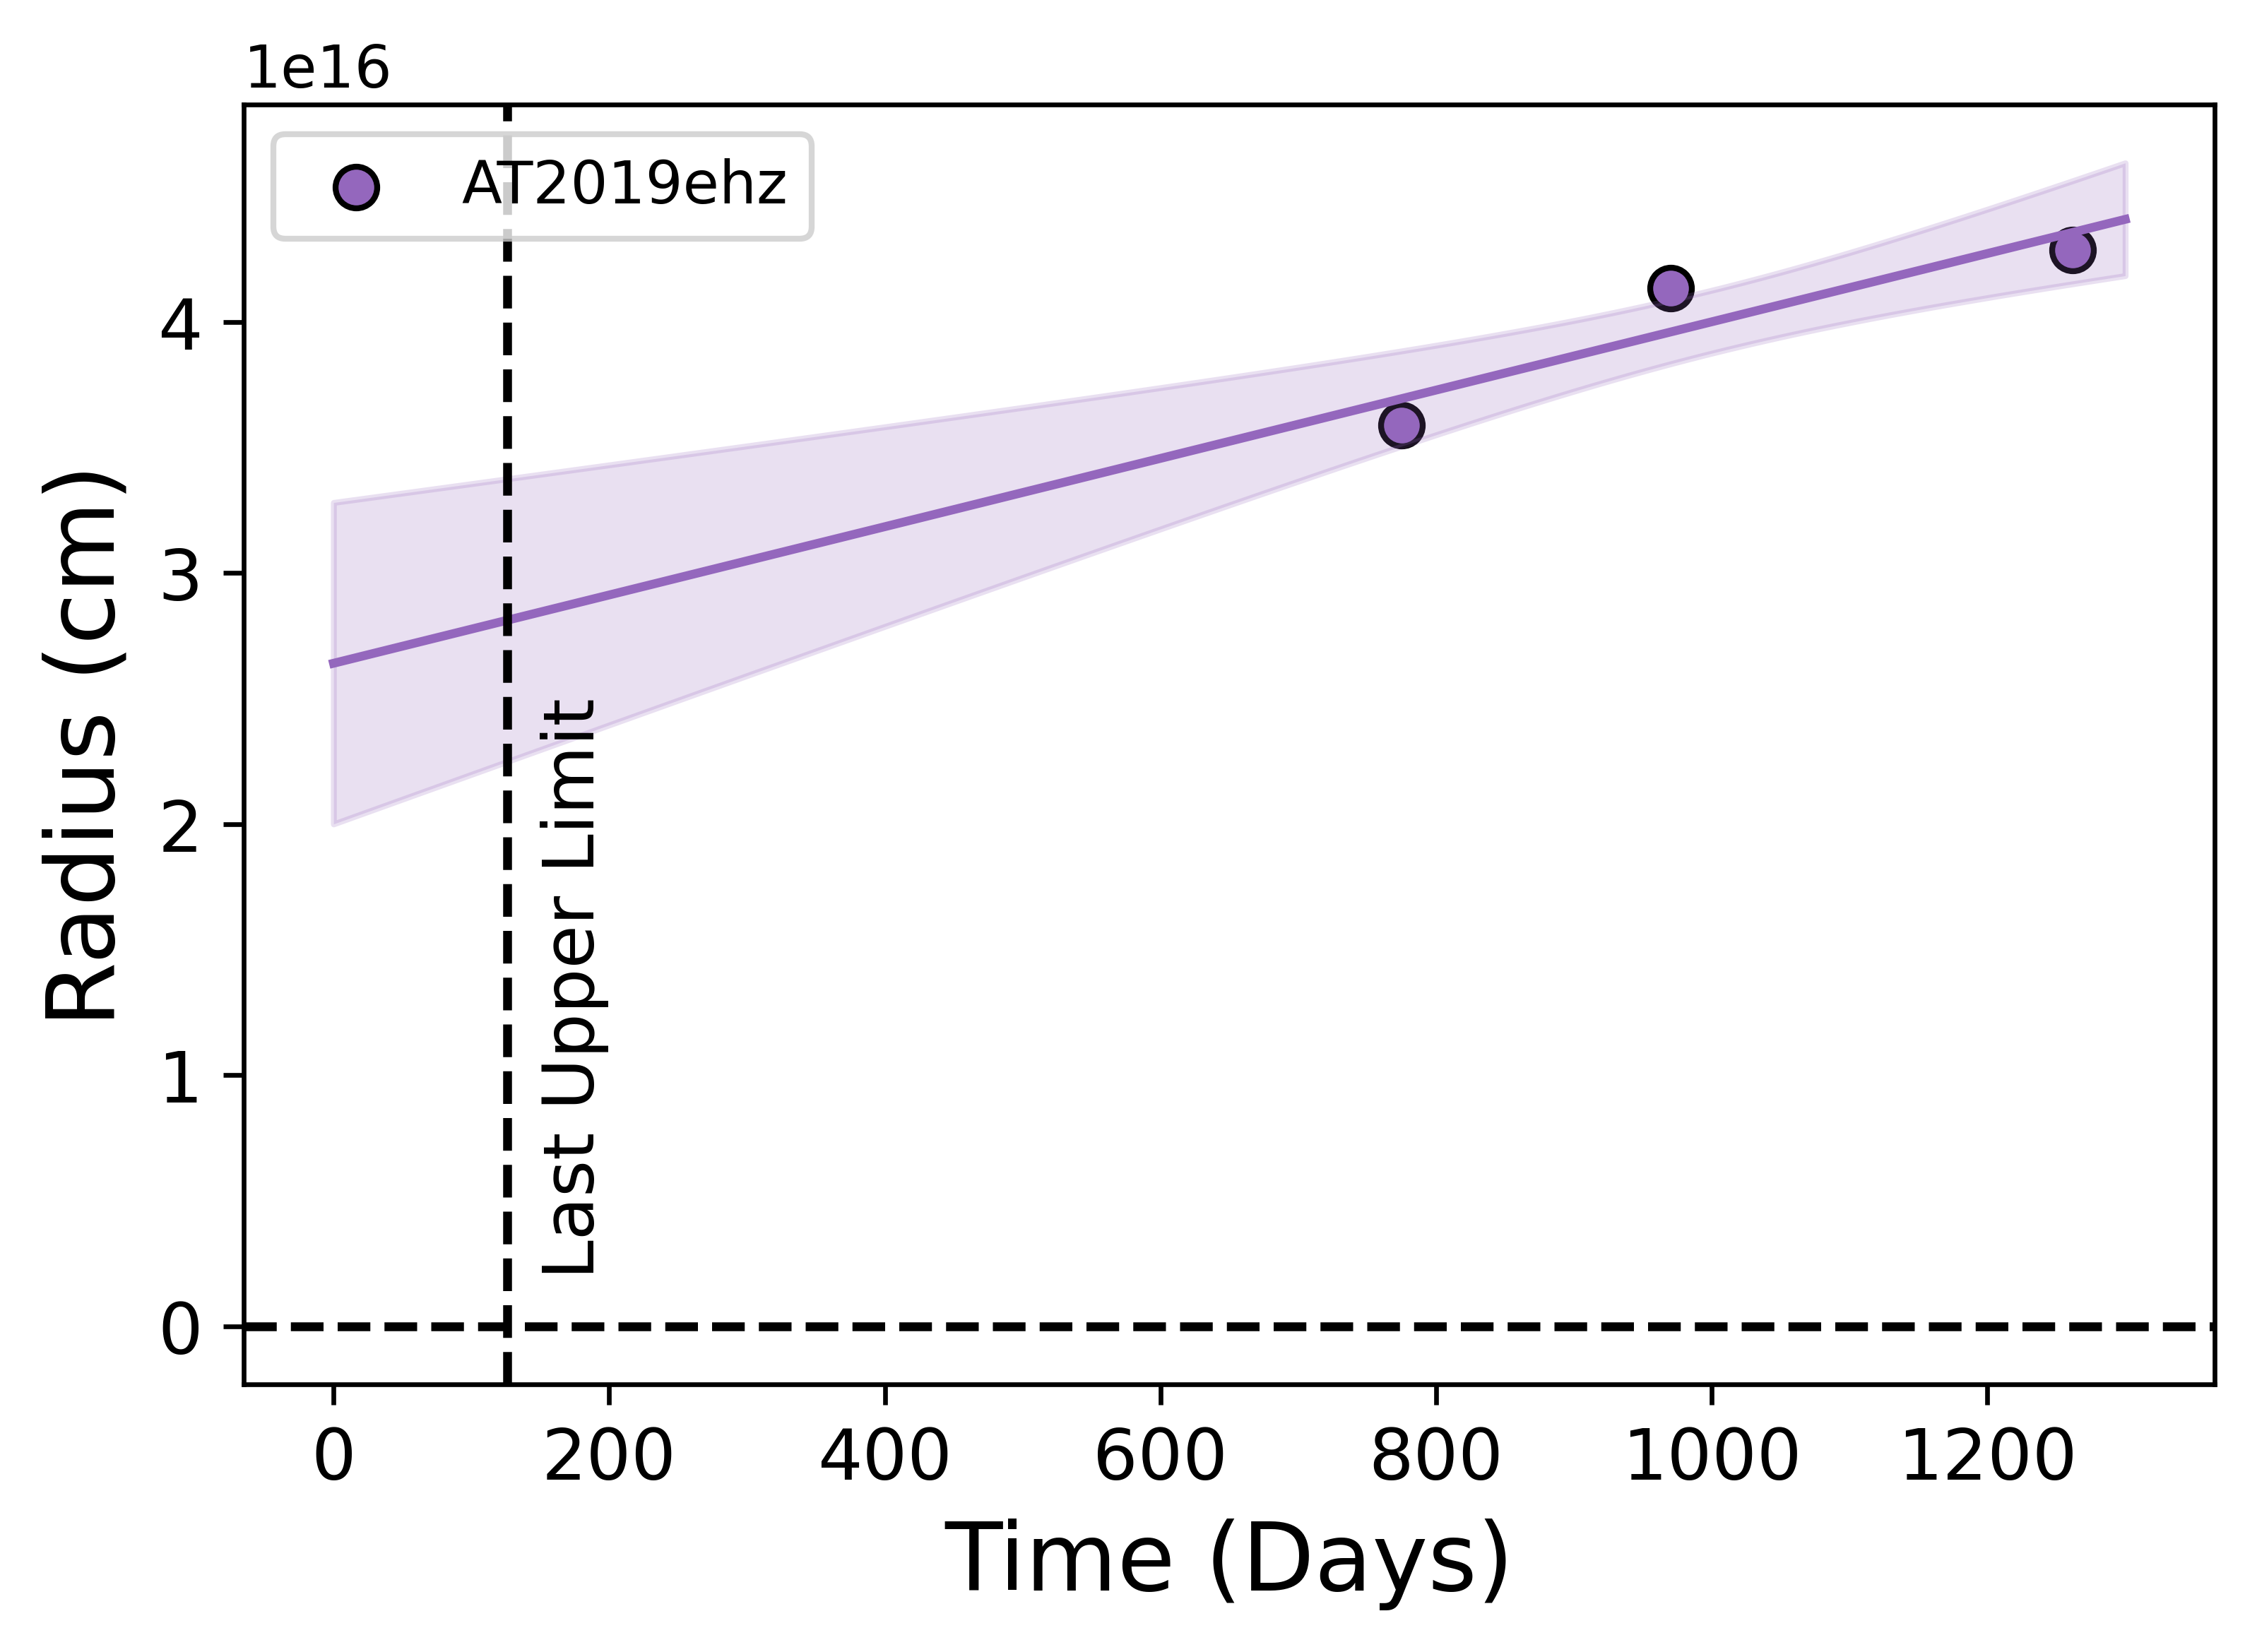
Thus, we estimate the launch dates of the outflows following the method in Cendes et al. (2022b); namely, we fit the radius evolution with a linear trend and determine the timescale at which . This analysis requires multiple SEDs, and so we only carry it out for 5 TDEs (ASASSN-14ae, PS16dtm, AT2018hco, AT2019ehz, AT2019eve). Since all of these TDEs also have an initial single-frequency (6 GHz) detection before an SED was obtained, we extract a rough radius estimate from this first detection by estimating the value of at that time from its later evolution, and calibrating to match the observed 6 GHz flux density. In the case of AT2019eve, the third (latest) SED exhibits a decrease in while remains relatively steady, resulting in a decrease in the inferred radius compared to days earlier. As the first two measured radii for AT2019eve show an increase, and the third SED occurred during a continued decrease of the light curve, we conclude it is more likely to be related to a change in the outflow’s structure related to deceleration, which would not be useful for estimating the launch time of the outflow, and thus do not include this last data point in our calculation. For ASASSN-14ae and PS16dtm, where the peak of emission appears to be below our lowest data point, we extract a rough radius estimate based off the lowest data point directly measured ( GHz in both cases), and assume is fixed at this value throughout our observation.
| TDE | Outflow Start | log() | |||
|---|---|---|---|---|---|
| (d) | (d) | (d) | (Hz) | ||
| TDEs with Launch Times Estimated from Radius Evolution | |||||
| ASASSN-14ae | 2696 | 632 | >0.025 | >10.36 | |
| ASASSN-14ae | 3243 | 1179 | >0.028 | >10.39 | |
| AT2018hco | 1191 | 401 | |||
| AT2018hco | 1311 | 521 | |||
| AT2019eve | 945 | 400 | |||
| AT2019eve | 1102 | 557 | |||
| AT2019eve | 1325 | 780 | |||
| TDEs with Individually Inferred Launch Times | |||||
| iPTF16fnl | 1345 | 1752 | 407 | >0.002 | >9.45 |
| PS16dtm | 984 | 1767 | 783 | >0.030 | >10.30 |
| PS16dtm | 984 | 2291 | 1307 | >0.023 | >10.45 |
| AT2018zr | 1218 | 1743 | 525 | >0.043 | >11.09 |
| AT2019dsg | 561 | 1171 | 610 | ||
| AT2018dyb | 1028 | 1615 | 270 | ||
| AT2019ehz | 400 | 945 | 545 | ||
| AT2019ehz | 400 | 1262 | 862 | ||
| AT2019teq | 351 | 1155 | 804 | >0.080 | >11.51 |
Note. — The outflow start times are in days post optical discovery, where are the original outflow dates using the date since optical detection, and are the revised times of our SED observations relative to the outflow start times.
In Figure 5, we show our fits to the radius data for each TDE (including for reference the date of the last measured upper limit). In all cases, with the exception of AT2019ehz and PS16dtm, we find significant delays in the outflow launch time, of days; see Table 4. Equally important, the inferred time delays are consistent with with the available radio non-detections.
In the case of TDEs with only a single SED, and for AT2019ehz and PS16dtm where our multi-epoch radius analysis did not converge, we instead make individual estimates of the launch date using the observed light curve behavior and prior upper limits. For AT2019dsg and iPTF16fnl, which exhibit a distinct late-time component, we use an outflow launch time corresponding to the dimmest light curve point before the re-brightening, namely 561 days for AT2019dsg and 1345 days for iPTF16fnl. For AT2018zr, with a constraining upper limit at 1218 days, we assume the outflow launched at that time. For PS16dtm, we adopt the last constraining upper limit in radio observations at 984 days. For AT2019teq, with a constraining upper limit at 351 days, we assume the outflow launched at that time. For AT2018dyb, which has brightened by an order of magnitude between our two observations, we assume the outflow launch time corresponds to our initial detection at 1028 days. Finally, for AT2019ehz, which has a data gap of days between the final upper limit and the first detection, we assume that the light curve rose at roughly the same rate as its observed decline, giving an estimated launch time of days. We note that planned future observations of the TDEs with only a single SED will allow us to better refine the outflow launch times.
With the outflow delay estimates we recalcualte the values of and , which are strongly dependent on the chosen launch time (Table 4). We find that this increases the inferred velocities by a factor of , to .
Finally, we note that for all but one TDE, the revised is more in line with the data. Specifically, in most cases if we calculate from the time of optical discovery (Table 3), we would expect a cooling break to be present in the range of frequencies covered by our SEDs. However, no such break is discernible, implying the cooling break is higher than calculated. The exception to this is AT2019ehz, for which an estimated launch date was not possible via a fit to its radius evolution. This discrepancy in , resolves itself once we use shorter in its calculation, however, which implies a delayed outflow. However, other explanations are also possible due to the parameters required to calculate , such as a deviation from equipartition.
5 Discussion
5.1 Outflow and Environment Properties of TDEs with Late Radio Emission
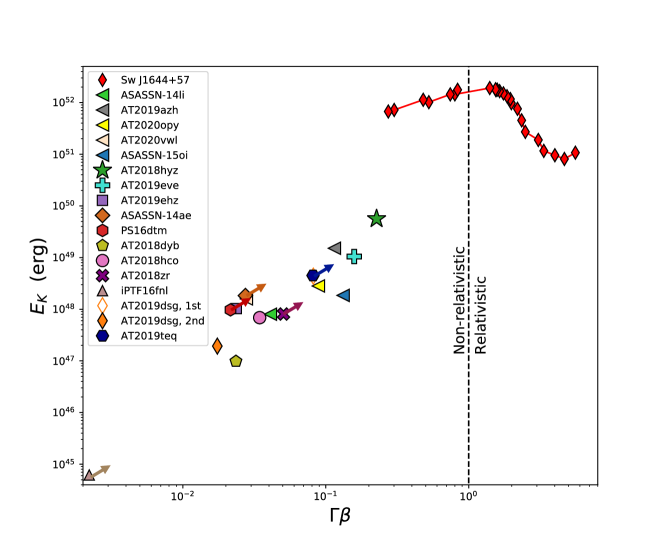
Our equipartition analysis for 8 TDEs with delayed radio emission and 2 TDEs with a second flare allows us to examine their energy and velocity relation, and to compare their properties to TDEs with early radio emission. In Figure 6 we plot the kinetic energy () and velocity () for all known optical TDEs with radio detections for which a similar analysis has been carried out, using the highest energy inferred in those sources (Cendes et al., 2021a; Stein et al., 2021; Alexander et al., 2016; Goodwin et al., 2022; Zauderer et al., 2011; Cendes et al., 2021b; Goodwin et al., 2023c; Cendes et al., 2022b). We also include the jetted, non-optical TDE Sw1644+57 for reference (Eftekhari et al., 2018; Cendes et al., 2021b). For TDEs where we obtained lower limits for these values, we include an arrow in the direction of the allowable phase space. For TDEs with late emission, with the exception of iPTF16fnl (which had a lower limit at erg and ), we find they span erg, and . Overall, we find the majority of the TDE population in our sample show velocity and energy values similar to that seen in a broader population of TDEs with non-relativistic outflows that have emission at early times (; i.e., Cendes et al., 2021a; Alexander et al., 2016).
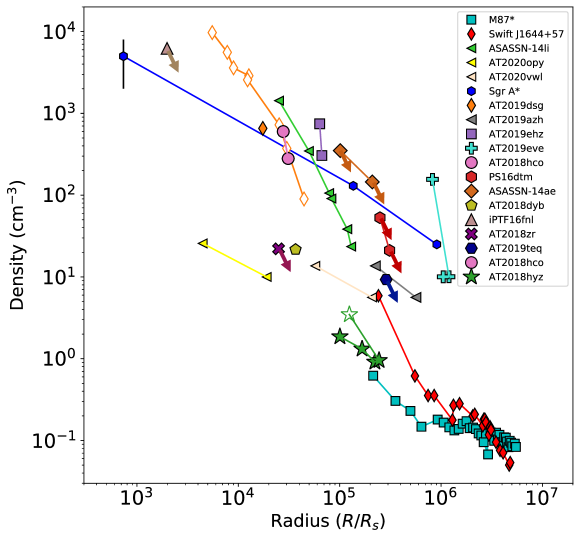
In Figure 7 we show the inferred ambient density for each TDE as a function of radius (scaled by the Schwarzschild radius) for TDEs in our sample and previously studied radio-emitting TDEs. Here we use the mass for each BH inferred from optical data (Nicholl et al., 2019; Yao & Guolo, 2022; Goodwin et al., 2022, 2023c; Leloudas et al., 2019; Blagorodnova et al., 2017; Hammerstein et al., 2023). In the cases of TDEs where we have upper limits on density and lower limit on radius, we include an arrow in the direction of the allowable phase space. We find that the densities probed are consistent with the densities and circumnuclear density profiles of previous TDEs, and are more dense than the low density environment of M87∗. Crucially, we do not infer an unusually high density for any TDEs in our sample, which might be expected if the radio emission was delayed due to rapid shift from low to high density.
As many of our light curves are still rising, this implies that the blast wave is still in the free expansion phase (with constant). In this case, the mass of the swept-up material, , would be less than the mass of the ejecta, . Using the inferred ambient densities, kinetic energies, and velocities inferred from the equipartition analysis we verify that for all TDEs except for AT2019eve, where in the first observation at 945 days and in our second observation at 1102 days. Given the steady fading light curve of AT2019eve during this time period, we conclude AT2019eve is no longer in free expansion.
We can consider the case of the X-ray TDE IGRJ12580+0134, which had a radio-only flare observed days after peak (Perlman et al., 2022). Perlman et al. (2022) interpret this flare is most likely due to a jet outflow encountering a circumnuclear (CNM) cloud at cm from a black hole (Irwin et al., 2015), where the density increases from a background of cm-3 to cm-3. These densities would be lower than what we sample in our TDE population and at larger radii than we probe in our work (, and the outflow velocity of is higher than what we infer for all our TDEs. However, as (Perlman et al., 2022) notes theirs is a simplified model with several degeneracies, and other values may fit the data.
5.2 Off-Axis Jets
We explore the possibility that the late radio emission is due to relativistic jets with an off-axis viewing orientation. First, we note that if the origin of delayed radio emission was off-axis relativistic jets, then the inevitable conclusion based on our detection statistics (§3.2) is that about half of all optically-selected TDEs harbor off-axis jets. This conclusion, which would indicate a rate of Gpc-3 yr-1 (using the optical TDE rate from van Velzen 2018) is in strong conflict with the rate of on-axis relativistic jets determined from -rays and optical detections (Andreoni et al., 2022; Brown et al., 2015) of Gpc-3 yr-1 and a beaming correction factor of .
Further, we can consider two possible off-axis jet scenarios: (i) an initially off-axis relativistic jet that has decelerated to a non-relativistic velocity and spread to roughly spherical geometry, which is mainly relevant for TDEs in our sample in which we have observed the light curves peak and decline; and (ii) an off-axis jet that remains collimated and oriented off-axis, which is potentially relevant for TDEs in which the radio emission is still rising (e.g., (Matsumoto & Piran, 2023)).
In the first scenario, the time at which the radio emission peaks is given by the deceleration time (e.g., Nakar & Piran 2011):
| (8) |
where is the initial velocity, which for an off-axis relativistic jet is . Using the results of our equipartition analysis (§4.2), we find days for all TDEs in our sample, which is substantially smaller than the observed peak timescales of days. This agrees with the much lower luminosities compared to Sw1644+57, which became non-relativistic at a comparable timescale of d (Eftekhari et al., 2018). In particular, several of the TDEs in our sample (i.e., PS16dtm, AT2018hco, AT2019ehz, and AT2019eve) peaked at days with luminosities of erg s-1, about two to three orders of magnitude below Sw1644+57. These TDEs consistently have values of and have already peaked, so following the formalism of Matsumoto & Piran (2023) and Beniamini et al. (2023) we conclude that they cannot be off-axis jets since they do not cross the threshold of required for a decelerating off-axis jet.
The second scenario involves the possibility of a decelerating off-axis jet that remains collimated with the emitting area increasing over time, as suggested for the delayed rapid rise in AT2018hyz by Matsumoto & Piran (2023) and Sfaradi et al. (2023). In updated work, Beniamini et al. (2023) proposes a threshold of below which two solutions exist: a non-relativistic spherical outflow, and an off-axis relativistic jet. Critically, in the latter scenario, as the jet decelerates and the emission area grows, the outflow will eventually exceed the threshold value. For the TDEs in our sample with rising light curves (i.e., ASASSN-14ae, AT2018dyb, AT2018zr) we find values for . Since these sources still exhibit rising emission, continued monitoring will establish whether they ever cross the threshold value of . However, this is unlikely given their current evolution. For example, in the case of ASASSN-14ae, which is rising rapidly after a long delay of days, we find that with its current evolution (, ) it is expected to follow , and hence will cross the threshold of 0.23 (0.44) in () years given the current value of ; at that point it will reach a peak luminosity of erg s-1, much in excess of the peak lumiosity of Sw1644+57. Similar conclusions are reached for AT2018dyb and AT2018zr, which begin rising at days.
We next note the cases of iPTF16fnl and AT2019dsg, which exhibit early radio emission (i.e., peaking at days) and then rapidly rise again a second time. We could envision a scenario in which these TDEs produced both a spherical non-relativistic outflow that dominates the early radio emission, and an off-axis relativistic jet. The inferred velocities for both TDEs is low, , and hence they are again unlikely to eventually cross the threshold of expected for an off-axis jet. As for the other TDEs with rising light curves, continued monitoring of iPTF16fnl and AT2019dsg will elucidate the origin of their emission.
Thus, we conclude based on the measured radio properties (timescales and luminosities), the inferred physical properties (velocities), and the rate of TDEs with late radio emission that off-axis jets are an unlikely explanation for this population.
5.3 Origin of Delayed Outflows
There are at least two broad possibilities for the origin of the delayed mildly relativistic outflow, both of which connect to its assumed origin in a fast outflow from the innermost regions of the black hole accretion flow.
One possibility is that the delayed radio emission is due to the timescales for debris circularization and viscous accretion (Hayasaki & Jonker, 2021). In this scenario, the first stream-stream collisions produce the optical/UV flare, creating a debris-circularized ring. The ring then evolves viscous-diffusively, and reaches the innermost stable circular orbit (ISCO) on a timescale of months to years after the initial flare, consistent with the timescale we infer for our TDEs. However, with a disk wind velocity of , this is inconsistent with the velocities we infer for our TDEs, although may be possible to achieve if the outflow mass was very low or the radius for the ISCO was exceptionally large.
Alternately, it is also possible that the formation of a jet or fast wind from the inner accretion flow is delayed because the SMBH accretion rate does not peak on the same timescale as the mass fall-back rate. Because the debris from the TDE is weakly bound to the SMBH, its natural configuration is a large quasi-spherical envelope (e.g., Loeb & Ulmer 1997; Coughlin & Begelman 2014), which must cool and radially contract to form an accretion disk (e.g., Metzger 2022). If accretion onto the SMBH supplies energy to the envelope (with an efficiency ), full contraction of the envelope can be delayed for a time, up to 700 days (e.g., Loeb & Ulmer 1997), in agreement with the time scales of the outflows measured in this work. Thus, we see that disk formation can be delayed for hundreds to thousands of days, providing an alternative explanation for late-onset radio-generating outflows from the SMBH (Metzger, 2022). This model also appears to provide a good description of the multi-wavelength properties of ASASSN-15oi (Hajela et al. in prep). As another alternative possibility, the escape of a jet from the vicinity of the black hole may be delayed until processes within the accretion flow align the angular momentum axis of the accretion disk and the jet to the black hole spin axis (Teboul & Metzger, 2023).
6 Conclusions
We presented radio observations for 23 optically-discovered TDEs on timescales of days post-discovery. We detected radio emission from 17 of these TDEs, of which 6 had an ambiguous or host/AGN origin. Of the 11 TDEs with transient radio emission, 9 TDEs were detected for the first time despite a lack of radio emission at earlier times, and 2 TDEs (AT2019dsg and iPTF16fnl) were detected to significantly brighten at late time relative to their declining radio emission at earlier times; these late-time components are similar to what has been found in ASASSN-15oi and AT2020vwl (Horesh et al., 2021a; Goodwin et al., 2023b, a). Based on this large sample, our key results are:
-
•
We find of TDEs in this work show late-time emission, meaning a substantial fraction of all optically-selected TDEs exhibit radio emission that rises on timescales of hundreds of days.
-
•
The range of luminosities for this sample is erg s-1, though in some cases this is a lower limit because emission is still rising.
-
•
We find radio emission in this population peaks at time scales d, though note some are lower limits as emission is still rising.
-
•
Multi-frequency SEDs reveal a range of peak frequencies of GHz to GHz. Using the SED information we determine the outflow physical properties assuming equipartition. We find cm and erg.
-
•
Using the radius evolution when available, and the light curve behavior otherwise, we infer outflow launch timescales of days. This then leads to inferred velocities of .
-
•
From the equipartition analysis we also infer circumnuclear densities of cm-3. These densities are comparable to those inferred for TDEs with early radio emission.
-
•
We rule out off-axis relativistic jets as an explanation for the bulk of the TDEs with late radio emission, and conclude delayed outflows are a more likely explanation. If this delay is due to delayed disk formation, then the relative formation timescale inferred from our data is days.
Our study highlights that persistent radio monitoring of TDEs starting after discovery and lasting for several years is critical for determining the timing of ourflow formation, and its subsequent evolution; this includes TDEs that exhibit radio emission at early time, but which may re-brighten subsequently. Additionally, multi-frequency observations, extending below GHz, are crucial for determining the outflow properties (energy, velocity) and the ambient density. As demonstrated here, these observations are within reach for TDEs at modest distances with existing facilities (VLA, ATCA, MeerKAT). In the future, much larger samples of TDEs (typically at larger distances) from the Vera C. Rubin Observatory Legacy Survey of Space and Time (LSST) will be effectively studied with the next-generation Square Kilometer Array and the next-generation VLA.
| Object | Telescope | Project Code/ | Date of Observation | Frequency | Flux Density | |
|---|---|---|---|---|---|---|
| Source | (d) | (GHz) | (mJy) | |||
| iPTF16fnl | VLA | 20A-492 | 2020 May 24 | 1365 | 6 | 0.045 0.001 |
| — | 21A-303 | 2021 Jun 15 | 1752 | 3 | 0.514 | |
| — | — | — | — | 5 | 0.028 0.008 | |
| — | — | — | — | 7 | 0.031 0.007 | |
| — | — | — | — | 9 | 0.024 0.006 | |
| — | — | — | — | 11 | 0.023 0.008 | |
| AT2019dsg | VLA | 21A-303 | 2021 Jun 12 | 796 | 1.25 | 0.514 |
| — | — | — | — | 1.75 | 0.114 0.033 | |
| — | — | — | — | 2.5 | 0.235 0.026 | |
| — | — | — | — | 3.5 | 0.201 0.014 | |
| — | — | — | — | 5 | 0.209 0.014 | |
| — | — | — | — | 7 | 0.132 0.013 | |
| MeerKAT | SCI-20220822-YC-01 | 2023 Jan 15 | 1378 | 0.88 | 0.284 0.041 | |
| — | — | — | — | 1.36 | 0.384 0.026 | |
| VLA | VLASS 3 | 2023 Jan 31 | 1404 | 3 | 0.386 | |
| MeerKAT | SCI-20220822-MB-03 | 2023 Mar 5 | 1437 | 1.36 | 0.228 0.016 | |
| ASASSN-14ae | VLA | 15B-247 | 2016 Mar 12 | 778 | 5 | 0.033 |
| — | VLASS 1 | 2019 Nov 19 | 2122 | 6 | 0.420 | |
| — | 20A-492 | 2020 May 25 | 2313 | 6 | 0.090 0.015 | |
| — | 21A-303 | 2021 Jun 12 | 2696 | 3 | 0.334 0.038 | |
| — | — | — | — | 5 | 0.222 0.018 | |
| — | — | — | — | 7 | 0.169 0.007 | |
| — | — | — | — | 9 | 0.155 0.010 | |
| — | — | — | — | 11 | 0.150 0.001 | |
| — | VLASS 2 | 2021 Dec 4 | 2608 | 3 | 0.47 | |
| — | 22B-205 | 2022 Dec 11 | 3243 | 1.25 | 3.12 | |
| — | — | — | — | 1.75 | 0.720 0.041 | |
| — | — | — | — | 2.5 | 0.680 0.029 | |
| — | — | — | — | 3.5 | 0.604 0.017 | |
| — | — | — | — | 5 | 0.418 0.080 | |
| — | — | — | — | 7 | 0.446 0.011 | |
| — | — | — | — | 9 | 0.382 0.020 | |
| — | — | — | — | 11 | 0.361 0.025 | |
| — | — | — | — | 13.5 | 0.347 0.015 | |
| — | — | — | — | 16.5 | 0.337 0.022 | |
| — | — | — | — | 20 | 0.303 0.015 | |
| — | — | — | — | 24 | 0.343 0.014 | |
| PS16dtm | VLA | 16B-398 | 2016 Sept 22 | 54 | 15.5 | 0.069 |
| — | — | 2016 Dec 21 | 144 | 6 | 0.075 | |
| — | — | 2017 Jun 4 | 326 | 3 | 0.0132 | |
| — | — | 2017 Aug 22 | 372 | 6 | 0.015 | |
| ASKAP | 2019 Jun 16 | 984 | 0.887 | 1.002 0.015 | ||
| VLA | 20A-492 | 2020 Jun 6 | 1405 | 6 | 0.021 0.008 | |
| — | VLASS 2 | 2020 Sept 4 | 1485 | 3 | 0.845 | |
| — | 21A-303 | 2021 Jun 14 | 1767 | 3 | 0.361 0.076 | |
| — | — | — | — | 5 | 0.285 0.013 | |
| — | — | — | — | 7 | 0.260 0.009 | |
| — | — | — | — | 9 | 0.256 0.010 | |
| — | — | — | — | 11 | 0.228 0.009 | |
| — | 22B-205 | 2022 Nov 23 | 2291 | 1.25 | 0.767 | |
| — | — | — | — | 1.75 | 0.193 0.047 | |
| — | — | — | — | 3.0 | 0.210 0.058 | |
| — | — | — | — | 6 | 0.163 0.012 | |
| — | — | — | — | 10 | 0.089 0.015 | |
| — | — | — | — | 15 | 0.086 0.008 | |
| — | — | — | — | 20 | 0.053 0.012 | |
| — | — | — | — | 24 | 0.039 0.011 | |
| AT2018zr | VLA | 20A-492 | 2020 Aug 23 | 929 | 6 | 0.014 |
| VLA | 21A-303 | 2021 Jun 18 | 1218 | 6 | 0.053 | |
| — | 22B-205 | 2022 Oct 16 | 1218 | 6 | 0.147 0.011 | |
| — | — | 2022 Dec 8 | 1713 | 1.25 | 0.749 | |
| — | — | — | — | 1.75 | 0.218 0.041 | |
| — | — | — | — | 2.5 | 0.209 0.032 | |
| — | — | — | — | 3.5 | 0.180 0.001 | |
| — | — | — | — | 5 | 0.155 0.018 | |
| — | — | — | — | 7 | 0.109 0.015 | |
| — | — | — | — | 9 | 0.088 0.016 | |
| — | — | — | — | 11 | 0.085 0.012 | |
| AT2020neh | VLA | 20A-372 | 2020 Jun 19 | 12 | 1 5 | 0.018 |
| — | — | 2020 Dec 31 | 196 | 6 | 0.016 | |
| — | 22B-205 | 2022 Nov 9 | 874 | 6 | 0.026 0.006 | |
| — | — | 2022 Dec 10 | 905 | 6 | 0.053 0.012 | |
| AT2018dyb | MeerKAT | SCI-20210212-YC-01 | 2021 May 4 | 1028 | 1.36 | 0.158 0.045 |
| MeerKAT | SCI-20220822-YC-01 | 2022 Dec 11 | 1615 | 1.36 | 1.031 0.068 | |
| ATCA | C3325 | 2023 Jan 22 | 1657 | 2.1 | 1.15 0.07 | |
| — | — | — | — | 5.5 | 0.50 0.04 | |
| — | — | — | — | 9 | 0.27 0.03 | |
| AT2018hco | VLA | 18A-373 | 2018 Dec 5 | 62 | 6 | 0.0165 |
| — | VLASS 1 | 2019 May 5 | 213 | 3 | 0.3 | |
| — | 21A-303 | 2021 June 12 | 982 | 6 | 0.343 0.015 | |
| — | VLASS 2 | 2021 Oct 14 | 1106 | 3 | 0.436 0.142 | |
| — | 21B-360 | 2022 Jan 7 | 1191 | 1.5 | 0.329 | |
| — | — | — | — | 2.5 | 0.166 0.030 | |
| — | — | — | — | 3.5 | 0.252 0.011 | |
| — | — | — | — | 5 | 0.265 0.014 | |
| — | — | — | — | 7 | 0.227 0.014 | |
| — | — | — | — | 9 | 0.161 0.010 | |
| — | — | — | — | 11 | 0.371 0.015 | |
| ATCA | — | 2022 Apr 30 | 1311 | 2.1 | ||
| — | — | — | — | 5.5 | 0.200 0.019 | |
| — | — | — | — | 9 | 0.111 0.019 | |
| — | — | — | — | 17 | ||
| — | — | — | — | 19 | 0.141 | |
| MeerKAT | SCI-20210212-YC-01 | 2022 May 7 | 1312 | 0.88 | ||
| — | — | — | — | 1.36 | 0.171 0.025 | |
| AT2019ehz | VLA | VLASS 1 | 2017 Dec 1 | -515 | 3 | 0.39 |
| — | 19A-395 | 2019 May 21 | 23 | 9 | .06 | |
| — | 19A-395 | 2019 June 14 | 47 | 9 | .026 | |
| — | VLASS 2 | 2019 Sept 1 | 126 | 3 | 0.3 | |
| — | 21A-303 | 2021 June 11 | 775 | 6 | 1.071 0.032 | |
| — | 21B-360 | 2021 Dec 23 | 970 | 1.5 | 0.237 | |
| — | — | — | — | 2.5 | 0.156 0.070 | |
| — | — | — | — | 3.5 | 0.396 0.046 | |
| — | — | — | — | 5 | 0.733 0.041 | |
| — | — | — | — | 7 | 0.485 0.059 | |
| — | — | — | — | 9 | 0.401 0.014 | |
| — | — | — | — | 11 | 0.338 0.015 | |
| — | — | — | — | 14 | 0.322 0.015 | |
| — | — | — | — | 17 | 0.200 0.012 | |
| — | — | — | — | 20 | 0.092 0.016 | |
| — | — | — | — | 24 | 0.077 0.014 | |
| — | 22B-205 | 2022 Oct 7 | 1262 | 1.5 | 0.335 | |
| — | — | — | — | 2.5 | 0.245 0.026 | |
| — | — | — | — | 3.5 | 0.309 0.010 | |
| — | — | — | — | 5 | 0.205 0.032 | |
| — | — | — | — | 7 | 0.235 0.018 | |
| — | — | — | — | 9 | 0.184 0.013 | |
| — | — | — | — | 11 | 0.111 0.015 | |
| AT2019eve | VLA | VLASS 1 | 2017 Oct 28 | -555 | 3 | 0.3 |
| — | VLASS 2 | 2020 Oct 11 | 526 | 3 | .0.497 | |
| — | 21A-303 | 2021 June 11 | 769 | 6 | 0.766 0.009 | |
| — | 22B-360 | 2021 Dec 4 | 945 | 1.25 | 0.852 0.120 | |
| — | — | — | — | 1.75 | 0.978 0.053 | |
| — | — | — | — | 2.5 | 0.949 0.039 | |
| — | — | — | — | 3.5 | 0.847 0.020 | |
| — | — | — | — | 5 | 0.657 0.022 | |
| — | — | — | — | 7 | 0.484 0.024 | |
| — | — | — | — | 9 | 0.385 0.034 | |
| — | — | — | — | 11 | 0.222 0.023 | |
| — | — | — | — | 13.5 | 0.161 0.023 | |
| — | — | — | — | 16.5 | 0.171 0.015 | |
| — | — | — | — | 20 | 0.182 0.011 | |
| — | — | — | — | 24 | 0.123 0.012 | |
| MeerKAT | DDT-20220414-YC-01 | 2022 May 5 | 1103 | 0.88 | 0.702 0.040 | |
| — | — | — | — | 1.36 | 1.053 0.020 | |
| ATCA | C3472 | 2022 Apr 30 | 1092 | 2.1 | 0.770 0.061 | |
| — | — | — | — | 5.5 | 0.543 0.025 | |
| — | — | — | — | 9 | 0.300 0.013 | |
| — | — | — | — | 17 | 0.122 0.032 | |
| — | — | — | — | 19 | .243 | |
| — | 22B-205 | 2022 Dec 19 | 1325 | 1.25 | 0.846 0.175 | |
| — | — | — | — | 1.75 | 0.735 0.048 | |
| — | — | — | — | 2.5 | 0.553 0.028 | |
| — | — | — | — | 3.5 | 0.567 0.018 | |
| — | — | — | — | 5 | 0.430 0.020 | |
| — | — | — | — | 7 | 0.392 0.015 | |
| — | — | — | — | 9 | 0.272 0.019 | |
| — | — | — | — | 11 | 6 | |
| — | — | — | — | 13.5 | 4.2 | |
| — | — | — | — | 16.5 | 0.205 0.010 | |
| — | — | — | — | 20 | 0.076 0.020 | |
| — | — | — | — | 24 | 0.104 0.016 | |
| MeerKAT | SCI-20220822-YC-01 | 2023 Jan 4 | 1343 | 0.88 | 0.702 0.040 | |
| AT2019teq | VLA | VLASS 2 | 2020 Aug 13 | 351 | 3 | 0.238 |
| — | 22B-205 | 2022 Oct 19 | 1096 | 6 | 0.238 0.008 | |
| — | — | 2022 Dec 17 | 1155 | 1.25 | 0.492 0.088 | |
| — | — | — | — | 1.75 | 0.430 0.054 | |
| — | — | — | — | 2.5 | 0.283 0.051 | |
| — | — | — | — | 3.5 | 0.268 0.017 | |
| — | — | — | — | 5 | 0.159 0.023 | |
| — | — | — | — | 7 | 0.064 0.015 | |
| — | — | — | — | 9 | 0.069 | |
| — | — | — | — | 11 | 0.046 0.018 | |
| DES14C1kia | VLA | 14B-506 | 2015 Jan 17 | 68 | 6 | |
| — | — | 2015 Jan 17 | 68 | 21.7 | ||
| — | — | 2015 Mar 12 | 122 | 6 | ||
| — | — | 2015 Mar 12 | 122 | 21.7 | ||
| VLA | 20A-492 | 2020 May 28 | 2026 | 6 | ||
| iPTF15af | VLA | 14A-483 | 2015 Jan 31 | 17 | 6.1 | 0.084 |
| — | 20A-492 | 2020 Jun 6 | 1970 | 6 | 0.017 | |
| — | 22B-205 | 2022 Oct 25 | 2841 | 6 | 0.008 | |
| iPTF16axa | VLA | 21A-303 | 2021 Jun 17 | 1846 | 6 | 0.011 |
| — | 22B-205 | 2022 Oct 25 | 2841 | 6 | 0.017 | |
| AT2017eqx | VLA | 20A-492 | 2020 May 25 | 1090 | 6 | 0.018 |
| — | 22B-205 | 2022 Oct 7 | 1955 | 6 | 0.011 | |
| AT2018fyk | MeerKAT | SCI-20210212-YC-01 | 2021 May 8 | 973 | 1.36 | 0.060 |
| — | SCI-20220822-YC-01 | 2023 Jan 25 | 1601 | 1.36 | 0.083 | |
| AT2018lna | VLA | 21A-303 | 2021 Jun 20 | 906 | 6 | 0.018 |
| — | 22B-205 | 2022 Dec 8 | 1442 | 6 | 0.012 |
Note. — Upper limits quoted as . This table only includes previously unpublished data for these TDEs; for published observations see Section 3.1.1. We note that the uncertainties listed in this table are statistical only and do not include an expected systematic uncertainty in the overall flux density calibration, which is taken into account in the equipartition analysis (Section 4.2).
| Object | Telescope | Project Code/ | Date of Observation | Frequency | Flux Density | |
|---|---|---|---|---|---|---|
| Source | (d) | (GHz) | (mJy) | |||
| OGLE17aaj | ASKAP | VAST | 2020 May 9 | 1224 | 1.42 | <0.3 |
| — | — | 2020 May 16 | 1230 | 1.42 | <0.3 | |
| — | — | 2021 Apr 9 | 1391 | 1.42 | <0.3 | |
| MeerKAT | — | 2021 May 1 | 1581 | 1.36 | 0.193 0.020 | |
| ATCA | C3472 | 2022 Apr 9 | 1924 | 2.1 | <0.156 | |
| — | — | — | — | 5.5 | <0.057 | |
| — | — | — | — | 9 | <0.045 | |
| — | — | — | — | 17 | <0.087 | |
| — | — | — | — | 19 | <0.126 | |
| MeerKAT | DDT-20220414-YC-01 | 2022 Apr 16 | 1931 | 0.82 | 0.290 0.030 | |
| — | — | — | — | 1.36 | 0.215 0.023 | |
| — | SCI-20220822-YC-01 | 2022 Nov 24 | 2153 | 0.824 | 0.252 0.05 | |
| — | — | 2022 Dec 3 | 2161 | 1.36 | 0.249 0.023 | |
| — | — | 2023 Jan 5 | 2195 | 0.82 | 0.231 0.025 | |
| AT2018bsi | VLA | 21A-303 | 2021 Jun 20 | 1169 | 6 | 0.013 |
| — | 22B-205 | 2022 Dec 8 | 1705 | 6 | 0.037 0.005 | |
| AT2018hyz | VLA | VLASS 3 | 2023 Feb 7 | 1578 | 3 | 16.838 0.205 |
| AT2020nov | VLA | 20A-372 | 2020 Oct 16 | 111 | 15 | 0.224 0.009 |
| — | — | 2021 Feb 10 | 228 | 6 | 0.376 0.010 | |
| — | — | 2021 Feb 28 | 246 | 6 | 0.370 0.010 | |
| VLA | 22B-205 | 2022 Nov 13 | 869 | 6 | 0.366 0.019 | |
| AT2020mot | VLA | 22B-205 | 2022 Nov 18 | 887 | 6 | 0.086 0.008 |
| AT2020pj | VLA | VLASS 1 | 2020 Sept 19 | 261 | 3 | .0.465 |
| — | 22B-205 | 2022 Oct 28 | 1030 | 6 | 0.118 0.006 | |
| — | — | 2022 Dec 15 | 1078 | 6 | 0.093 0.011 | |
| — | VLASS 2 | 2023 Jan 24 | 1118 | 3 | .0.454 | |
| AT2020wey | VLA | 20A-372 | 2020 Oct 30 | 22 | 15 | 0.014 |
| — | — | 2021 Feb 13 | 128 | 6 | 0.408 0.081 | |
| — | 22B-205 | 2022 Oct 7 | 729 | 6 | 0.018 |
Note. — Upper limits quoted as . We note that the uncertainties listed in this table are statistical only and do not include an expected systematic uncertainty in the overall flux density calibration, which is taken into account in the equipartition analysis (Section 4.2).
References
- Alexander et al. (2016) Alexander, K. D., Berger, E., Guillochon, J., Zauderer, B. A., & Williams, P. K. G. 2016, ApJ, 819, L25, doi: 10.3847/2041-8205/819/2/L25
- Alexander et al. (2020) Alexander, K. D., van Velzen, S., Horesh, A., & Zauderer, B. A. 2020, Space Sci. Rev., 216, 81, doi: 10.1007/s11214-020-00702-w
- Andreoni et al. (2022) Andreoni, I., Coughlin, M. W., Perley, D. A., et al. 2022, Nature, 612, 430, doi: 10.1038/s41586-022-05465-8
- Angus et al. (2022) Angus, C. R., Baldassare, V. F., Mockler, B., et al. 2022, Nature Astronomy, 6, 1452, doi: 10.1038/s41550-022-01811-y
- Baganoff et al. (2003) Baganoff, F. K., Maeda, Y., Morris, M., et al. 2003, ApJ, 591, 891, doi: 10.1086/375145
- Barniol Duran et al. (2013) Barniol Duran, R., Nakar, E., & Piran, T. 2013, ApJ, 772, 78, doi: 10.1088/0004-637X/772/1/78
- Beniamini et al. (2023) Beniamini, P., Piran, T., & Matsumoto, T. 2023, arXiv e-prints, arXiv:2305.06370. https://arxiv.org/abs/2305.06370
- Berger et al. (2012) Berger, E., Zauderer, A., Pooley, G. G., et al. 2012, ApJ, 748, 36, doi: 10.1088/0004-637X/748/1/36
- Blagorodnova et al. (2017) Blagorodnova, N., Gezari, S., Hung, T., et al. 2017, ApJ, 844, 46, doi: 10.3847/1538-4357/aa7579
- Blagorodnova et al. (2019) Blagorodnova, N., Cenko, S. B., Kulkarni, S. R., et al. 2019, ApJ, 873, 92, doi: 10.3847/1538-4357/ab04b0
- Blanchard et al. (2017) Blanchard, P. K., Nicholl, M., Berger, E., et al. 2017, ApJ, 843, 106, doi: 10.3847/1538-4357/aa77f7
- Brown et al. (2015) Brown, G. C., Levan, A. J., Stanway, E. R., et al. 2015, MNRAS, 452, 4297, doi: 10.1093/mnras/stv1520
- Cendes et al. (2022a) Cendes, Y., Alexander, K., Berger, E., et al. 2022a, The Astronomer’s Telegram, 15728, 1
- Cendes et al. (2021a) Cendes, Y., Alexander, K. D., Berger, E., et al. 2021a, ApJ, 919, 127, doi: 10.3847/1538-4357/ac110a
- Cendes et al. (2021b) Cendes, Y., Eftekhari, T., Berger, E., & Polisensky, E. 2021b, ApJ, 908, 125, doi: 10.3847/1538-4357/abd323
- Cendes et al. (2022b) Cendes, Y., Berger, E., Alexander, K. D., et al. 2022b, ApJ, 938, 28, doi: 10.3847/1538-4357/ac88d0
- Condon et al. (1998) Condon, J. J., Cotton, W. D., Greisen, E. W., et al. 1998, AJ, 115, 1693, doi: 10.1086/300337
- Coughlin & Begelman (2014) Coughlin, E. R., & Begelman, M. C. 2014, ApJ, 797, 103, doi: 10.1088/0004-637X/797/2/103
- De Colle et al. (2012) De Colle, F., Guillochon, J., Naiman, J., & Ramirez-Ruiz, E. 2012, ApJ, 760, 103, doi: 10.1088/0004-637X/760/2/103
- Eftekhari et al. (2018) Eftekhari, T., Berger, E., Zauderer, B. A., Margutti, R., & Alexander, K. D. 2018, ApJ, 854, 86, doi: 10.3847/1538-4357/aaa8e0
- Foley et al. (2015) Foley, R. J., Blanchard, P. K., Challis, P., et al. 2015, The Astronomer’s Telegram, 6877, 1
- Foreman-Mackey et al. (2013) Foreman-Mackey, D., Hogg, D. W., Lang, D., & Goodman, J. 2013, PASP, 125, 306, doi: 10.1086/670067
- Frederick et al. (2020) Frederick, S., Gezari, S., Velzen, S. V., et al. 2020, Transient Name Server AstroNote, 143, 1
- Giannios & Metzger (2011) Giannios, D., & Metzger, B. D. 2011, MNRAS, 416, 2102, doi: 10.1111/j.1365-2966.2011.19188.x
- Gillessen et al. (2019) Gillessen, S., Plewa, P. M., Widmann, F., et al. 2019, ApJ, 871, 126, doi: 10.3847/1538-4357/aaf4f8
- Gomez et al. (2020) Gomez, S., Nicholl, M., Short, P., et al. 2020, MNRAS, 497, 1925, doi: 10.1093/mnras/staa2099
- Goodwin et al. (2023a) Goodwin, A., Miller-Jones, J., Alexander, K. D., et al. 2023a, The Astronomer’s Telegram, 16165, 1
- Goodwin et al. (2022) Goodwin, A. J., van Velzen, S., Miller-Jones, J. C. A., et al. 2022, MNRAS, doi: 10.1093/mnras/stac333
- Goodwin et al. (2023b) Goodwin, A. J., Alexander, K. D., Miller-Jones, J. C. A., et al. 2023b, arXiv e-prints, arXiv:2304.12661, doi: 10.48550/arXiv.2304.12661
- Goodwin et al. (2023c) Goodwin, A. J., Miller-Jones, J. C. A., van Velzen, S., et al. 2023c, MNRAS, 518, 847, doi: 10.1093/mnras/stac3127
- Granot & Sari (2002) Granot, J., & Sari, R. 2002, ApJ, 568, 820, doi: 10.1086/338966
- Gromadzki et al. (2019) Gromadzki, M., Hamanowicz, A., Wyrzykowski, L., et al. 2019, A&A, 622, L2, doi: 10.1051/0004-6361/201833682
- Guillochon & Ramirez-Ruiz (2013) Guillochon, J., & Ramirez-Ruiz, E. 2013, ApJ, 767, 25, doi: 10.1088/0004-637X/767/1/25
- Hammerstein et al. (2022) Hammerstein, E., van Velzen, S., Gezari, S., et al. 2022, arXiv e-prints, arXiv:2203.01461. https://arxiv.org/abs/2203.01461
- Hammerstein et al. (2023) —. 2023, ApJ, 942, 9, doi: 10.3847/1538-4357/aca283
- Hayasaki & Jonker (2021) Hayasaki, K., & Jonker, P. G. 2021, ApJ, 921, 20, doi: 10.3847/1538-4357/ac18c2
- Heywood (2020) Heywood, I. 2020, oxkat: Semi-automated imaging of MeerKAT observations, Astrophysics Source Code Library, record ascl:2009.003. http://ascl.net/2009.003
- Holoien et al. (2014) Holoien, T. W. S., Prieto, J. L., Bersier, D., et al. 2014, MNRAS, 445, 3263, doi: 10.1093/mnras/stu1922
- Holoien et al. (2020) Holoien, T. W. S., Auchettl, K., Tucker, M. A., et al. 2020, ApJ, 898, 161, doi: 10.3847/1538-4357/ab9f3d
- Horesh et al. (2021a) Horesh, A., Cenko, S. B., & Arcavi, I. 2021a, Nature Astronomy, 5, 491, doi: 10.1038/s41550-021-01300-8
- Horesh et al. (2021b) Horesh, A., Sfaradi, I., Fender, R., et al. 2021b, ApJ, 920, L5, doi: 10.3847/2041-8213/ac25fe
- Horesh et al. (2018) Horesh, A., Sfaradi, I., Bright, J., et al. 2018, The Astronomer’s Telegram, 12271, 1
- Hung et al. (2017) Hung, T., Gezari, S., Blagorodnova, N., et al. 2017, ApJ, 842, 29, doi: 10.3847/1538-4357/aa7337
- Hung et al. (2019) Hung, T., Cenko, S. B., Roth, N., et al. 2019, ApJ, 879, 119, doi: 10.3847/1538-4357/ab24de
- Irwin et al. (2015) Irwin, J. A., Henriksen, R. N., Krause, M., et al. 2015, ApJ, 809, 172, doi: 10.1088/0004-637X/809/2/172
- Jiang et al. (2017) Jiang, N., Wang, T., Yan, L., et al. 2017, ApJ, 850, 63, doi: 10.3847/1538-4357/aa93f5
- Lacy et al. (2020) Lacy, M., Baum, S. A., Chandler, C. J., et al. 2020, PASP, 132, 035001, doi: 10.1088/1538-3873/ab63eb
- Leloudas et al. (2019) Leloudas, G., Dai, L., Arcavi, I., et al. 2019, ApJ, 887, 218, doi: 10.3847/1538-4357/ab5792
- Liodakis et al. (2022) Liodakis, I., Koljonen, K. I. I., Blinov, D., et al. 2022, arXiv e-prints, arXiv:2208.14465, doi: 10.48550/arXiv.2208.14465
- Loeb & Ulmer (1997) Loeb, A., & Ulmer, A. 1997, ApJ, 489, 573, doi: 10.1086/304814
- Matsumoto & Piran (2023) Matsumoto, T., & Piran, T. 2023, MNRAS, doi: 10.1093/mnras/stad1269
- McMullin et al. (2007) McMullin, J. P., Waters, B., Schiebel, D., Young, W., & Golap, K. 2007, in Astronomical Society of the Pacific Conference Series, Vol. 376, Astronomical Data Analysis Software and Systems XVI, ed. R. A. Shaw, F. Hill, & D. J. Bell, 127
- Metzger (2022) Metzger, B. D. 2022, ApJ, 937, L12, doi: 10.3847/2041-8213/ac90ba
- Metzger et al. (2012) Metzger, B. D., Giannios, D., & Mimica, P. 2012, MNRAS, 420, 3528, doi: 10.1111/j.1365-2966.2011.20273.x
- Murphy et al. (2021) Murphy, T., Kaplan, D. L., Stewart, A. J., et al. 2021, PASA, 38, e054, doi: 10.1017/pasa.2021.44
- Nakar & Piran (2011) Nakar, E., & Piran, T. 2011, Nature, 478, 82, doi: 10.1038/nature10365
- Nicholl et al. (2019) Nicholl, M., Blanchard, P. K., Berger, E., et al. 2019, MNRAS, 488, 1878, doi: 10.1093/mnras/stz1837
- Nicholl et al. (2020) Nicholl, M., Wevers, T., Oates, S. R., et al. 2020, MNRAS, 499, 482, doi: 10.1093/mnras/staa2824
- O’Brien et al. (2019) O’Brien, A., Kaplan, D., Murphy, T., Yu, W., & Zhang, W. 2019, The Astronomer’s Telegram, 13310, 1
- Pasham & van Velzen (2018) Pasham, D. R., & van Velzen, S. 2018, ApJ, 856, 1, doi: 10.3847/1538-4357/aab361
- Perlman et al. (2022) Perlman, E. S., Meyer, E. T., Wang, Q. D., et al. 2022, ApJ, 925, 143, doi: 10.3847/1538-4357/ac3bba
- Petrushevska et al. (2023) Petrushevska, T., Leloudas, G., Ilić, D., et al. 2023, A&A, 669, A140, doi: 10.1051/0004-6361/202244623
- Russell et al. (2015) Russell, H. R., Fabian, A. C., McNamara, B. R., & Broderick, A. E. 2015, MNRAS, 451, 588, doi: 10.1093/mnras/stv954
- Sari et al. (1998) Sari, R., Piran, T., & Narayan, R. 1998, ApJ, 497, L17, doi: 10.1086/311269
- Sfaradi et al. (2022) Sfaradi, I., Horesh, A., Fender, R., et al. 2022, ApJ, 933, 176, doi: 10.3847/1538-4357/ac74bc
- Sfaradi et al. (2023) Sfaradi, I., Beniamini, P., Horesh, A., et al. 2023, arXiv e-prints, arXiv:2308.01965, doi: 10.48550/arXiv.2308.01965
- Short et al. (2020) Short, P., Nicholl, M., Lawrence, A., et al. 2020, MNRAS, 498, 4119, doi: 10.1093/mnras/staa2065
- Stein et al. (2021) Stein, R., van Velzen, S., Kowalski, M., et al. 2021, Nature Astronomy, 5, 510, doi: 10.1038/s41550-020-01295-8
- Stone et al. (2013) Stone, N., Sari, R., & Loeb, A. 2013, MNRAS, 435, 1809, doi: 10.1093/mnras/stt1270
- Teboul & Metzger (2023) Teboul, O., & Metzger, B. D. 2023, arXiv e-prints, arXiv:2308.05161, doi: 10.48550/arXiv.2308.05161
- van Velzen (2018) van Velzen, S. 2018, ApJ, 852, 72, doi: 10.3847/1538-4357/aa998e
- van Velzen et al. (2020) van Velzen, S., Holoien, T. W. S., Onori, F., Hung, T., & Arcavi, I. 2020, Space Sci. Rev., 216, 124, doi: 10.1007/s11214-020-00753-z
- van Velzen et al. (2019) van Velzen, S., Gezari, S., Cenko, S. B., et al. 2019, ApJ, 872, 198, doi: 10.3847/1538-4357/aafe0c
- van Velzen et al. (2021) van Velzen, S., Gezari, S., Hammerstein, E., et al. 2021, ApJ, 908, 4, doi: 10.3847/1538-4357/abc258
- Wevers et al. (2019) Wevers, T., Pasham, D. R., van Velzen, S., et al. 2019, MNRAS, 488, 4816, doi: 10.1093/mnras/stz1976
- Williams et al. (2017) Williams, P. K. G., Gizis, J. E., & Berger, E. 2017, ApJ, 834, 117, doi: 10.3847/1538-4357/834/2/117
- Wright (2006) Wright, E. L. 2006, PASP, 118, 1711, doi: 10.1086/510102
- Yao & Guolo (2022) Yao, Y., & Guolo, M. 2022, The Astronomer’s Telegram, 15657, 1
- Zauderer et al. (2013) Zauderer, B. A., Berger, E., Margutti, R., et al. 2013, ApJ, 767, 152, doi: 10.1088/0004-637X/767/2/152
- Zauderer et al. (2011) Zauderer, B. A., Berger, E., Soderberg, A. M., et al. 2011, Nature, 476, 425, doi: 10.1038/nature10366