Star Formation at the Epoch of Reionization with CANUCS: The ages of stellar populations in MACS1149-JD1
Abstract
We present measurements of stellar populations properties of a gravitationally lensed galaxy MACS1149-JD1 using deep JWST NIRISS slitless spectroscopy as well as NIRISS and NIRCam imaging from the CAnadian NIRISS Unbiased Cluster Survey (CANUCS). The galaxy is split into four components. Three magnified () star-forming components are unresolved, giving intrinsic sizes of . In addition, the underlying extended component contains the bulk of the stellar mass, formed the majority of its stars earlier than the other three components and is not the site of most active star formation currently. The NIRISS and NIRCam resolved photometry does not confirm a strong Balmer break previously seen in Spitzer. The NIRISS grism spectrum has been extracted for the entire galaxy and shows a clear continuum and Lyman-break, with no Lyman- detected.
1 Introduction
Tracing star formation to the earliest times has been a long-standing goal of extragalactic astronomy. In particular, studying the onset of star formation is of importance not only for galaxy formation models but also for studies of the early universe. Spitzer and the Hubble Space Telescope (HST) played a unique role in determining the onset of star formation of galaxies at redshift (e.g., Bradač, 2020 for a review).
The James Webb Space Telescope (JWST, Gardner et al., 2023) is revolutionizing studies of the early onset of star formation in high-redshift galaxies. With the expanded sensitivity, filter set and wavelength coverage compared to Spitzer, JWST can trace the full spectral energy distribution, and in some cases distinguish strong line emission from breaks due to evolved stars (e.g., Laporte et al., 2023). Early results from JWST appear to show a higher than expected ultraviolet luminosity density at (Harikane et al., 2023; Donnan et al., 2023). There have also been claims for the presence at of massive galaxies with strong Balmer breaks in the CEERS survey (Labbé et al., 2023; Lovell et al., 2023; Boylan-Kolchin, 2023). However, studies from other JWST surveys with comparable or larger volumes such as JADES, EPOCHS and CANUCS do not find such a high density of massive galaxies with strong Balmer breaks at these redshifts (Endsley et al., 2023b; Trussler et al., 2023; Desprez et al., 2023, in prep.).
One of the most intriguing objects showing a potential Balmer break from previous HST and Spitzer studies is the galaxy MACS1149-JD1 behind the cluster MACS J1149.52223. MACS1149-JD1 was originally discovered in HST and shallow Spitzer data in Zheng et al. (2012). It was later detected in both channel 1 and channel 2 Spitzer bands using deeper data (Bradač et al., 2014; Huang et al., 2016; Zheng et al., 2017; Hoag et al., 2018) and its redshift was spectroscopically measured with the [O III] 88 line using ALMA by Hashimoto et al. (2018). With early data, it was concluded that the nebular emission lines are redshifted out of both Spitzer bands (at ), yet the galaxy showed a strong color excess. It was therefore highly likely that old () stellar populations are causing the red rest-frame optical colors (Hashimoto et al., 2018; Hoag et al., 2018; Huang et al., 2016). This was surprising, given the galaxy would need to start forming a significant amount of stars shortly after the Big Bang (). In addition, the cold dust content of the galaxy was constrained to be modest from observations taken with ALMA, making dust an unlikely cause of red Spitzer color (Hashimoto et al., 2018).
MACS1149-JD1 was recently observed as part of the CAnadian NIRISS Unbiased Cluster Survey (CANUCS, Willott et al., 2022) with the NIRCam and NIRISS instruments onboard JWST. The data provides superior photometry compared to what was possible with Spitzer. In addition, NIRISS spectra with its coverage from 1 to m allow us to investigate the rest frame UV spectrum, including searching for the presence of potential Lyman- line (previously mentioned in Hashimoto et al., 2018). Here we describe these data and analysis of the stellar properties of MACS1149-JD1.
The paper is structured as follows. In Section 2 we present the data used in this paper and in Section 3 we describe the analysis of the photometric and spectroscopic data. In Section 4 we present the main science results. We summarize in Section 5 and give photometry and SED fitting results in the tables in Appendix A.
Throughout the paper we assume a CDM cosmology from Planck Collaboration et al. (2020) with and Hubble constant .
2 Data
JWST NIRISS and NIRCam observations of MACS1149-JD1 were taken from 10th-22nd May 2023 as part of the NIRISS GTO Program #1208, The Canadian NIRISS Unbiased Cluster Survey (CANUCS, Willott et al. 2022, https://doi.org/10.17909/ph4n-6n76 (catalog DOI)).
The field was observed with NIRCam imaging using filters F090W, F115W, F150W, F200W, F277W, F356W, F410M, and F444W with exposure times of each, reaching S/N between 5 and 10 for a point source. We also utilized archival data of HST imaging from Hubble Frontier Fields (Lotz et al., 2017), GLASS (Treu et al., 2015), and SN Refsdal (Kelly et al., 2015) follow-up observations (HST-GO-13504, PI Lotz; HST-GO-13790, PI Rodney; HST-GO-13459, PI Treu; HST GO-14041, PI Kelly).
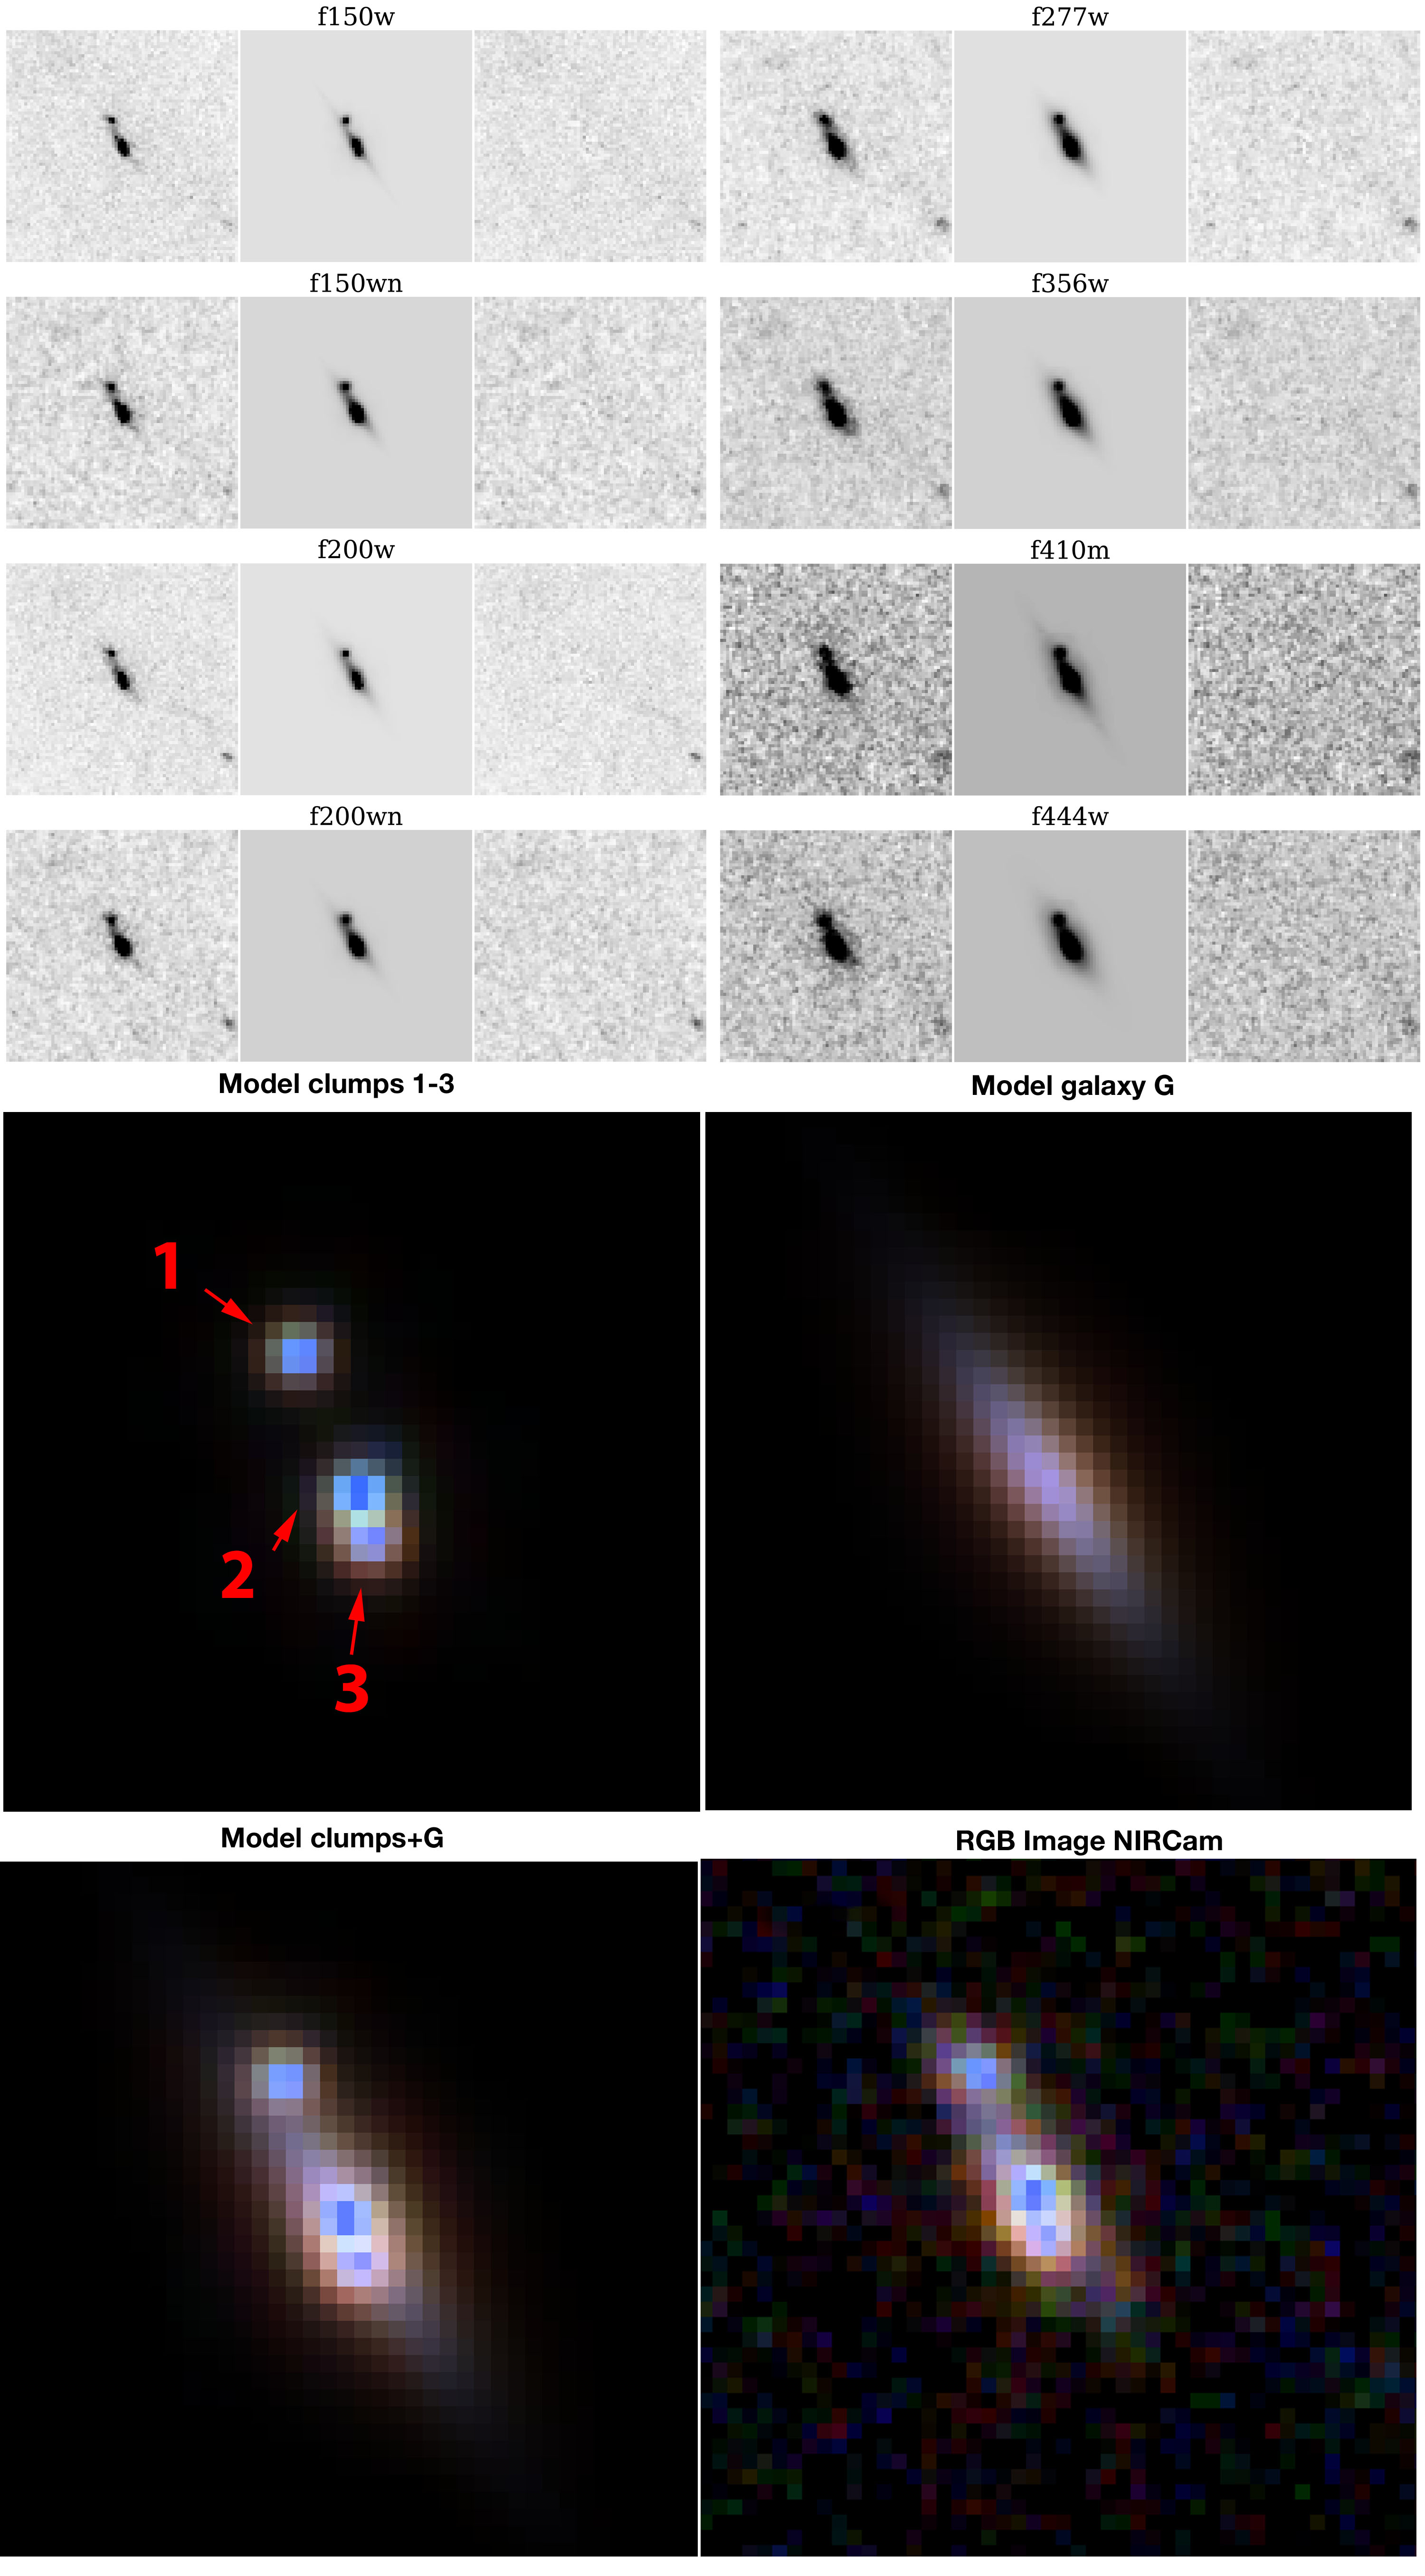
To reduce the imaging data we use the photometric pipeline that will be presented in Brammer et al. (in prep.), which also provides a compilation of the JWST ERO photometric data released to date. Briefly, the raw data has been reduced using the public Grism redshift & line analysis software Grizli (Brammer, 2023a, b), which masks imaging artifacts, provides astrometric calibrations based on the Gaia Data Release 3 catalog, and shifts images using Astrodrizzle. The method closely follows the one outlined in Valentino et al. (2023). We show the cutouts of MACS1149-JD1 in Fig. 1.
Observations also consist of two NIRISS pointings, one centred on the cluster centre containing MACS1149-JD1 and the other coincident with a flanking field. Each pointing is observed with the GR150R and GR150C grisms through the F115W, F150W and F200W filters. Exposure times for the cluster field are 19240 seconds in each of the three filters. We also process all the NIRISS imaging and slitless spectroscopy with Grizli. Grizli performs full end-to-end processing of space-based slitless spectroscopic datasets. For full details see e.g., Matharu et al. (2021); Noirot et al. (2023); Matharu et al. (2023). In summary, raw data is downloaded from the Mikulski Archive for Space Telescopes (MAST) and pre-processed for cosmic rays, flat-fielding, sky subtraction, astrometric corrections and alignment. Contamination models (which correct for overlapping spectra from nearby sources) for each pointing are then generated and subtracted for each grism spectrum of interest. From these images we extract the spectrum of MACS1149-JD1.
For the magnification estimate, we use the model from Finney et al. (2018), which uses Hubble Frontier field data (referred to Bradacv4). The corresponding magnification is ( confidence). It is in agreement with the median magnification from the six other publicly available post-HFF lens models (CATSv4.1, Sharonv4cor, Keetonv4, Williamsv4, Diegov4.1, GLAFICv3) published on MAST111https://archive.stsci.edu/prepds/frontier/lensmodels/. Throughout the paper we correct for gravitational lensing magnification all properties as appropriate unless otherwise noted.
3 Data Analysis
3.1 Photometry and SED Fitting
The photometry is derived using the updated zero-points, and corrected for Milky Way extinction. We use F150W and F200W NIRISS filters as well as F150W, F200W, F277W, F356W, F410M, and F444W NIRCam filters (in other JWST filters MACS1149-JD1 is not/barely detected) and HST upper limits for the entire source. Since the object is resolved into three distinct clumps and a smooth galaxy component, we perform a photometric fit using Galfit (Peng et al., 2010). We forward model the source assuming four components (three point sources for the clumps and a sersic profile for the diffused light), convolve them with the PSF and determine their parameters to minimise the residuals. We measure empirical PSF determined from the stars.
The resulting models and residuals are shown in Fig. 1. Residuals from the fits are negligible, confirming the original visual impression that the three compact sources are unresolved and an additional smooth component is present. The agreement between NIRISS and NIRCam fluxes in the two overlapping filters is a confirmation of the robustness of photometry. Resolved photometry is necessary, as global spectral energy distribution (SED) fitting can bias stellar masses when young stellar population outshine the first episodes of star formation (e.g., Sorba & Sawicki, 2018; Giménez-Arteaga et al., 2023; Narayanan et al., 2023). Photometric properties are given in Table 1.
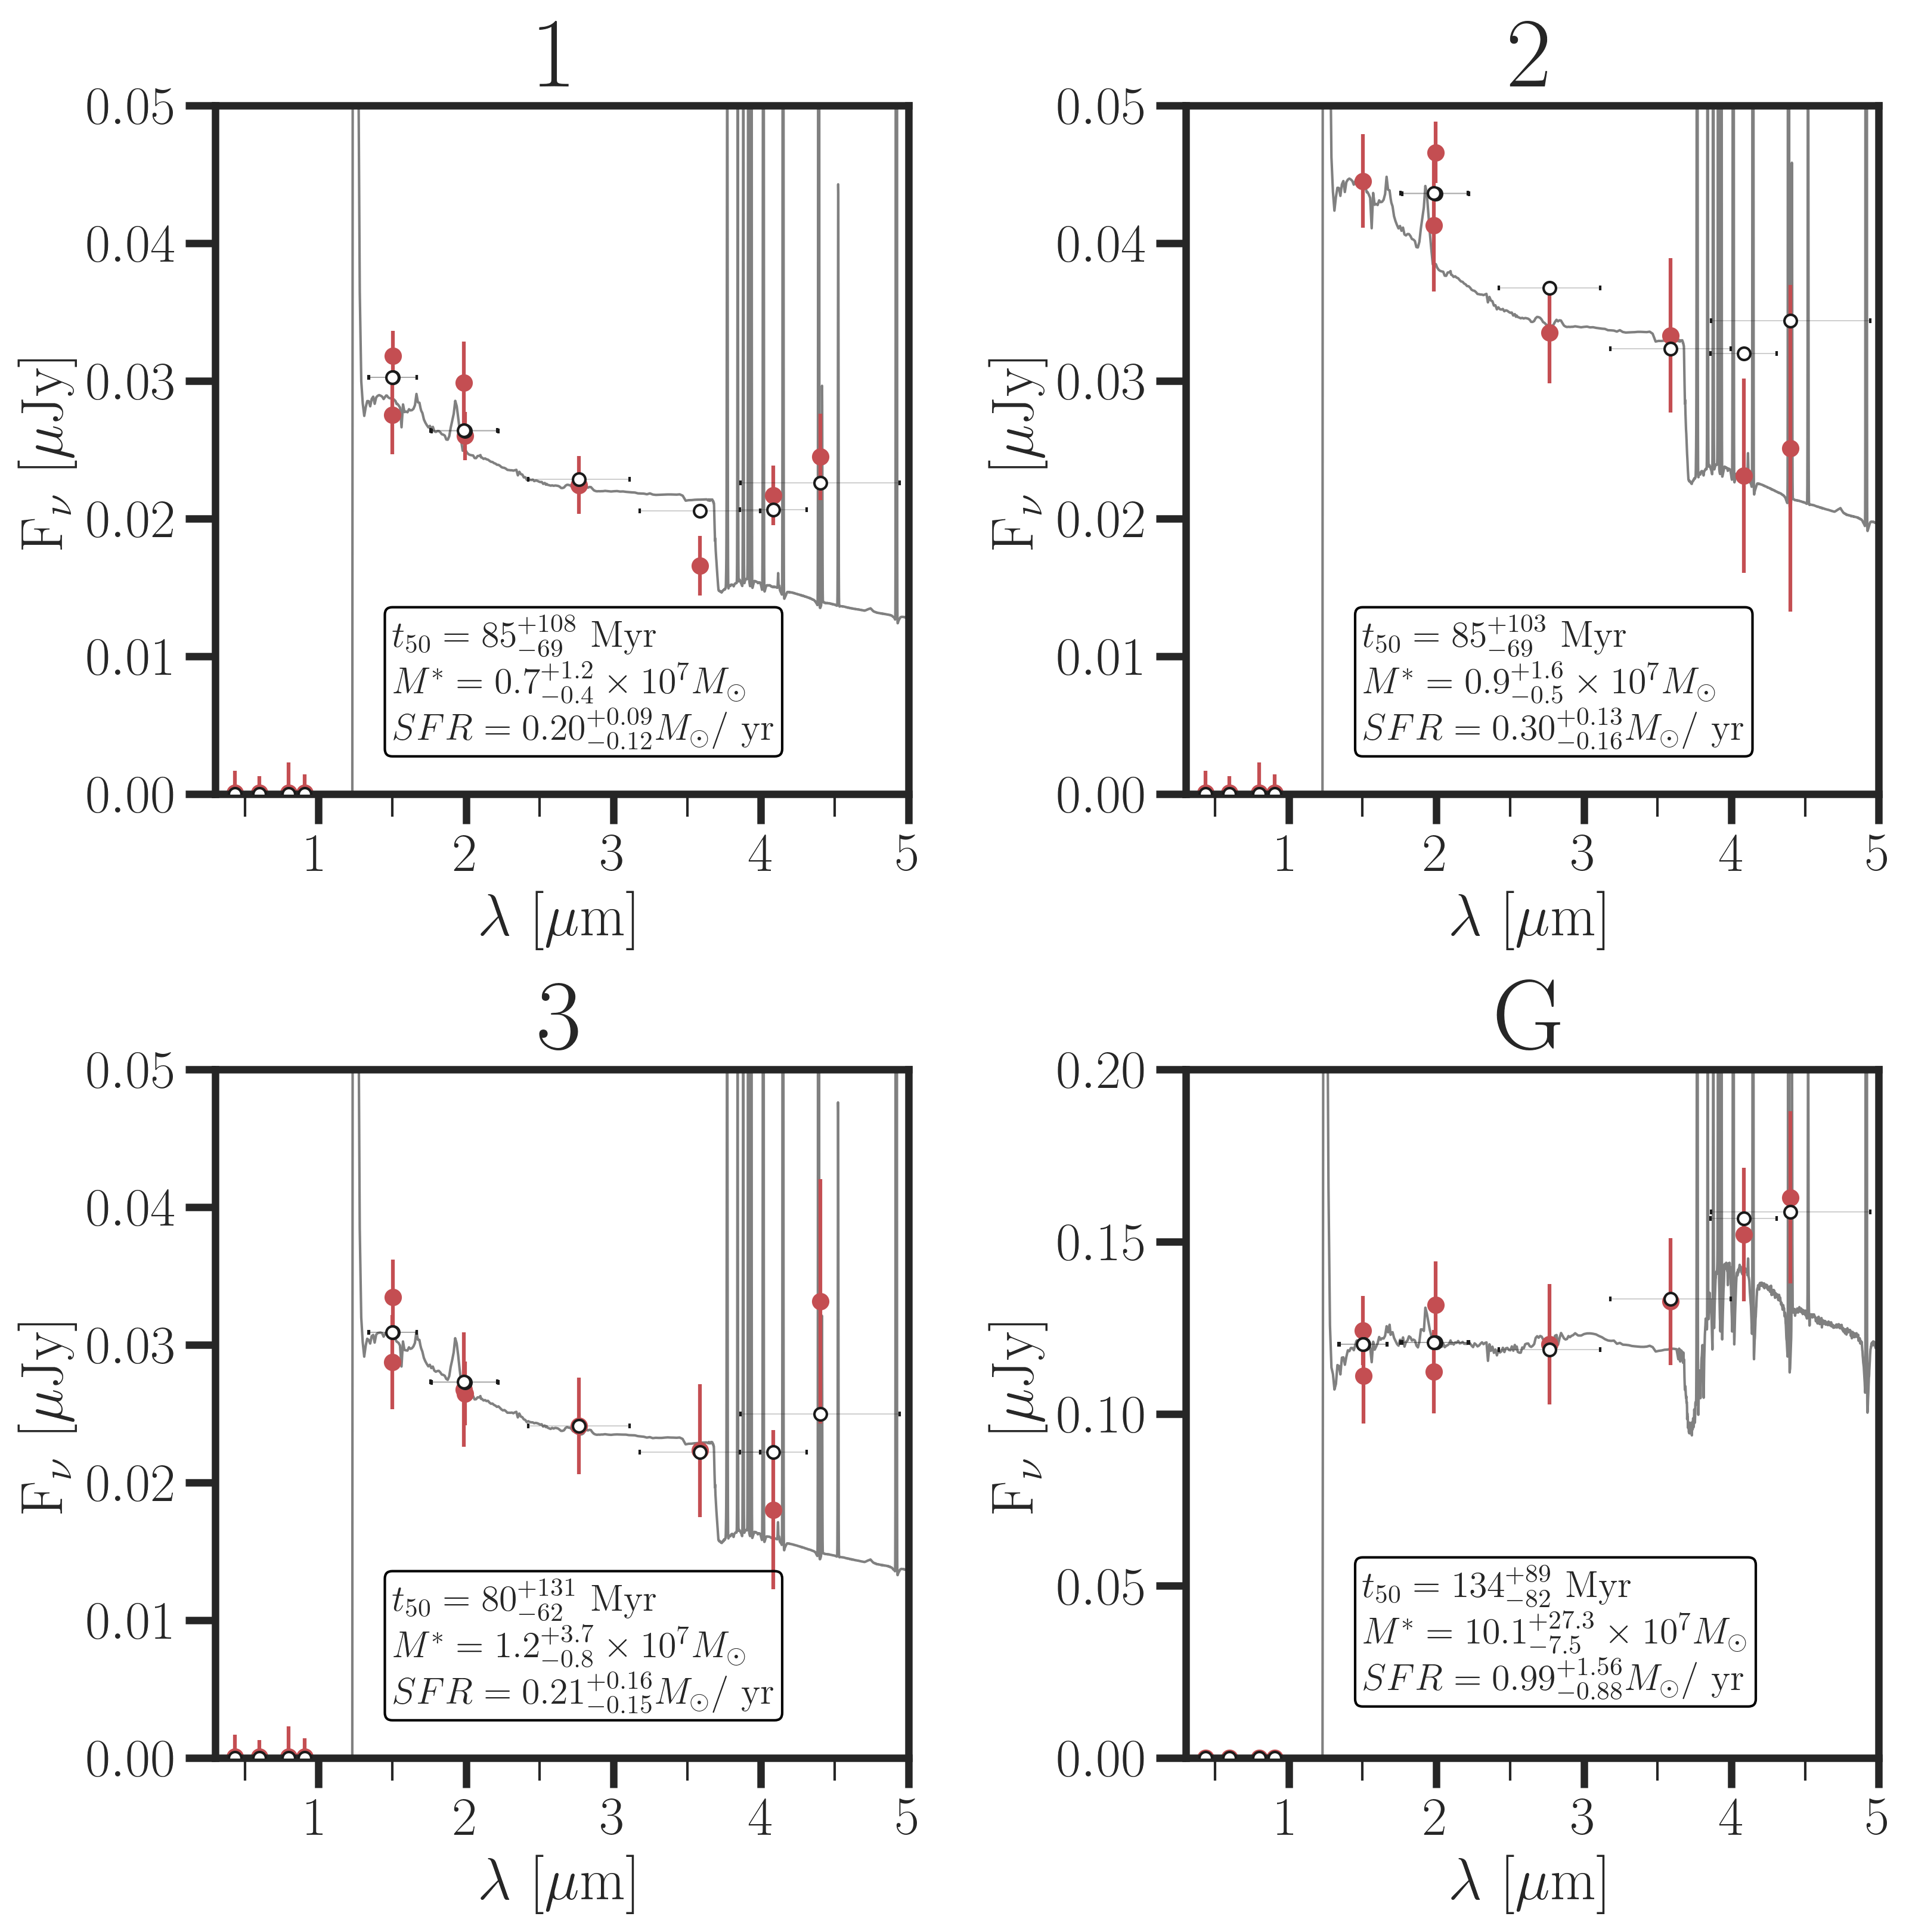
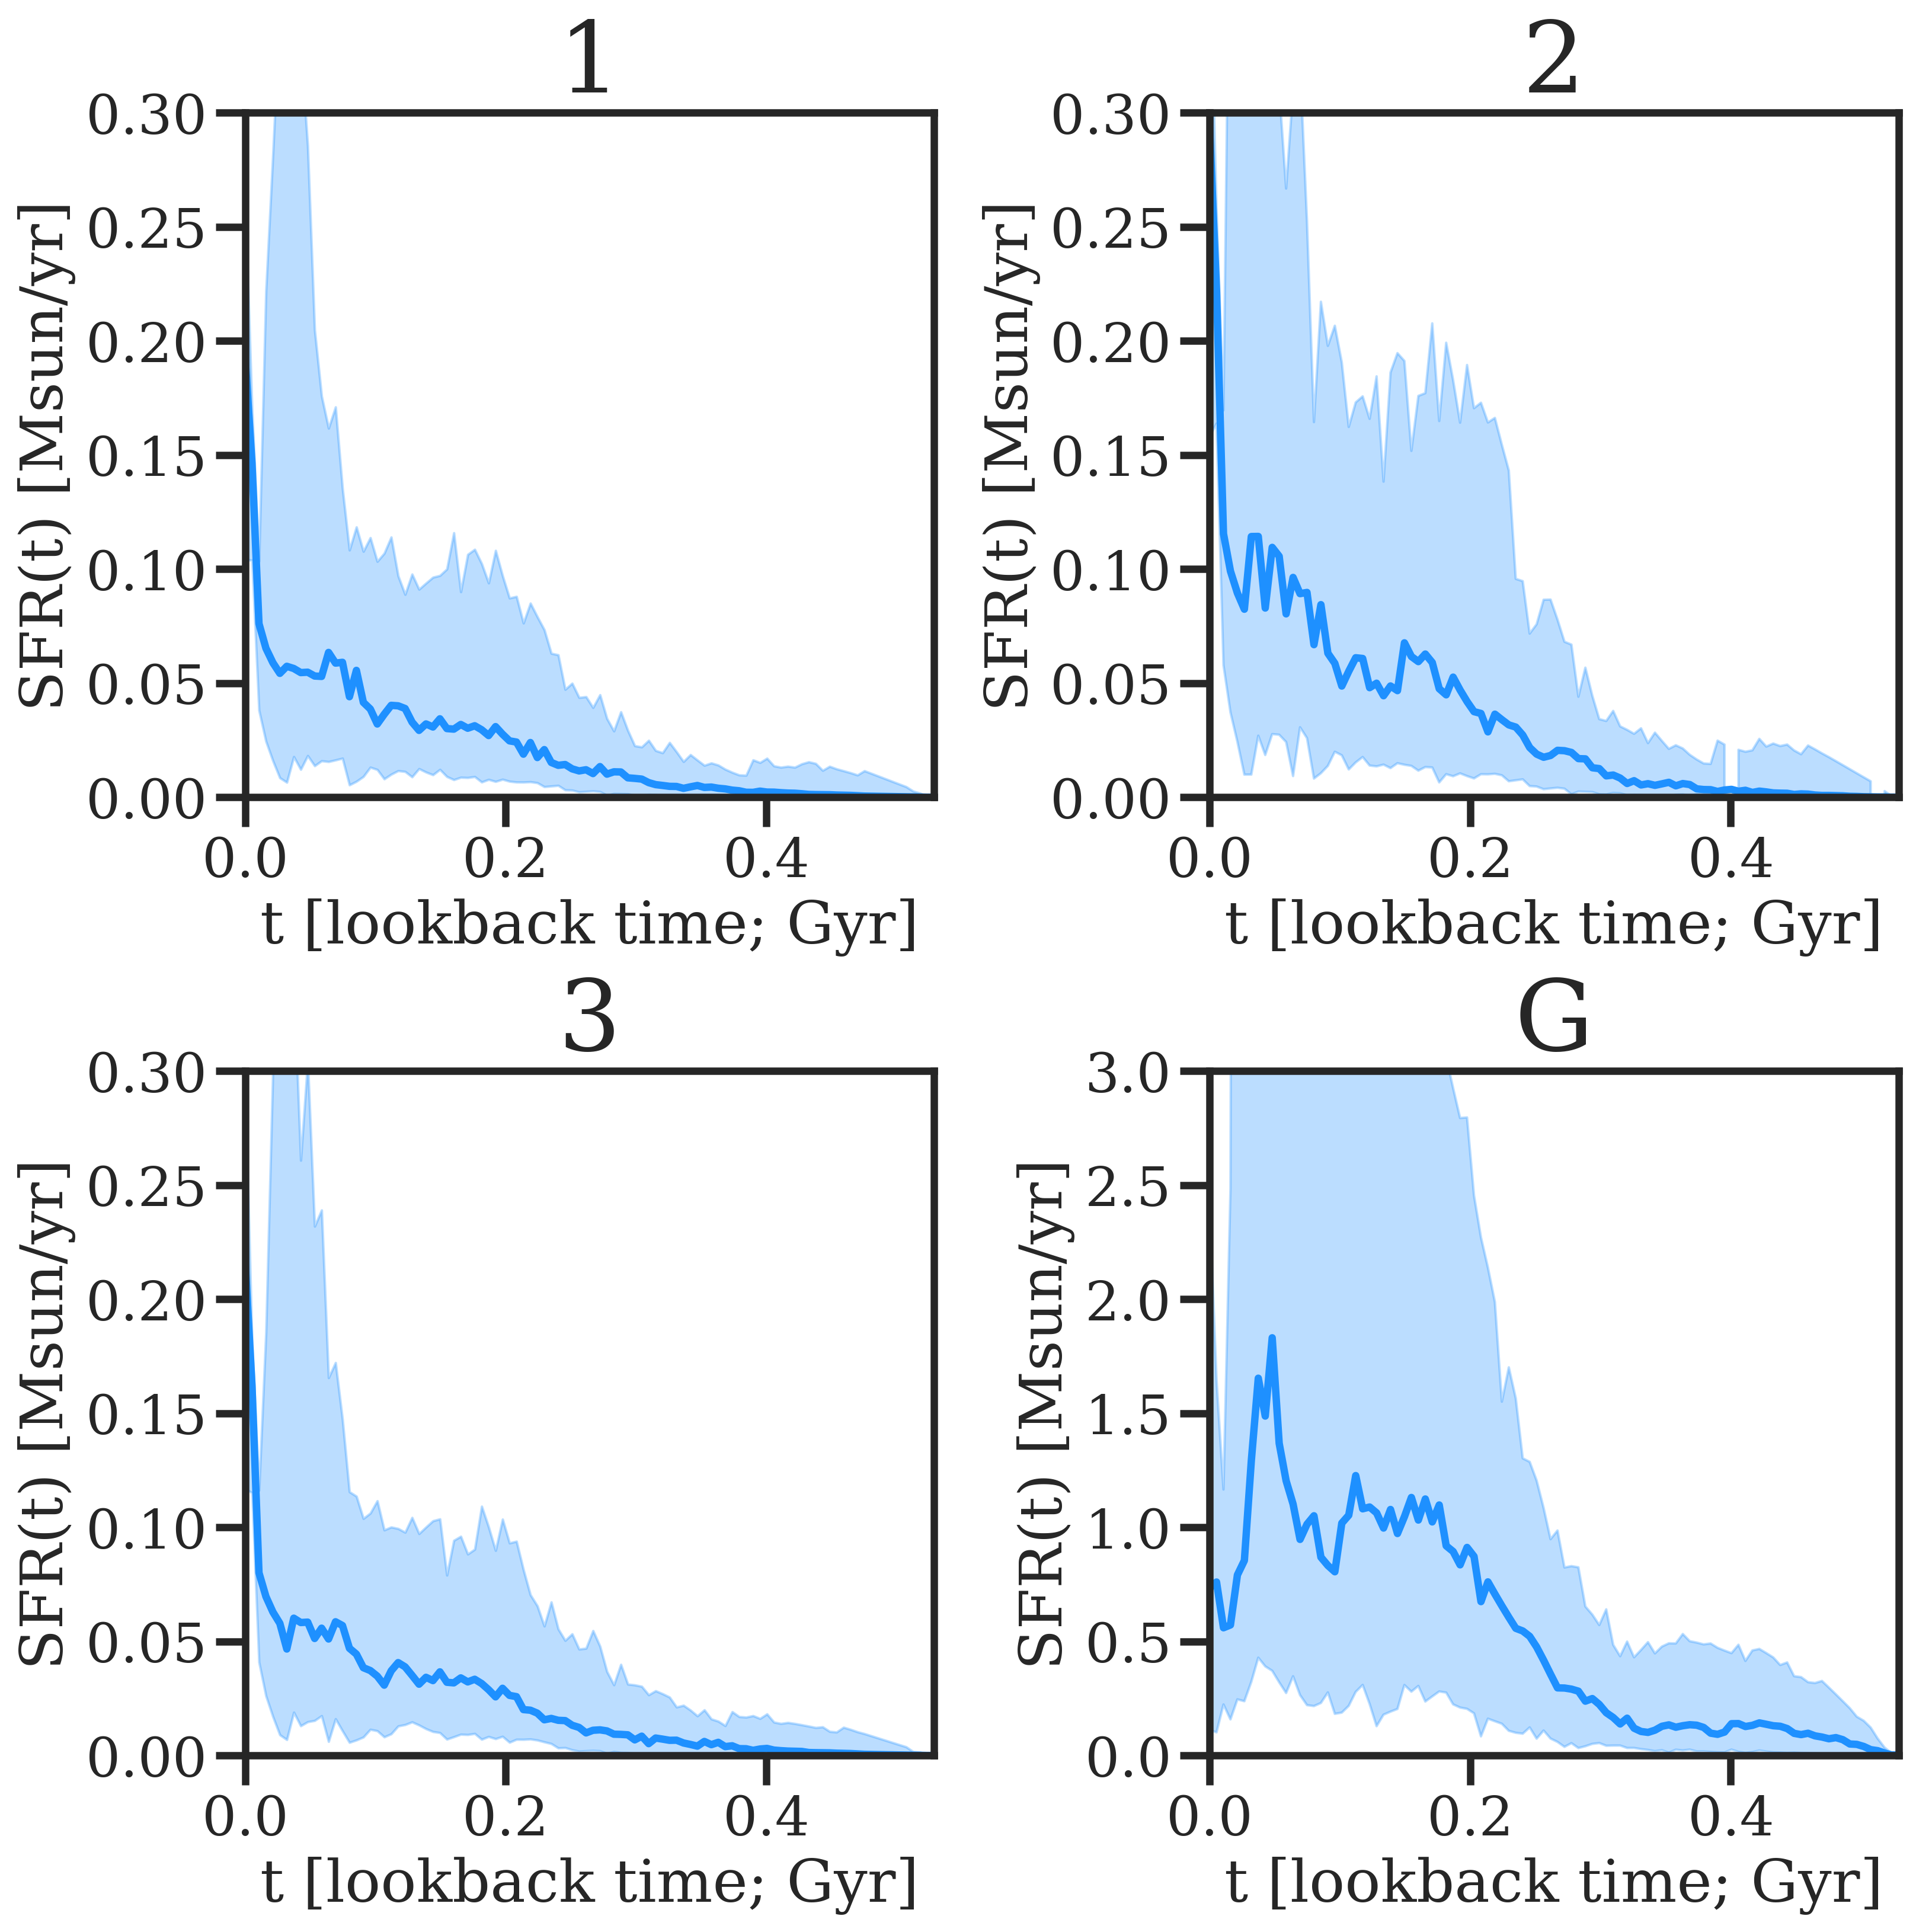
SEDs derived from our photometry were analysed using the DENSE BASIS method (Iyer & Gawiser, 2017; Iyer et al., 2019) to determine nonparametric star formation histories (SFHs), masses, and ages for our sources in MACS1149-JD1. We adopt the Calzetti attenuation law (Calzetti, 2001) and a Chabrier IMF (Chabrier, 2003). We fix the redshift to that found by the [O III] 88 line in Hashimoto et al. (2018), . All other parameters are left free. The primary advantage of using DENSE BASIS with nonparametric SFHs is that they allow us to account for flexible stellar populations. Both photometry and SED fit are shown in Fig. 2.
3.2 Grism spectroscopy
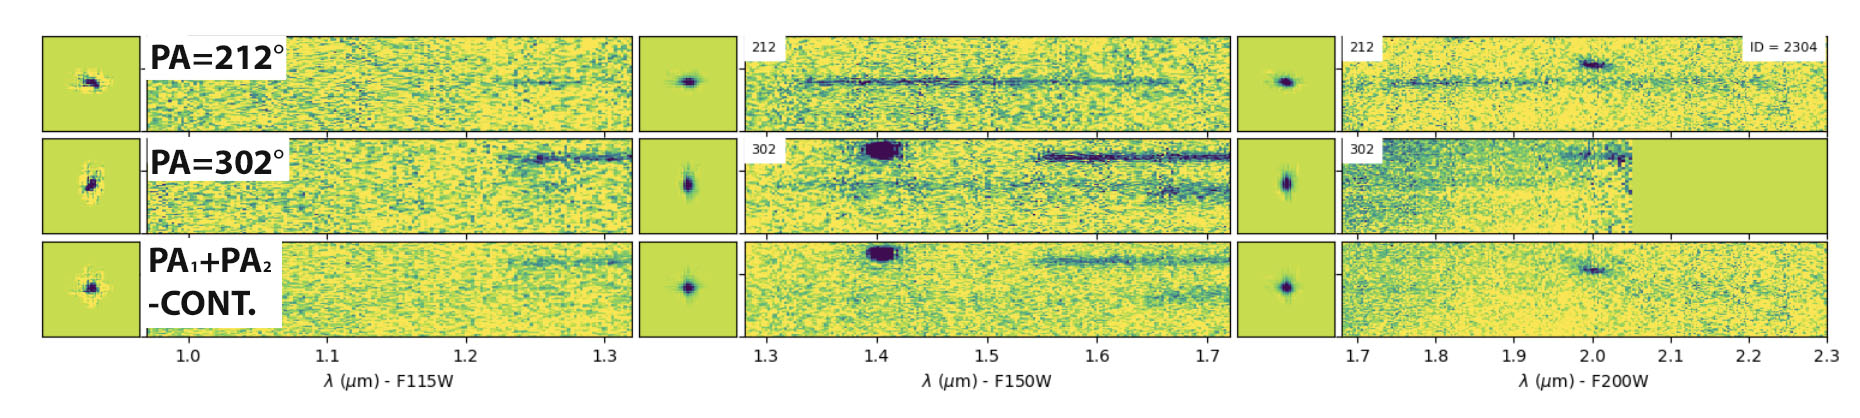
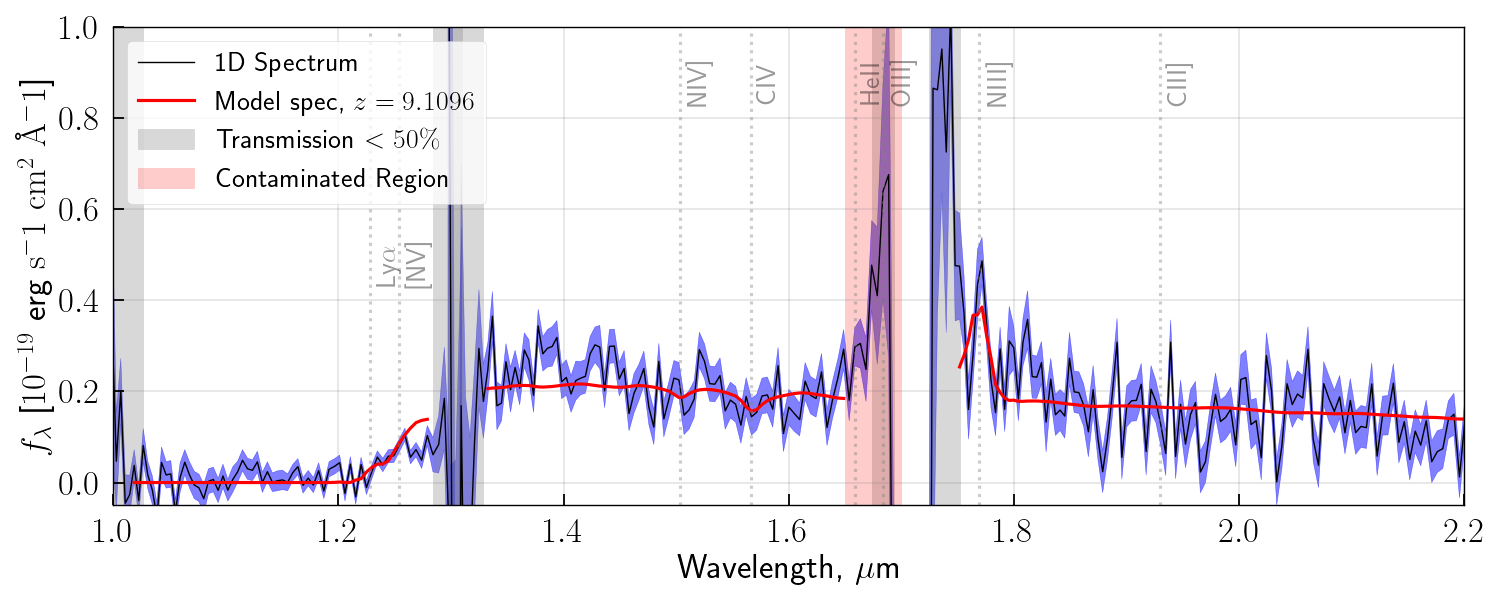
To extract the NIRISS spectrum of the source we also use the Grizli package. The Grizli reduction steps of the NIRISS data includes the creation of a NIRISS direct image mosaic from which diffraction spikes of bright sources are masked. Following Noirot et al. (2023) source detection is performed on the NIRISS mosaic image with the Source Extractor (Bertin & Arnouts, 1996) python wrapper sep (Barbary, 2016), using the default detection parameters implemented in Grizli (a detection threshold ‘threshold’ of above the global background RMS, a minimum source area in pixels ‘minarea’ of 9, and deblending parameters ’deblend_cont’ and ‘deblend_ntresh’ of 0.001 and 32, respectively). Matched aperture photometry on the available NIRISS filters is performed at the same stage. From this NIRISS imaging catalogue, the position of sources that contaminate the spectrum of MACS1149-JD1 are used to locate spectral traces in the grism data. The spectral continua of the sources are modelled using an iterative polynomial fitting of the data for contamination estimate and removal. The 2D and extracted 1D MACS1149-JD1 spectra with contamination removal and modelled spectrum are shown in Fig. 3.
4 Results
4.1 Spatially Resolved Star Formation History
Using our photometry (Table 1) we now determine the stellar properties of each individual component. By determining slopes based on NIRCam F150W, F200W, and F227W fluxes, we see that the three clumps have different properties than the underlying galaxy component. The three clumps have measured between and, , whereas the galaxy itself is redder with (Table 2). The values are consistent with with other observations from JWST (e.g., Topping et al., 2023; Endsley et al., 2023a; Bouwens et al., 2023; Franco et al., 2023).
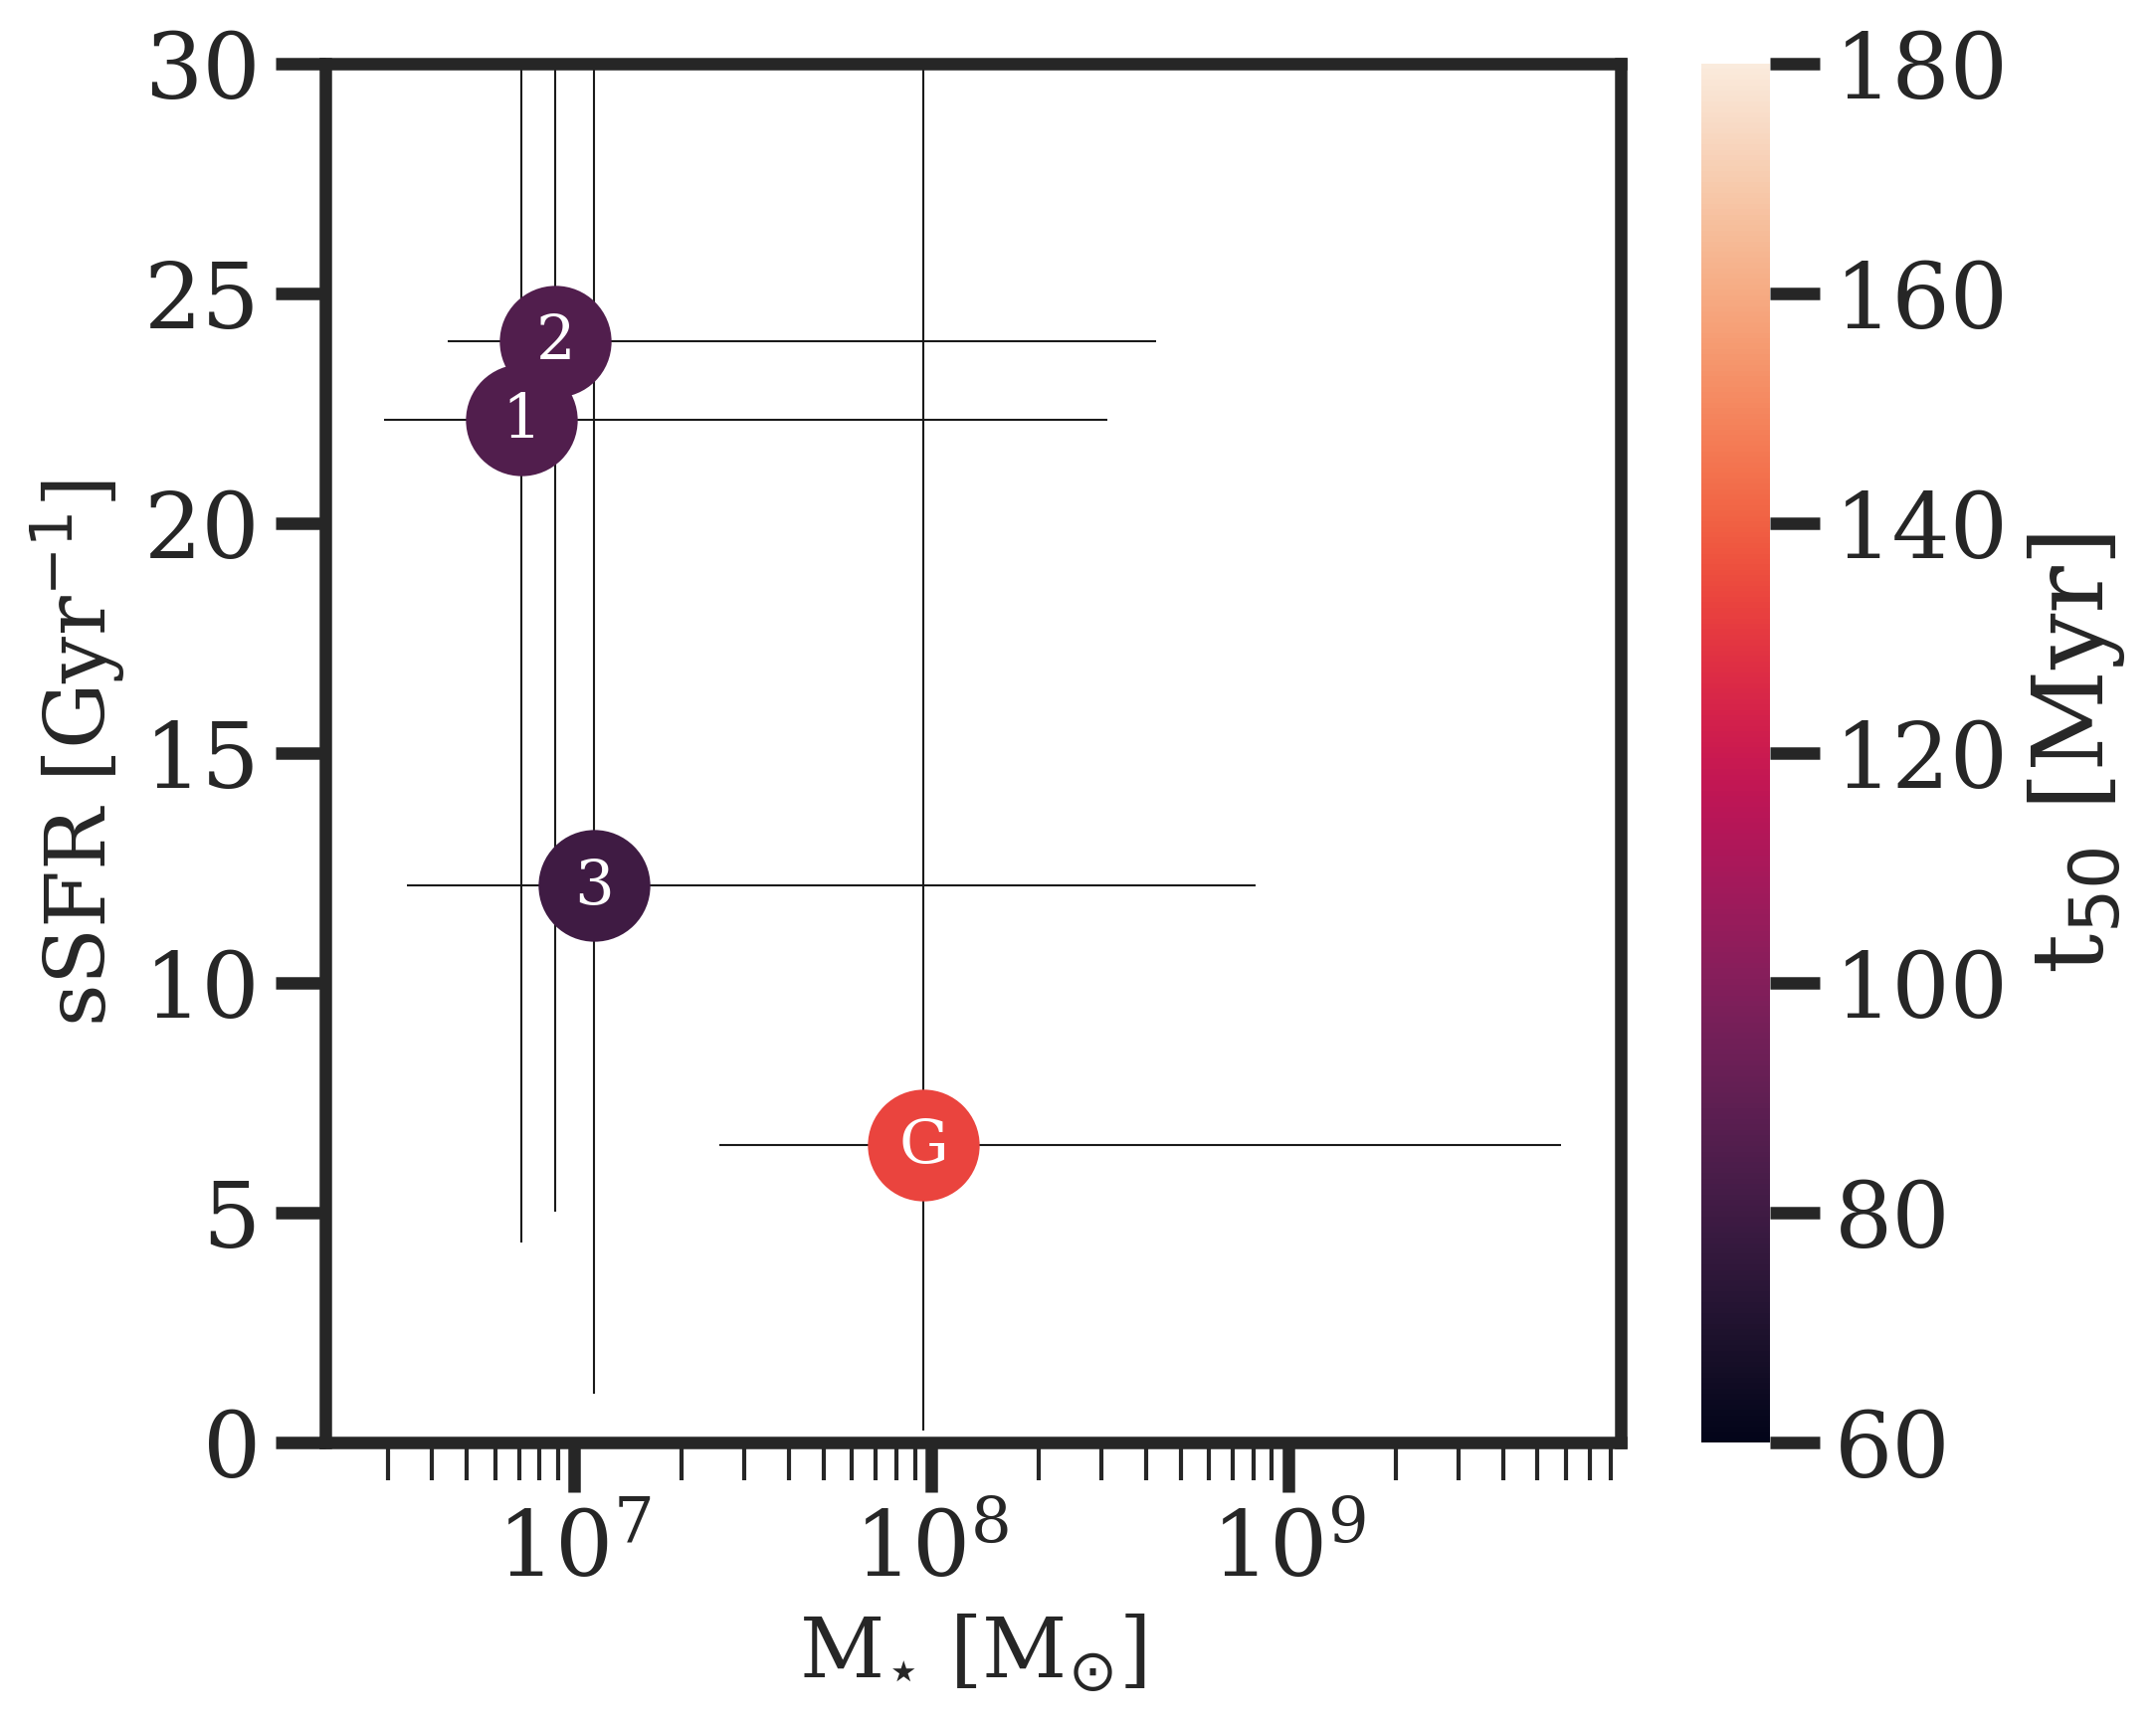
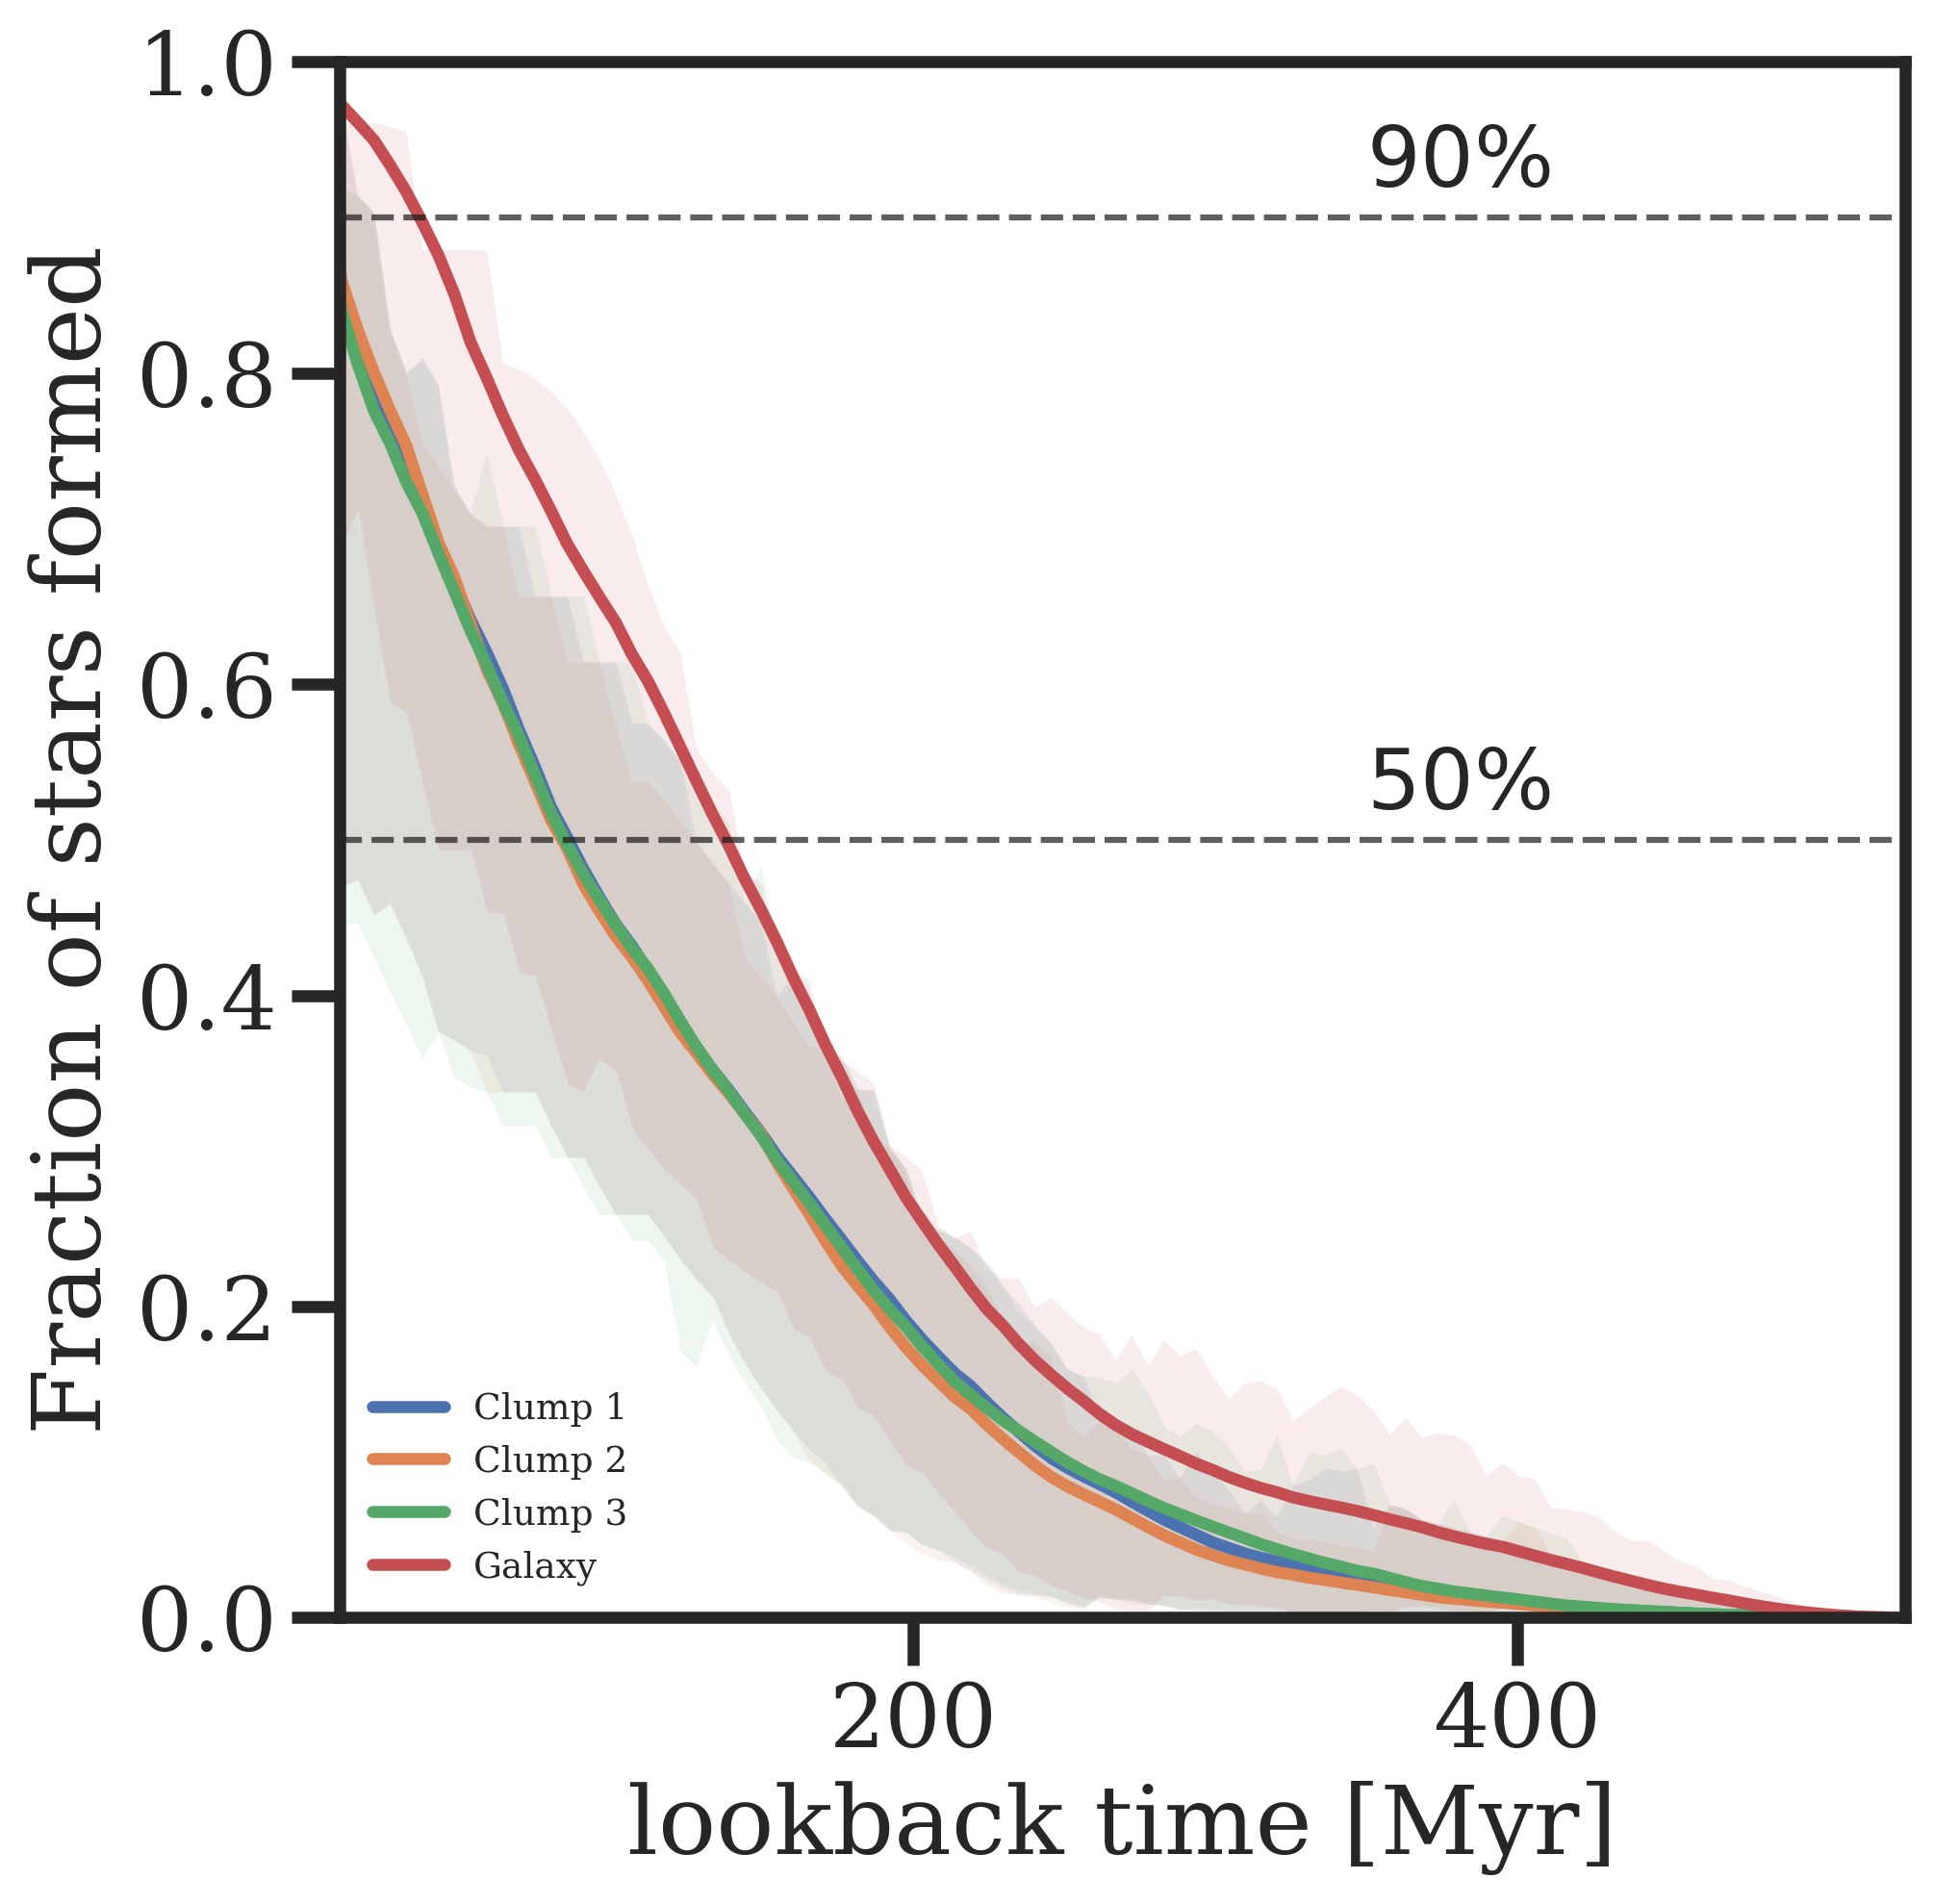
Using DENSE BASIS we also perform the SED fit and determine nonparametric star formation histories. All four components have intrinsic (corrected for magnification) stellar masses between and and star formation rates (SFR) between . While the errorbars are large and there is still a possibility that all components have the same star formation histories, there is nevertheless a hint that the galaxy itself (G) has started to form the bulk of the stars earlier (Fig. 4). This component also has the highest stellar mass (Fig. 5). In Fig. 6 we also show the mass fraction of stars formed as a function of lookback time. Once again, the error-bars are large, but there is an indication that the underlying galaxy has formed the bulk of its stellar masses earlier than the clumps, which are still actively star-forming.
The galaxy formed 50% of its total mass at . In Hashimoto et al. (2018), the bulk of the stellar population was determined to have formed at a look-back time of . The main reason is that the relative flux measured red-ward of has decreased, making the potential Balmer-break less pronounced. We measure the Balmer break of galaxy G (based on fluxes in F444W and F277W, the latter being mostly emission line free) of (). This is lower compared to Spitzer measurements from Kokorev et al. (2022) of , from Zheng et al. (2017) (also used in Hashimoto et al., 2018) (1-) , from ASTRODEEP (Di Criscienzo et al., 2017) (3-) and from (Huang et al., 2016) . All Spitzer measurements are the average of the older G component and all the clumps, though the former dominates the flux. This discrepancy is unlikely caused by emission lines, as both NIRCam F444W and Spitzer Channel 2 have similar throughputs at the red-end, hence entering [O iii] 4959 emission line (where both instruments have a throughput of 20%) could not play a role (for [O iii] 5007 both are similarly at 1%). We think the most likely source of discrepancy is the contamination modelling which in the case of Spitzer’s large PSF is difficult.
4.2 Grism Spectrum
We clearly detect the continuum and Lyman-break in the NIRISS spectrum at the expected redshift. In Fig. 3 we show 1D spectral extraction with a fitted model at the redshift determined by Hashimoto et al. (2018). However, even if we let the redshift be determined by the NIRISS data alone, we still recover the same redshift (). We have also searched for the Lyman- emission line that was indicated in Hashimoto et al. (2018) at with an integrated (lensed) flux of erg s-1 cm-2. We do not detect any lines at that wavelength. From the sensitivity of our observations, such a line would have been detected. We do, however, detect a line in one orientation at which corresponds to N iii] 1747,1749, with the flux of erg s-1 cm-2. Unfortunately, the other orientation is contaminated and furthermore, the spectrum is located towards the edge of the detector. Hence, we consider this line tentative.
The combined UV beta slope measured from the NIRISS spectrum between rest-frame wavelengths of and (we assume a similar spectral range as used for photometry, excluding the part of the spectrum in the detector gap) is . This is consistent with the average photometric measurements done for individual clumps (Table. 2).
The spectrum also shows a softening of the Lyman-break in the vicinity of Lyman-, very likely caused by a largely neutral IGM (Mason & Gronke, 2020; Curtis-Lake et al., 2023; Heintz et al., 2023). Unfortunately, the break falls at the gap between the two filters, hence we cannot characterize it fully.
5 Conclusions
The gravitationally lensed galaxy MACS1149-JD1 at has been well studied in the past. Spitzer data were showing what seemed to be a strong Balmer break, meaning that the dominant stellar component formed about 290Myr earlier (or around after the Big Bang, Bradač et al., 2014; Huang et al., 2016; Hoag et al., 2018; Hashimoto et al., 2018).
New JWST observations with NIRISS and NIRCam reveal that the galaxy consists of three unresolved (with intrinsic sizes ) star-forming clumps and an underlying extended galaxy component. We individually perform SED fitting of all four components (Fig. 2, Table 2). The galaxy component (G) is showing somewhat older stellar population, albeit with large errobars. This component (i) contains the bulk of the stellar mass, (ii) likely formed the majority of its stars earlier than the other components and (iii) is not the site of the most recent star formation.
NIRISS spectrum of MACS1149-JD1 shows a clear detection of the continuum and Lyman-break. However, we do not detect the Lyman- line previously reported in Hashimoto et al. (2018). Given that NIRISS spectra have low spectral resolution Lyman- could still be present, though at a lower flux than previously reported.
In conclusion, MACS1149-JD1 is a highly magnified, intrinsically faint galaxy at . It shows properties that are consistent with other galaxies detected with JWST (e.g., Bunker et al., 2023; Topping et al., 2023); however, its true nature was only revealed through resolved SED fitting. While strong Balmer breaks can be present at high redshift, they are rare (Laporte et al., 2023; Looser et al., 2023; Strait et al., 2023; Endsley et al., 2023b). With the newest data for MACS1149-JD1, a strong Balmer break is excluded.
Acknowledgements
MB, GR, and AH acknowledge support from the ERC Grant FIRSTLIGHT and Slovenian national research agency ARRS through grants N1-0238 and P1-0188. MB acknowledges support from the program HST-GO-16667, provided through a grant from the STScI under NASA contract NAS5-26555. This research was enabled by grant 18JWST-GTO1 from the Canadian Space Agency and funding from the Natural Sciences and Engineering Research Council of Canada. This research used the Canadian Advanced Network For Astronomy Research (CANFAR) operated in partnership by the Canadian Astronomy Data Centre and The Digital Research Alliance of Canada with support from the National Research Council of Canada the Canadian Space Agency, CANARIE and the Canadian Foundation for Innovation. The Cosmic Dawn Center (DAWN) is funded by the Danish National Research Foundation under grant No. 140. This work utilizes gravitational lensing models produced by PIs Bradač, Natarajan & Kneib (CATS), Merten, Zitrin, Sharon, Williams, Keeton, Bernstein and Diego, and the GLAFIC group. This lens modeling was partially funded by the HST Frontier Fields program conducted by STScI. STScI is operated by the Association of Universities for Research in Astronomy, Inc. under NASA contract NAS 5-26555. The lens models were obtained from the Mikulski Archive for Space Telescopes (MAST).
Data Availability
The data is available at DOI: 10.17909/ph4n-6n76
References
- Barbary (2016) Barbary, K. 2016, The Journal of Open Source Software, 1, 58, doi: 10.21105/joss.00058
- Bertin & Arnouts (1996) Bertin, E., & Arnouts, S. 1996, Astronomy and Astrophysics Supplement, 117, 393
- Bouwens et al. (2023) Bouwens, R. J., Stefanon, M., Brammer, G., et al. 2023, MNRAS, 523, 1036, doi: 10.1093/mnras/stad1145
- Boylan-Kolchin (2023) Boylan-Kolchin, M. 2023, Nature Astronomy, 7, 731, doi: 10.1038/s41550-023-01937-7
- Bradač et al. (2014) Bradač, M., Ryan, R., Casertano, S., et al. 2014, ApJ, 785, 108, doi: 10.1088/0004-637X/785/2/108
- Bradač (2020) Bradač, M. 2020, Nature Astronomy, 4, 478, doi: 10.1038/s41550-020-1104-5
- Brammer (2023a) Brammer, G. 2023a, grizli, 1.8.2, Zenodo, Zenodo, doi: 10.5281/zenodo.7712834
- Brammer (2023b) —. 2023b, grizli, 1.9.1, Zenodo, Zenodo, doi: 10.5281/zenodo.8210732
- Bunker et al. (2023) Bunker, A. J., Cameron, A. J., Curtis-Lake, E., et al. 2023, arXiv e-prints, arXiv:2306.02467, doi: 10.48550/arXiv.2306.02467
- Calzetti (2001) Calzetti, D. 2001, PASP, 113, 1449, doi: 10.1086/324269
- Chabrier (2003) Chabrier, G. 2003, ApJ, 586, L133, doi: 10.1086/374879
- Curtis-Lake et al. (2023) Curtis-Lake, E., Carniani, S., Cameron, A., et al. 2023, Nature Astronomy, 7, 622, doi: 10.1038/s41550-023-01918-w
- Desprez et al. (2023) Desprez et al. 2023, in prep.
- Di Criscienzo et al. (2017) Di Criscienzo, M., Merlin, E., Castellano, M., et al. 2017, A&A, 607, A30, doi: 10.1051/0004-6361/201731172
- Donnan et al. (2023) Donnan, C. T., McLeod, D. J., Dunlop, J. S., et al. 2023, MNRAS, 518, 6011, doi: 10.1093/mnras/stac3472
- Endsley et al. (2023a) Endsley, R., Stark, D. P., Whitler, L., et al. 2023a, MNRAS, 524, 2312, doi: 10.1093/mnras/stad1919
- Endsley et al. (2023b) —. 2023b, arXiv e-prints, arXiv:2306.05295, doi: 10.48550/arXiv.2306.05295
- Finney et al. (2018) Finney, E. Q., Bradač, M., Huang, K.-H., et al. 2018, ApJ, 859, 58, doi: 10.3847/1538-4357/aabf97
- Franco et al. (2023) Franco, M., Akins, H. B., Casey, C. M., et al. 2023, arXiv e-prints, arXiv:2308.00751, doi: 10.48550/arXiv.2308.00751
- Gardner et al. (2023) Gardner, J. P., Mather, J. C., Abbott, R., et al. 2023, PASP, 135, 068001, doi: 10.1088/1538-3873/acd1b5
- Giménez-Arteaga et al. (2023) Giménez-Arteaga, C., Oesch, P. A., Brammer, G. B., et al. 2023, ApJ, 948, 126, doi: 10.3847/1538-4357/acc5ea
- Harikane et al. (2023) Harikane, Y., Ouchi, M., Oguri, M., et al. 2023, ApJS, 265, 5, doi: 10.3847/1538-4365/acaaa9
- Hashimoto et al. (2018) Hashimoto, T., Laporte, N., Mawatari, K., et al. 2018, Nature, 557, 392, doi: 10.1038/s41586-018-0117-z
- Heintz et al. (2023) Heintz, K. E., Watson, D., Brammer, G., et al. 2023, arXiv e-prints, arXiv:2306.00647, doi: 10.48550/arXiv.2306.00647
- Hoag et al. (2018) Hoag, A., Bradač, M., Brammer, G., et al. 2018, ApJ, 854, 39, doi: 10.3847/1538-4357/aaa9c2
- Huang et al. (2016) Huang, K.-H., Lemaux, B. C., Schmidt, K. B., et al. 2016, ApJ, 823, L14, doi: 10.3847/2041-8205/823/1/L14
- Iyer & Gawiser (2017) Iyer, K., & Gawiser, E. 2017, ApJ, 838, 127, doi: 10.3847/1538-4357/aa63f0
- Iyer et al. (2019) Iyer, K. G., Gawiser, E., Faber, S. M., et al. 2019, ApJ, 879, 116, doi: 10.3847/1538-4357/ab2052
- Kelly et al. (2015) Kelly, P. L., Rodney, S. A., Treu, T., et al. 2015, Science, 347, 1123, doi: 10.1126/science.aaa3350
- Kokorev et al. (2022) Kokorev, V., Brammer, G., Fujimoto, S., et al. 2022, ApJS, 263, 38, doi: 10.3847/1538-4365/ac9909
- Labbé et al. (2023) Labbé, I., van Dokkum, P., Nelson, E., et al. 2023, Nature, 616, 266, doi: 10.1038/s41586-023-05786-2
- Laporte et al. (2023) Laporte, N., Ellis, R. S., Witten, C. E. C., & Roberts-Borsani, G. 2023, MNRAS, 523, 3018, doi: 10.1093/mnras/stad1597
- Looser et al. (2023) Looser, T. J., D’Eugenio, F., Maiolino, R., et al. 2023, arXiv e-prints, arXiv:2302.14155, doi: 10.48550/arXiv.2302.14155
- Lotz et al. (2017) Lotz, J. M., Koekemoer, A., Coe, D., et al. 2017, ApJ, 837, 97, doi: 10.3847/1538-4357/837/1/97
- Lovell et al. (2023) Lovell, C. C., Harrison, I., Harikane, Y., Tacchella, S., & Wilkins, S. M. 2023, MNRAS, 518, 2511, doi: 10.1093/mnras/stac3224
- Mason & Gronke (2020) Mason, C. A., & Gronke, M. 2020, MNRAS, 499, 1395, doi: 10.1093/mnras/staa2910
- Matharu et al. (2021) Matharu, J., Muzzin, A., Brammer, G. B., et al. 2021, ApJ, 923, 222, doi: 10.3847/1538-4357/ac26c3
- Matharu et al. (2023) Matharu, J., Muzzin, A., Sarrouh, G. T. E., et al. 2023, ApJ, 949, L11, doi: 10.3847/2041-8213/acd1db
- Narayanan et al. (2023) Narayanan, D., Lower, S., Torrey, P., et al. 2023, arXiv e-prints, arXiv:2306.10118, doi: 10.48550/arXiv.2306.10118
- Noirot et al. (2023) Noirot, G., Desprez, G., Asada, Y., et al. 2023, MNRAS, doi: 10.1093/mnras/stad1019
- Peng et al. (2010) Peng, Y.-j., Lilly, S. J., Kovač, K., et al. 2010, ApJ, 721, 193, doi: 10.1088/0004-637X/721/1/193
- Planck Collaboration et al. (2020) Planck Collaboration, Aghanim, N., Akrami, Y., et al. 2020, A&A, 641, A6, doi: 10.1051/0004-6361/201833910
- Sorba & Sawicki (2018) Sorba, R., & Sawicki, M. 2018, MNRAS, 476, 1532, doi: 10.1093/mnras/sty186
- Strait et al. (2023) Strait, V., Brammer, G., Muzzin, A., et al. 2023, arXiv e-prints, arXiv:2303.11349, doi: 10.48550/arXiv.2303.11349
- Topping et al. (2023) Topping, M. W., Stark, D. P., Endsley, R., et al. 2023, arXiv e-prints, arXiv:2307.08835, doi: 10.48550/arXiv.2307.08835
- Treu et al. (2015) Treu, T., Schmidt, K. B., Brammer, G. B., et al. 2015, ApJ, 812, 114, doi: 10.1088/0004-637X/812/2/114
- Trussler et al. (2023) Trussler, J. A. A., Conselice, C. J., Adams, N., et al. 2023, arXiv e-prints, arXiv:2308.09665, doi: 10.48550/arXiv.2308.09665
- Valentino et al. (2023) Valentino, F., Brammer, G., Gould, K. M. L., et al. 2023, ApJ, 947, 20, doi: 10.3847/1538-4357/acbefa
- Willott et al. (2022) Willott, C. J., Doyon, R., Albert, L., et al. 2022, PASP, 134, 025002, doi: 10.1088/1538-3873/ac5158
- Zheng et al. (2012) Zheng, W., Postman, M., Zitrin, A., et al. 2012, Nature, 489, 406, doi: 10.1038/nature11446
- Zheng et al. (2017) Zheng, W., Zitrin, A., Infante, L., et al. 2017, ApJ, 836, 210, doi: 10.3847/1538-4357/aa5d55
Appendix A Photometry and SED fitting
In Table 1 we list photometry and in Table 2 derived quantities and results of SED fitting of MACS1149-JD1. All the procedures are described in the main text.
| Filter | C #1 | C #2 | C #3 | G |
|---|---|---|---|---|
| (nJy) | (nJy) | (nJy) | (nJy) | |
| NIRISS | ||||
| F150W | ||||
| F200W | ||||
| NIRCam | ||||
| F150W | ||||
| F200W | ||||
| F277W | ||||
| F356W | ||||
| F410M | ||||
| F444W | ||||