Large-scale Information Retrieval in Software Engineering - An Experience Report from Industrial Application
Abstract
Background: Software Engineering activities are information intensive. Research proposes Information Retrieval (IR) techniques to support engineers in their daily tasks, such as establishing and maintaining traceability links, fault identification, and software maintenance. Objective: We describe an engineering task, test case selection, and illustrate our problem analysis and solution discovery process. The objective of the study is to gain an understanding of to what extent IR techniques (one potential solution) can be applied to test case selection and provide decision support in a large-scale, industrial setting. Method: We analyze, in the context of the studied company, how test case selection is performed and design a series of experiments evaluating the performance of different IR techniques. Each experiment provides lessons learned from implementation, execution, and results, feeding to its successor. Results: The three experiments led to the following observations: 1) there is a lack of research on scalable parameter optimization of IR techniques for software engineering problems; 2) scaling IR techniques to industry data is challenging, in particular for latent semantic analysis; 3) the IR context poses constraints on the empirical evaluation of IR techniques, requiring more research on developing valid statistical approaches. Conclusions: We believe that our experiences in conducting a series of IR experiments with industry grade data are valuable for peer researchers so that they can avoid the pitfalls that we have encountered. Furthermore, we identified challenges that need to be addressed in order to bridge the gap between laboratory IR experiments and real applications of IR in the industry.
Keywords:
Test Case Selection Information Retrieval Data Mining Experiment1 Introduction
The field of Software Engineering thrives on the continuous interchange of knowledge and experience between those who research and those who practice (Wohlin et al, 2012). Research without application is, in the long-term, meaningless and application without research leads to stagnation (Ivarsson and Gorschek, 2011). This view requires that research efforts are seeded by concrete problem statements from industry, and that solutions are evaluated within industrial applications and validated by practitioners (Gorschek et al, 2006). Scientific advances require also that results are reproducible, which in turn is only possible with disciplined reporting that covers the necessary details to replicate studies. Shepperd et al (2014) performed a meta-analysis on 600 software defect prediction (SDP) results published in literature and determined that differences in prediction performance varies with the research group rather than the studied SDP technique. They suggest that this researcher bias could be addressed by improving the communication of study designs and details of the used technologies.
On that note, even though we address a different issue than SDP, we report on experiences in identifying, developing and evaluating a potential solution for our industrial partner: test case selection (Rothermel and Harrold, 1996) decision support by Information Retrieval techniques (Grossman and Frieder, 2004). The main goal of this paper is to illustrate the path from problem identification to solution definition and evaluation, and to dissect the taken design decisions that address a real-world software engineering problem. With complex problem statements it is sensible to develop new solutions upon existing and validated building blocks. We identified IR techniques, as they are applied in traceability recovery (Borg et al, 2013) in general and feature location (Dit et al, 2011b) in particular, as part of a potential solution and performed a series of experiments with the goal to evaluate whether the overall approach is feasible. We illustrate the design and evolution of the experiments, pointing out practical implementation challenges that we encountered while adapting IR techniques proposed by research. Even though this research was driven by eventually developing a workable solution for test case selection decision support, we focus in this paper on the lessons learned from designing and executing the experiments. Thereby, we make the following contributions:
-
•
An application of IR techniques to support test case selection in a Software Product Line context.
-
•
An illustration of three experimental setups, each leading to a set of new research challenges for IR applications on industry-grade data.
The remainder of this paper is structured as follows. In Section 2 we present the context in which we conducted the research, illustrate the envisioned solution and discuss related work. Section 3 provides the formal problem definition that guides the overall design of the experiment. In Section 4 we illustrate the design, execution, results and lessons learned from each of the three experimental setups. The paper concludes in Section 5, pointing out avenues for future work.
2 Background and related work
This research is conducted in collaboration with ES (“Embedded Systems”, name anonymized for confidentiality reasons) and the solution development is driven by their particular context and requirements. In this section, we first give an overview of the case context and problem (Section 2.1). We take then a step back and analyze the problem with respect to the state of art (Section 2.2) before sketching a solution in Section 2.3. We discuss related work in Section 2.4.
2.1 Case context
ES, developing both hard- and software for their worldwide marketed products, has a three-decade history in developing embedded systems, although the particular applications areas have changed over time.
2.1.1 Variability management and consequences for quality assurance
In autumn 2011, we performed a lightweight process assessment (Pettersson et al, 2008) at ES in order to identify improvement opportunities, in particular in the coordination between requirements engineering and software testing. We interviewed 16 employees (line managers, product and project managers, test and technology leads, and test engineers) and reviewed project documentation, test runs and trouble reports of two recently completed projects. As observed by Thörn (2010) in small and medium sized companies, we identified also at ES a lack of variability management in the problem space (requirements analysis, specification and maintenance). This has historical reasons, mostly attributed to the strong technical support for managing variants in the solution space (separate development of a platform and product specific software). ES generally develops a new product generation on the basis of their current products, reusing and extending the existing requirements specifications. This has the advantage that the requirements management process is lightweight and requires minimal documentation. However, this can also lead to challenges for impact analysis of new features since relationships between requirements are not documented (Graaf et al, 2003). The interviewed test engineers at ES also indicated that without variability management, they may select system test cases that are not applicable for a particular product. This can lead to a lower efficiency in test execution as information on applicability needs to be retrieved from the project (project manager or product expert) or by an in-depth analysis of the particular test case and product. Looking at the test case database at ES, for a typical product release, 400-1000 system test-cases are selected, run and evaluated, each consisting of up to 20 manual test steps. An improved test case selection can therefore reduce rework and time-to-market.
ES initiated different programs to improve their quality assurance efficiency. They introduced a risk-based strategy in order to focus the testing effort on those parts of the product carrying a risk to contain faults, optimizing thereby available time and resources. The risk-based test selection is based upon expert judgments from technology leads, product experts and test maintainers, but also on historical data from test runs of similar products. Furthermore, automated integration tests are run on every version control system commit and before the product is handed over to the quality assurance (QA) department. A third avenue to achieve a more precise test case selection, developed at ES, is described next.
2.1.2 Test case selection based on product configurations
For ES, an important criterion to adopt any test case selection support is to reuse as many existing resources and artifacts as possible, causing very little additional up-front investments to the overall development process. The developed approach leverages on the existing technical infrastructure managing product variants in the solution space, where a central configuration file determines the activation state of a feature in the product. The approach consists of:
-
•
a parser that determines the activation state of a feature from the central configuration file,
-
•
the creation of a mapping between features and test-case modules (containing a set of related test-cases), verified by product experts.
A product delivered to QA can be analyzed automatically to determine the activation status of its features. The parser creates a Product Configuration Report (PCR) that is used by QA engineers to guide the selection of system test cases. Testers need thereby to map between product features and test modules. In the current implementation, this solution has the following weak points:
-
•
The feature list in the PCR is incomplete, i.e. some test case modules can not be mapped to a feature.
-
•
Some test-cases need to be executed for every product. These test cases are also not mapped to a feature in the PCR.
-
•
The granularity of the feature list in the PCR disallows a mapping to specific test cases.
-
•
The mapping is static. If the organization of the test case modules changes or features in the central configuration file change, testers and product experts need to re-verify the mapping.
Based on these observations we started to explore alternative approaches to address the test case selection problem.
2.2 Overview of the state of art
As illustrated in Section 2.1.1, ES resides in a Software Product Line (SPL) (Clements and Northrop, 2001) context, where verification and validation is difficult due to the large number of product combinations that can be created (Perrouin et al, 2010). This problem is aggravated when the product is a combination of software and hardware, since late identification of defects when verifying an embedded system is costly (Broy, 2006; Ebert and Jones, 2009). Model-based testing (MBT) techniques (Utting et al, 2012) have been proposed to address this complex challenge from an SPL perspective (see Engström and Runeson (2011) for a review of solution proposals). However, many of these proposals assume that companies apply variability management (Babar et al, 2010) in their product lines, allowing the derivation of test strategies and the efficient selection of test cases. Chen and Babar (2011) reviewed the variability management techniques proposed in literature, showing that the majority is not validated in an industrial context. This is supported by the observation by Thörn (2010) that companies have control over variation in the solution space, lack however techniques and methods for variability management in the product and problem space. With a lack of variability management in the problem space, as it is the case for our case company, software product line testing principles (Pohl and Metzger, 2006) or test case selection techniques (Lee et al, 2012) are not applicable without upfront investment. Since reuse of existing resources and artifacts is a major criterion for ES to adapt a solution (see Section 2.1.2), we sought for alternatives.
Test case selection, in the context of regression testing, encompasses the problem of choosing a subset of test cases, relevant to a change in the system under test, from a set of existing test cases (Rothermel and Harrold, 1996). To address this engineering problem, various techniques have been developed (see Engström et al (2010) and Yoo and Harman (2012) for comprehensive reviews). In general, they can be classified into white and black-box selection techniques. The former rely upon structural knowledge of the system under test, exploiting, for example, changes in source code, data and control flow, or execution traces (Yoo and Harman, 2012). The latter use other work products, such as design documentation, to perform impact analysis (Yoo and Harman, 2012). Both white and black-box test case selection techniques assume some sort of traceability between the changed artifact and the relevant test cases. Since the lack of variability management excludes the black-box selection approaches, ES has implemented traceability between product configurations and test cases as described in Section 2.1.2, with the observed drawbacks. Next, we give a motivation and outline for the solution we aim to implement and evaluate in the remainder of this paper.
2.3 Solution development
| Artifact | Benefits | Liabilities |
|---|---|---|
| PFD is a design document written in natural language that details of what a certain functionality consists of and how it is intended to be used. | Detailed and accurately linked to a particular product variant. | Exists only for newly introduced features, i.e. is incomplete w.r.t. the overall functionality of a product variant. |
| PCS contains all available configuration options and dependencies among them, used to configure a product at build-time | Straightforward identification of activated/de-activated features | Not all tested features are activated/de-activated at build-time |
| Source code | Complete w.r.t. identifying both build-time and run-time bound functionality. | Lowest possible abstraction level for representing features |
| Version Control data | Provides semantic information to source code changes, such as commit comments, time, scale and frequency of changes. | Except for commit comments, little use for feature identification if not used in combination with source code. |
We outline the solution development approach by breaking down the test case selection problem into two objectives.
The first objective is to identify the to-be-tested features in a particular product variant that is delivered to QA. Currently, product variants are not managed in the problem space (e.g. in the requirements specifications) at ES. Hence, other work products that are created during the project and that are up-to-date when the product is delivered to QA need to be used instead. Table 1 summarizes those candidate artifacts that fulfill these criteria.
The second objective is to map system test-cases to identified features. A system test-case contains information on the overall objectives of the test, acceptance criteria, and test steps. By establishing a trace link between a feature in a particular product variant and the set of relevant test-cases for that feature, test-case selection can be performed. In ES’s solution, the mapping between the PCR and test-case modules is performed manually, which leads to the drawbacks illustrated in Section 2.1.2.
Looking at the available artifacts in Table 1, only the source code artifacts provide complete information on the functionality in a particular product variant. On the other hand, the source code information (comments, method and variable identifiers, and literals) regarding each feature is given at a low abstraction level, compared to the other work products, i.e. the PCS and the PFD.
Inspired by ES’s semi-automatic solution that uses the PCS and expert judgment for test-case selection, we envision a solution that is applicable on source code, providing feature existence information, and is not dependent on regular expert input. In the area of source code mining, in particular textual feature location techniques based on natural language processing (NLP)111Note that the terms NLP and IR are independently used in literature to describe computerized processing of text and there is an overlap on what they comprise (Falessi et al, 2013). In the remainder of the paper we use exclusively the term IR to maintain consistency. or information retrieval (IR) (Grossman and Frieder, 2004) seem promising. The goal of feature location is to support software developers in maintenance tasks by identifying relevant locations in the source code, e.g. to remove a fault or to extend a feature. The premise of textual feature location is that comments, identifiers, and literals encode domain knowledge, representing features than can be located in the source code by a set of similar terms (Dit et al, 2011b).
The test case selection problem and the two outlined objectives at the beginning of this subsection can be formulated as a feature location problem: Given a test-case, representing a particular feature, locate the source code that implements that feature in the given product variant. The test case serves thereby as query, returning a list of artifacts ranked according to their similarity to the test case. Note that the specific problem of feature location can be also seen in the wider context of traceability recovery. The decision whether the given test case is selected or not, depends on whether the highest ranked artifact has a similarity score above or below a threshold . The particular value for is not known in advance and must be determined experimentally, with a confidence interval such that the test engineer can gauge the robustness of the suggestion. Determining can be achieved by sampling a set of features for which the following is known: (a) the test case(s) verifying the feature and (b) the source code implementing the feature. We call this relationship between feature, test case(s) and source code a feature chain. Once the value and confidence interval for the threshold is determined, it can be used to perform test case selection.
Note that this solution description is the starting point and not the outcome of our investigation. We provide a more formal problem definition in Section 3 and illustrate three experimental setups (Section 4) that were designed to study to what degree IR techniques can be used to support test case selection with industry grade data.
2.4 Related work
2.4.1 Traceability Recovery
Mapping product features from source code to the respective test cases, as described in Section 2.3, is related to traceability (Gotel and Finkelstein, 1994) in general, and to the concept assignment problem (Biggerstaff et al, 1993) in particular. Concept assignment is the process of mapping concepts from the problem domain (e.g. a requirement or feature expressed in potentially ambiguous and imprecise natural language) to the solution domain (e.g. an algorithm expressed in precise and unambiguous numerical computations). Recovering traceability links between source code and natural language documentation using IR techniques was pioneered by Antoniol et al (1999, 2000), Maletic and Valluri (1999) and Maletic and Marcus (2000, 2001). These early studies envisioned the potential of IR techniques to support software engineers in program comprehension (Maletic and Valluri, 1999; Antoniol et al, 1999), requirement tracing and impact analysis, software reuse and maintenance (Antoniol et al, 1999). Following these initial investigations, comprehensive experiments were conducted, studying particular IR techniques in depth (e.g. Marcus et al (2004); Zhao et al (2006); De Lucia et al (2007); Poshyvanyk et al (2012)) or comparing newly proposed techniques to previously studied ones (e.g. Marcus and Maletic (2003); Poshyvanyk et al (2006); Cleary et al (2009)). A large part of these studies use small scale data sets, derived from open source applications or public repositories. Furthermore, while a large body of work w.r.t. traceability recovery has been reviewed by Borg et al (2013), only a few addressed the recovery of links between source code and test cases (e.g. De Lucia et al (2006, 2009, 2011)), and have been evaluated only on student projects (Borg et al, 2013).
Besides the study of individual IR techniques and their traceability recovery performance, investigations into the hybrid techniques show promise. Gethers et al (2011) combined deterministic and probabilistic IR techniques, exploiting the fact that they capture different information. While this hybrid traceability recovery approach outperformed the individual techniques, determining the number of topics in the probabilistic approach (Steyvers and Griffiths, 2007) and finding an optimal combination of the individual approaches are still research challenges (Gethers et al, 2011). More recently, Qusef et al (2014) combined textual and runtime information to recover traceability between source code and unit test cases. In their approach, first the runtime information is used to create a candidate list of traces, which is then further refined in a second step which analyzes textual information. While the evaluation of this hybrid technique indicates that it outperforms the precision of individual techniques (Qusef et al, 2014), it requires the collection of a test execution trace and has been designed for unit-testing, i.e. white-box testing.
2.4.2 Test case prioritization
While test case selection encompasses the problem of identifying test cases relevant to a change in the system under test, prioritization aims at ordering test cases such that defects are detected as early as possible (Yoo and Harman, 2012). Islam et al (2012) recover traceability links between source code and system requirements with IR techniques and use this information together with code coverage and test execution cost to identify optimal test orderings. This approach requires structural knowledge of the system under test, i.e. source code in this particular case. Thomas et al (2014) propose therefore an approach that relies only upon data originating from the test cases. They use an IR technique to measure the similarity between test cases and prioritize them such that dissimilar test cases are run first.
2.4.3 Configuration of IR techniques
Numerous studies proposed and evaluated IR techniques for different software engineering tasks (see the systematic literature reviews by Dit et al (2011b) and Borg et al (2013)), leading to the need of systematically comparing and evaluating these techniques. The fundamental idea behind any configuration optimization is to guide the process by a data-driven parameter selection. For example, Falessi et al (2013) use IR techniques to detect equivalent requirements and evaluate the performance of 242 configurations. While they identify an optimal technique, they point out that the particular parameters are dependent on the underlying data set, which means that the identification of the optimal technique configuration requires considerable effort. Lohar et al (2013) propose therefore to use Genetic Algorithms (Goldberg, 1989) to search for the optimal IR technique configuration. A similar approach was proposed by Panichella et al (2013) to configure probabilistic IR techniques (Latent Dirichlet Allocation (Blei et al, 2003)).
2.4.4 Contribution
Traceability recovery supported by IR techniques has seen a lot of research in many application areas in software engineering (see Section 2.4.1). However, research on traceability recovery with IR techniques between source code and test cases has been rare (Borg et al, 2013), or not designed for black-box system testing (e.g. Qusef et al (2014)). In this paper we propose to use IR techniques for test case selection in the context of Software Product Lines. While IR techniques have been applied for test case prioritization (see Section 2.4.2), their use in test case selection has received less attention. IR techniques need to be configured in order to reach optimal performance. Recent studies show that configuring IR techniques should be driven by experiments since the performance depends on the underlying data (see Section 2.4.3). We use an industrial data set that is at least by an order of magnitude larger than in previous studies attempting to configure IR techniques. We report on the practical implementation of our proposed test selection techniques, the challenges we encountered and the lessons learned in evaluating the approach experimentally.
3 Research method
In Section 2.3 we stated the informal hypothesis that textual feature location based on IR techniques can be used to support test case selection decisions. Therefore, using the goal-question-metric method (Basili and Caldiera, 1995) to specify the goal (Dyba et al, 2005) of this study, we:
Analyze IR techniques, for the purpose of evaluation, with respect to their support for test case selection, from the point of view of the practitioner, in the context of industry-grade software development artifacts.
Based on this goal definition, we state the following research questions.
- •
-
RQ-1 To what extent can state-of-the-art IR techniques be applied in a large-scale industrial context?
- •
-
RQ-2 To what extent do the used software development artifacts influence the performance of IR techniques?
- •
-
RQ-3 To what extent can the studied IR techniques support test case selection?
We defined the problem in the context of our industrial partner and use their data to design, implement and evaluate a solution candidate. This approach differs from previous IR experiments on textual feature location which are mostly limited to preliminary evaluations in academic contexts (Dit et al, 2011b). Hence, the purpose of RQ1 is to understand the challenges and to identify solutions for conducting IR experiments on data sets whose characteristics correspond to data sets from the problem domain. We conduct an experiment that evolves over three setups and address RQ-1 by reporting on lessons learned and analyzing them w.r.t. previous IR experiments reported in literature. With RQ-2 we aim to understand the impact of input data characteristics on the performance of IR techniques. With IR performance we refer to both the techniques’ efficiency in terms of computational cost and to the techniques’ effectiveness (the specific effectiveness measures differ in the experimental setups and are defined there). We address RQ-2 in Experimental Setup 2 and 3. The purpose of RQ-3 is to compare the studied IR techniques and to determine whether the approach of using feature location as an aid to test case selection is feasible. We address RQ-3 in Experimental Setup 3. The remainder of this section describes the overall design of our experiment.
3.1 Description of objects
The objects of the experiment are software development artifacts belonging to the implementation (source code, configuration files, user help documentation) and the system test (natural language test steps) domain.
In the implementation domain, there is a set of features , where is the total number of features, that represent the configurable functionality of a family of systems . The feature vector , where , identifies a particular variant of the system family . Furthermore, there is a set of source code files , where is the total number of source code files, each consisting of a set of source code lines , where is the total number of lines in that source code file. Depending on the particular implementation of a feature, there exists a mapping of feature to either:
-
•
, i.e. a subset of the source code files
-
•
, i.e. a subset of the source code lines
-
•
a combination of the above, i.e. feature is mapped to a subset of the source code files and a subset of source code lines
Note that and , i.e. there is a subset of source code files/lines that are not mapped to any configurable feature. Those source code files/lines are common to every system variant in .
In the system test domain, there is a set of test cases , where is the total number of test cases. A test case is a natural language document that contains categorization information (test case name, test module name, test module information) and test execution information (assumptions, initialization information, acceptance criteria, test objective, test steps).
3.2 Feature chains
Specific instances of the objects defined in Section 3.1 determine a feature chain, connecting features, source code and test cases (Figure 1). A feature chain consists of two links:
-
1.
Feature to test cases: established by senior test engineers, linking a subset of all features to a subset of all test-cases , i.e. , where .
-
2.
Feature to product artifacts: established by identifying the impact of the configuration switch activating/deactivating a feature on product artifacts (i.e. file and/or line addition/removal).
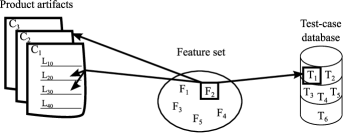
A feature chain connects the artifacts from the implementation and system test domain. Figure 1 illustrates this concept. Feature is verified by test case . This connection is established by a senior test engineer. Feature is implemented in source code file and in lines to in file . This connection is established by identifying the impact of the configuration switch activating/deactivating feature on , , and .
3.3 Independent variables
The potential independent variables, i.e. the variables that can be controlled and manipulated in the experiment, are numerous. Since the overall architecture of IR techniques is that of a pipeline, individual components can generally be replaced as long as input/output constrains are satisfied. Falessi et al (2013) propose a classification of IR techniques consisting of four main components: IR model, term extraction, weighting schema, and similarity metric222Grossman and Frieder (2004) provides a broader overview. For each of these dimensions, it is possible to identify multiple factors that deserve consideration in an experiment evaluating IR techniques. However, since the main purpose of this study is to determine the feasibility of IR techniques for test case selection, we limit the number of independent variables and values to a realizable number (see Table 2). As it turned out during the execution of the experiment, with increasing complexity and amount of data on which the IR techniques are applied, we had to remove values as they were not feasible to manipulate, but also added values as the data required e.g. additional pre-processing. These decisions are motivated and documented in the corresponding experimental setup in Section 4. We describe now the independent variables shown in Table 2 in more detail.
| IV | Test case content | Term extraction | IR Model |
|---|---|---|---|
| Full test case | Tokenization | VSM | |
| Values | Test case except test steps | Stop words | LSA |
| Acceptance criteria and objective | Stemming |
As described in Section 3.1, test cases consist of categorization and execution information, containing information that is not necessarily connected to the to-be-tested feature. For example, assumptions, initialization information and test steps may refer to pre-requisite functionality that is verified by another dedicated test case. Hence, it is necessary to identify the test case content that is the most effective, i.e. encode the most information on a feature with the least amount of noise.
Term extraction refers to pre-processing techniques applied incrementally on the analyzed texts, where the simplest form, tokenization and stop-word removal, can be extended by stemming (Falessi et al, 2013). Furthermore, techniques exist that aim specifically to improve IR applied on source code, e.g. by splitting (Enslen et al, 2009; Dit et al, 2011a) or expanding identifiers (Hill et al, 2008; Lawrie and Binkley, 2011) or a combination of both (Guerrouj et al, 2011; Corazza et al, 2012). Even though these techniques seem to improve the performance of IR, they have been implemented for and validated against only a subset (Java, C, C++) of the programming languages we encountered in a product (see Section 4.1.3). Therefore, we decided against adding them as a manipulated variable in our experiment.
An IR model evaluates the semantic similarity between text documents (Falessi et al, 2013). The vector space model (VSM) (Salton et al, 1975) and latent semantic analysis (LSA) (Deerwester et al, 1990) both represent documents as term-frequency vectors and consider the distance between these vectors as semantic dissimilarity. LSA, an extension to the VSM, considers co-occurrence of terms (Falessi et al, 2013) in order to address synonymy (the same meaning - different terms) and polysemy (different meanings - the same term) (Deerwester et al, 1990). Note that LSA is a parameterized model, increasing the number of independent variables.
3.4 Validity threats
We use Wohlin et al (2000) to structure this analysis and discuss the threat categories in the suggested priority for empirical software engineering experiments: internal, external, construct and conclusion threats. For each category, we discuss only those threats that apply to the experiment design formulated in this section.
3.4.1 Internal validity
The instrumentation threat refers to the effects caused by the artifacts used for experiment implementation. The impact of the used artifacts is a central aspect of the study overall, but in particular of the experimental design and its implementation in three setups. As such, we are explicitly addressing and discussing instrumentation and its effect in each setup.
The selection threat refers to the variation of the chosen objects in the experiment. The feature chains are determined by the possibility to establish an association between a particular feature and the test cases that verify that feature. As such, the selection of features is biased towards those for which the tasked test engineers could create such a mapping. We have however no indication that the non-random selection of features introduced a systematic bias towards product variants and their artifacts or types of system test cases.
3.4.2 External validity
The interaction of selection/setting and treatment threat refers to the selection of objects from a population that is not representative for the population to which we want to generalize. We address this threat by sampling objects from an industry setting which is the population to which we generalize our results.
3.4.3 Construct validity
Inadequate pre-operational explication of constructs refers to the threat of insufficiently defining the theoretical constructs of the experiment. We address this threat by formalizing the relationships of the objects, i.e. the feature chain and its components, in the experimental design and using this formalization in the execution of the three experiments. However, there is a threat that the mapping of test cases to features, necessary for constructing a feature chain, was biased by the understanding and experience of a single tester. We addressed this by involving two test engineers in this process.
A mono-operation bias exists in an experiment if the limited number of independent variables, objects or treatments leads to an incomplete picture of the theory. While we aimed at selecting a sensible variation of independent variables, the choice was eventually limited by the practical constraints of implementing the experiment on industry grade data sets, that addressed external validity threats. This is a trade-off between conflicting validity threats one has to consider when performing applied research Wohlin et al (2000). Other studies focus on a broader coverage of IR configurations, e.g. Falessi et al (2013) and Biggers et al (2014).
3.4.4 Conclusion validity
There is a moderate threat of low statistical power w.r.t. the conclusions made in Experimental Setup 3. The cost for establishing an observation (feature chain) considerably limited the number of observations that could be made with reasonable effort, also from the industry participants.
We address the threat of violated assumptions of statistical tests by an in-depth analysis of the experimental design and choice of statistical techniques (see Section 4.3.5).
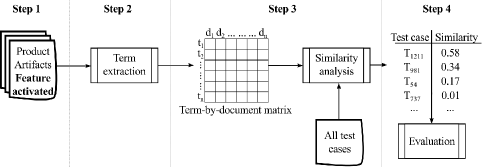
While the implementation of corpus creation, term extraction, similarity analysis and evaluation differed in the three experimental setups (see Figure 2) due do their varying objectives, we consider the threat of reliability of treatment implementation low. The implementation of the four steps did not change within a experimental setup and is available in the supplementary material (Unterkalmsteiner et al, 2014) for reference.
4 Experimental setups and evaluation
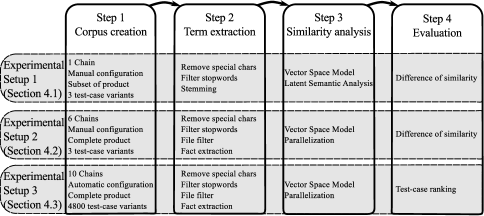
In this section we illustrate three major experimental setups whose implementation is guided by the design presented in Section 3. Each setup had a particular objective and its implementation lead to lessons learned, motivating and shaping the objectives of the subsequent setup.
The execution of the experiment follows the general flow shown in Figure 2 in all three setups. In Step 1, we create the corpus for a chain, consisting of the configured product artifacts and test-cases. In Step 2, the corpus is textually pre-processed, which removes noise and prepares the data for the subsequent analysis in Step 3. We perform the evaluation of the IR technique in Step 4. With each experimental setup, the steps are refined to address issues and lessons learned from the predecessor. An overview of the differences between the three experimental setups is shown in Figure 2, while the details are discussed in the respective subsections.
4.1 Experimental Setup 1: Pilot Experiment
The motivation for preparing a pilot experiment is to get an intuition whether IR techniques can be used to solve the test case selection problem. Therefore, we designed an experimental setup that tests the sensitivity of IR. In other words, we want to determine whether the signal provided by the test cases is strong enough to differentiate between a feature-activated and a feature-deactivated corpus.
Formally, using the notation introduced in Section 3.1, we have in Experimental Setup 1 one feature chain that includes feature and test case . Therefore, we have two feature vectors and , resulting in two system variants and . We evaluate whether , where is the test case mapped to feature . As for independent variables, we manipulate the content of and the IR model (see Table 2). Figure 2 illustrates the configuration of each step in this setup, further detailed in subsections 4.1.1 - 4.1.4 and in Figure 3.
The overall objectives of the pilot experiment are to:
-
•
increase the understanding of the analyzed data (product artifacts, test cases)
-
•
identify and evaluate IR tools which can be used to implement and execute the experiments
-
•
provide evidence on whether this approach is generally feasible or not
4.1.1 Step 1 - Corpus creation
The product is configured by a collection of GNU autotools (Calcote, 2010) scripts and built with GNU make (Feldman, 1979). In a typical product build, several hundred software packages are fetched from the version control system server, configured, compiled and packaged into an image that can be installed onto the respective camera model.
For the pilot experiment, we selected one feature that is implemented in a relatively small software package (368 files). On activation, the feature affects 10 source code files (8 modifications and 2 additions). The build system uses filepp333http://www-users.york.ac.uk/~dm26/filepp, a file pre-processor, to apply configuration switches on plain text and HTML files. By manually invoking filepp on the software package that implements the user interface, we generated two variants with 10 distinct and 358 shared files.
4.1.2 Step 2 - Term extraction
We applied the following pre-processing steps on both the source code and test case variants:
-
•
filtered numeric, punctuation and special characters444using GNU sed, http://www.gnu.org/software/sed/
-
•
filtered stop-words; English, and HTML/javascript keywords
-
•
performed word stemming
Stop-word filtering and word stemming were implemented using the generic data mining tool Rapidminer555http://www.rapidminer.com, version 5, which was also used in the next step.
4.1.3 Step 3 - Similarity analysis
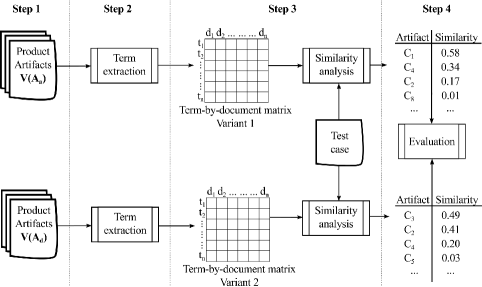
Figure 3 illustrates the pilot setup in more detail, emphasizing the fact that we are working with two corpora ( and with activated and deactivated feature).
When creating the term-by-document matrix in Step 3, one has to decide on the document granularity, i.e. on how the corpus is divided into documents. Commonly, when analyzing similarity in source code, documents are defined as a method (Marcus et al, 2004; Cleary et al, 2009), a class (Antoniol et al, 2002) or a file (Marcus and Maletic, 2003). We defined a file as a document due to the heterogeneity of the source code (markup, procedural, object oriented languages).

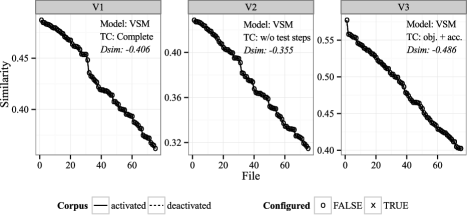
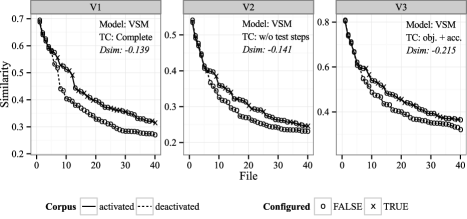
We applied VSM and LSA on the corpora, resulting in a list of ranked documents according to their similarity to the test case. Figure 4 shows the results of 12 runs of the pilot experiment: with the VSM, we varied the test case content (V1-V3), whereas with LSA, we also varied dimension reduction (V4abc-V6abc). For each run, we plotted the cosine similarity of the first 30 ranked documents (for all runs, the similarity values approach values below 0.1 after 30 documents and showing all documents would render the plots more difficult to read). Furthermore, documents that differ between the two corpora, i.e. that are affected by activating/deactivating the feature, are marked with an “x”-symbol.
Looking at Figure 4, it can be observed that for all runs, in the feature activated corpus (solid line), configured documents are ranked first (e.g. 4 in V1, 2 in V4a, etc). This shows that, for this particular corpus and test case, all IR techniques and combinations are able to locate the feature in question. However, we are interested in differences between corpora (solid and dashed lines). These differences are visible in runs V1-V3 (VSM), i.e. the maximum similarity of the feature activated corpus is higher than the one of the feature deactivated corpus. Furthermore, the solid line (activated corpus) is consistently above the dashed line (deactivated corpus). This indicates that, at least visually, we can differentiate between the two corpora. This changes in runs V4-V6 (LSA), rendering the visual differentiation more difficult. We can observe that the maximum similarity in run V4a is higher in the feature deactivated corpus higher than in the feature activated corpus. Furthermore, in runs V(456)b and V(456)c the solid line intersects the dashed line at around file 8, indicating that the overall calculated similarity between test case and feature deactivated corpus is higher than for the feature activated corpus.
These results are promising as they indicate that a differentiation between a feature activated and deactivated corpus is possible, i.e. that there is a discerning signal in this particular test case and IR techniques are able to detect that signal. However, in order to determine which combination of test-case component and IR technique performs best, we need to define a measure that is able to express the visually determinable difference as a numerical value, as shown next.
4.1.4 Step 4 - Evaluation
In Section 4.1 we defined an experimental setup with two corpora in order to test whether IR techniques can differentiate, given a test case, between the two product variants. This is motivated by our aim for test case selection, which needs to determine the existence/non-existence of a feature, but not necessarily its exact location.
However, this also means that the traditional class of performance measures, e.g. precision and recall, based on a confusion matrix, cannot be used for the following reason. In a binary classification problem, the confusion matrix contains four classes: true positives, true negatives, false positives, and false negatives. Given an arbitrary threshold value for the calculated similarity between document (source code) and query (test case), one can define a confusion matrix for the corpus where the feature is activated. However, given a corpus where the feature is deactivated, the number of true positives and false negatives, i.e. the number of relevant documents, is by definition zero. In other words, no classification takes place in the feature deactivated corpus. Hence, measures based on the confusion matrix are unsuitable in this case.
Therefore, we develop a measure based on similarity and the given ground truth. Similarity, a direct measure as opposed to the derived precision/recall pair, has been used by Falessi et al (2013) to construct a credibility measure. Following this example, we construct a differential similarity measure,
| (1) |
which is the difference of the maximum similarity values of the two corpora. Note that the maximum similarity for the feature activated corpus is taken from the artifact that was actually affected by the feature activation, i.e. is configured. Since the calculated similarity between two documents ranges from 0 to 1, the range for Dsim is between -1 and 1. 1 indicates a perfect true differentiation, 0 no differentiation at all, and -1 a perfect false differentiation. A false differentiation occurs when the IR technique fails to connect the test case to the correct, i.e. configured, source code artifacts.
It would be possible to construct sophisticated measures, incorporating more of the distinguishing features of the curves in Figure 4 and the characteristics of feature locations. For example, one can assume that features are implemented in a small number of files out of a larger set. Then, the similarity for this small number of files would be large, followed by a drop-down and a quick convergence to 0 (as it can be observed in all curves of the feature activated corpus in Figure 4). For the feature deactivated corpus, one would expect only a small drop-down in similarity and a rather slow convergence to 0, as it can be observed in V(456)c in Figure 4. These features of the curves, drop-down and convergence of similarity measures, could be used to define more accurate differential similarity measures. However, this approach would be threatened by an over-fitting of the measure definition to the given data, resulting in a measure that would represent well the current, but not the future data. Hence, we choose the simple measure that relies only on the maximum similarity values.
4.1.5 Discussion and Lessons Learned
We start this section by discussing the results of the evaluation and then elaborate on the lessons learned from the implementation of Experimental Setup 1, addressing RQ-1.
Looking at Figure 4, run V5b, V6c and V6b achieve the largest value, indicating that LSA performs better than VSM (V1-V3). In general, we can observe that the more specific the test case content, the larger the value, i.e. using the complete test case is consistently worse (for both VSM and LSA) than using a subset of the test case. This is an important result as it indicates that test cases contain noise that can be reduced by a selective removal of test-case content.
In this pilot setup, we test our idea of using IR techniques for test case selection. The results, illustrated in Figure 4, indicate that for this particular chain and subset of documents, we can indeed differentiate between a feature activated and a feature deactivated variant of a product, using the corresponding test case as a probe. However, further experimentation as described in Section 4.2 is required to investigate the scalability and generalizability of the approach.
Looking at the number of published studies in the field of feature location (Dit et al, 2011b), or in other areas where IR techniques are applied, e.g. traceability research (Borg et al, 2013), one would assume that literature provides both technical and methodological guidance to implement and evaluate IR-based solutions, adapted for the particular problem context. However, very few studies provide enough detail to implement their proposed approach. None of the 14 publications that study textual feature location techniques based on VSM and/or LSA reviewed by Dit et al (2011b) provides prototype implementations. Few mention existing tools that were used to implement parts of the proposed approaches. Abadi et al (2008) and Gay et al (2009) use Apache Lucene (The Apache Software Foundation, 2014) as the VSM implementation, and Cleary et al (2009) mention SVDPACKC (Berry, 2014) as an implementation for singular value decomposition (SVD), a procedure required for LSA. Lormans and van Deursen (2006) use the Text to Matrix Generator toolbox (Zeimpekis and Gallopoulos, 2006), a Matlab module for text mining.
However, none of these tools lends itself to set up an experimental environment that allows one to explore data and technologies. Therefore, we implemented the process in Figure 2 with the off-the-shelf data-mining tool Rapidminer. The tool provides text processing capabilities and the necessary operators to implement VSM and LSA models. Furthermore, analyses can be constructed through the component-based graphical process designer, allowing for quick exploration of ideas. However, this convenience limits flexibility, e.g. by providing only a limited number of term weight functions666Nevertheless, standard functionality can be extended through Rapidminers’ plugin mechanism. Furthermore, the execution time for a single experiment run in the pilot does not scale to the amount of data in an actual chain. We implemented therefore the pilot process and the following experimental setups with shell scripts the statistical software package R (Crawley, 2007), available in the supplementary material (Unterkalmsteiner et al, 2014). While there exist efforts to reduce the barrier for conducting IR experiments, e.g. with TraceLab (Cleland-Huang et al, 2011; Dit et al, 2014), researchers require also the flexibility of general purpose statistical software. For example, Dit et al (2013) piloted their approach with TraceLab, implemented the final experiment (Panichella et al, 2013) however with R. This mirrors our experience with Rapidminer and R, where the former provides the ease of use for quick experimental exploration while the latter enables flexible configuration and batch processing.
The studies reviewed by Dit et al (2011b) and Borg et al (2013) usually describe process steps, such as corpus creation, indexing, query formulation, and ranking. However, this information alone is insufficient to re-implement the proposed approaches as the IR techniques’ behavior is defined by a set of parameters (Thomas et al, 2013), including pre-processing steps, input data, term weights, similarity metrics and algorithm-specific variations such as the dimensionality reduction factor for LSA. Choosing is a matter of experimenting with the data at hand to identify the value that provides the best retrieval performance (Deerwester et al, 1990). When comparing different algorithms, it is necessary to identify the optimal parameters in order to provide a “fair” comparison (Hooker, 1995). This process is referred to as parameter tuning (see for example Lavesson and Davidsson (2006) and Arcuri and Fraser (2011)). Few of the studies reviewed by Dit et al (2011b) and Borg et al (2013) tune to their LSA application. Some pick based on experiences from previous studies (e.g. from Deerwester et al (1990) and Dumais (1992)), which is however a questionable practice: these early studies use benchmark data-sets unrelated to the software engineering context. Furthermore, SVD on large, sparse matrices is a computationally expensive operation. Iterative implementations (e.g. Berry (2014)) using the Lanczos algorithm (Cullum and Willoughby, 2002) approximate the singular values, effectively reducing the runtime of LSA by limiting the number of dimensions. Computational cost should however not be a hidden driver for parameter selection as it biases the comparison (Hooker, 1995).
Few studies motivate, empirically or theoretically, their choice of . A notable exception is De Lucia et al (2007) where the performance of LSA is systematically evaluated. Since the document space in their experiment was small (150), it was computationally not costly to vary . The authors observed that LSA performance, measured with precision and recall, did not vary much when was set between 30%-100% of the document space, attributing this behavior to the small number of documents used in their experiments, and leading to the conclusion that should be a user-configurable parameter in their proposed tool. Poshyvanyk et al (2006) worked with a larger document space (68,190), varied however only between 0.4%-2.2% (), motivating their decision that larger values for are impractical to compute. They also observed that varying did not significantly influence LSA performance.
However, concluding from these results that an optimal value for should be between 30-500 would be wrong. De Lucia et al (2007) observed a decline in performance when was set to less than 10% of the document space. Poshyvanyk et al (2006) never reached that percentage due to the computational cost involved in SVD. Not optimizing model parameters can lead to contradicting conclusions on which IR technique performs better, as the following example illustrates. Oliveto et al (2010) compare, among other models, LSA with Latent Dirichlet Allocation (LDA). While for LSA is not reported, the number of topics in LDA is varied between 50 and 300. The authors conclude that “the LDA-based traceability recovery technique provided lower accuracy as compared to other IR-based techniques” (Oliveto et al, 2010). Asuncion et al (2010), using the same standardized data set (EasyClinic777 http://web.soccerlab.polymtl.ca/tefse09/Challenge.htm), parameterize LSA with and LDA with , and conclude that LDA performs better than LSA, i.e. the opposite of Oliveto et al (2010). These contradicting results, also observed by Grant et al (2013), illustrate the importance of parameter optimization.
4.2 Experimental Setup 2: Scaling up
While Experimental Setup 1 focused on studying the feasibility of using IR techniques for test case selection, this setup aims at evaluating the scalability of the approach. Concretely, the objectives are to study its behavior with respect to:
-
•
computational scalability of the 4 steps (corpus creation, term extraction, similarity analysis and evaluation), and
-
•
accuracy, i.e. a larger corpus means that the feature location task becomes more difficult since there are many more irrelevant than relevant documents
In this setup, we apply the piloted approach shown in Section 4.1 on a set of corpora created from the complete product. Formally, we have in Experimental Setup 2 six feature chains that include six features and six test cases . Therefore, we have 12 feature vectors and resulting in 12 system variants and . We evaluate whether . As for independent variables, we manipulate the content of . The characteristics of this setup are summarized in Figure 2 and detailed in subsections 4.2.1 - 4.2.4. We report on the lessons learned in Section 4.2.5.
4.2.1 Step 1 - Corpus creation
We selected six features, resulting in chains consisting of between 67,238 and 67,334 files, depending on the particular feature activation state. As in Experimental Setup 1, we created the different product configurations manually. However, in contrast to the limited set of files used in Experimental Setup 1, the complete product contains source code written in various programming languages, and build, configuration and documentation files. Furthermore, we had to consider more configuration mechanisms. In Experimental Setup 1, the feature activation/deactivation could be performed with filepp alone since only a subset of the product (the one configured with filepp) was considered for the corpus. However in this setup, GNU autotools mechanisms (i.e. depending on configuration, adding or removing files to the build process) and pre-processor mechanisms from the GNU compiler tool-chain needed to be considered in addition. In this setup we did not build the product (this will be explored in Experimental Setup 3 in Section 4.3), but traced the impact of feature activation/deactivation and implemented it manually in the product artifacts.
For each feature chain, we randomly selected one test-case from the pool of test cases identified by the test engineers as relevant for the particular feature. As in the pilot experiment, we created three test case variants that differed by the amount of included information.
4.2.2 Step 2 - Term extraction
With the increase in size but also the variety of the corpus, term extraction became more challenging. We decided to eliminate term stemming as the processing time for one feature chain amounted to 20 hours. This likely increased the number of terms in the term-by-document matrix. On the other hand, we added a filter that removed binary files from the corpus and added a fact extraction process, inspired by Poshyvanyk and Marcus (2007). We used srcML (Maletic et al, 2002) to extract identifier names, comments and literals from C and C++ source code, reducing the amount of irrelevant terms in the corpus. Concretely, for the kernels’ source code files, the term count could be reduced from 237,393 to 195,019 (a reduction of 18%) with fact extraction.
4.2.3 Step 3 - Similarity analysis
To implement the term-by-document matrix we used an R text-mining package (Feinerer et al, 2008), which provides efficient means to represent highly sparse matrices. This is required to be able to efficiently process a large corpus in memory. Furthermore, we improved the computational performance in two ways.
First, we optimized the calculation of similarity values by changing our initial, iterative, implementation into a vectorized form, exploiting the performance advantages of array programming (Iverson, 1980). This reduced the similarity calculation using the VSM for one chain (corpus with 60,000 files) from 20 hours to 8 hours.
Second, we changed our implementation of VSM to support parallelization, allowing us to distribute the workload among several CPUs. We chose to use the snowfall package (Knaus, 2013) for this task as it allows to choose at run-time, without changing code, whether to run in cluster or in sequential mode, which is useful for testing the implementation. With the use of a cluster consisting of 8 cores, we could reduce the computation time for one chain from 8 to approximately 1 hour.
4.2.4 Step 4 - Evaluation
We used the Dsim measure, introduced in Section 4.1.4, to evaluate the performance of VSM to differentiate between the activated and deactivated corpus using a test-case. Table 3 shows the results of the 18 experiment runs: 6 chains and 3 test-case variants each. Recall that for a true differentiation, the Dsim measure ranges between 0 and 1.
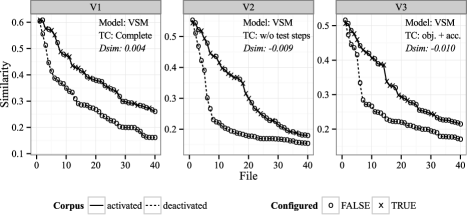
Looking at Table 3, the results from chain 1 indicate that a true differentiation is possible. This confirms the results from Experimental Setup 1, which consisted of the same feature and test-case, however with a subset of the product artifacts. On the other hand, the Dsim measure of chains 2-6 indicates that the test-cases cannot differentiate between the feature activated and deactivated corpus. Looking at chain 2, shown in Figure 5a, we observe that there is no dissimilarity between the feature activated and deactivated corpus among the first 70 files. For chains 4 and 5 the curves look similar and are therefore not shown in Figure 5. Common to these three chains is the low number of files that are affected by a feature activation (between 2 and 7) and the change is minimal (typically a parameter replacement in a configuration file). In these cases, IR techniques are unlikely to work for test case selection as the changes between variants are minimal.
The situation is different for chains 3 and 6. Even though the Dsim measures in Table 3 indicate no differentiation, Figure 5b indicates a slight, and Figure 5c a more pronounced difference between activated and deactivated corpus. This suggests that the Dsim measure discards too much information by taking only the maximum similarity values into consideration.
| Variant / Chain | 1 | 2 | 3 | 4 | 5 | 6 |
|---|---|---|---|---|---|---|
| V1 | 0.120 | -0.406 | -0.139 | -0.490 | -0.259 | 0.004 |
| V2 | 0.170 | -0.355 | -0.141 | -0.504 | -0.244 | -0.009 |
| V3 | 0.228 | -0.486 | -0.215 | -0.517 | -0.205 | -0.010 |
4.2.5 Discussion and Lessons Learned
We start this section by discussing implementation issues of Experimental Setup 2, and then elaborate on the lessons learned from the results and evaluation, addressing both RQ-1 and RQ-2.
The main concern in this setup is to scale the implementation of the experiment from a corpus with a few hundred files to one with 67000 files. After all, we are interested in studying the behavior of the IR techniques and solutions on a realistic data set that mirrors the characteristics of the target problem. The application of IR models (VSM and LSA) is thereby constrained by two factors: memory usage and computational time.
Since the term-by-document matrix is sparse, there exist efficient means to represent the matrix in memory, storing only non-zero values. However, this requires that matrix calculations support this format. Concretely, vectorized multiplication requires (by definition) that the multiplicands are stored as vectors. This is a requirement that we used in Step 3 (see Section 4.2.3) to our advantage. We created sub-matrices from the sparse term-by-document matrix that would fit in memory and distributed the cosine calculation for the VSM model among a cluster. Looking at the studies discussed in Section 4.1.5, only a few applied IR models on large corpora. Table 4 compares the average corpus in this study with the largest corpora identified in the relevant literature. None of these studies analyzes the implications of the large corpora on memory consumption and applicability of the proposed approaches in an actual solution that could be used in industry.
| Publications | IR model | # Documents | # Unique Terms |
|---|---|---|---|
| Poshyvanyk et al (2012) | LSA | 18,147 | 17,295 |
| Moreno et al (2013) | LSA/VSM | 34,375 | Not stated |
| Gay et al (2009) | VSM | 74,996 | Not stated |
| Poshyvanyk and Marcus (2007) | LSA | 86,208 | 56,863 |
| Liu et al (2007) | LSA | 89,000 | 56,861 |
| Experimental Setup 2 | VSM | 67,334 | 359,954 |
The second factor that constrains the applicability of the IR techniques is computational time. In Section 4.2.3, we have shown how the computational efficiency for the VSM model was increased by vectorization and parallelization of matrix multiplications. The LSA model requires a singular value decomposition of the term-by-document matrix. This operation is expensive with respect to execution time and difficult to parallelize for sparse matrices (Berry et al, 2006). We ran a benchmark on a corpus with 35,387 documents and 193,861 terms, measuring the runtime of the SVD operation with various dimension reductions (). We used the irlba package (Baglama and Reichel, 2014), which allows partial SVD calculations in contrast to the standard SVD implementation in R. Figure 6 shows the measured runtime in hours versus the number of dimensions. For example, the runtime with amounts to 1 hour and 43 minutes, whereas with the SVD computation requires 20 hours and 30 minutes. We fitted a simple quadratic linear regression model to the data, explaining 99% of the observed variance (see Figure 6), which we could use to extrapolate the runtime for higher values of .
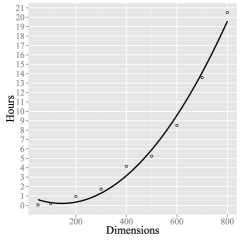
In Experimental Setup 1, we varied as a percentage of the number of documents in the corpus (80%, 40%, 20%). If we would apply the same strategy in this setup with 67,000 documents, even with only a 20% reduction (), the SVD runtime would amount to 8,287 hours, or 345 days. This illustrates why determining an optimal is rather impractical and has been done only in a limited manner in the past (see discussion in Section 4.1.5). However, experimentation represents the only way to determine the optimal for the data at hand (Deerwester et al, 1990). Possible strategies that would make such experimentation possible, in particular with source code as documents, are to:
-
•
Reduce the number of terms in the corpus with fact extraction from C source code files (Section 4.2.2). However, this approach requires the implementation of fact extractors for the (potentially many) programming languages occurring in the analyzed corpus.
-
•
Exclude irrelevant documents from the corpus: we used every text-based document in the product repository as input. However, one could reduce this set to documents that are used in the product build process, effectively selecting only relevant documents as input. We explore this strategy in Experimental Setup 3 (Section 4.3).
-
•
Use of parallel/distributed SVD implementations: we used a serial implementation which neither exploits multi-core processors nor can be run on a distributed system. Hence, one could explore solutions that parallelize the SVD computation, e.g. pbdR (Ostrouchov et al, 2012), SLEPc (Hernandez et al, 2005) or gensim (Řehůřek, 2011). Note that incremental SVD computations, as suggested by Brand (2006) and Jiang et al (2008), would be of no benefit for model selection, since we are interested to vary and typically do not update the corpus.
Due to the inefficiency of the SVD computation, we decided to exclude LSA from our further experimentation, motivated by the instability of the VSM results in this setup and the uncertainty of the overall feasibility of the approach. It would be unwise to optimize the LSA model for computational efficiency when the approach, even with the simpler VSM model, turns out to be impractical.
In Section 4.2.4, we argued that the VSM model seems to work on chains with certain characteristics, even though the Dsim measure does not reflect this. For example, the visual representation of the results of chain 6 in Figure 5c indicates that there is a difference between the activated and deactivated corpus, even though Dsim (0,004, -0.009, -0.010) does not express this. Dsim discards too much information, i.e. it does not accurately represent the actual difference between a feature activated and deactivated corpus. Our first intuition on how to use IR techniques for test case selection (see discussion on solution development in Section 2.3) would require to empirically identify a threshold value for selecting/discarding a particular test case. Now however, after sampling more feature chains with a realistically sized document corpus, it seems unlikely that we can determine a useful threshold value. Dsim clearly indicates that the difference between a feature activated and deactivated corpus cannot be measured by maximum similarity. Hence, a similarity threshold would not work either.
We therefore decided to reshape the original solution description (Section 2.3), allowing us to define an alternative evaluation metric to Dsim. Instead of using a test case as query and ranking product artifacts, we calculate an aggregated similarity of each test case to a product variant. This means that each test case is ranked with respect to a particular product variant. We can use this rank, in combination with the test case relevance information provided by a feature chain, to evaluate 1) the relative performance of IR techniques and 2) the test case selection performance. This reformulation of the problem leads to a simplified experimental setup, as illustrated in Figure 7. The main differences to the previous two setups (Figure 3) are in Step 1 where we create only one feature activated corpus per chain and in Step 4 where all existing system test cases are ranked according to their similarity to the feature activated corpus.
4.3 Experimental Setup 3: Ranking
In the previous setups we studied the feasibility and scalability of the approach, leading to refinements in individual steps, to the removal of the LSA model due to its computational cost from the experiment, and to a re-formulation of the problem in order to enable the evaluation. The objectives of this setup are therefore to:
-
•
adapt the experimental setup to the problem reformulation
-
•
choose the correct statistical technique to evaluate and determine the factors that influence the IR technique performance
In this setup, we modified the configuration of the experiment in Steps 1 and 4 (see Figure 7 and 2). In Step 4, we calculate the similarity of each test case (1600) to a product variant and then use this similarity score to rank the test-cases. Since we know which test cases are relevant for a product variant, we can then evaluate the IR techniques based on the respective test case rankings.
Formally, we have in Experimental Setup 3 ten feature chains that include ten features . We have ten feature vectors resulting in ten system variants . To each feature, one or more test cases are mapped: in total, 65 test cases are mapped to ten features. We rank all 1600 test cases, which include the 65 mapped test cases, according to . As for independent variables, we manipulate the content of test cases and use two different summary statistics when calculating .
The consequence of this problem reformulation, compared to Experimental Setup 1 and 2, is an increase in computational cost: the similarity of each test case variant (4,800) to the product variant needs to be calculated (as opposed to the 3 test case variants in Experimental Setup 2). To make the ranking evaluation feasible, we employed two strategies to reduce the size of the document corpus and created two types of corpora:
-
1.
A minimal corpus that contains only the artifacts that are affected by a feature activation, reducing thereby noise stemming from artifacts that are common to all product variants. This allows us to pilot the new setup with a relatively short run-time.
-
2.
An automatic corpus that represents the configured product as accurately as possible, reducing thereby the number of artifacts to what is actually composing a deployed product.
We call the first corpus “minimal” for two reasons: a) features are implemented in a small subset of the total files, hence the corpus is small compared to the second, “automatic” corpus; b) the difficulty level is minimized by removing noise caused by not relevant files. We call the second corpus “automatic” since we employ techniques to create this corpus without manual intervention, in contrast to the previous experimental setups.
4.3.1 Step 1 - Corpus creation
For the creation of the minimal corpus, we followed the same procedure as in Experimental Setup 2, i.e. manually tracing the impact of a feature activation to product artifacts. However, in this setup, we only included artifacts that were affected by a feature activation, thereby creating a minimal corpus.
| Chain | Minimal corpus | Automatic corpus | Manual corpus (setup 2) |
|---|---|---|---|
| 1 | 10/1,668 | 11,078/68,619 | 67,332/347,854 |
| 2 | 3/260 | 11,078/68,613 | 67,331/341,098 |
| 3 | 56/3,471 | 11,078/68,614 | 67,332/347,853 |
| 4 | 2/150 | 11,078/68,613 | 67,334/359,954 |
| 5 | 2/29 | 11,078/68,613 | 67,331/341,097 |
| 6 | 29/1,638 | 11,078/68,611 | 67,332/347,857 |
| 7 | 61/2,170 | 11,078/68,608 | N/A |
| 8 | 2/242 | 11,078/68,611 | N/A |
| 9 | 3/630 | 11,078/68,613 | N/A |
| 10 | 3/66 | 11,078/68,612 | N/A |
The idea for creating an automatic corpus stems from the disadvantages of manual corpus creation, being inefficient (it must be repeated for every chain), error-prone, and most importantly, incomplete. With a manual configuration, only the traced option is considered and all other options are not implemented in the product artifacts. This means that the artifacts in a manually generated corpus do not correspond to the artifacts that compose a product that would be eventually installed and tested on a camera, leading to a larger, less accurate corpus.
For example, Listing 1 shows an excerpt from a Makefile where
a configuration option (line 2) determines whether 2 files (line 3) should be
built or not. If CONFIG_A is the traced option, a manual
configuration would delete the source files corresponding to line 2. However,
independently of whether CONFIG_B in line 6 is activated, the
corresponding files in line 7 would be included in a manually generated corpus.
The same principle holds for preprocessor directives that realize configuration
options. In Listing 2, assume CONFIG_C
to be the traced option (line 8). With a manually generated corpus, the
configuration option in line 2 would not be evaluated, therefore including the
file (line 3) into the corpus, independently whether the product is actually run
on an ARM processor. This increases the size of the corpus, adds noise and does
not reflect the product for which the system test cases where developed.
We addressed this issue by exploiting the product build system. The basic idea of our approach is to hook into the build process custom code that performs pre-processing operations on the files included in the product. As a result, we get the configured (preprocessed) source code and the compiled product as it is installed on the camera, including configuration files and documentation. In this way, we could create a corpus that corresponds to the tested product merely by configuring and building the product.
Table 5 illustrates the size characteristics of the minimal and automatic corpus from this setup and the manual corpus from Experimental Setup 2. We reduced the average size for the automatic corpus by a factor 6 compared to the manual corpus. The minimal corpus is significantly smaller, which allowed us to pilot the ranking approach.
The second major difference to Experimental Setup 2 was to use all system test cases (1,600) and rank them instead of analyzing similarity between a product and the applicable test case(s). As test cases were stored in a database, we could easily automatize the construction of the 4,800 test case variants.
4.3.2 Step 2 - Term extraction
We applied the same process as in Experimental Setup 2.
4.3.3 Step 3 - Similarity analysis
In Experimental Setup 2, a similarity analysis for one product configuration and one test case variant required approximately one hour of computational time. With 4,800 test case variants, this would amount to a computation time of 200 days per chain. However, with the reduced corpus sizes we could compute a chain within 2 (minimal corpus) respectively 17 (automatic corpus) hours, making the ranking approach feasible.
4.3.4 Step 4 - Evaluation
The evaluation procedure differs considerably from Experimental Setup 2 where we looked at the difference of a feature activated and deactivated corpus. In this setup, we have only a feature activated corpus and rank the test cases according to their similarity to that corpus. To create such a test case ranking, we compute a single similarity value using a summary statistic of the corpus’ documents similarity to each test case. As summary statistics we chose maximum and mean similarity.
The independent variables in this setup are the test-case variants and the summary statistics. For the test case variants we have three levels (see Table 2) while the summary statistics consist of two levels (maximum and mean). Since we have two independent variables and use the same data for all factors, we have a two-way repeated measures design. The dependent variable is the ranking position of a test-case, i.e. the lower the ranking position the better. In total, we have 65 ground truth instances, i.e. relevant test cases that are ranked between position 1 and 1600.
The evaluation goal in this setup is twofold: (1) we compare the effect of the independent variables on the ranking performance; (2) we study the ranking performance to understand whether it can support test case selection decisions.
(1) Comparison of ranking performance
We formulate the following null hypotheses:
- :
-
The test case content does not significantly affect the ranking performance of the VSM.
- :
-
The summary statistic does not significantly affect the ranking performance of the VSM.
Furthermore, we evaluate whether the size of the corpus impacts the ranking performance and formulate the third null hypothesis as follows:
- :
-
The corpus type does not significantly affect the ranking performance of the VSM.
| Effect | p-value minimal corpus | p-value automatic corpus |
|---|---|---|
| 1. Test case content | 0.32022 | 0.11216 |
| 2. Summary statistic | 0.07580 | 0.98244 |
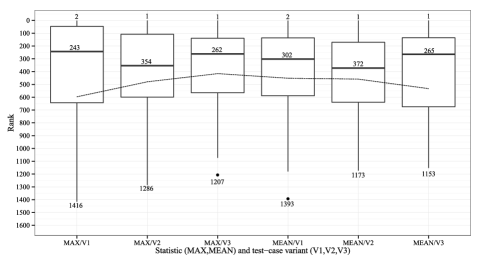
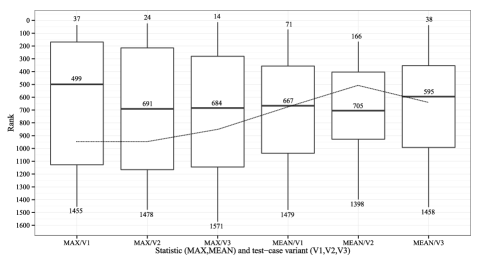
Figure 8 illustrates the ranking results in the form of box plots. The y-axis shows the ranking position (the numbers indicate minimum, median and maximum position) of the 65 test cases whereas the different box plots represent the two factors with two and three levels. Even though in both corpus types a large variance can be observed, the spread is more pronounced in the automatic corpus. This is an expected result as the minimal corpus contains less noise than the automatic corpus. Looking at the minimal corpus in Figure 8a, one can observe that, for the maximum statistic, the more specific the information in the test case the smaller is the variation (inter-quartile range, dashed line) in ranking results. This behavior is reversed for the mean statistic where the inter-quartile range increases with the specificity of the test case content. Looking at the automatic corpus in Figure 8b, the impact of statistic and test case content on inter-quartile range is not analogous to the one observed in the minimal corpus. This is an indication that the characteristics of the corpus (minimal vs. automatic) affect IR technique performance, not only by overall absolute values, but also in terms of the impact of the summary statistic and the test-case input on the ranking.
In order to test the stated hypotheses we used randomization tests (Ludbrook and Dudley, 1998; Edgington and Onghena, 2007) provided by the ez package (Lawrence, 2013) for R. Table 6 lists the results of testing and , which we consequently fail to reject at : neither test case content nor summary statistic significantly affect the test case ranking performance, both on the minimal and automatic corpus. However, we reject with a p-value 0.001 (randomization test, 100,000 iterations).
(2) Test case selection decision support
Table 4.3.4 shows a subset of the results (for each chain only the test case with the highest rank is shown) in this experimental setup, both for the minimal and the automatic corpus. The first column indicates the chain and the number of test cases identified by the test engineers as being relevant for that feature. The remaining columns refer to the rank (out of 1,600) with the given test case variant and used summary statistic. For example, in the minimal corpus in Table 4.3.4, the only test case in Chain 1 was ranked on position 81, using the complete test case and the mean as summary statistic. A lower rank indicates a better result since a relevant test case would appear higher in the ranked list of test cases.
Table 4.3.4 shows also the mean average precision (MAP) (Liu, 2011) of the test case rankings. MAP allows us to interpret how useful the ranking is for the task at hand. MAP is calculated by taking the mean of the average precision (AP) over a set of queries. AP is calculated by averaging the precision at each relevant test case. For example, representing correct results as 1 and 0 otherwise, the AP for the query result is . The MAP is then calculated by averaging the AP of a series of query results. A MAP of means that only every tenth ranked item is relevant, whereas with a MAP of , every second item is relevant.
Test case ranking positions and Mean Average Precision Chain1 MAX/V1 MAX/V2 MAX/V3 MEAN/V1 MEAN/V2 MEAN/V3 Minimal corpus - test case ranking position 1 (1) 57 142 311 81 327 136 2 (2) 1,416 1,286 955 1,393 1,166 992 3 (5) 111 85 171 41 16 136 4 (1) 2 1 4 2 1 4 5 (1) 656 481 319 656 481 319 6 (1) 37 107 105 4 28 125 7 (34) 4 11 20 92 114 58 8 (10) 891 766 660 912 795 670 9 (7) 221 357 171 168 232 181 10 (3) 29 9 17 20 5 11 MAP 0.1140 0.1913 0.0879 0.1287 0.2032 0.0949 Automatic corpus - test case ranking position 1 (1) 461 524 165 497 630 1,365 2 (2) 174 203 226 301 346 509 3 (5) 67 185 14 229 194 631 4 (1) 46 42 117 820 736 376 5 (1) 888 805 1,112 1,074 793 821 6 (1) 290 359 537 357 182 635 7 (34) 892 1,120 1,229 71 225 38 8 (10) 77 45 123 236 392 200 9 (7) 37 66 109 477 450 347 10 (3) 117 138 172 876 656 354 MAP 0.0116 0.0122 0.0086 0.0058 0.0057 0.0062
-
1
The number in parentheses indicates the total number of test cases that were mapped to that particular chain.
In order to better understand the quality of the achieved rankings, we involved test engineers in the evaluation. Unfortunately, no test history was available for the studied product and feature chains, not allowing us to compare the achieved ranking with the selection from test engineers. However, by querying test engineers we could establish whether test cases associated with a particular feature are relevant or not. For example, in Chain 1, with the maximum summary statistic and test case variant 1, the known to be relevant test case was ranked on position 57 (see Table 4.3.4, minimal corpus). This means that 56 test cases were ranked above the relevant one. Our question to the test engineers was whether these higher ranked test cases were indeed relevant for the particular feature. We chose those chains for evaluation where the relevant test case was ranked below position 100. These six chains are indicated in bold typeface in Table 4.3.4. Then, for each relevant test case (65), we selected those test cases which were ranked higher, or, in case the relevant test case was ranked at position 20 or lower, all top 20 test cases. This resulted in a set of 295 test cases, for each of which we identified the corresponding test area maintainers (eight in total). Table 7 shows the true and false positive rates for each chain. According to the MAP in Table 4.3.4, the IR technique with the mean summary statistic and variant 2 of the test case performed best. Hence, we chose that test case ranking to calculate the average precision, shown in Table 7.
| Result / Chain | 1 | 3 | 4 | 6 | 7 | 10 | Aggregate |
|---|---|---|---|---|---|---|---|
| Total test cases | 48 | 29 | 25 | 19 | 141 | 33 | 295 |
| True positives | 9 | 12 | 7 | 4 | 48 | 21 | 101 |
| False positives | 39 | 17 | 18 | 15 | 93 | 12 | 194 |
| Average Precision | 0.21 | 0.61 | 0.42 | 0.24 | 0.10 | 0.70 | 0.38 |
4.3.5 Discussion and Lessons Learned
We start this section with a discussion of the results from Experimental Setup 3, addressing RQ-2 and RQ-3, and then elaborate on the lessons learned from this evaluation, addressing RQ-1.
The first goal of this experimental setup was to study whether the test case content or summary statistic has an effect on the ranking performance of the VSM. The results (Table 6) suggest that there is no statistically significant evidence for such an effect, even though there is a strong significant evidence that the ranking performance on minimal and automatic corpus differ (see the rejected ). Looking at the results summarized in Table 6, one can observe in the minimal corpus a tendency that the summary statistic affects the ranking performance. In the automatic corpus this tendency disappears. Even though this result is not statistically significant, it illustrates an important point: the characteristics of the data set on which the IR techniques are evaluated matter, even to the extent where the impact of a factor is reversed. Neglecting this can lead to sub-optimal IR technique configurations, e.g. when they are evaluated on a data set with characteristics that differ from the one where the technique is eventually applied for productive use. The experiments conducted by Falessi et al (2013) illustrate the effect of data set difficulty on the performance of different IR techniques, confirming our observation that under different corpus characteristics (minimal vs. automatic), IR techniques behave differently.
The second goal of this experimental setup was to study to what extent the ranking provides test case selection decision support. Looking at Table 4.3.4, the minimal corpus, we can observe that for Chains 1, 3, 4, 6, 7 and 10 ranking positions below 100 were achieved. According to the MAP measure, the combination of V2 (test case except test steps) and the mean summary statistic would provide the best performance (i.e. every 5th test case is relevant). However, looking at the automatic corpus, the combination of V2 and the maximum summary statistic would provide the best performance. Furthermore, the MAP measure in the automatic corpus is by a factor 10 lower than in the minimal corpus, supporting the above conclusion that data set difficulty affects IR technique performance. We also evaluated how useful the best achieved rankings would be for test case selection. Table 7 illustrates the achieved average precision with the selected best IR technique configuration. The results suggest that for some feature chains the approach works very well, e.g. for Chain 3 and 10 with a MAP , which means that every second test case inspected by the test engineer was relevant. On the other hand, in Chain 7 only every 10th test case was assessed as relevant. Furthermore, we note that Table 7 shows only the six out of ten feature chains for which we could achieve a ranking of one or more known to be relevant test cases. While these result seem underwhelming, they are comparable w.r.t. the achieved MAP of 0.38 to similar studies aiming at automatic traceability recovery. Abadi et al (2008) traced code to documentation and experimented with 17 IR technique configurations, achieving a MAP between 0.04 and 0.66. Cleary et al (2009) compared 6 concept location techniques, achieving a MAP between 0.006 and 0.06 (they attribute the low values to the large data set). Qusef et al (2014) combine IR techniques with dynamic slicing to identify the classes tested by a test suite, achieving a MAP between 0.83 and 0.93. More recently, Xia et al (2015) associated bug reports with developers, achieving a MAP of 0.51.
We turn now to the lessons learned from the statistical analysis. When we perform experiments comparing different IR techniques, we exercise them on the same set of tasks and determine the techniques’ relative performance by testing whether their location parameter (e.g. mean or median) of some performance measure differs significantly (Smucker et al, 2007). This general IR technique evaluation framework guides the selection and configuration of permissible statistical analyses, leading to the following considerations:
-
1.
Test assumptions: The characteristics of the population distribution from which the dependent variables are sampled determine whether the assumptions (normality, independent samples, homogeneity of variance) of parametric tests are violated. An assumption that is likely to be violated is normality, caused by a skew to the right of the dependent variable. This is due to the inherent properties of some IR performance measures, e.g. a ranking cannot be negative.
-
2.
Repeated measures: When comparing IR techniques we apply them on the same corpus, looking at the effect of different treatments (IR techniques) on the same subject (corpus). In other words, we have a paired (two IR techniques) or repeated (more than two IR techniques) measures design.
-
3.
Multiple testing: When many different configurations of IR techniques are compared, we encounter the multiple testing problem (Bender and Lange, 2001): the more statistical tests are performed, the higher the likelihood that a true null hypothesis is rejected (false positive or Type I error).
Individually, the above considerations can be addressed by choosing statistical procedures fulfilling the given requirements. For example, if the assumptions of the parametric tests are violated, one can use non-parametric or distribution-free alternatives (Sheskin, 2000). For a repeated measures design, paired difference tests or repeated measures ANOVA are viable choices (Sheskin, 2000). The multiple testing problem can be addressed by applying adjustments to p-values or, depending on the particular study design, choosing test procedures that compensate for multiple comparisons (Bender and Lange, 2001).
In the context of evaluating IR techniques, we need to address all of the above stated considerations simultaneously and select a statistical procedure whose assumptions are not violated, allows for a repeated measures design and provides means to compensate for multiple testing. It turns out that these combined requirements are difficult to fulfill. If we assume that the normality assumption is violated, requiring a non-parametric test, and that we have a repeated measures design, we can only evaluate designs with at most one factor using Friedman’s two-way analysis of variance by ranks (Sheskin, 2000). This means that factorial designs to compare IR techniques can not be effectively evaluated with traditional statistical means, without allowing for violations of the test procedure and accepting a potential loss of statistical power.
For example, Biggers et al (2014) ignore potential normality violations (the dependent variable is a rank based on a similarity measure) and use regular ANOVA with five factors888Unfortunately it is not possible to determine whether this potential assumption violation had an impact on the outcome of the analysis since the raw data for this particular part (Part 1) of the case study has not been published by the authors.. Subsequent analyses of interactions and main effects are performed with Kruskal-Wallis analysis of variance by ranks (Sheskin, 2000) (a non-parametric test) which indicates that the authors were aware of the potential violations of the parametric test assumptions. Further examples from recent journal publications illustrate the inherent difficulty to correctly evaluate IR techniques:
-
•
Poshyvanyk et al (2012) use Wilcoxon matched-pairs signed-ranks test (Sheskin, 2000), acknowledging a potential violation of normality of their performance measure and taking advantage of the stronger statistical power of the paired test; however they do not compensate for multiple testing when evaluating the effect of stemming on the performance measure (48 tests).
-
•
Thomas et al (2013) use Tukey’s HSD test which is commonly recommended when all pair-wise comparisons in a data set need to be evaluated (Sheskin, 2000). This test compensates for multiple tests, assumes however normality and homogeneity of variance. Even though the authors tested for the latter, normality is silently assumed.
-
•
Falessi et al (2013) provide guidelines on the statistical evaluation of IR techniques, motivating the use of inferential statistics (Sheskin, 2000) by the need to “check whether the observed difference could reasonable occur just by chance due to the random sample used for developing the model” (Falessi et al, 2013). However, in the case-study presented in the same paper (Falessi et al, 2013) they refrain from using inferential statistical tests and rely on descriptive statistics to determine the best IR technique, not following their own best practice principles999They use inferential statistics to compare the best IR technique with the optimal combination of IR techniques, but this comparison is questionable since the preceding selection of best technique is based on descriptive statistics..
We chose to follow the advise by Smucker et al (2007) and used the randomization test (Ludbrook and Dudley, 1998; Edgington and Onghena, 2007; Mittas and Angelis, 2008) to perform our IR technique comparison. The major advantage of randomization tests is that they do not assume any particular theoretical population distribution from which the sample is drawn but rather construct a sample distribution by permutations of the observed data (Sheskin, 2000). This means that the skewness of our dependent variable (rank) is of no concern. A disadvantage of randomization tests is their computational cost: we performed the procedure with 100.000 permutations on 65 observations on two factors (2x3 levels) in 11 hours. This is a considerable cost compared to generally instantaneous results of traditional statistical tests.
Randomization tests are also applicable to repeated measure designs (Sheskin, 2000). However, procedures to address the multiple testing problem in the context of repeated measure designs are difficult to implement, since comparisons occur between-subject factors, within-subject factors, or both (Bender and Lange, 2001). Hence, to the best of our knowledge, multiple testing is still an open issue, in the context of IR technique comparisons with more than two factors and under the constraints of a repeated measures design and potentially violated normality assumptions.
5 Conclusions and future work
This paper illustrated the experiences and lessons learned from developing and evaluating an approach for test case selection decision support based on Information Retrieval (IR) techniques. We rooted the solution development in the context of a large-scale industry experiment which allowed us to evaluate IR techniques in a realistic environment. The solution development was guided by incremental refinements of the experimental setup, both testing the scalability and performance of IR techniques. In order to provide insight for researchers, we reported on the design decisions, both in terms of experimental setup and IR technique implementation. We conclude by providing answers to the initially stated research questions.
RQ-1 To what extent can state-of-the-art IR techniques be applied in a large-scale industrial context?
We identified a set of open questions that need to be addressed in order to bridge the gap between laboratory IR experiments and applications of IR in industry:
-
•
Comparative studies on IR techniques seldom optimize the parameters of all underlying IR models, leading to potentially unfair evaluations. This can even go as far as to reporting contradictory results, as we have shown in Section 4.1.5, and has been also observed by Grant et al (2013). This poses a threat to both researchers and practitioners who might adopt IR techniques based on flawed evaluations. Future work is required on evaluating IR techniques both on standardized data sets but also on large-scale, industry-grade data.
-
•
Parameter optimization is computationally expensive, particularly when applied on industry-grade, large data sets. Possible avenues for enabling parameter optimization efforts are: (1) investigating means to reduce the number of terms in a corpus, without affecting the IR models performance. Such techniques would however be very application and data specific, e.g. as the fact extraction and corpus-size reduction techniques illustrated in Sections 4.2.1 and 4.3.1 respectively; (2) using parallel/distributed implementations of the algorithms, e.g. Singular Value Decomposition, that power IR techniques. A third alternative would be to compare optimized parametric with non-parametric IR models, such as Hierarchical Dirichlet Processes (Teh et al, 2006). If non-parametric models would show to be consistently equivalent or better than parametric models, they would be the favorable solution in an industrial environment since they would require less customization effort.
-
•
Determining the superiority of one IR technique over another should be based upon inferential statistical techniques (Falessi et al, 2013). However, as we have elaborated in Section 4.3.5, developing and evaluating a valid statistical technique that allows simultaneously for non-normal dependent variables, a repeated measures design and multiple comparisons, in the context of IR evaluation, is still an open issue.
RQ-2 To what extent do the used software development artifacts influence the performance of IR techniques?
We have experimented with different variants of both test case content, i.e. information within the test case description, and product artifacts, in particular the size of the document corpus. We could not determine a statistical significant performance difference between test case variants. However, we observed that the size of the corpus influences the performance considerably (observed in Experimental Setup 2, and shown with statistical significance in Experimental Setup 3). This confirms the observations by Falessi et al (2013) who evaluated IR techniques at varying difficulty levels. As a consequence, this means that IR techniques need to be evaluated on realistic, large dataset that mirror the difficulty of datasets encountered in real industry applications.
RQ-3 To what extent can the studied IR techniques support test case selection?
We have evaluated the test selection performance on ten feature chains. In four chains, the feature “signal” in the product artifacts was too weak to induce an actionable ranking. In the other six feature chains, we tasked test engineers to rate the test case ranking with respect to their relevance for the corresponding feature. The results in terms of precision (MAP ) are comparable to what has been achieved in similar studies that aimed at automating trace recovery (e.g. Abadi et al (2008); Cleary et al (2009); Qusef et al (2014); Xia et al (2015)) However, while our results reflect the state of art, the approach based on IR techniques is not yet reliable enough to automate the test case selection process in a realistic industry setting.
In future work, we plan to study the properties of the features chains where the differentiation between a feature activated and deactivated corpus failed. Knowing these properties and being able to detect them in the corpus would allow us to provide suggestions on how to improve source code documentation, e.g. by better naming conventions using a company-wide glossary. Furthermore, by including meta-data from the version control system in the corpus, such as commit comments connected to feature activation/deactivation code, we could improve the test case rankings.
References
- Abadi et al (2008) Abadi A, Nisenson M, Simionovici Y (2008) A Traceability Technique for Specifications. In: Proceedings 16th International Conference on Program Comprehension (ICPC), IEEE, Amsterdam, The Netherlands, pp 103–112
- Antoniol et al (1999) Antoniol G, Canfora G, De Lucia A, Merlo E (1999) Recovering code to documentation links in OO systems. In: Proceedings 6th Working Conference on Reverse Engineering (WCRE), IEEE, Atlanta, USA, pp 136–144
- Antoniol et al (2000) Antoniol G, Canfora G, Casazza G, De Lucia A (2000) Information retrieval models for recovering traceability links between code and documentation. In: Proceedings International Conference on Software Maintenance (ICSM), IEEE, San Jose, USA, pp 40–49
- Antoniol et al (2002) Antoniol G, Canfora G, Casazza G, De Lucia A, Merlo E (2002) Recovering traceability links between code and documentation. IEEE Transactions on Software Engineering 28(10):970 – 983
- Arcuri and Fraser (2011) Arcuri A, Fraser G (2011) On Parameter Tuning in Search Based Software Engineering. In: Proceedings 3rd International Conference on Search Based Software Engineering (SSBSE), Springer, Szeged, Hungary, pp 33–47
- Asuncion et al (2010) Asuncion H, Asuncion A, Taylor R (2010) Software traceability with topic modeling. In: Proceedings 32nd International Conference on Software Engineering (ICSE), IEEE, Cape Town, South Africa, pp 95–104
- Babar et al (2010) Babar MA, Lianping Chen, Shull F (2010) Managing Variability in Software Product Lines. IEEE Software 27(3):89–91, 94
- Baglama and Reichel (2014) Baglama J, Reichel L (2014) irlba: Fast partial SVD by implicitly-restarted Lanczos bidiagonalization. URL http://cran.r-project.org/web/packages/irlba/index.html
- Basili and Caldiera (1995) Basili V, Caldiera G (1995) Improve software quality by reusing knowledge and experience. Sloan Management Review 37(1):55–64
- Bender and Lange (2001) Bender R, Lange S (2001) Adjusting for multiple testing - when and how? Journal of Clinical Epidemiology 54(4):343–349
- Berry (2014) Berry MW (2014) SVDPACKC. URL http://www.netlib.org/svdpack/
- Berry et al (2006) Berry MW, Mehzer D, Philippe B, Sameh A (2006) Parallel Algorithms for the Singular Value Decomposition. In: Handbook of Parallel Computing and Statistics, 1st edn, CRC Press
- Biggers et al (2014) Biggers LR, Bocovich C, Capshaw R, Eddy BP, Etzkorn LH, Kraft NA (2014) Configuring latent Dirichlet allocation based feature location. Empirical Software Engineering 19(3):465–500
- Biggerstaff et al (1993) Biggerstaff TJ, Mitbander BG, Webster D (1993) The Concept Assignment Problem in Program Understanding. In: Proceedings 15th International Conference on Software Engineering (ICSE), IEEE, Baltimore, USA, pp 482–498
- Blei et al (2003) Blei DM, Ng AY, Jordan MI (2003) Latent Dirichlet Allocation. Journal of Machine Learning Research 3:993–1022
- Borg et al (2013) Borg M, Runeson P, Ardö A (2013) Recovering from a decade: a systematic mapping of information retrieval approaches to software traceability. Empirical Software Engineering pp 1–52, in Print
- Brand (2006) Brand M (2006) Fast low-rank modifications of the thin singular value decomposition. Linear Algebra and its Applications 415(1):20–30
- Broy (2006) Broy M (2006) Challenges in Automotive Software Engineering. In: Proceedings 28th International Conference on Software Engineering (ICSE), ACM, Shanghai, China, pp 33–42
- Calcote (2010) Calcote J (2010) Autotools: A Practitioner’s Guide to GNU Autoconf, Automake, and Libtool. No Starch Press
- Chen and Babar (2011) Chen L, Babar MA (2011) A systematic review of evaluation of variability management approaches in software product lines. Information and Software Technology 53(4):344–362
- Cleary et al (2009) Cleary B, Exton C, Buckley J, English M (2009) An empirical analysis of information retrieval based concept location techniques in software comprehension. Empirical Software Engineering 14(1):93–130
- Cleland-Huang et al (2011) Cleland-Huang J, Czauderna A, Dekhtyar A, Gotel O, Hayes JH, Keenan E, Leach G, Maletic J, Poshyvanyk D, Shin Y, Zisman A, Antoniol G, Berenbach B, Egyed A, Maeder P (2011) Grand Challenges, Benchmarks, and TraceLab: Developing Infrastructure for the Software Traceability Research Community. In: Proceedings 6th International Workshop on Traceability in Emerging Forms of Software Engineering (TEFSE), ACM, Honolulu, USA, pp 17–23
- Clements and Northrop (2001) Clements P, Northrop L (2001) Software Product Lines: Practices and Patterns, 3rd edn. Addison-Wesley Professional, Boston
- Corazza et al (2012) Corazza A, Di Martino S, Maggio V (2012) LINSEN: An efficient approach to split identifiers and expand abbreviations. In: Proceedings 28th International Conference on Software Maintenance (ICSM), IEEE, Trento, Italy, pp 233–242
- Crawley (2007) Crawley MJ (2007) The R Book, 1st edn. John Wiley & Sons
- Cullum and Willoughby (2002) Cullum JK, Willoughby RA (2002) Lanczos Algorithms for Large Symmetric Eigenvalue Computations: Vol. 1: Theory, 2nd edn. SIAM
- De Lucia et al (2006) De Lucia A, Fasano F, Oliveto R, Tortora G (2006) Can Information Retrieval Techniques Effectively Support Traceability Link Recovery? In: Proceedings 14th International Conference on Program Comprehension (ICPC), IEEE, Athens, Greece, pp 307–316
- De Lucia et al (2007) De Lucia A, Fasano F, Oliveto R, Tortora G (2007) Recovering traceability links in software artifact management systems using information retrieval methods. ACM Transactions Software Engineering Methodology 16(4)
- De Lucia et al (2009) De Lucia A, Oliveto R, Tortora G (2009) Assessing IR-based traceability recovery tools through controlled experiments. Empirical Software Engineering 14(1):57–92
- De Lucia et al (2011) De Lucia A, Di Penta M, Oliveto R, Panichella A, Panichella S (2011) Improving IR-based Traceability Recovery Using Smoothing Filters. In: Proceedings 19th International Conference on Program Comprehension (ICPC), IEEE, Kingston, Canada, pp 21–30
- Deerwester et al (1990) Deerwester S, Dumais ST, Furnas GW, Landauer TK, Harshman R (1990) Indexing by Latent Semantic Analysis. Journal of the American Society for Information Science 41(6):391–407
- Dit et al (2011a) Dit B, Guerrouj L, Poshyvanyk D, Antoniol G (2011a) Can Better Identifier Splitting Techniques Help Feature Location? In: Proceedings 19th International Conference on Program Comprehension (ICPC), IEEE, Kingston, Canada, pp 11–20
- Dit et al (2011b) Dit B, Revelle M, Gethers M, Poshyvanyk D (2011b) Feature location in source code: a taxonomy and survey. Journal of Software Maintenance and Evolution: Research and Practice 25(1):53–95
- Dit et al (2013) Dit B, Panichella A, Moritz E, Oliveto R, Di Penta M, Poshyvanyk D, De Lucia A (2013) Configuring topic models for software engineering tasks in TraceLab. In: Proceedings 7th International Workshop on Traceability in Emerging Forms of Software Engineering (TEFSE), IEEE, San Francisco, USA, pp 105–109
- Dit et al (2014) Dit B, Moritz E, Linares-Vásquez M, Poshyvanyk D, Cleland-Huang J (2014) Supporting and accelerating reproducible empirical research in software evolution and maintenance using TraceLab Component Library. Empirical Software Engineering pp 1–39
- Dumais (1992) Dumais ST (1992) LSI meets TREC: a status report. In: NIST special publication, National Institute of Standards and Technology, pp 137–152
- Dyba et al (2005) Dyba T, Kitchenham B, Jorgensen M (2005) Evidence-based software engineering for practitioners. IEEE Software 22(1):58–65
- Ebert and Jones (2009) Ebert C, Jones C (2009) Embedded Software: Facts, Figures, and Future. Computer 42(4):42–52
- Edgington and Onghena (2007) Edgington E, Onghena P (2007) Randomization Tests, 4th edn. Chapman and Hall/CRC, Boca Raton, FL
- Engström and Runeson (2011) Engström E, Runeson P (2011) Software product line testing - A systematic mapping study. Information and Software Technology 53(1):2–13
- Engström et al (2010) Engström E, Runeson P, Skoglund M (2010) A systematic review on regression test selection techniques. Information and Software Technology 52(1):14–30
- Enslen et al (2009) Enslen E, Hill E, Pollock L, Vijay-Shanker K (2009) Mining source code to automatically split identifiers for software analysis. In: Proceedings 6th International Working Conference on Mining Software Repositories (MSR), IEEE, Vancouver, Canada, pp 71–80
- Falessi et al (2013) Falessi D, Cantone G, Canfora G (2013) Empirical Principles and an Industrial Case Study in Retrieving Equivalent Requirements via Natural Language Processing Techniques. Transactions on Software Engineering 39(1):18–44
- Feinerer et al (2008) Feinerer I, Hornik K, Meyer D (2008) Text Mining Infrastructure in R. Journal of Statistical Software 25(5):1–54
- Feldman (1979) Feldman SI (1979) Make - a program for maintaining computer programs. Software: Practice and Experience 9(4):255–265
- Gay et al (2009) Gay G, Haiduc S, Marcus A, Menzies T (2009) On the use of relevance feedback in IR-based concept location. In: Proceedings 28th International Conference on Software Maintenance (ICSM), IEEE, Edmonton, Canada, pp 351–360
- Gethers et al (2011) Gethers M, Oliveto R, Poshyvanyk D, De Lucia A (2011) On integrating orthogonal information retrieval methods to improve traceability recovery. In: Proceedings 27th International Conference on Software Maintenance (ICSM), IEEE, Williamsburg, USA, pp 133–142
- Goldberg (1989) Goldberg DE (1989) Genetic algorithms in search, optimization, and machine learning, 1st edn. Addison Wesley, Boston, USA
- Gorschek et al (2006) Gorschek T, Wohlin C, Carre P, Larsson S (2006) A Model for Technology Transfer in Practice. IEEE Software 23(6):88–95
- Gotel and Finkelstein (1994) Gotel O, Finkelstein CW (1994) An analysis of the requirements traceability problem. In: Proceedings 1st International Conference on Requirements Engineering (RE), IEEE, Colorado Springs, USA, pp 94–101
- Graaf et al (2003) Graaf B, Lormans M, Toetenel H (2003) Embedded software engineering: the state of the practice. IEEE Software 20(6):61–69
- Grant et al (2013) Grant S, Cordy JR, Skillicorn DB (2013) Using heuristics to estimate an appropriate number of latent topics in source code analysis. Science of Computer Programming 78(9):1663–1678
- Grossman and Frieder (2004) Grossman D, Frieder O (2004) Information Retrieval - Algorithms and Heuristics, The Information Retrieval Series, vol 15, 2nd edn. Springer, New York, USA
- Guerrouj et al (2011) Guerrouj L, Di Penta M, Antoniol G, Guéhéneuc YG (2011) TIDIER: an identifier splitting approach using speech recognition techniques. Journal of Software Maintenance and Evolution: Research and Practice 25(6):575–599
- Hernandez et al (2005) Hernandez V, Roman JE, Vidal V (2005) SLEPc: A Scalable and Flexible Toolkit for the Solution of Eigenvalue Problems. ACM Transactions on Mathematical Software 31(3):351–362
- Hill et al (2008) Hill E, Fry ZP, Boyd H, Sridhara G, Novikova Y, Pollock L, Vijay-Shanker K (2008) AMAP: automatically mining abbreviation expansions in programs to enhance software maintenance tools. In: Proceedings 5th International Working Conference on Mining Software Repositories (MSR), ACM, Leipzig, Germany, pp 79–88
- Hooker (1995) Hooker JN (1995) Testing heuristics: We have it all wrong. Journal of Heuristics 1(1):33–42
- Islam et al (2012) Islam M, Marchetto A, Susi A, Scanniello G (2012) A Multi-Objective Technique to Prioritize Test Cases Based on Latent Semantic Indexing. In: Proceedings 16th European Conference on Software Maintenance and Reengineering (CSMR), IEEE, Szeged, Hungary, pp 21–30
- Ivarsson and Gorschek (2011) Ivarsson M, Gorschek T (2011) A method for evaluating rigor and industrial relevance of technology evaluations. Empirical Software Engineering 16(3):365–395
- Iverson (1980) Iverson KE (1980) Notation As a Tool of Thought. Communications of the ACM 23(8):444–465
- Jiang et al (2008) Jiang HY, Nguyen TN, Chen IX, Jaygarl H, Chang CK (2008) Incremental Latent Semantic Indexing for Automatic Traceability Link Evolution Management. In: Proceedings 23rd International Conference on Automated Software Engineering (ASE), IEEE, L’Aquila, Italy, pp 59–68
- Knaus (2013) Knaus J (2013) snowfall: Easier cluster computing (based on snow). URL http://cran.r-project.org/web/packages/snowfall/index.html
- Lavesson and Davidsson (2006) Lavesson N, Davidsson P (2006) Quantifying the Impact of Learning Algorithm Parameter Tuning. In: Proceedings 21st National Conference on Artificial Intelligence (AAAI), AAAI Press, Boston, USA, pp 395–400
- Lawrence (2013) Lawrence MA (2013) ez: Easy analysis and visualization of factorial experiments. URL http://cran.r-project.org/web/packages/ez/index.html
- Lawrie and Binkley (2011) Lawrie D, Binkley D (2011) Expanding identifiers to normalize source code vocabulary. In: Proceedings 27th IEEE International Conference on Software Maintenance (ICSM), IEEE, Williamsburg, USA, pp 113–122
- Lee et al (2012) Lee J, Kang S, Lee D (2012) A Survey on Software Product Line Testing. In: Proceedings 16th International Software Product Line Conference (SPLC), ACM, Salvador, Brazil, pp 31–40
- Liu et al (2007) Liu D, Marcus A, Poshyvanyk D, Rajlich V (2007) Feature Location via Information Retrieval Based Filtering of a Single Scenario Execution Trace. In: Proceedings 22nd International Conference on Automated Software Engineering (ASE), ACM, Atlanta, USA, pp 234–243
- Liu (2011) Liu TY (2011) Learning to Rank for Information Retrieval, 1st edn. Springer
- Lohar et al (2013) Lohar S, Amornborvornwong S, Zisman A, Cleland-Huang J (2013) Improving Trace Accuracy Through Data-driven Configuration and Composition of Tracing Features. In: Proceedings 9th Joint Meeting on Foundations of Software Engineering (FSE), ACM, Saint Petersburg, Russia, pp 378–388
- Lormans and van Deursen (2006) Lormans M, van Deursen A (2006) Can LSI help reconstructing requirements traceability in design and test? In: Proceedings 10th European Conference on Software Maintenance and Reengineering (CSMR), IEEE, Bari, Italy, pp 47–56
- Ludbrook and Dudley (1998) Ludbrook J, Dudley H (1998) Why Permutation Tests are Superior to t and F Tests in Biomedical Research. The American Statistician 52(2):127–132
- Maletic and Marcus (2000) Maletic J, Marcus A (2000) Using latent semantic analysis to identify similarities in source code to support program understanding. In: Proceedings 12th International Conference on Tools with Artificial Intelligence (ICTAI), IEEE, Vancouver, Canada, pp 46–53
- Maletic and Marcus (2001) Maletic J, Marcus A (2001) Supporting Program Comprehension Using Semantic and Structural Information. In: Proceedings 23rd International Conference on Software Engineering (ICSE), IEEE, Toronto, Canada, pp 103–112
- Maletic and Valluri (1999) Maletic J, Valluri N (1999) Automatic software clustering via Latent Semantic Analysis. In: Proceedings 14th International Conference on Automated Software Engineering (ASE), IEEE, Cocoa Beach, USA, pp 251–254
- Maletic et al (2002) Maletic J, Collard M, Marcus A (2002) Source code files as structured documents. In: Proceedings 10th International Workshop on Program Comprehension (IWPC), IEEE, Paris, France, pp 289–292
- Marcus and Maletic (2003) Marcus A, Maletic J (2003) Recovering documentation-to-source-code traceability links using latent semantic indexing. In: Proceedings 25th International Conference on Software Engineering (ICSE), IEEE, Portland, USA, pp 125 – 135
- Marcus et al (2004) Marcus A, Sergeyev A, Rajlich V, Maletic J (2004) An information retrieval approach to concept location in source code. In: Proceedings 11th Working Conference on Reverse Engineering (WCRE), IEEE, Delft, The Netherlands, pp 214–223
- Mittas and Angelis (2008) Mittas N, Angelis L (2008) Comparing cost prediction models by resampling techniques. Journal of Systems and Software 81(5):616–632
- Moreno et al (2013) Moreno L, Bandara W, Haiduc S, Marcus A (2013) On the Relationship between the Vocabulary of Bug Reports and Source Code. In: Proceedings 29th International Conference on Software Maintenance (ICSM), IEEE, Eindhoven, The Netherlands, pp 452–455
- Oliveto et al (2010) Oliveto R, Gethers M, Poshyvanyk D, De Lucia A (2010) On the Equivalence of Information Retrieval Methods for Automated Traceability Link Recovery. In: Proceedings 18th International Conference on Program Comprehension (ICPC), IEEE, Braga, Portugal, pp 68–71
- Ostrouchov et al (2012) Ostrouchov G, Chen WC, Schmidt D, Patel P (2012) Programming with Big Data in R. URL http://r-pbd.org/
- Panichella et al (2013) Panichella A, Dit B, Oliveto R, Di Penta M, Poshyvanyk D, De Lucia A (2013) How to Effectively Use Topic Models for Software Engineering Tasks? An Approach Based on Genetic Algorithms. In: Proceedings 35th International Conference on Software Engineering (ICSE), IEEE, San Francisco, USA, pp 522–531
- Perrouin et al (2010) Perrouin G, Sen S, Klein J, Baudry B, Le Traon Y (2010) Automated and Scalable T-wise Test Case Generation Strategies for Software Product Lines. In: Proceedings 3rd International Conference on Software Testing, Verification and Validation (ICST), pp 459–468
- Pettersson et al (2008) Pettersson F, Ivarsson M, Gorschek T, Öhman P (2008) A practitioner’s guide to light weight software process assessment and improvement planning. The Journal of Systems and Software 81(6):972–995
- Pohl and Metzger (2006) Pohl K, Metzger A (2006) Software Product Line Testing. Communications of the ACM 49(12):78–81
- Poshyvanyk and Marcus (2007) Poshyvanyk D, Marcus A (2007) Combining Formal Concept Analysis with Information Retrieval for Concept Location in Source Code. In: Proceedings 15th International Conference on Program Comprehension (ICPC), IEEE, Banff, Canada, pp 37–48
- Poshyvanyk et al (2006) Poshyvanyk D, Gueheneuc YG, Marcus A, Antoniol G, Rajlich V (2006) Combining Probabilistic Ranking and Latent Semantic Indexing for Feature Identification. In: Proceedings 14th International Conference on Program Comprehension (ICPC), IEEE, Athens, Greece, pp 137–148
- Poshyvanyk et al (2012) Poshyvanyk D, Gethers M, Marcus A (2012) Concept location using formal concept analysis and information retrieval. ACM Transactions on Software Engineering and Methodology 21(4)
- Qusef et al (2014) Qusef A, Bavota G, Oliveto R, De Lucia A, Binkley D (2014) Recovering test-to-code traceability using slicing and textual analysis. Journal of Systems and Software 88:147–168
- Rothermel and Harrold (1996) Rothermel G, Harrold M (1996) Analyzing regression test selection techniques. IEEE Transactions on Software Engineering 22(8):529–551
- Salton et al (1975) Salton G, Wong A, Yang CS (1975) A Vector Space Model for Automatic Indexing. Communications of the ACM 18(11):613–620
- Shepperd et al (2014) Shepperd M, Bowes D, Hall T (2014) Researcher Bias: The Use of Machine Learning in Software Defect Prediction. IEEE Transactions on Software Engineering 40(6):603–616
- Sheskin (2000) Sheskin DJ (2000) Handbook of Parametric and Nonparametric Statistical Procedures, Second Edition, 2nd edn. Chapman and Hall/CRC, Boca Raton
- Smucker et al (2007) Smucker MD, Allan J, Carterette B (2007) A comparison of statistical significance tests for information retrieval evaluation. In: Proceedings 16th Conference on Information and Knowledge Management (CIKM), ACM, Lisbon, Portugal, pp 623–632
- Steyvers and Griffiths (2007) Steyvers M, Griffiths T (2007) Probabilistic topic models. In: Handbook of Latent Semantic Analysis, 1st edn, Psychology Press
- Teh et al (2006) Teh YW, Jordan MI, Beal MJ, Blei DM (2006) Hierarchical Dirichlet Processes. Journal of the American Statistical Association 101(476):1566–1581
- The Apache Software Foundation (2014) The Apache Software Foundation (2014) Apache Lucene - Apache Lucene Core. URL http://lucene.apache.org/core/
- Thomas et al (2013) Thomas SW, Nagappan M, Blostein D, Hassan AE (2013) The Impact of Classifier Configuration and Classifier Combination on Bug Localization. IEEE Transactions on Software Engineering 39(10):1427–1443
- Thomas et al (2014) Thomas SW, Hemmati H, Hassan AE, Blostein D (2014) Static test case prioritization using topic models. Empirical Software Engineering 19(1):182–212
- Thörn (2010) Thörn C (2010) Current state and potential of variability management practices in software-intensive SMEs: Results from a regional industrial survey. Information and Software Technology 52(4):411–421
- Unterkalmsteiner et al (2014) Unterkalmsteiner M, Gorschek T, Feldt R (2014) Supplementary Material to ”Large-scale Information Retrieval - an experience report from industrial application”. URL http://www.bth.se/com/mun.nsf/pages/autotcs-exp
- Utting et al (2012) Utting M, Pretschner A, Legeard B (2012) A taxonomy of model-based testing approaches. Software Testing, Verification and Reliability 22(5):297–312
- Wohlin et al (2000) Wohlin C, Runeson P, Höst M, Ohlsson MC, Regnell B, Wesslén A (2000) Experimentation in software engineering: an introduction. Kluwer Academic Publishers, Norwell
- Wohlin et al (2012) Wohlin C, Aurum A, Angelis L, Phillips L, Dittrich Y, Gorschek T, Grahn H, Henningsson K, Kagstrom S, Low G, Rovegard P, Tomaszewski P, van Toorn C, Winter J (2012) The Success Factors Powering Industry-Academia Collaboration. IEEE Software 29(2):67–73
- Xia et al (2015) Xia X, Lo D, Wang X, Zhou B (2015) Dual analysis for recommending developers to resolve bugs. Journal of Software: Evolution and Process In Print
- Yoo and Harman (2012) Yoo S, Harman M (2012) Regression testing minimization, selection and prioritization: a survey. Software Testing, Verification and Reliability 22(2):67–120
- Zeimpekis and Gallopoulos (2006) Zeimpekis D, Gallopoulos E (2006) TMG: A MATLAB Toolbox for Generating Term-Document Matrices from Text Collections. In: Grouping Multidimensional Data, Springer, Berlin, Heidelberg, pp 187–210
- Zhao et al (2006) Zhao W, Zhang L, Liu Y, Sun J, Yang F (2006) SNIAFL: Towards a static noninteractive approach to feature location. ACM Transactions on Software Engineering and Methodology 15(2):195–226
- Řehůřek (2011) Řehůřek R (2011) Subspace Tracking for Latent Semantic Analysis. In: Proceedings 33rd European Conference on Advances in Information Retrieval (ECIR), Springer, Dublin, Ireland, pp 289–300