Rest-Frame Near-Infrared Radial Light Profiles up to from JWST/NIRCam: Wavelength Dependence of the Sérsic Index
Abstract
We examine the wavelength dependence of radial light profiles based on Sérsic index measurements of 1067 galaxies with M 109.5M⊙ and in the redshift range . The sample and rest-frame optical light profiles are drawn from CANDELS3D-HST; rest-frame near-infrared light profiles are inferred from CEERS JWST/NIRCam imaging. shows only weak dependence on wavelength, regardless of redshift, galaxy mass and type: on average, star-forming galaxies have and quiescent galaxies have in the rest-frame optical and near-infrared. The strong correlation at all wavelengths between and star-formation activity implies a physical connection between the radial stellar mass profile and star-formation activity. The main caveat is that the current sample is too small to discern trends for the most massive galaxies (M ).
1 Introduction
James Webb Space Telescope (JWST) NIRCam imaging is providing us for the first time with spatially resolved, rest-frame near-infrared structural information of galaxies at high redshift (up to z3) with an angular resolution unachievable from ground-based observatories. Previous, extensive Hubble Space Telescope (HST) surveys have produced a detailed picture of the rest-frame UV and optical structural properties and their correlations with other galaxy properties such as stellar mass and star-formation rate (i.e., van der Wel et al., 2014a, b; Lang et al., 2014; Shibuya et al., 2015; Nelson et al., 2016), but only at longer wavelengths is the stellar body revealed without being significantly hampered by the effects of stellar population and attenuation variations across galaxies.
The broad wavelength coverage together with the high angular resolution offered by the synergy between HST and JWST observations in the near-IR allows one to examine the wavelength dependence of the Sérsic index (). For the first time we can determine for galaxies at large look-back time whether any trends in the rest-frame near-IR with stellar mass and star-formation activity are substantially different from those seen in the rest-frame optical/UV.
Both non-parametric and parametric methods have been widely used to examine galaxy structure: see Conselice (2014) for a comprehensive review on non-parametric methods and Whitney et al. (2021) for a recent application to high-redshift galaxies. Among parametric methods, Sérsic profile fits have become the standard as they are conveniently measured with codes such as galfit (Peng et al., 2002, 2010); this is the approach we use in this study.
As stellar populations and dust attenuation determine the light distribution, the measured structural properties are generally observed to depend on wavelength (e.g, de Jong, 1996a, b; Kelvin et al., 2012; Häußler et al., 2013; Vika et al., 2013; Pastrav et al., 2013; Vulcani et al., 2014; Kennedy et al., 2015; Baes et al., 2020; Nersesian et al., 2023). Kelvin et al. (2012) used the low-redshift () GAMA survey (Driver et al., 2009) to examine the dependence of the Sérsic index on wavelength, splitting the galaxy sample by visual morphology (disc galaxies and spheroidal galaxies). They find a mild dependence on wavelength for spheroidal galaxies and a somewhat stronger correlation for disc galaxies. Kelvin et al. (2012) argue that the trend is to be expected, as spiral galaxies will have redder bulges, which tend to have . Despite this trend, the difference in Sérsic index between disc and spheroidal galaxies persists even in the band ( vs. ).
Since the morphological class and structure/concentration (as parameterized by Sérsic index) are intrinsically connected and, from an empirical perspective, derived from the same information, we will instead examine the wavelength dependence of Sérsic separating galaxies by star-formation activity, which is estimated independently from the Sérsic profile. Moreover, thanks to the revolutionary NIRCam imaging we can for the first time extend such an analysis to redshift and beyond. The goal of this study is to measure the evolution of the Sérsic index with redshift in the rest-frame near-infrared and examine the wavelength dependence of the Sérsic index across the redshift range . One question of specific interest is whether the difference between the Sérsic index for quiescent and star-forming galaxies, seen in the rest-frame optical (e.g., Blanton et al., 2003; Blanton & Moustakas, 2009; Bell et al., 2012), persists in the rest-frame near-IR. If not, then the star-formation activity itself is the cause of the apparent difference in structure (while the underlying mass profile shows no such difference). Alternatively, if the difference persists, then there is a physical correlation between the shape of the radial stellar mass profile and star-formation activity.
In this work we take advantage of the JWST/NIRCam (Rieke et al., 2005) imaging provided by the CEERS program (Finkelstein et al., 2023) and model the light profiles of 1067 galaxies in the redshift range with stellar masses M⊙. We also compare our results with previous studies (Kelvin et al., 2012; van der Wel et al., 2012) to exploit strengths and weaknesses of our study.
The paper is structured as follows: in section 2 we describe the datasets used in this paper, section 3 contains the results of this work divided into the different dependencies of Sérsic indices and a comparison with literature results. This will be followed by a discussion in section 4 and finally, in section 5, we will sum up the content of the paper and draw our conclusions.
We assume a flat CDM cosmology with H0=70km s-1 Mpc-1 and =0.3.
2 Data and Sample Selection
In this section we construct a redshift and stellar mass-selected sample from pre-existing catalogs in the Extended Groth Strip (EGS, Davis et al., 2007), and derive Sérsic profile fits from the recently acquired JWST/NIRCam imaging from CEERS (Finkelstein et al., 2023).
2.1 Imaging and Photometry
Skelton et al. (2014) and Whitaker et al. (2014) presented HST, Spitzer and ground-based imaging data to construct a widely used, homogeneous photometric catalog from the UV to 24m for the five extragalactic deep fields targeted by CANDELS (Koekemoer et al., 2011; Grogin et al., 2011) and 3D-HST (Brammer et al., 2012) which Leja et al. (2020) used to estimate redshift, stellar masses, star-formation rates and dust attenuation parameters with the Prospector SED fitting code (Johnson & Leja, 2017; Johnson et al., 2021). In this paper we use the Leja et al. (2020) catalog of redshifts, stellar masses and star-formation rates for galaxies at redshift .
We first cross-match this catalog with van der Wel et al. (2012) which will be used as a reference for comparisons, and then with sources in the recent JWST/NIRCam data taken as part of the Cosmic Evolution Early Release Science Survey (CEERS) program (Finkelstein et al., 2017, 2023) in the EGS, one of the 5 CANDELS fields. We note (and correct for) a systematic shift in declination of between the Skelton et al. (2014) coordinates and the coordinates in the CEERS mosaics, which we identified with the Python library for Source Extraction and Photometry sep (Bertin & Arnouts, 1996; Barbary, 2016, 2018). We identify 2684 out of 63,413 galaxies in the Leja et al. (2020) catalog falling within the NIRCam footprint, of which 1216 are above our adopted stellar mass limit of M⊙, which is the stellar mass completeness limit of the photometric catalog at (Tal et al., 2014). 97% of these objects have signal-to-noise ratio 50 in all JWST/NIRCam filters, which is the requirement for unbiased Sérsic index measurements (van der Wel et al., 2012). This is not the case for the shallower HST/WFC3 data, but those data do not play a major role in this work.
CEERS provides imaging in seven near-IR filters, specifically F115W, F150W, F200W in the Short Wavelength channel of NIRCam and F277W, F356W, F410M, F444W through the Long Wavelength channel. We use Stage 2b calibrated images already background subtracted available on the MAST archive additionally processed with the Grizli software (Brammer, 2019) to obtain aligned imaging, weight and segmentation mosaics out of the 4 pointings available when we started this work (also see Naidu et al., 2022).
For convenience, the available HST/ACS (F606W and F814W) and HST/WFC3 (F125W, F140W and F160W) data are re-reduced with Grizli to produce mosaics that are aligned with the NIRCam mosaics from CEERS.
2.2 Sérsic Profile Fits
For each of the 1216 target galaxies with NIRCam imaging and for each of the seven JWST filters and five HST filters, we create square cutouts with size ten times the effective radius in pixels measured from the F160W CANDELS imaging (van der Wel et al., 2012). We set a lower limit of 63 pixels (2.5”) and an upper limit of 200 pixels for sources with . The upper limit is doubled for sources brighter than this threshold to ensure accurate background estimates. All objects in the cutout that are brighter than or less than 1 magnitude fainter than the target are assigned their own Sérsic profile and simultaneously fitted. All other sources in the van der Wel et al. (2012) catalog or in the CEERS segmentation map are masked.
We use GalfitM (Häußler et al., 2013; Vika et al., 2013) to perform the profile fits simultaneously for all JWST/NIRCam filters and simultaneously for all HST/ACS and HST/WFC3 filters. The model Sérsic profiles are convolved with the publicly available model PSFs111https://github.com/gbrammer/grizli-psf-library/tree/main/ceers drizzled with the same drizzle parameters as those used to create the mosaics. The square root of the inverse of the weight map is used as the noise map in GalfitM. The background, as well as the center of the galaxy, the total magnitude, Sérsic index and effective radius are left as free parameters of the fit, allowing those to vary independently from filter to filter. The axis ratio and position angle are the additional free parameters, but these are constrained to have the same value for all filters in the simultaneous fits.
We set the following constraints on the fit’s parameters:
-
•
Sérsic index
-
•
Re [pix]
-
•
x and y coordinates have to be within 5 pixels from the van der Wel et al. (2012) corrected position.
Following van der Wel et al. (2012) we assign a formal random uncertainty of 0.1 dex on the Sérsic index for objects with signal-to-noise ratio S/N, and scale the (linear) uncertainty with (S/N)-1/2. The S/N is calculated by summing the image and inverse weight maps across the object segment in the segmentation map.
In Figure 1 we show the data, model and residual of four galaxies respectively at redshift 0.74, 0.98, 2.49 and 2.98. Even these low-mass galaxies are detected with high significance and are well resolved by JWST/NIRCam filters, even when HST does not.
In order to calculate the Sérsic index at specific rest-frame wavelength values we fit for each object a 2nd-order Chebyshev polynomial to the independently measured Sérsic values across all filters (but separately for JWST and HST to exploit differences between the instruments) with the uncertainties as weight factors. For each galaxy we fit the polynomial only to those filters where the galaxy was detected (i.e. does not fall in gaps of the NIRCam detectors) and with a converged value of . We reject from our sample galaxies for which less than 3 filters are available to fit the polynomial. Among the JWST fits, just one galaxy does not satisfy this condition, while for the HST fits we reject 35 galaxies.
The adopted uncertainty for Sérsic indices at specific rest-frame wavelength recovered from the Chebyshev polynomial is that of the filter nearest in pivot wavelength. The differences between the directly measured Sérsic index values and the polynomial values are small, typically and within the error bar.
We also remove from our sample those 113 objects for which the Sérsic index reached the or constraint for either of the JWST/NIRCam or HST/ACS filters. The WFC3 filters overlap in wavelength with the NIRCam/SW channel, so that such a rejection is not needed.
This leaves us with a final sample of 1067 galaxies in the redshift range and MM⊙. The rejected galaxies do not severely bias the sample as they do not occupy a particular region of the parameter space in terms of redshift or stellar mass (in the appendix A we show the stellar mass and sSFR distribution of the selected sample and of the rejected galaxies as a function of redshift).
To check whether the size adopted for cutouts is large enough to properly retrieve Sérsic profiles, we compare our size measurements with those presented in van der Wel et al. (2012) finding no systematic differences.
To ensure that the background estimate converges for the sizes of the cutouts, we compare the magnitudes with those obtained from cutouts half the size and, for a subset of the 50 most massive galaxies, the magnitudes obtained with cutouts double the size. From this exercise we conclude that the magnitudes are accurate to within 0.05 mag (and Sérsic indices to within 0.03 dex), indicating the systematic uncertainties in the background estimates do not play a significant role. To check for spatial variations of the background within cutouts we compared the standard deviation of pixels in the residuals with the median value in the noise-maps finding a good agreement between the two. This confirms that background spatial variations due to close bright sources or diffuse halos do not contribute significantly to the uncertainties.
Likewise we test whether constraining the position angle and axis ratio to the same value for all filters leads to systematic errors. With those parameters free to vary from filter to filter we find only small scatter in Sérsic .
To test the reliability of our new HST-based Sérsic profile fits we compare in the upper panel of Figure 2 our measurements of Sérsic index in the HST/WFC3 filter F160W with the previously published values from van der Wel et al. (2012) inferred from the same data. Due to slight differences in the segmentation of objects and in methodology there is scatter and a fair number of outliers appear ( of the sample have log() dex with no preferred properties, where log() is defined as ), but the systematic offset is negligible and the 1 scatter small (). Galaxies with log() dex are characterized by a median S/NF160W that is half of that of galaxies with smaller log(), suggesting low S/N might be an important source of scatter in this plot.
In the bottom panel of Figure 2 we show a comparison of NIRCam/F150W and HST/F160W Sérsic indices retrieved in this work. From this figure, we can infer that despite being shallower than JWST/F150W, HST/F160W was already deep enough to properly recover Sérsic indices for the whole population (van der Wel et al., 2012; Nedkova et al., 2021). Indeed, quantitatively, is just 7% systematically larger than . However, the large scatter observed reflects how the improved depth of F150W highlights new features that can change the Sérsic index of some galaxies. An example of such differences can be observed in the last two panels of Figure 1.
The scatter is larger by about a factor 2 compared to what one expects based on the formally adopted measurement uncertainties: the total uncertainty (on the ratio of the two independently measured Sérsic indices shown in the figure) is as much as 50%. That said, the random uncertainties on the CEERS-based measurements are typically a factor 3-4 smaller than those from CANDELS due to the increased S/N, leading us to conclude that the CEERS-based measurements have a variance that is one-quarter of the total variance seen in Fig. 2. The error budget is an important issue that needs to be examined in detail, but it is also beyond the scope of this paper. Future improvements in the PSF model and background subtraction techniques are certain to improve the data analysis.
To test whether the choice of the PSF used to fit NIRCam mosaics affects our results, we repeat the profile fits with an empirical PSF: a star visually identified in the NIRCam mosaics. The star is chosen to be faint (and therefore noisy) in order to avoid the well-known saturation issues in the NIRCam imaging (for an in-depth analysis of the JWST/NIRCam PSF see e.g., Nardiello et al., 2022; Weaver et al., 2023; Zhuang & Shen, 2023). The difference between the model-PSF and the empirical-PSFs is most pronounced in the Short Wavelength channel, where we see a decrease of in for objects with . Low- and Long Wavelength channel estimates are not systematically affected. This bias does not introduce large significant uncertainties in the following analysis and our conclusions do not depend on the choice of PSF. Solid dark(light)-grey lines show linear regression fits to the values inferred with the model (empirical) PSF, using 3 clipping. The empirical PSF results shows systematic offsets at low and high , whereas the model PSF results do not, implying that they suffer less from systematic uncertainties. The results based on the model PSF are used in the remainder of this paper.
2.3 Local Comparison Sample from GAMA
A comparison sample is drawn from GAMA. For the GAMA I dataset we use the GalfitM profile fits obtained from the SDSS ugriz imaging and the UKIDSS-LAS YJHK imaging (Lawrence et al., 2007, 2012).222http://www.gama-survey.org/dr4/schema/table.php?id=578
MAGPHYS (da Cunha et al., 2008) stellar mass and star-formation rate estimates from GAMA II 333http://www.gama-survey.org/dr4/schema/table.php?id=545 are used to construct the comparison sample of galaxies with M⊙ and redshift . There may be systematic differences between MAGPHYS and Prospector-based parameter estimates, for the purpose of this study these are not significant: we study trends with mass and bulk redshift evolution so that 0.1-0.2 dex differences in and SFR do not matter.
3 Results
In this section we investigate the wavelength and mass dependence and redshift evolution of the Sérsic index, based on the 1067 galaxies in the redshift range and with stellar masses M⊙, and the low- comparison from GAMA. We often use the rest-frame 0.5m and 1.1m Sérsic index, and , to examine the differences between rest-frame optical and rest-frame near-IR trends, choosing 0.5m to avoid the larger scatter at shorter wavelength, and choosing 1.1m to have common wavelength coverage across the entire redshift range.
3.1 Wavelength dependence of Sérsic n
We divide the sample into quiescent and star-forming galaxies defining the former as those galaxies that are located dex below the ridge defined by Leja et al. (2022) (see also Appendix A). The ridge definition presented in Leja et al. (2022) applies to galaxies. The SFRs of GAMA galaxies at are compared with the cutoff value for to avoid extrapolation.
Figure 3 shows the median Sérsic index as a function of rest-frame wavelength. The medians (and percentile ranges) are constructed as follows. At a specific rest-frame wavelength all galaxies (minimum 10) with coverage from either HST or JWST are included using the Chebyshev polynomial value (see Sec. 2.3). If both HST and JWST cover that wavelength, JWST is preferred on account of its higher S/N. Lines are drawn using the cobs (Ng & Maechler, 2007, 2022) library which allows for a combination of a spline regression and quantile regression (the smoothing factor is chosen using the Schwarz-type information criterion automatically computed by the code.).
We recover a clear, overall difference in the median Sérsic index of star-forming and quiescent galaxies: vs. , respectively (as indicated by the grey dashed lines in Fig. 3). Uncertainties are computed as standard deviation of 1000 replica of the medians computed at different wavelength and gaussian distributed according to their own statistical uncertainty (represented by the errorbars in Figure 3). Neither the quiescent nor the star-forming population shows a strong wavelength dependence across m to m. The scatter in among all the galaxies, shown in the figure by means of shaded areas that extend from the to the percentiles, is constant with wavelength for quiescent galaxies, but for star-forming galaxies the scatter decreases with wavelength, likely due to a reduced variation in radial profiles due to stochasticity in the distribution of young stars and dust. This reduced scatter at long wavelengths implies that the contrast between quiescent and star-forming galaxies is, statistically speaking, more significant in the near-IR than in the UV/optical.
The fact that the wavelength dependence is weak for the ensemble of galaxies does not necessarily imply that individual galaxies have similar Sérsic indices at all wavelengths. In Figure 4 we investigate the direct comparison between and . The comparison shows only 0.1dex (26) scatter, which is a combination of observational uncertainties and physical variations. of galaxies change their Sérsic index by more than a factor 1.5 (up or down) from m to m. The vast majority of galaxies have similar radial light profiles at different wavelengths. The fractions of galaxies with and are similar: 8% and 11%, respectively. At low there is a small but significant deviation in the sense that is smaller than , driven by galaxies with large . We performed a Cramér-test (Baringhaus & Franz, 2004) to asses whether and share the same distribution. For quiescent galaxies the test results 0.34 with an estimated p-value of 0.89 (with 1- confidence interval) confirming the absence of wavelength dependence on Sérsic index for quiescent galaxies. On the contrary, for star-forming galaxies, we find an observed statistic of 3.75 with a p-value of , suggesting the Sérsic index indeed shows a mild dependence on wavelength. However, as shown in the bottom panel of Figure 4, becomes systematically smaller than unity for rising . To statistically confirm this observation we performed a Cramér-test on those star-forming galaxies with Av finding that and for these galaxies are distributed the same (test result 0.64, p-value 0.36). This is consistent with the recent results from Gillman et al. (2023) who find that sub-mm-selected galaxies (expected to be dusty) have more concentrated profiles in the rest-frame near-IR than in the rest-frame optical/UV.
Figure 3 shows also the wavelength dependence of the Sérsic index for the comparison sample drawn from GAMA (Sec. 2.3). Although the star-forming galaxies show an increase with wavelength from to almost in the rest-frame band, or higher than seen in the high- sample, the quiescent population shows a milder evolution with its peak in the nUV. The trend shown by the star-forming galaxies echos the findings by Kelvin et al. (2012) for GAMA, but they divided the sample into Disk and Spheroidal classes, presenting a different look compared to our separation by star-formation activity. It is worth pointing out that the definition of quiescence can be important: different definitions can affect the strength of the increase(decrease) in the nIR(nUV) shown by star-forming(quiescent) galaxies. Definitions like that presented in Tacchella et al. (2022) (where a galaxy starts its quiescent phase when sSFR, with being the age of the universe at the galaxy’s redshift) lead to much shallower slopes for both the GAMA quiescent and star-forming population leaving almost unaffected our high redshift sample.
Nonetheless, the good agreement between the two datasets suggests a lack of dependence on redshift for the quiescent population and a mild evolution in the median for the star-forming population.
3.2 Correlations with Star Formation Activity
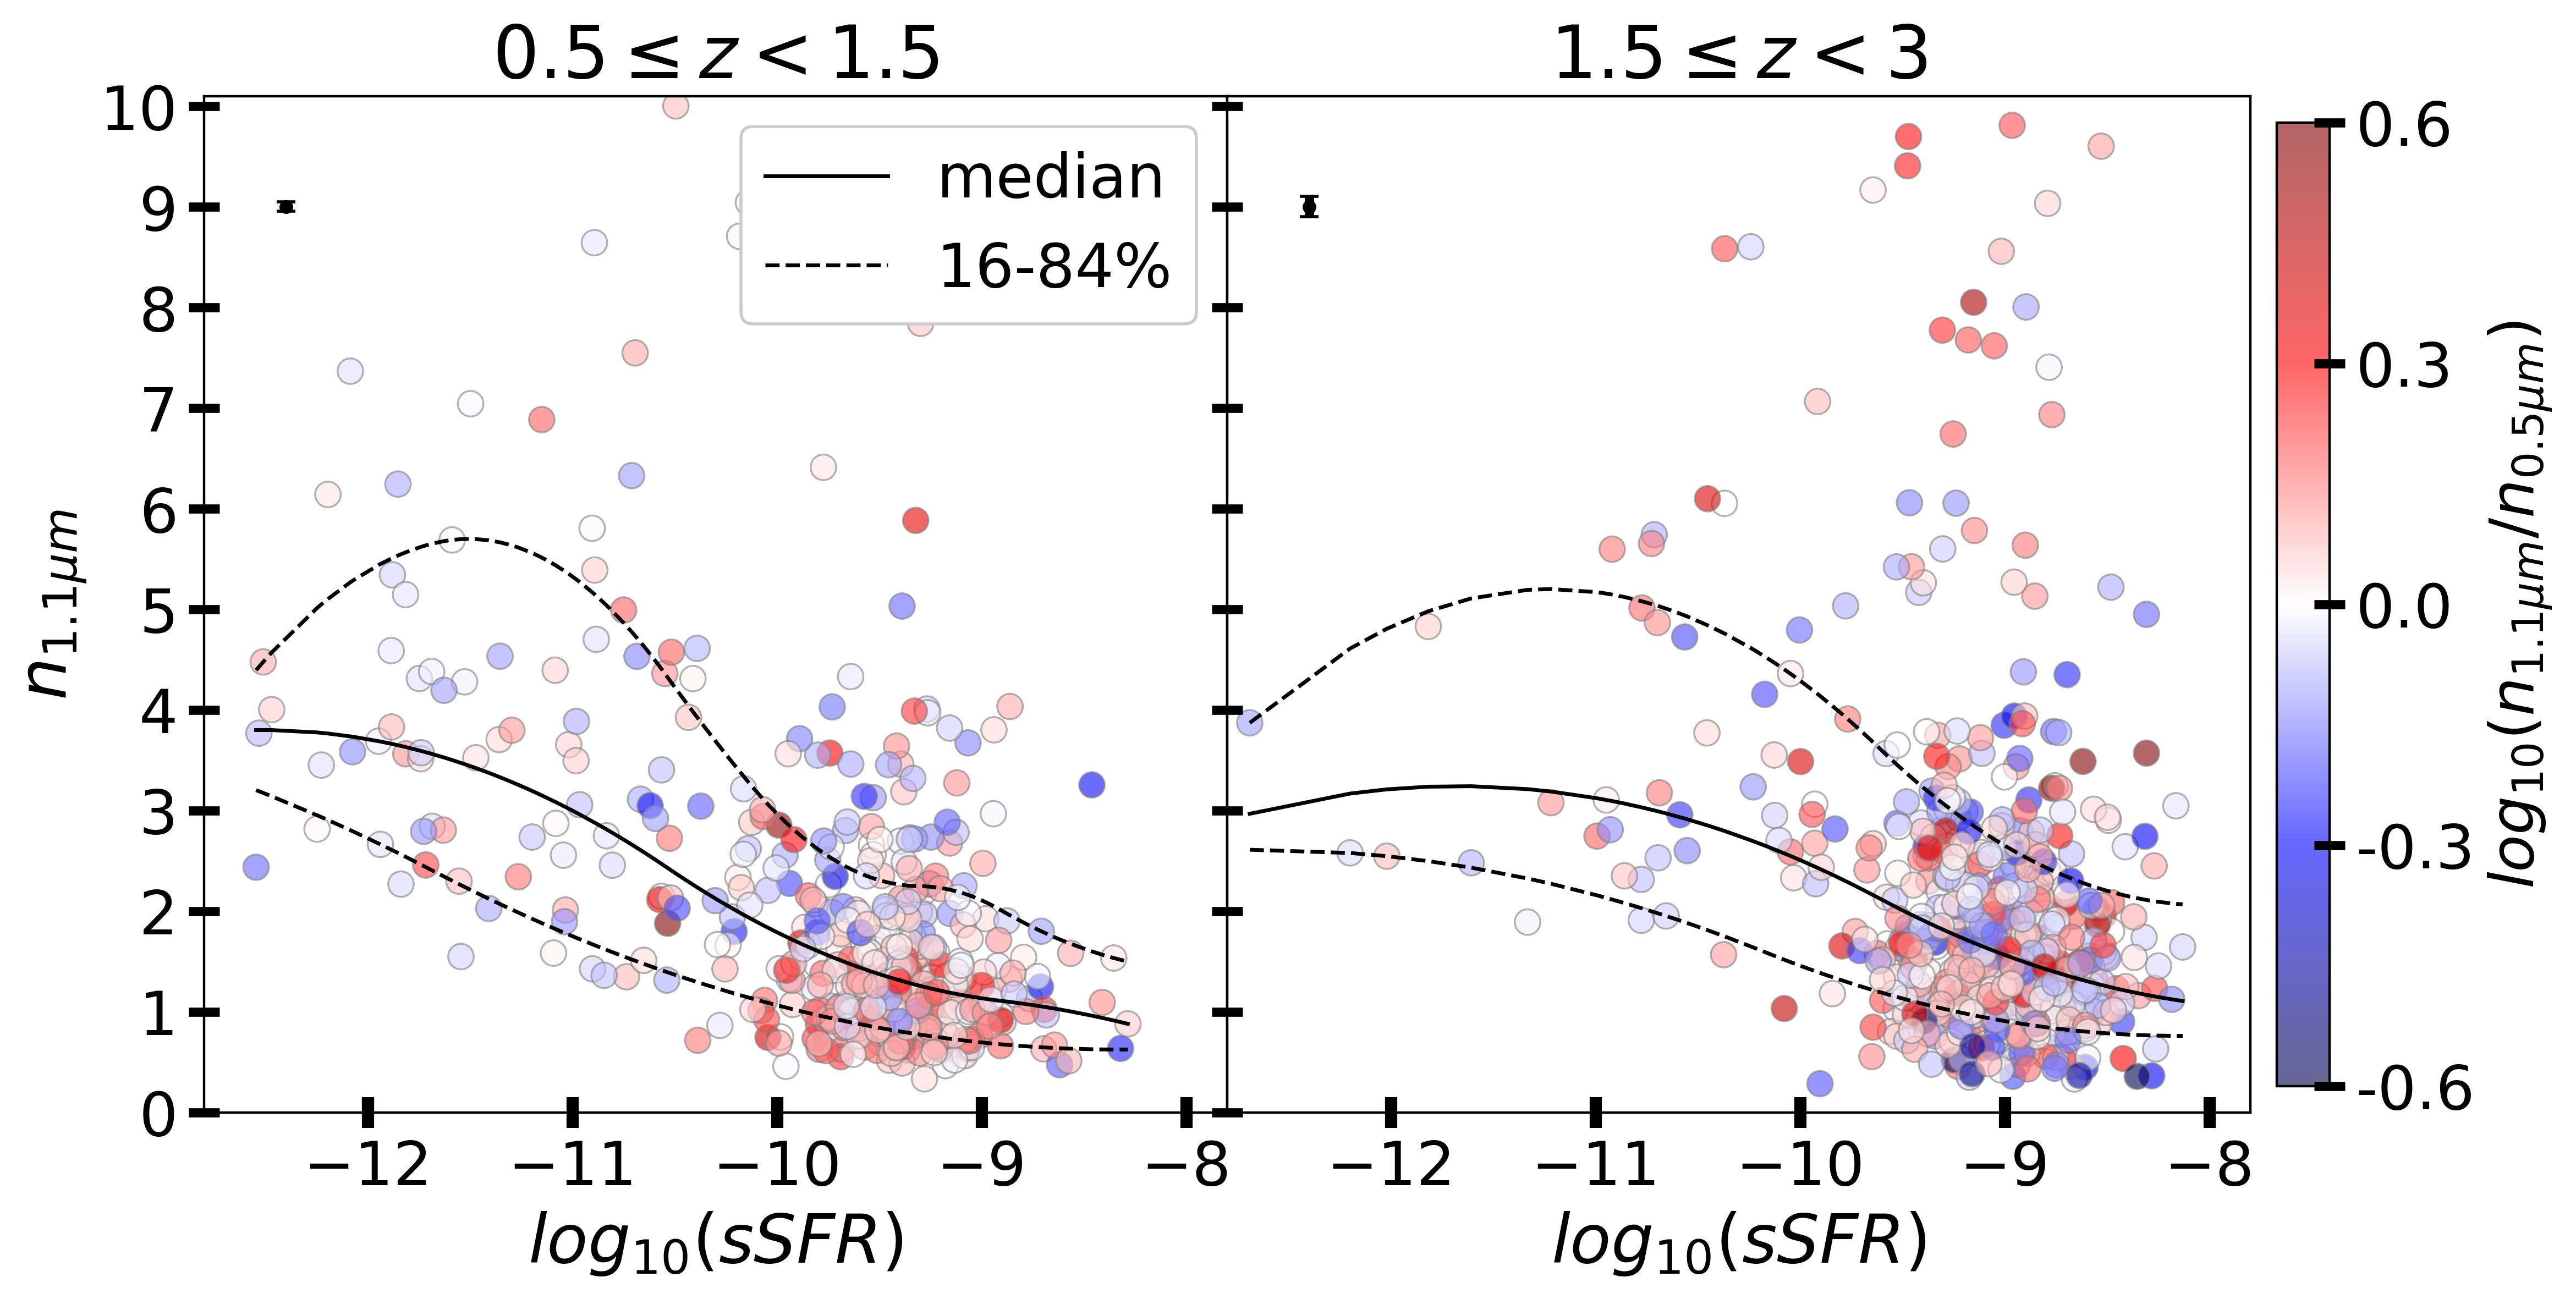
Figure 3 suggests that star formation activity shows a strong correlation with Sérsic index, regardless of wavelength. In Figure 5 we show , the Sérsic index at rest-frame m, as a function of the sSFR. Lines are drawn with the technique presented in section 3.1. The smoothing factor is chosen using the Schwarz-type information criterion. Galaxies with low sSFR have systematically larger than galaxies with high sSFR. For both and the Cramér test excludes with very high confidence that star-forming and quiescent galaxies are drawn from the same distribution. However, star-forming galaxies show a tail of high- galaxies. This echoes earlier results obtained in the rest-frame optical by Bell et al. (2012) and Whitaker et al. (2017), who argued that having a high Sérsic index is a necessary, but not sufficient, condition for a galaxy to be quiescent.
Interestingly, the Sérsic index does evolve with redshift at fixed sSFR: galaxies with log(sSFR) have at and at . But rather than indicating a physical decrease in with cosmic time, this should be interpreted in the context of a decline in SFR with cosmic time, which is of course well documented (Leja et al., 2022, and references therein).
We also see that galaxies with low sSFR do not show a difference between and . On the contrary, at (left-hand panel of Fig. 5) high sSFR galaxies show positive values of . At there is no such trend, but there is a significant scatter in , which is mostly due to variations in (rather than ), otherwise this would result in a vertical gradient in the color coding. This scatter does not reflect difficulties in estimating Sérsic profiles at at high redshift since these come from high- JWST/NIRCam imaging, but rather a wider variety of values at high redshift, likely due to variance induced by bright star-forming regions and/or dust-obscured areas.
3.3 Correlations with Stellar Mass
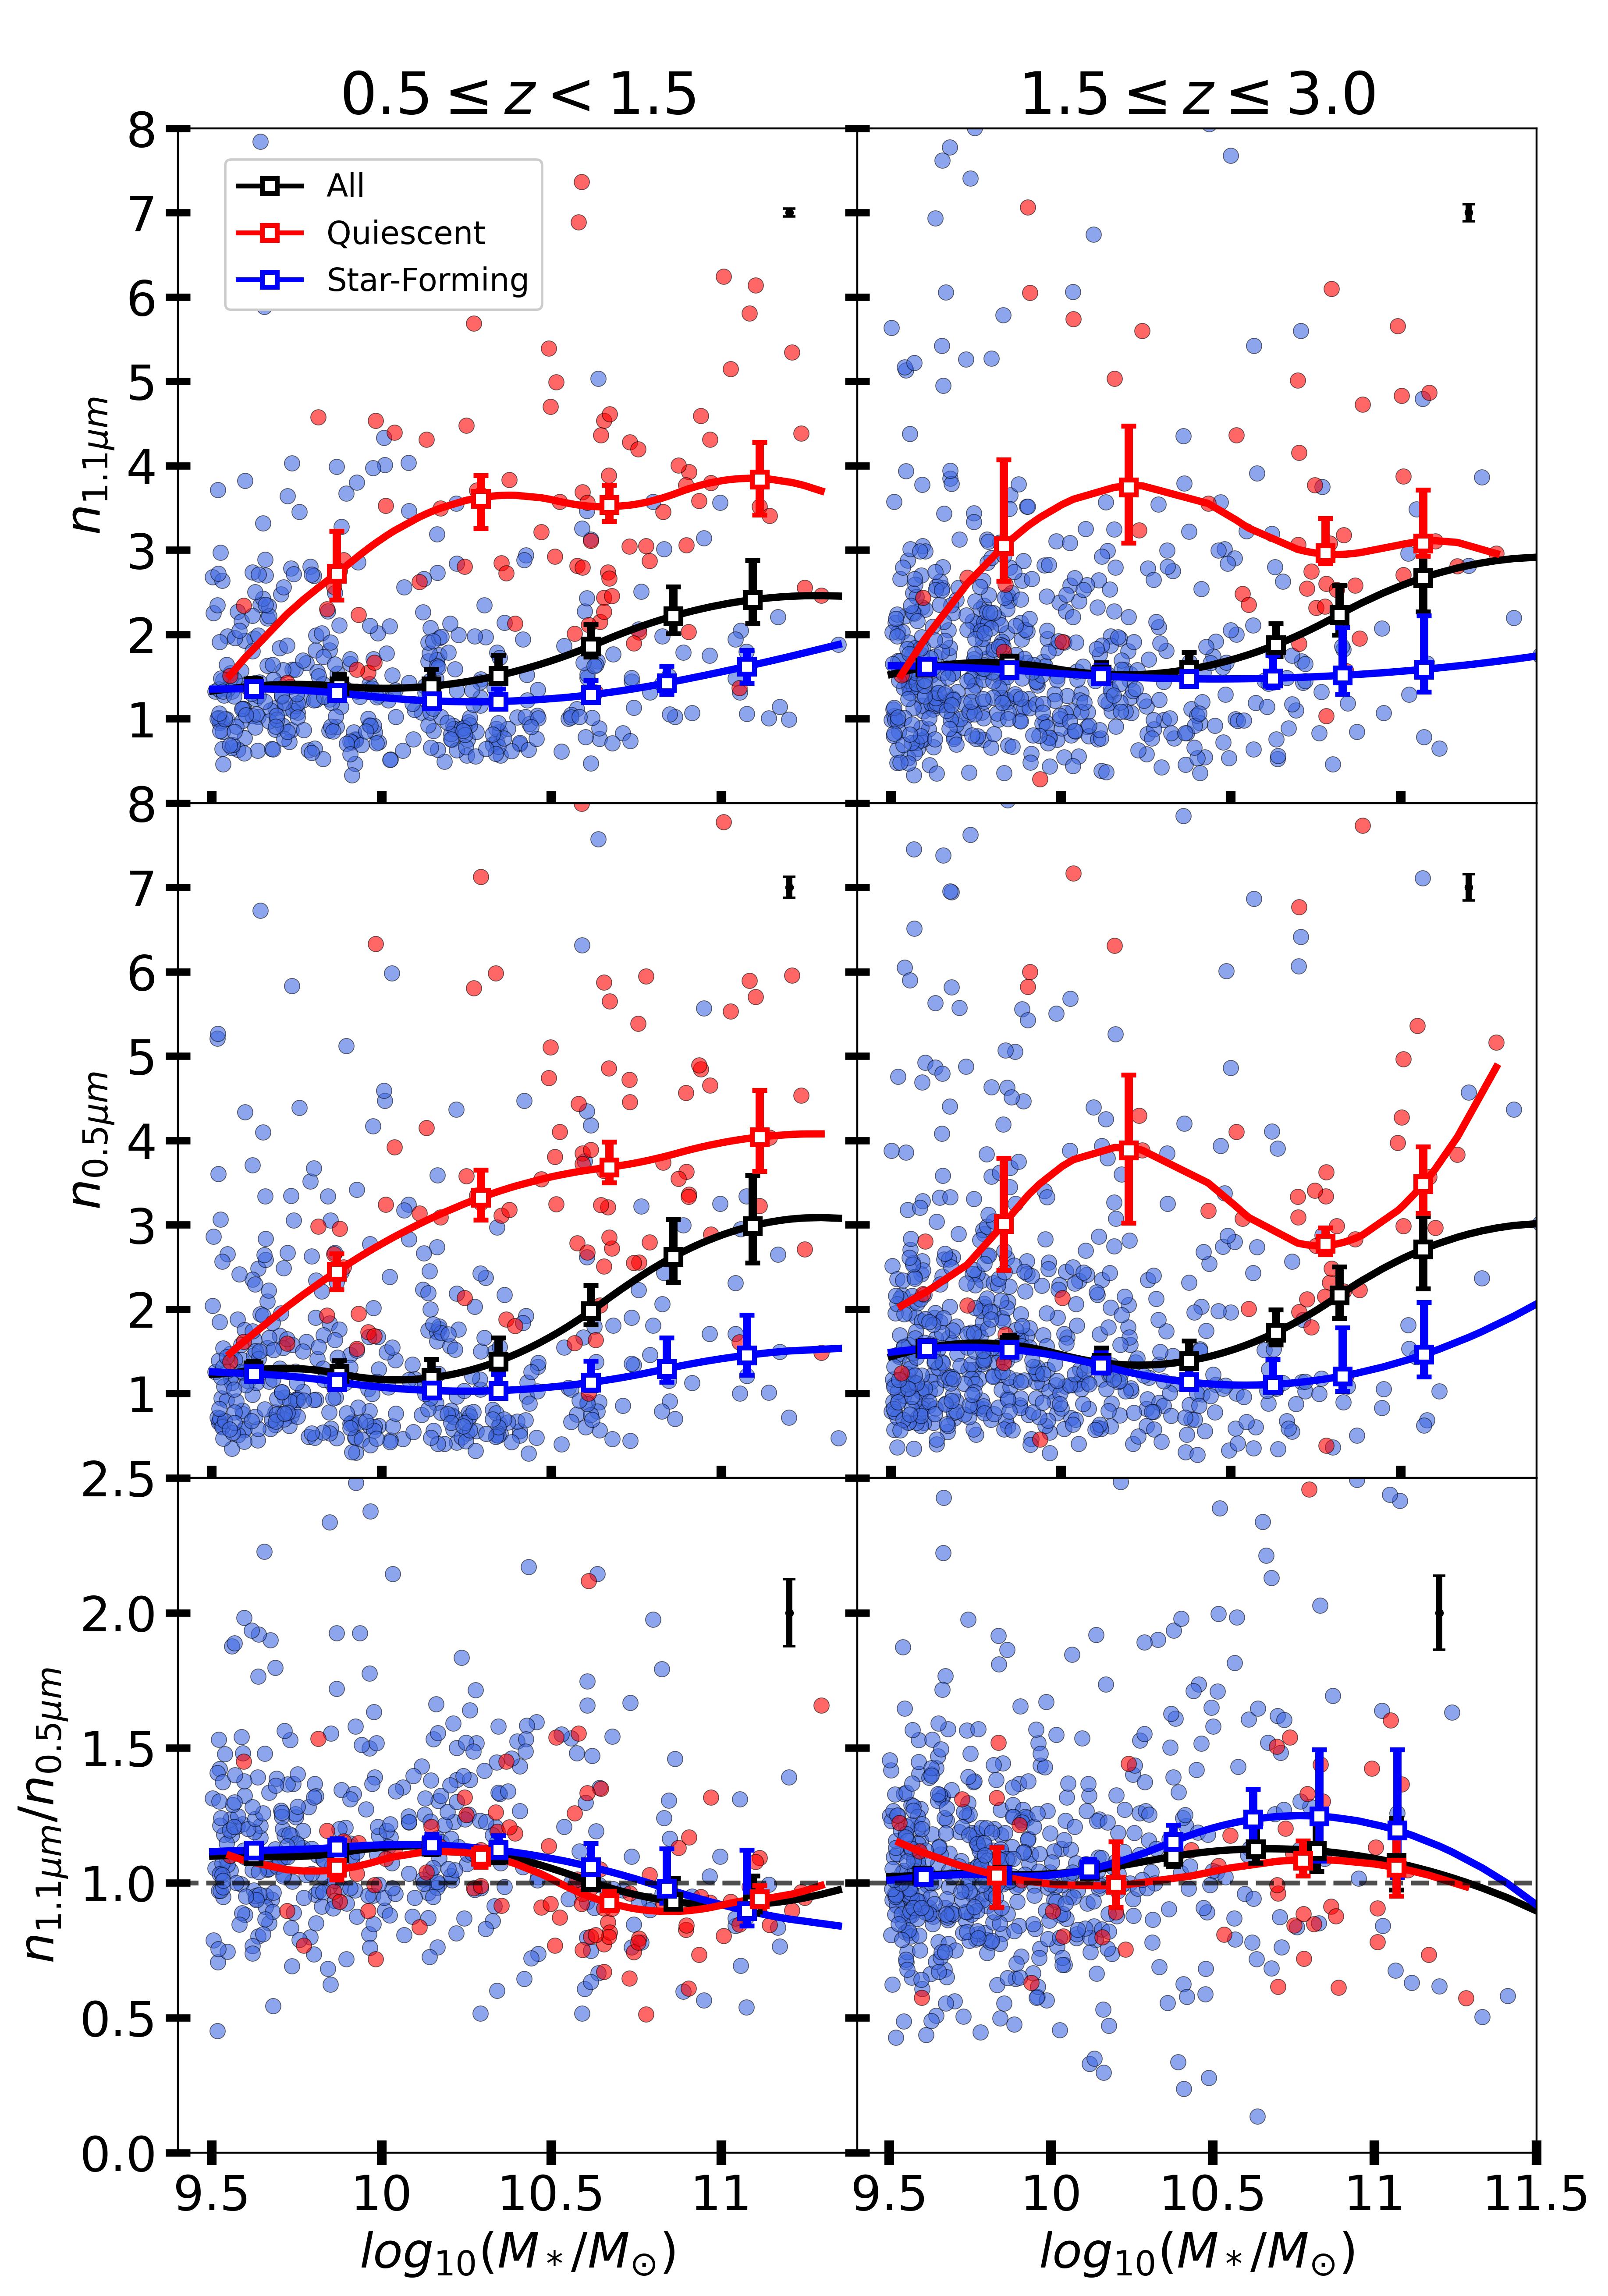
The wavelength and sSFR dependence of the Sérsic index shown above do not consider any correlation with stellar mass. Figure 6 shows , and their ratio as a function of stellar mass. Regardless of wavelength, the Sérsic index increase with stellar mass is in part due to the underlying correlations between, on the one hand, stellar mass and sSFR, and on the other hand sSFR and Sérsic index. But also among quiescent galaxies the Sérsic index increases with stellar mass, while for star-forming galaxies such an increase is less evident. Here we should keep in mind that the current sample has only a few massive star-forming galaxies with significant bulge components.
Regardless of the detailed mass-dependencies that may exist, the main point is that the Sérsic index - stellar mass distribution looks very similar in the rest-frame optical and rest-frame near-IR, and that these patterns exist across the entire redshift range . This is further elucidated by the bottom panels, that show , which does not deviate much from unity across the sampled stellar mass range. The only significant departure is seen, somewhat surprisingly, for lower- star-forming galaxies at , which have slightly higher than . These galaxies often have whereas , which may suggest that these galaxies have diffusely distributed young populations and/or somewhat attenuated centers, while the underlying populations have approximately exponential profiles.
In the highest redshift bin we observe the median is compatible with unity for star-forming galaxies with M⊙ followed by an increase that peaks at M⊙ and a sharp decline for higher masses. The quiescent population shows no significant trend. However, the sample is too small at these high masses to claim a physical difference in .
4 Discussion
While light profiles in the optical/UV can be strongly affected by young stars and dust absorption, the near-IR is more representative of the stellar mass distribution. But the striking absence of a strong wavelength dependence of the Sérsic index for both quiescent and star-forming galaxies over the redshift range suggests that the curvature of the radial light profile in the optical does not deviate much from that of the underlying stellar mass distribution across most of cosmic time: an exponential profile at short wavelengths predicts an exponential profile at long wavelengths, and a De Vaucouleurs-like profile generally also persists across the UV-to-near-IR wavelength regime. Our findings reinforce the results from Bell et al. (2012) who found no wavelength dependence for across the rest-frame UV and optical wavelength regime for galaxies up to .
The absence of a striking wavelength dependence on Sérsic index does not imply that light profiles do not systematically change with wavelength. Galaxies have smaller scale radii at longer wavelengths at both low and high redshift (Kelvin et al., 2012; van der Wel et al., 2014a). At low redshift we understand this to be due to gradients in attenuation (e.g., Popescu et al., 2000; Graham & Worley, 2008) and stellar population properties (e.g., Sánchez-Blázquez et al., 2007; Zibetti et al., 2020). At large look-back time, thanks to JWST, such analysis is now becoming possible (Miller et al., 2022; Suess et al., 2022; Shen et al., 2023), and it is already clear that the stellar mass distribution is smoother (Wuyts et al., 2012) than the clumpier distribution seen in the UV and optical (e.g., Guo et al., 2015).
The key result presented here is that the radial profiles of star-forming and quiescent galaxies are different even in the rest-frame near-infrared If star formation and/or dust were responsible for the different structure seen at shorter wavelengths, then the Sérsic indices of star-forming and quiescent galaxies would become more similar at longer wavelengths. In fact, the reduced scatter in of star-forming galaxies at longer wavelengths (m, see Figure 3) implies that the difference in structure is more pronounced in the rest-frame NIR than the rest-frame UV/optical. The absence of such a trend implies, at first sight, that stellar mass profiles are similar to stellar light profiles, but since galaxy sizes decrease with wavelength, and stellar half-mass radii are generally found to be smaller than half-light radii (e.g., Szomoru et al., 2013; Fang et al., 2013; Suess et al., 2017; Mosleh et al., 2017; Suess et al., 2019; Miller et al., 2023), the interpretation is not straightforward. Clearly, the outshining effect of young, bright, blue populations (Wuyts et al., 2012; Reddy et al., 2012; Lilly & Carollo, 2016) plays a significant role. In particular, Fang et al. (2013) find that, for galaxies in the present-day Universe, the difference between half-mass and half-light radii is larger for star-forming galaxies than for quiescent galaxies and that stellar mass profiles in the range kpc are rather similar for quiescent and star-forming galaxies.
But a high Sérsic index is driven by the combination of deviations from an exponential profile at both small radius, where Fang et al. (2013) indeed find a significant difference between the mass profiles of star-forming and quiescent galaxies, and large radius, which Fang et al. (2013) do not examine. In general, a decline in galaxy size with wavelength and a lack of such dependence for the Sérsic index are not necessarily in tension, and we conclude that there is a physical difference in the radial curvature of the stellar mass profiles when comparing star-forming and quiescent galaxies.
The strong correlation between galaxy structure and star-formation activity seen at high redshift (Franx et al., 2008; Wuyts et al., 2011; Bell et al., 2012; Barro et al., 2017; Whitaker et al., 2017) is now verified to be physical in nature and builds on well-documented correlations seen for present-day galaxies (e.g., Kauffmann et al., 2003; Brinchmann et al., 2004). A more in-depth discussion of the causal connection between structural evolution and star-formation history/quenching (e.g., van der Wel et al., 2009; Bell et al., 2012; Fang et al., 2013; van Dokkum et al., 2015; Lilly & Carollo, 2016; Tacchella et al., 2016; Barro et al., 2017; Bluck et al., 2020; Chen et al., 2020; Dimauro et al., 2022) is beyond the scope of this paper.
At , M⊙ star-forming galaxies do show a mild increase in with wavelength, while this trend disappears at higher redshift. Because of the lack of a significant number of high-mass galaxies in the sample, we can not argue the same for higher masses. However, the hint of a gradual trend of with redshift (Fig. 6) at first sight echoes the usual line of thought that older bulges and a lack of attenuation in the center lead to an increased Sérsic index at longer wavelengths, but our measurements are not consistent with this picture. Instead, the trend is driven by galaxies with M⊙ which display a slight decrease in from high to low redshift in the rest-frame optical (mid row of Fig.6) while their rest-frame near-IR shows a weaker and less significant evolution (top row of Fig.6). Similar trends were found at low redshift by Vulcani et al. (2014) and at 2-3 by Shibuya et al. (2015) comparing UV and optical wavelengths. We speculate this is, at least partially, due to an increase in attenuation with cosmic time for galaxies in this mass range, associated with an increase in gas-phase metallicity (e.g., Sanders et al., 2021).
5 Conclusions and Outlook
We present rest-frame optical and near-IR Sérsic index measurements for a sample of 1067 galaxies at with stellar masses 109.5M⊙ selected from recent JWST/NIRCam imaging that was collected as part of the CEERS program (Finkelstein et al., 2023). The wavelength dependence of is weak (Fig.3). As a result, the near-IR light profiles of galaxies do not, on average, strongly differ from those in the optical (Fig.4). The large spread in at any given wavelength is strongly correlated with star-formation activity (Fig.5), across redshift and stellar mass. Indeed, after controlling for star-formation activity, star-forming galaxies show just a weak evolution in with redshift, as previously shown by Shibuya et al. (2015) in the rest-frame optical, and a mild dependence on stellar mass. The remaining scatter is mostly driven by variations in the optical profile driven by dust absorption (Fig.4). Regardless of wavelength, stellar mass, and redshift we see that star-forming galaxies have , and quiescent galaxies have (Figs. 3 and 6).
The fact that the well-documented correlation between galaxy structure and star-formation activity (see Sec. 3.2) persists in the rest-frame near-infrared implies a physical connection between radial stellar mass distribution and growth through star-formation. In other words, it is not a mere perception caused by young, bright, star-forming disks that fade after the cessation of star formation.
The lack of a strong wavelength dependence in the Sérsic index at all redshifts also implies a plausible lack of such a dependence at even higher redshifts. As JWST/NIRCam explores the rest-frame optical up to (Kartaltepe et al., 2022) and UV at , we can have some confidence that the observed radial light profiles inform us about the underlying stellar mass profiles even if -gradient corrections are needed to reconstruct those.
Our conclusions hold for galaxies across the redshift range and the main weakness of the current study is the small number of high-mass star-forming galaxies (as discussed in section 3.3), especially at high : there are only 11(9) M⊙ star-forming(quiescent) galaxies at investigated with JWST in our sample. For these galaxies the structure may be expected to vary the strongest with wavelength due to centrally concentrated, dust-obscured star-formation activity. As larger areas are observed with NIRCam by, for example, JADES (Williams et al., 2018), UNCOVER (Bezanson et al., 2022) and COSMOS-Web (Casey et al., 2022), this challenge will be addressed.
Acknowledgments
This project has received funding from the European Research Council (ERC) under the European Union’s Horizon 2020 research and innovation programme (grant agreement No. 683184). MM and MB acknowledge the financial support of the Flemish Fund for Scientific Research (FWO-Vlaanderen), research project G030319N.
References
- Baes et al. (2020) Baes, M., Nersesian, A., Casasola, V., et al. 2020, A&A, 641, A119, doi: 10.1051/0004-6361/202038470
- Barbary (2016) Barbary, K. 2016, Journal of Open Source Software, 1, 58
- Barbary (2018) Barbary, K. 2018, SEP: Source Extraction and Photometry, Astrophysics Source Code Library, record ascl:1811.004. http://ascl.net/1811.004
- Baringhaus & Franz (2004) Baringhaus, L., & Franz, C. 2004, Journal of Multivariate Analysis, 88, 190, doi: https://doi.org/10.1016/S0047-259X(03)00079-4
- Barro et al. (2017) Barro, G., Faber, S. M., Koo, D. C., et al. 2017, ApJ, 840, 47, doi: 10.3847/1538-4357/aa6b05
- Bell et al. (2012) Bell, E. F., van der Wel, A., Papovich, C., et al. 2012, ApJ, 753, 167, doi: 10.1088/0004-637X/753/2/167
- Bertin & Arnouts (1996) Bertin, E., & Arnouts, S. 1996, A&AS, 117, 393, doi: 10.1051/aas:1996164
- Bezanson et al. (2022) Bezanson, R., Labbe, I., Whitaker, K. E., et al. 2022, arXiv e-prints, arXiv:2212.04026, doi: 10.48550/arXiv.2212.04026
- Blanton & Moustakas (2009) Blanton, M. R., & Moustakas, J. 2009, ARA&A, 47, 159, doi: 10.1146/annurev-astro-082708-101734
- Blanton et al. (2003) Blanton, M. R., Hogg, D. W., Bahcall, N. A., et al. 2003, ApJ, 594, 186, doi: 10.1086/375528
- Bluck et al. (2020) Bluck, A. F. L., Maiolino, R., Sánchez, S. F., et al. 2020, MNRAS, 492, 96, doi: 10.1093/mnras/stz3264
- Brammer (2019) Brammer, G. 2019, Grizli: Grism redshift and line analysis software, Astrophysics Source Code Library, record ascl:1905.001. http://ascl.net/1905.001
- Brammer et al. (2012) Brammer, G. B., Sánchez-Janssen, R., Labbé, I., et al. 2012, ApJ, 758, L17, doi: 10.1088/2041-8205/758/1/L17
- Brinchmann et al. (2004) Brinchmann, J., Charlot, S., White, S. D. M., et al. 2004, MNRAS, 351, 1151, doi: 10.1111/j.1365-2966.2004.07881.x
- Casey et al. (2022) Casey, C. M., Kartaltepe, J. S., Drakos, N. E., et al. 2022, arXiv e-prints, arXiv:2211.07865, doi: 10.48550/arXiv.2211.07865
- Chen et al. (2020) Chen, Z., Faber, S. M., Koo, D. C., et al. 2020, ApJ, 897, 102, doi: 10.3847/1538-4357/ab9633
- Conselice (2014) Conselice, C. J. 2014, ARA&A, 52, 291, doi: 10.1146/annurev-astro-081913-040037
- da Cunha et al. (2008) da Cunha, E., Charlot, S., & Elbaz, D. 2008, MNRAS, 388, 1595, doi: 10.1111/j.1365-2966.2008.13535.x
- Davis et al. (2007) Davis, M., Guhathakurta, P., Konidaris, N. P., et al. 2007, ApJ, 660, L1, doi: 10.1086/517931
- de Jong (1996a) de Jong, R. S. 1996a, A&A, 313, 45, doi: 10.48550/arXiv.astro-ph/9601005
- de Jong (1996b) —. 1996b, A&A, 313, 377, doi: 10.48550/arXiv.astro-ph/9604010
- Dimauro et al. (2022) Dimauro, P., Daddi, E., Shankar, F., et al. 2022, MNRAS, 513, 256, doi: 10.1093/mnras/stac884
- Driver et al. (2009) Driver, S. P., Norberg, P., Baldry, I. K., et al. 2009, Astronomy and Geophysics, 50, 5.12, doi: 10.1111/j.1468-4004.2009.50512.x
- Fang et al. (2013) Fang, J. J., Faber, S. M., Koo, D. C., & Dekel, A. 2013, ApJ, 776, 63, doi: 10.1088/0004-637X/776/1/63
- Finkelstein et al. (2017) Finkelstein, S. L., Dickinson, M., Ferguson, H. C., et al. 2017, The Cosmic Evolution Early Release Science (CEERS) Survey, JWST Proposal ID 1345. Cycle 0 Early Release Science
- Finkelstein et al. (2023) Finkelstein, S. L., Bagley, M. B., Ferguson, H. C., et al. 2023, ApJ, 946, L13, doi: 10.3847/2041-8213/acade4
- Franx et al. (2008) Franx, M., van Dokkum, P. G., Schreiber, N. M. F., et al. 2008, ApJ, 688, 770, doi: 10.1086/592431
- Gillman et al. (2023) Gillman, S., Gullberg, B., Brammer, G., et al. 2023, arXiv e-prints, arXiv:2303.17246, doi: 10.48550/arXiv.2303.17246
- Graham & Worley (2008) Graham, A. W., & Worley, C. C. 2008, MNRAS, 388, 1708, doi: 10.1111/j.1365-2966.2008.13506.x
- Grogin et al. (2011) Grogin, N. A., Kocevski, D. D., Faber, S. M., et al. 2011, ApJS, 197, 35, doi: 10.1088/0067-0049/197/2/35
- Guo et al. (2015) Guo, Y., Ferguson, H. C., Bell, E. F., et al. 2015, ApJ, 800, 39, doi: 10.1088/0004-637X/800/1/39
- Häußler et al. (2013) Häußler, B., Bamford, S. P., Vika, M., et al. 2013, MNRAS, 430, 330, doi: 10.1093/mnras/sts633
- Johnson & Leja (2017) Johnson, B., & Leja, J. 2017, Bd-J/Prospector: Initial Release, v0.1, Zenodo, Zenodo, doi: 10.5281/zenodo.1116491
- Johnson et al. (2021) Johnson, B. D., Leja, J., Conroy, C., & Speagle, J. S. 2021, ApJS, 254, 22, doi: 10.3847/1538-4365/abef67
- Kartaltepe et al. (2022) Kartaltepe, J. S., Rose, C., Vanderhoof, B. N., et al. 2022, arXiv e-prints, arXiv:2210.14713, doi: 10.48550/arXiv.2210.14713
- Kauffmann et al. (2003) Kauffmann, G., Heckman, T. M., White, S. D. M., et al. 2003, MNRAS, 341, 33, doi: 10.1046/j.1365-8711.2003.06291.x
- Kelvin et al. (2012) Kelvin, L. S., Driver, S. P., Robotham, A. S. G., et al. 2012, MNRAS, 421, 1007, doi: 10.1111/j.1365-2966.2012.20355.x
- Kennedy et al. (2015) Kennedy, R., Bamford, S. P., Baldry, I., et al. 2015, MNRAS, 454, 806, doi: 10.1093/mnras/stv2032
- Koekemoer et al. (2011) Koekemoer, A. M., Faber, S. M., Ferguson, H. C., et al. 2011, ApJS, 197, 36, doi: 10.1088/0067-0049/197/2/36
- Lang et al. (2014) Lang, P., Wuyts, S., Somerville, R. S., et al. 2014, ApJ, 788, 11, doi: 10.1088/0004-637X/788/1/11
- Lawrence et al. (2007) Lawrence, A., Warren, S. J., Almaini, O., et al. 2007, MNRAS, 379, 1599, doi: 10.1111/j.1365-2966.2007.12040.x
- Lawrence et al. (2012) —. 2012, VizieR Online Data Catalog, II/314
- Leja et al. (2020) Leja, J., Speagle, J. S., Johnson, B. D., et al. 2020, ApJ, 893, 111, doi: 10.3847/1538-4357/ab7e27
- Leja et al. (2022) Leja, J., Speagle, J. S., Ting, Y.-S., et al. 2022, ApJ, 936, 165, doi: 10.3847/1538-4357/ac887d
- Lilly & Carollo (2016) Lilly, S. J., & Carollo, C. M. 2016, ApJ, 833, 1, doi: 10.3847/0004-637X/833/1/1
- Miller et al. (2023) Miller, T. B., van Dokkum, P., & Mowla, L. 2023, ApJ, 945, 155, doi: 10.3847/1538-4357/acbc74
- Miller et al. (2022) Miller, T. B., Whitaker, K. E., Nelson, E. J., et al. 2022, ApJ, 941, L37, doi: 10.3847/2041-8213/aca675
- Mosleh et al. (2017) Mosleh, M., Tacchella, S., Renzini, A., et al. 2017, ApJ, 837, 2, doi: 10.3847/1538-4357/aa5f14
- Naidu et al. (2022) Naidu, R. P., Oesch, P. A., van Dokkum, P., et al. 2022, ApJ, 940, L14, doi: 10.3847/2041-8213/ac9b22
- Nardiello et al. (2022) Nardiello, D., Bedin, L. R., Burgasser, A., et al. 2022, MNRAS, 517, 484, doi: 10.1093/mnras/stac2659
- Nedkova et al. (2021) Nedkova, K. V., Häußler, B., Marchesini, D., et al. 2021, MNRAS, 506, 928, doi: 10.1093/mnras/stab1744
- Nelson et al. (2016) Nelson, E. J., van Dokkum, P. G., Momcheva, I. G., et al. 2016, ApJ, 817, L9, doi: 10.3847/2041-8205/817/1/L9
- Nersesian et al. (2023) Nersesian, A., Zibetti, S., D’Eugenio, F., & Baes, M. 2023, arXiv e-prints, arXiv:2303.01907, doi: 10.48550/arXiv.2303.01907
- Ng & Maechler (2007) Ng, P., & Maechler, M. 2007, Statistical Modelling, 7, 315, doi: 10.1177/1471082X0700700403
- Ng & Maechler (2022) —. 2022, COBS – Constrained B-splines (Sparse matrix based). https://CRAN.R-project.org/package=cobs
- Pastrav et al. (2013) Pastrav, B. A., Popescu, C. C., Tuffs, R. J., & Sansom, A. E. 2013, A&A, 553, A80, doi: 10.1051/0004-6361/201220962
- Peng et al. (2002) Peng, C. Y., Ho, L. C., Impey, C. D., & Rix, H.-W. 2002, AJ, 124, 266, doi: 10.1086/340952
- Peng et al. (2010) Peng, Y.-j., Lilly, S. J., Kovač, K., et al. 2010, ApJ, 721, 193, doi: 10.1088/0004-637X/721/1/193
- Popescu et al. (2000) Popescu, C. C., Misiriotis, A., Kylafis, N. D., Tuffs, R. J., & Fischera, J. 2000, A&A, 362, 138, doi: 10.48550/arXiv.astro-ph/0008098
- Reddy et al. (2012) Reddy, N. A., Pettini, M., Steidel, C. C., et al. 2012, ApJ, 754, 25, doi: 10.1088/0004-637X/754/1/25
- Rieke et al. (2005) Rieke, M. J., Kelly, D., & Horner, S. 2005, in Society of Photo-Optical Instrumentation Engineers (SPIE) Conference Series, Vol. 5904, Cryogenic Optical Systems and Instruments XI, ed. J. B. Heaney & L. G. Burriesci, 1–8, doi: 10.1117/12.615554
- Sánchez-Blázquez et al. (2007) Sánchez-Blázquez, P., Forbes, D. A., Strader, J., Brodie, J., & Proctor, R. 2007, MNRAS, 377, 759, doi: 10.1111/j.1365-2966.2007.11647.x
- Sanders et al. (2021) Sanders, R. L., Shapley, A. E., Jones, T., et al. 2021, ApJ, 914, 19, doi: 10.3847/1538-4357/abf4c1
- Shen et al. (2023) Shen, L., Papovich, C., Yang, G., et al. 2023, arXiv e-prints, arXiv:2301.05727, doi: 10.48550/arXiv.2301.05727
- Shibuya et al. (2015) Shibuya, T., Ouchi, M., & Harikane, Y. 2015, ApJS, 219, 15, doi: 10.1088/0067-0049/219/2/15
- Skelton et al. (2014) Skelton, R. E., Whitaker, K. E., Momcheva, I. G., et al. 2014, ApJS, 214, 24, doi: 10.1088/0067-0049/214/2/24
- Suess et al. (2017) Suess, K. A., Bezanson, R., Spilker, J. S., et al. 2017, ApJ, 846, L14, doi: 10.3847/2041-8213/aa85dc
- Suess et al. (2019) Suess, K. A., Kriek, M., Price, S. H., & Barro, G. 2019, ApJ, 885, L22, doi: 10.3847/2041-8213/ab4db3
- Suess et al. (2022) Suess, K. A., Bezanson, R., Nelson, E. J., et al. 2022, ApJ, 937, L33, doi: 10.3847/2041-8213/ac8e06
- Szomoru et al. (2013) Szomoru, D., Franx, M., van Dokkum, P. G., et al. 2013, ApJ, 763, 73, doi: 10.1088/0004-637X/763/2/73
- Tacchella et al. (2016) Tacchella, S., Dekel, A., Carollo, C. M., et al. 2016, MNRAS, 458, 242, doi: 10.1093/mnras/stw303
- Tacchella et al. (2022) Tacchella, S., Conroy, C., Faber, S. M., et al. 2022, ApJ, 926, 134, doi: 10.3847/1538-4357/ac449b
- Tal et al. (2014) Tal, T., Dekel, A., Oesch, P., et al. 2014, ApJ, 789, 164, doi: 10.1088/0004-637X/789/2/164
- van der Wel et al. (2009) van der Wel, A., Bell, E. F., van den Bosch, F. C., Gallazzi, A., & Rix, H.-W. 2009, ApJ, 698, 1232, doi: 10.1088/0004-637X/698/2/1232
- van der Wel et al. (2012) van der Wel, A., Bell, E. F., Häussler, B., et al. 2012, ApJS, 203, 24, doi: 10.1088/0067-0049/203/2/24
- van der Wel et al. (2014a) van der Wel, A., Franx, M., van Dokkum, P. G., et al. 2014a, ApJ, 788, 28, doi: 10.1088/0004-637X/788/1/28
- van der Wel et al. (2014b) van der Wel, A., Chang, Y.-Y., Bell, E. F., et al. 2014b, ApJ, 792, L6, doi: 10.1088/2041-8205/792/1/L6
- van Dokkum et al. (2015) van Dokkum, P. G., Nelson, E. J., Franx, M., et al. 2015, ApJ, 813, 23, doi: 10.1088/0004-637X/813/1/23
- Vika et al. (2013) Vika, M., Bamford, S. P., Häußler, B., et al. 2013, MNRAS, 435, 623, doi: 10.1093/mnras/stt1320
- Vulcani et al. (2014) Vulcani, B., Bundy, K., Lackner, C., et al. 2014, ApJ, 797, 62, doi: 10.1088/0004-637X/797/1/62
- Weaver et al. (2023) Weaver, J. R., Cutler, S. E., Pan, R., et al. 2023, arXiv e-prints, arXiv:2301.02671, doi: 10.48550/arXiv.2301.02671
- Whitaker et al. (2014) Whitaker, K. E., Franx, M., Leja, J., et al. 2014, ApJ, 795, 104, doi: 10.1088/0004-637X/795/2/104
- Whitaker et al. (2017) Whitaker, K. E., Bezanson, R., van Dokkum, P. G., et al. 2017, ApJ, 838, 19, doi: 10.3847/1538-4357/aa6258
- Whitney et al. (2021) Whitney, A., Ferreira, L., Conselice, C. J., & Duncan, K. 2021, ApJ, 919, 139, doi: 10.3847/1538-4357/ac1422
- Williams et al. (2018) Williams, C. C., Curtis-Lake, E., Hainline, K. N., et al. 2018, ApJS, 236, 33, doi: 10.3847/1538-4365/aabcbb
- Wuyts et al. (2011) Wuyts, S., Förster Schreiber, N. M., van der Wel, A., et al. 2011, ApJ, 742, 96, doi: 10.1088/0004-637X/742/2/96
- Wuyts et al. (2012) Wuyts, S., Förster Schreiber, N. M., Genzel, R., et al. 2012, ApJ, 753, 114, doi: 10.1088/0004-637X/753/2/114
- Zhuang & Shen (2023) Zhuang, M.-Y., & Shen, Y. 2023, arXiv e-prints, arXiv:2304.13776, doi: 10.48550/arXiv.2304.13776
- Zibetti et al. (2020) Zibetti, S., Gallazzi, A. R., Hirschmann, M., et al. 2020, MNRAS, 491, 3562, doi: 10.1093/mnras/stz3205
Appendix A Sample Selection and Characteristics
Figure 7 shows the sample distribution and selection of galaxies used in this work. In the left panel we show the SNR in the HST/WFC3 filter F160W (empty circles) and JWST/NIRCam filter F150W (filled circles) as a function of redshift. The dashed horizontal line shows the SNR=50 limit suggested by van der Wel et al. (2012) to accurately measure Sérsic indices. The central panel of Figure 7 shows the mass distribution of our galaxies across redshift. The right panel of the figure shows the sSFR against the redshift distribution of our galaxies. In the last two panels star-forming galaxies are color-coded in blue while quiescent are red. The distinction between star-forming and quiescent is done as outlined in section 3.1. We used circles for galaxies included in the sample and stars for galaxies that are rejected as outlined in section 2 and 2.2. Black squares represent galaxies that despite having a SNR in F150W are not removed from the sample.