∎
Tel.: +41-79-6264261
22email: saulo.dasilvamendes@unige.ch, saulomendesp@gmail.com
Global assessment of university research comprehensiveness
Abstract
The demand for global university league tables has been high over the past two decades. However, significant criticism of their methodologies is accumulating without being addressed. One important bias regards the unequal distribution of research output and impact across different subjects, which in turn favors institutions that have its strongest performance in medical and physical sciences. I revisit global university league tables by normalizing each field as to create a uniform distribution of value.Then, the overall performance of an institution is interpreted as the probability of having a high score in any given academic field. I focus on the similarity of institutions across ten criteria related to academic performance in eighty subjects of all fields of knowledge. The latter does not induce a zero-sum game, removing one of the most prominent negative features of established league tables. The present assessment shows that the main difference between hundreds of leading global research universities is whether their coverage of all areas of human knowledge is comprehensive or specialized, as their mean performance per subject is nearly indistinguishable. I compare the results with the main league tables and found excellent agreement, suggesting that regardless of their methodologies, research-intensive institutions perform well in rankings if they are comprehensive. This comprehensiveness is ultimately dependent on institutional age, privileged funding allocation and regional academic culture. Consequently, when the size of an institution is taken out of the picture, I found no correlation between comprehensiveness and quality, and no difference can be found in the mean quality of institutions regionally or globally. Furthermore, I find the reputation and prestige of several famous institutions to far exceed their performance within the present methodology, while numerous institutions with less reputation and visibility perform better than expected.
Keywords:
University Ranking Comprehensiveness Specialization Research1 Introduction
The modern university arose from the competition between the Jesuit, Oxbridge111Term that regards collegiate universities that follow the management style for teaching and research as the universities of Oxford and Cambridge (Tapper and Palfreyman, 2002). and German university frameworks (Clark, 2008; Menand et al., 2017), which significantly differed from each other. While the Oxbridge model had no faculties and mostly focused on teaching for future fellows and administered by the head of the colleges, the German model focused on faculties of different academic subjects, had no colleges and was primarily focused on research (Kerr, 2001; Clark, 2008). Confronted by the far more impactful German university model, even the famous Oxbridge and Paris academies adopted such system (Clark, 2008). During the second-half of the nineteenth century, the American model combined the Oxbridge and German systems to create the ”comprehensive” university (Kerr, 2001; Zemliakova, 2018). Unlike the classical European universities, the American comprehensive university did not reject technical subjects such as engineering, agriculture or commerce from its core curriculum. Furthermore, they combined the two systems in different ways: undergraduate studies at American universities followed the Oxbridge system while graduate studies followed the German research university model (Veysey, 1965; Crow and Dabars, 2015). It was therefore the American university that first combined nearly all subjects of human knowledge into a single campus, initially embodied in the prominent examples of Harvard, Johns Hopkins and Cornell universities (Crow and Dabars, 2015). Since then, these institutions outperformed smaller counterparts in drawing visibility due to hallmark discoveries in science, engineering, medicine or economics, so that it has become natural to deem the best universities those with strong research output and impact. The association between university performance and research impact is very rooted, to such an extent that global rankings are built to measure institutions against this model (Marginson and van der Wende, 2007). Indeed, even teaching in graduate and undergraduate classrooms is ultimately related to an institution of research in the form of the ”delivery of research-led teaching” (Taylor, 2006). Therefore, it is only logical to measure university performance by research metrics due to its public availability and transparency. In fact, a comparative analysis among established university league tables show that although criteria vary significantly, research metrics appear in all of them and have the most prominent role among all indicators (Buela-Casal et al., 2007). This core research criteria make different league tables and methodologies thereof provide similar results (Aguillo et al., 2010).
The evaluation of performance and prestige of universities can be traced back to the 1798 Der Universitäts-Bereiser report to King Wilhelm II of Prussia (Gedike, 2018), regarded as one of the first forms of regional university ranking (Menand et al., 2017). In the twentieth century, international institutional ranking did not exist in the present form, but the prestige of institutions were largely determined by awards, most promintently the Nobel prize (Zuckerman, 1967; Inhaber and Przednowek, 1976; Zuckerman, 1977, 1978). On the other hand, the lack of a central education regulator led American institutions to compete among themselves for human and financial resources (Hagstrom, 1971), ultimately leading to a growing need for national rankings for both undergraduate and graduate studies, especially in the the post-war era (Babcock, 1911; Cartter, 1966; Webster, 1981, 1986; Wilbers and Brankovic, 2021). However, due to the exponential growth of universities222Buringh and van Zanden (2009) estimates the existence of a dozen universities in medieval Europe. By the time of the industrial revolution it did not exceed a hundred universities, arguably a small number of institutions across many nations to prompt a need for rankings. In comparison, current worldwide estimates are placed around 30,000 universities (Adina-Petruta, 2015)., fast globalization of higher education and demand for evaluation of cross-national tertiary educational systems (Larsen et al., 2002; Merisotis, 2002; Schofer and Meyer, 2005; Adina-Petruta, 2015), the modern concept of global university ranking arose in 2003 with the Shanghai (2022) Ranking in an attempt by China to compare its institutions to the leading American and European counterparts. Especially because of the effect of university research on economic growth (Anselin et al., 1997; Mokyr, 2011; Cantoni and Yuchtman, 2014; Valero and Van Reenen, 2019; Agasisti and Bertoletti, 2020), league tables have found a significant impact in geopolitics and policymaking (Hazelkorn, 2008), and the competition it stems plays a major role in further enhancing the discourse on excellence of human development of nation states (Brankovic et al., 2018). Furthermore, rankings can influence the reshaping of national educational systems (Marginson and van der Wende, 2007; Hazelkorn, 2015). Most prominently, the European tradition of favoring small specialized institutions have been recently challenged in view of the comprehensive university model, so that mergers of leading European instititutions have been carried out (Docampo et al., 2015; Ripoll-Soler and de Miguel-Molina, 2019). In addition, university rankings are also revelant for the decision-making of students regarding the evaluation of the cost-benefit of choosing a particular institution (Ehrenberg, 2000). Therefore, assessments on university performance is undisputably essential for many economic and social spheres, both at the national and international level.
Despite the relevance of university performance assessments, significant issues in the methodology of established league tables as well as the benchmarking of institutional quality has surfaced (Bowden, 2000; Clarke, 2002; Dill and Soo, 2005; Fauzi et al., 2020). For instance, Ehrenberg (2003) discussed the methodology of American college rankings, finding its main criteria to be based on reputation, selectivity of the institutions, retention and graduation rates, and even alumni donations. Although this rank still exists nationally, it is not surprising these factors are considered to be of the least importance when ranking global universities. Although research-based rankings are more suitable than survey-oriented ones for creating a global league table (Taylor and Braddock, 2007), global league tables relying on research-based metrics as provided by the Shanghai Ranking also contain issues and biases. For instance, although recent versions of the Shanghai Ranking have added awards and prizes in several other fields, their subject rankings do not include many social sciences as well as art and humanities subjects.
Building on the early criticisms of the Shanghai Ranking, alternative league tables with new methodologies sprung in the same decade. Mostly as a mix of national rankings in the USA and research-led global ranking, Quarelis Simons (QS) and Times Higher Education Ranking (THE)333Available at https://www.topuniversities.com ; https://www.timeshighereducation.com also relied on highly subjective parameters obtained from academic surveys, undergraduate employability, ratio of international students as well as class size. A major issue with employability indicators is that they are only applicable on a national or regional scale. Employers from South Africa can not compare its national institutions to those in New Zealand and so forth, as they do not compete together. Therefore, in an international ranking, employability will further skew scores to institutions that have a disproportionately favourable view from national employers as opposed to universities within countries where employability evaluation is uniform among the best institutions. In addition, employability favours schools who either specialize or score very high in engineering and decision sciences, such as law, economics or finance. Furthermore, it is well-known that non-academic employability of pure and theoretical physical sciences, humanities, social sciences are very low (Garrouste and Rodrigues, 2014). As already argued in Ehrenberg (2003) and Clarke (2002), these indicators are very problematic, as they are either measuring performance of previous decades or rooted in privilege and reputation that may not actually reflect the current state of an institution. Naturally, these survey-based indicators have found to lead to data fabrication, markedly exhibited in the recent scandals involving Temple Business School444 See ”Former Temple Business-School Dean Gets Prison Term in Rankings Scandal” at Wall Street Journal. and Columbia University555 See the article ”Columbia is the latest university caught in a rankings scandal” at The Economist ., in addition to being found to have significant conflicts of interest (Chirikov, 2021).
Yet a third group of global university rankings arose:666Among those not listed, webometrics is one the earliest. However, it is mostly based on internet transparency, not research or similar metrics. The league tables are found at NTU Ranking, US News & Report Global University Rankings, Leiden Ranking, SCImago Ranking. the purely bibliometric rankings such as the NTU Ranking, Leiden Ranking, US News & Report Global University Rankings among others. The main feature of these rankings is the abhorrence towards surveys and reputation of non-research metrics, and almost all indicators are related to bibliometrics. Indeed, Chen and Liao (2012) showed that Shanghai Ranking correlated well with bibliometric-based rankings, and survey-based ones showed the least overlap. Not only the overlap is less significant when comparing research-based with survey and reputation-based rankings, the latter tend to be prone to lack of transparency, gaming of data or total fabrication that can not be assessed by independent examiners. On the other hand, research-based metrics tend to be transparent and reproducible (Docampo, 2013). Nevertheless, pure research basis have also shown some setbacks: it is well-known that established university league tables favors universities who have a very high research output in natural and medical sciences, as these fields claim the journals with highest impact factor and highest number of published articles. Indeed, a Matthew effect (Biglu, 2008) was found on the distribution of research output across different fields, with fields of highest impact claiming the highest growth in impact factor (Althouse et al., 2009). Hence, there is little hope that social sciences, humanities and engineering will ever reach the sheer number of citations and published articles of natural and medical sciences (Hamilton, 1991). In fact, institutions can have their rank uplifted if specific scientific fields have a higher weight measure in the computation of the ranking, either by active methodological choice or by unconscious bias towards fields that provide higher metrics. In this context, institutions whose strongest departments are in the social sciences and humanities are severely underestimated. Conversely, having strong medical and science departments is enough to maintain or attract prestige. Therefore, a fair measurement of university rankings require a proper subject normalization.
| Institution | QS Rank 2020 | #Top50 QS | CWUR 2017 | #Top10 CWUR | QS+CWUR | Country |
|---|---|---|---|---|---|---|
| Harvard | 3 | 35 | 1 | 112 | 147 | United States |
| UC Berkeley | 28 | 38 | 7 | 50 | 88 | United States |
| Stanford | 2 | 38 | 2 | 48 | 86 | United States |
| MIT | 1 | 29 | 3 | 41 | 70 | United States |
| Princeton | 13 | 26 | 9 | 9 | 35 | United States |
| Caltech | 5 | 12 | 11 | 8 | 20 | United States |
| Oxford | 4 | 38 | 5 | 47 | 85 | United Kingdom |
| Cambridge | 7 | 39 | 4 | 38 | 87 | United Kingdom |
| UCL | 8 | 33 | 31 | 37 | 70 | United Kingdom |
| Sorbonne | 77 | 9 | 56 | 17 | 26 | France |
| École Poly. | 60 | 3 | 35 | 0 | 3 | France |
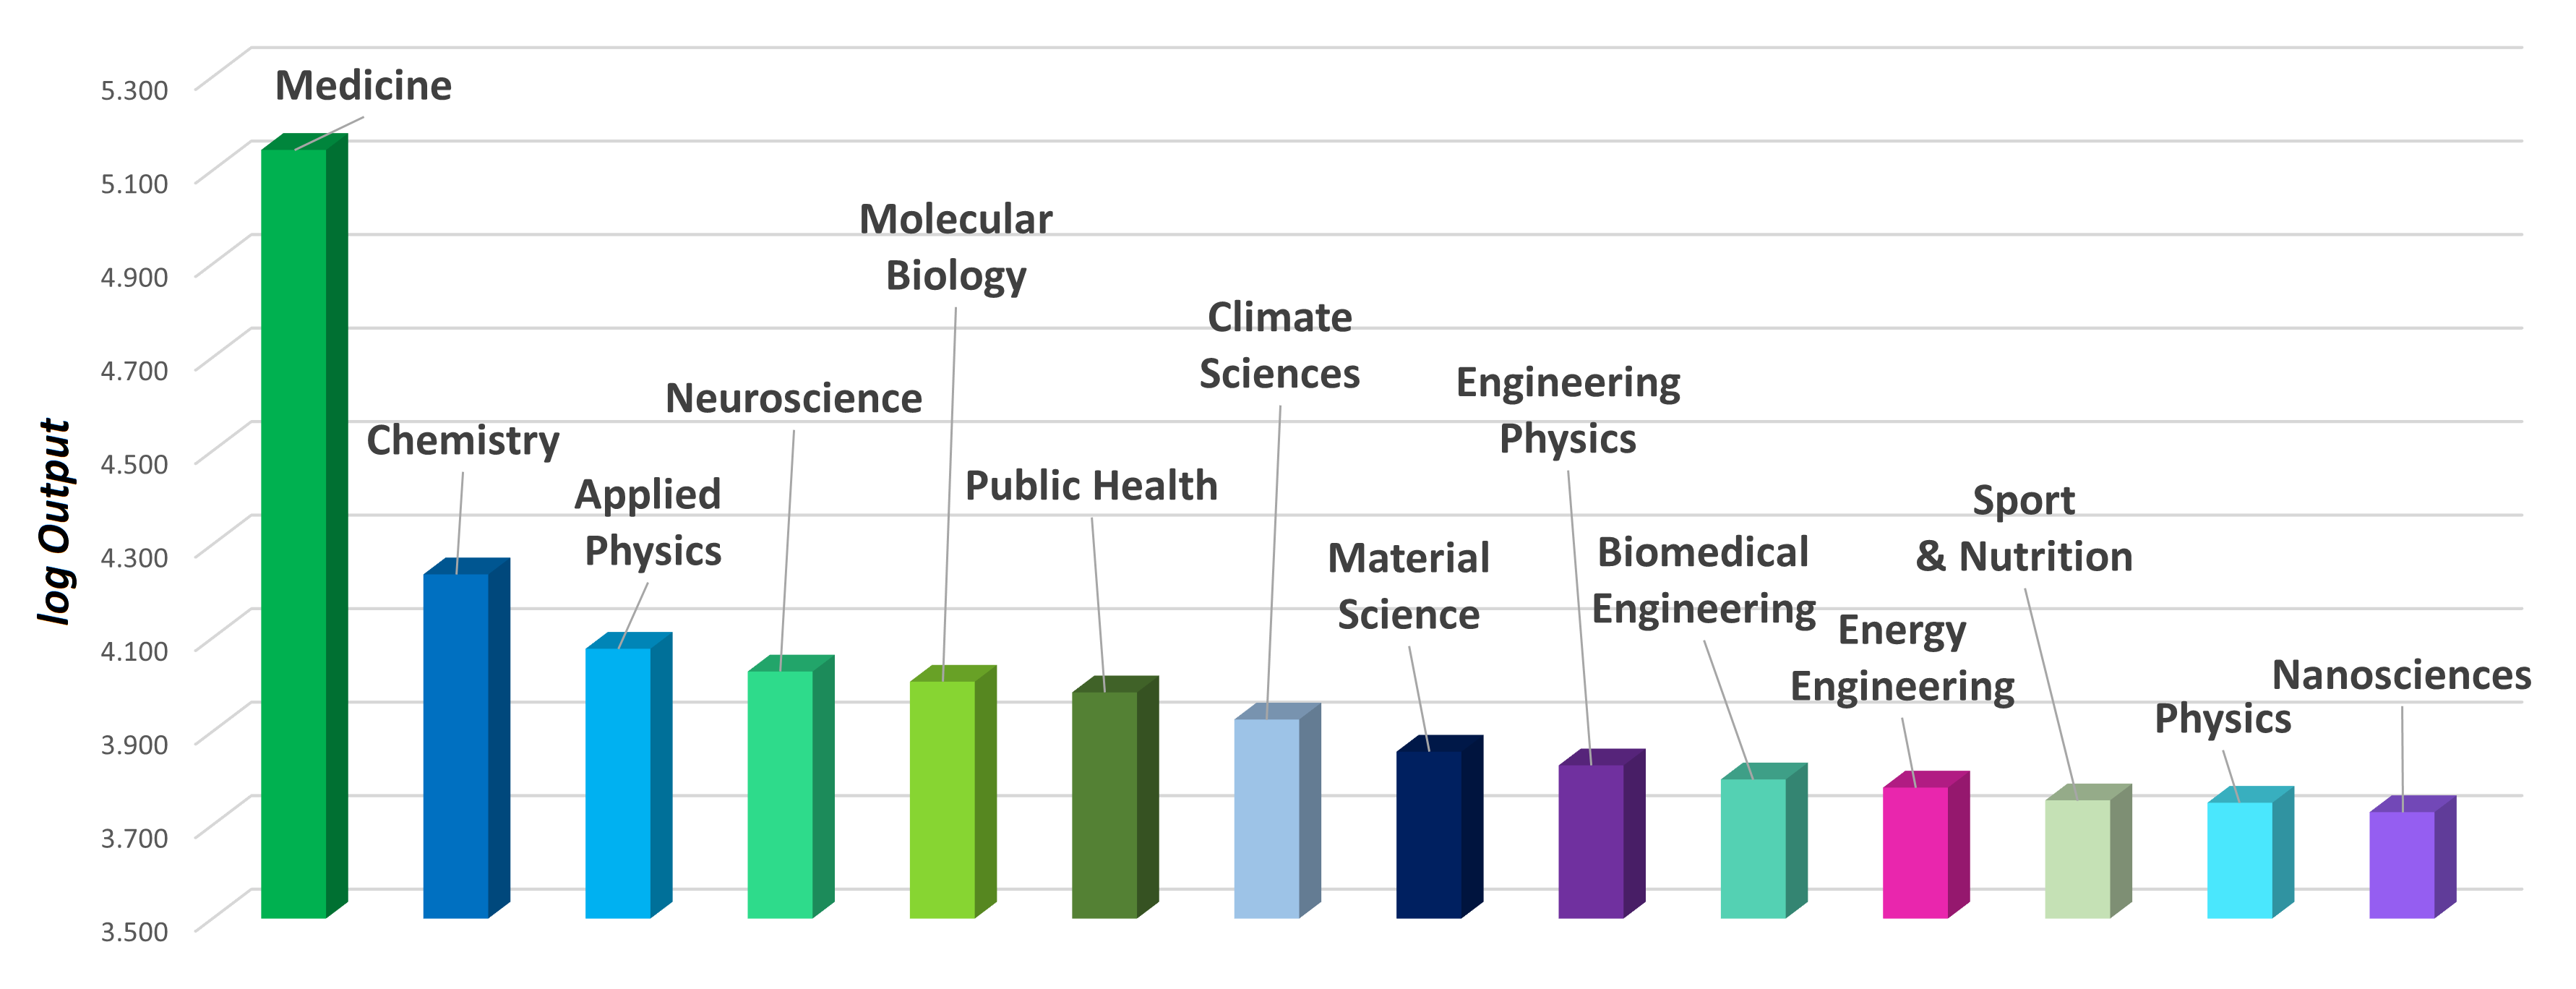
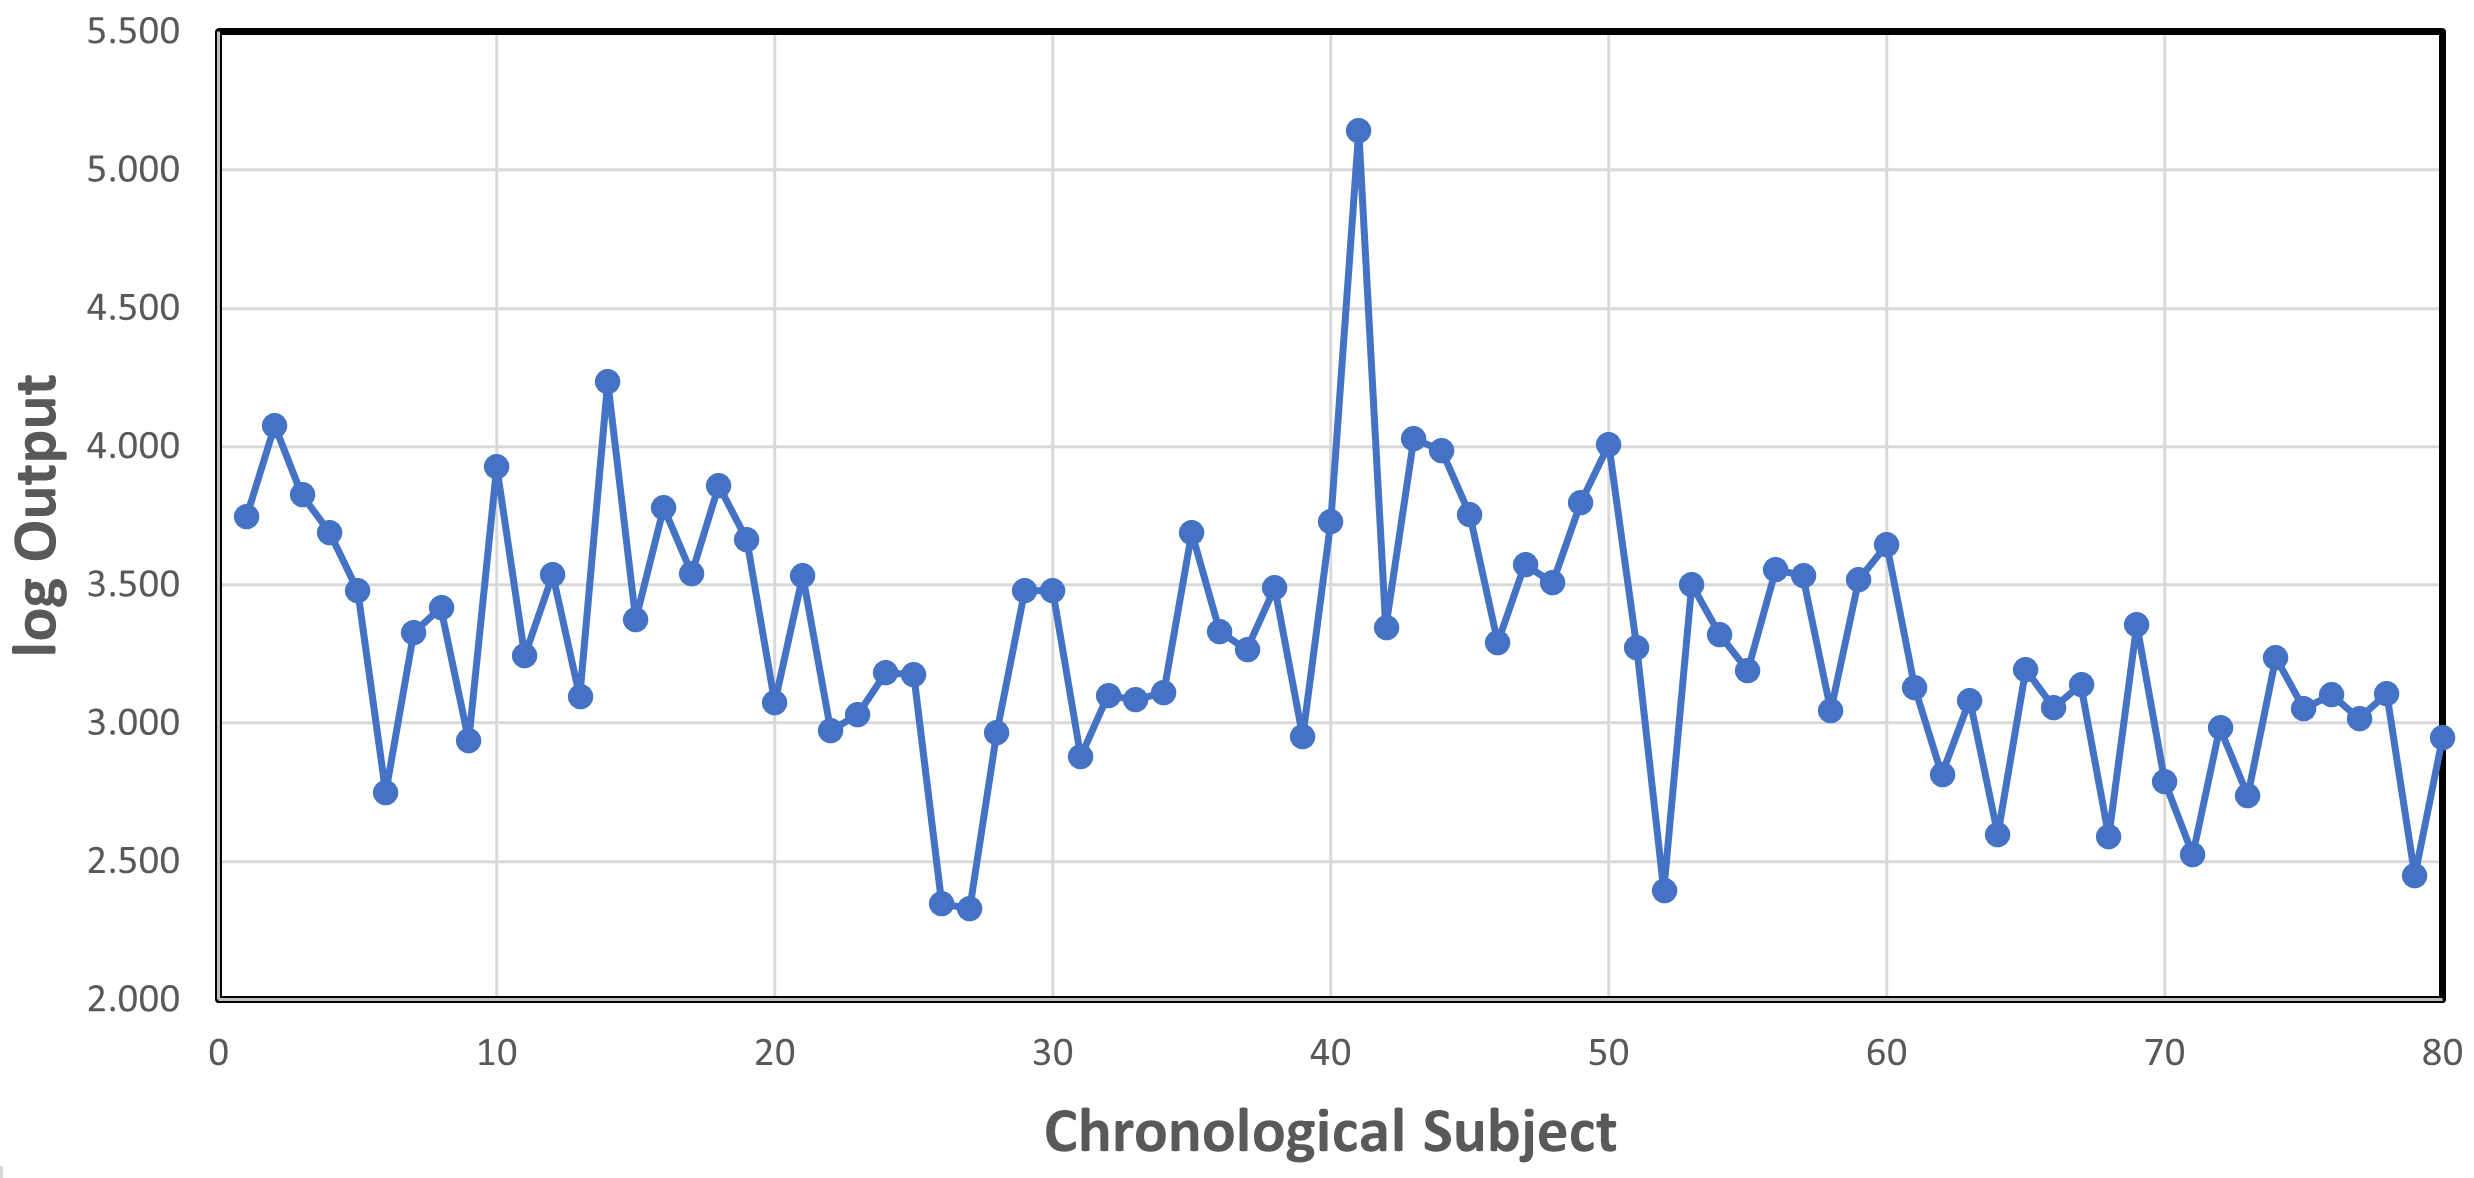
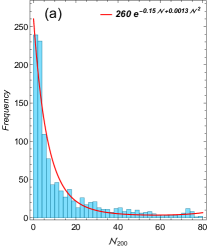
Despite the long list of issues present in most league tables, a concrete comparison between a large number of universities can be made based on research impact and comprehensiveness. However, as shown in Figure 1, some subjects have a much higher research output (articles, reviews, etc.) than others. Moreover, they also vary wildly in citation metrics and journal impact factor (Althouse et al., 2009). Overall, bibliometric practices strongly vary among different subjects (Moed et al., 1985) and makes any global evaluation based on weighted metrics biased and unrealistic. Albeit articles have steadily increased their number of references over the last decades, their growth in STEM fields is bigger than in social sciences and humanities (Biglu, 2008; Dai et al., 2021) and the variability across fields further widens the unevenness of their bibliometrics (Seglen, 1992). Hence, league tables based on total weighted research are inevitably favorable to the leading institutions in medical, chemical and physical sciences.
Table 1 displays a much less discussed feature of university league tables: the non-extensive character that creates an enormous disparity between excellence in academic subjects and the overall excellence. Although UC Berkeley is clearly a peer of Harvard, Stanford and MIT by the measure of the number of subjects they excel in, the QS overall ranking seems to contradict its own subject evaluation and puts UC Berkeley far below its peers in the overall analysis. Furthermore, the Sorbonne Université seems to be at the same overall rank as the École Polytechnique even though the former excels in dozens of subjects and the latter in only a few. Strikingly, the two overall rankings suggest that Caltech is far ahead of Sorbonne, while the latter actually has similar subject performance of Caltech. One can not help but perceive this phenomenon as paradoxical to the claim of academic excellence. Other league tables such as the Shanghai Ranking feature the same problem. The methodology of established rankings create this paradox by selecting intensive criteria that favours a few subjects, either present in bibliometric or reputation criteria. To remove this conflicting issue, in this work I analyze the comprehensiveness and evaluate the overall research impact of an institution as extensive (henceforth in the paper I take it to mean an additive property), i.e. the ideal (or maximal) research-intensive university is axiomatically the one which excels in all subjects.
In addressing all these points, the present study focuses and creates a method to rank global institutions limited to research-based indicators extracted from publicly available data of web of Science. In the spirit of Kosztyan et al. (2019), I replace unidimensional rankings by well-posed bideminesional ones: a collection of ranked leagues within the otherwise full unidimensional ranking. However, the present model define these groups by the similarity of these institutions across twelve indicators derived from each of the eighty subjects. In doing so, I address the well-known pathology of zero-sum games (Lee et al., 2020) and avoid the practice of gaming or tweaking of indicators. This new method of normalized and extensive analysis where the total score is a reflection of how many subjects an institution excels, shows that institutions are overvalued due to either their financial privileges, reputation, prestigious awards or disproportionate high performance in subjects with the highest bibliometric impact. Remarkably, the mean ranking among five leading league tables is shown to agree well with the present model, which confirms the tangible existence of the stratification of academic excellence.
2 Extensive World Rankings: Subject Comprehensiveness
| 1 Physics | 2 Applied Physics | 3 Eng. physics | 4 Astronomy | 5 Mathematics |
|---|---|---|---|---|
| 6 Statistics | 7 Geophysics | 8 Meteorology | 9 Phys. Oceanography | 10 Climate Science |
| 11 Geology | 12 Geochemistry | 13 Chem. Oceanography | 14 Chemistry | 15 Chemical Eng. |
| 16 Energy Eng. | 17 Petroleum Eng. | 18 Material Science | 19 Metallurgical Eng. | 20 Mineral Eng. |
| 21 Civil Eng. | 22 Geological Eng. | 23 Transport Eng. | 24 Environmental Eng. | 25 Hydraulic Eng. |
| 26 Coastal Eng. | 27 Architecture | 28 Urban Planning | 29 Geodesy | 30 Mechanical Eng. |
| 31 Naval Eng. | 32 Aerospace Eng. | 33 Industrial Eng. | 34 Acoustic Eng. | 35 Electrical Eng. |
| 36 Computer Sci. | 37 Computer Eng. | 38 Telecom. Eng. | 39 Mechatronical Eng. | 40 Nanoscience |
| 41 Medicine | 42 Nursing | 43 Neurosci. & Psych. | 44 Public Health | 45 Sport & Nutrition |
| 46 Phys. Therapy | 47 Dentistry | 48 Pharmacy | 49 Biomedical Eng. | 50 Molecular Biology |
| 51 Biochemistry | 52 Biophysics | 53 Biology | 54 Ecology | 55 Biol. Geosciences |
| 56 Agriculture | 57 Food Eng. | 58 Biotechnology | 59 Vet. Medicine | 60 Plant Science |
| 61 Economics | 62 Finance | 63 Business | 64 Public Policy | 65 Law |
| 66 Politics | 67 Sociology | 68 Anthropology | 69 Education | 70 Journalism |
| 71 Media studies | 72 Management | 73 Archaeology | 74 History | 75 Geography |
| 76 Philosophy | 77 Theology | 78 Languages | 79 Music | 80 Arts |
In view of the several caveats emerging in the process of classifying universities, I propose to ammend these issues by measuring the groupiness or similarity of institutions. I separate institutions by groups of similarity rather than a continuous ranking. Below I describe the step-by-step methodology:
• Delineate subareas for each of the eighty subjects according to web of Science classification over the period between 2011-2020. • Separate a measure of research impact applicable to each subject. The Leiden Rank parameter , henceforth denoted by and normalized to account for subject differences, measures the percentage of an institution output at the top 10% of the most cited papers and is the most suitable measure of research impact due to its weak dependence on time, as opposed to average citations (Sangwal, 2011; Finardi, 2014) or the Hirsch’s h-index777Note that the time-dependence of the h-index was already discussed in Hirsch (2005), where the author proposed to normalize the h-index by one’s net academic age. (Egghe, 2007; Mannella and Rossi, 2013). The fractional counting is applied to remove the effect of large collaborations in medical and physical sciences. This parameter superseeds average citations as it weakens the citation disparity among subjects. • For multi-campus universities I only measure the performance of the main campus. This is due the fact that leading US institutions have several campuses that are not computed altogether. For instance, were I to compute all campuses, the University of California output would far exceed the peers of its flagship campus (UC Berkeley) by an order of magnitude. Therefore, I define the parameter as the percentage of the research output carried out by the main campus of an institution, with in the vast majority of cases. • For each -th subject with , I compute the total research output between 2011-2020 as the sum of all citeable documents (articles, reviews, conference papers, etc.). I henceforth denote this number by . The arbitrary chronological -order is given in Table 2. Each subject can contain at most 200 ranked institutions, thus listing only the world 1% leading universities in a given subject. • For each -th subject I compute the maximum output and denote it with . • The -th subject has a score for the -th institution, and is computed with normalization : (1) • The major variable measures the total score of all covered subejcts (appearing among the top 200 institutions) by an institution removing the output bias of each subject: (2) • The major variable measures the total score of all covered subejcts by an institution regardless of its subject rank, though keeping the output bias of each subject: (3) The root of the output appears because the weighted sum of all subject outputs have only one normalization constant A and the exponential decay in output is much faster than for X. • The variable computes the arithmetic mean among all subjects, where measures the number of subjects in which a given institution appear among the top universities. This parameter is the closest measure of institutional research ”quality”. • The variable computes the weighted mean among all subjects regardless of its subject rank. • The variable adjusts the mean to the number of subjects they excel at, where is a normalization constant. It differentiates institutions posessing the same mean but that are indeed far apart in the measure of comprehensiveness. • The variable measures the degree of comprehensiveness concurrent with research impact of an institution. • The auxiliary variable measures the mean score per research faculty of an institution: (4) where is the total number of permanent faculty. Note that if the effective number of research-intensive faculty converges to . This asymptotic limit accounts for the known fact that teaching stream positions (i.e. not involved in research and restricted to teaching duties) in research-intensive institutions do not exceed 20% of the total full-time faculty count888Excluding medical schools, research-intensive institutions in the United States tend to restrict teaching-only faculty positions in the non-tenure track. Table 3.1 of Ehrenberg and Zhang (2005) shows that by 1999 about 15% of full-time faculty were of non-tenure track. However, this number has slowly increased in the years since (Curtis, 2014). As a remark, the research-oriented faculty does not consist of research-only duties. On the contrary, their teaching and administrative load is typically higher than of research (Schuster and Finkelstein, 2006).. In order to focus on research metrics while not upholding any bias towards socialized higher educational systems (which have an inflated number of teaching-only faculty), the above formula removes teaching stream instructors from the total number of full-time faculty. Group/Color 1 40,000 40,000 40,000 40,000 600 600 550 550 550 550 2 30,000 30,000 30,000 30,000 500 500 450 450 450 450 3 20,000 20,000 20,000 20,000 400 400 350 350 350 350 4 10,000 10,000 10,000 10,000 350 350 250 250 250 250 5 6,000 6,000 6,000 6,000 300 300 150 150 150 150 6 3,000 3,000 3,000 3,000 250 250 80 80 80 80 7 1,000 1,000 1,000 1,000 200 200 20 20 20 20 Table 3: Thresholds for the set of variables that defines mean groupiness and peer similarity. The remaining group 8 does not require a minimum threshold. Integer groups are assigned with a unique color to portray group stratification as in Figure 3. • The auxiliary variable transforms the size-dependent variables into size-independent ones through the change of variables . The square root and normalization appear to maintain the size-independent variables in the same range [0,1000]. Note that for an institution obtaining , currently not existing, would require a very large and therefore . • I combine five faculty size-independent variables and five faculty size-dependent variables to create the set defining groupiness (peer similarity). For each variable, I define a minimum threshold for an institution to belong to a group . Fractional groups exist as an ammend to institutions that do not obey the minimum criteria to belong to a group but that are not peer similar to any institution in the next integer group . To make this groupiness analysis robust, I oscillate the threshold by and . Therefore, each institution will be assigned a groupiness number for each variable of the set . The thresholds without oscillations is shown in Table 3. • I compute the mean groupiness among all fifty values of the set . The original five major variables were expanded for robustness, enlarged twofold to account for faculty size and then fivefold for threshold flexibility. Let with with odd, an institution belongs to a group provided that: (5) On the other hand, any institution will neither belong to group nor as long as, (6)
Figure 3: Color stratification of group membership ordered by the peer rank for . Each color within the mosaic follows the thresholds of Table 3. Color bands with bold boundary lines at the bottom depict the groups in Table 4 ranging from ++ to . • The peer similarity creates a league table with stratification of performance among different groups, but within a group all members are peers with little deviation in performance among themselves. For the sake of comparison with established league tables, I will differentiate between peers by the mean groupiness , leading to a continuous peer ranking (see Table 4).
2.1 Results
I have thus far assigned a methodology that is solely focused on subject rankings through the variables and the faculty density correction . As a result, the overall evaluation of all institutions is simply composed by the extensive analysis of all subjects. More specifically, intensive (the Leiden parameter ) and extensive (the output ) parameters were assigned to every subject for all institutions and make an extensive analysis of all subjects, each with the same maximum score to remove bibliometric disparity among different subjects. Because the overall rank is obtained from the peer similarity defined in eqs. (5-6), the final peer ranking independs on how the intensive and extensive measures are computed. In fact, one could use the -index as an alternative to both without significant deviations in the final result. However, in addition of being time-dependent (Mannella and Rossi, 2013), it is computationally burdensome to find the main campus contribution with the h-index. The core criteria that delineates final groups of similarity and ultimately the peer ranking is the stratification of classes defined in Table 3, whose stratification is clearly seen in Figure 3.
| Class | Grade | Group | Countries | |||||||
|---|---|---|---|---|---|---|---|---|---|---|
| Elite | A++ | 1, 1+ 1/2 | 44,300 | 47,900 | 614.4 | 622.5 | 653.8 | 72 | 9 | 3 |
| A+ | 2 | 31,100 | 39,000 | 522.0 | 504.4 | 537.2 | 63 | 10 | 4 | |
| World-Class | A | 2 + 1/2 | 29,700 | 33,000 | 478.7 | 472.9 | 500.5 | 62 | 22 | 8 |
| A- | 3 | 23,300 | 27,300 | 433.4 | 423.4 | 423.8 | 54 | 39 | 13 | |
| A- - | 3 + 1/2 | 17,800 | 24,000 | 391.3 | 388.4 | 348.1 | 45 | 36 | 14 | |
| Continental | B++ | 4 | 13,200 | 19,800 | 377.7 | 356.6 | 292.6 | 36 | 85 | 26 |
| B+ | 4 + 1/2 | 8,700 | 16,400 | 366.6 | 332.2 | 234.6 | 24 | 58 | 30 | |
| B | 5 | 6,300 | 14,900 | 352.3 | 317.1 | 191.9 | 18 | 104 | 32 | |
| National | B- | 5 + 1/2 | 4,200 | 11,600 | 361.6 | 274.9 | 146.7 | 12 | 63 | 37 |
| B- - | 6 | 2,700 | 11,300 | 328.8 | 267.4 | 111.0 | 8 | 103 | 42 | |
| Regional | C+ | 6 + 1/2 | 1,400 | 9,400 | 326.4 | 233.5 | 70.6 | 4 | 160 | 47 |
| C | 7 | 700 | 7,400 | 302.2 | 187.8 | 42.4 | 2 | 294 | 55 | |
| Local | D | 7 + 1/2, 8 | 300 | 5,500 | 261.0 | 155.5 | 24.3 | 1 | 270 | 63 |
| All | 4,900 | 11,900 | 304.9 | 250.5 | 127.6 | 13 | 1,253 | 63 |
| Type | |||||
|---|---|---|---|---|---|
| Specialized | 0/80 | 21/800 (2.6 %) | 56/2400 (2.3 %) | 213/8000 (2.7 %) | 477/16000 (3.0 %) |


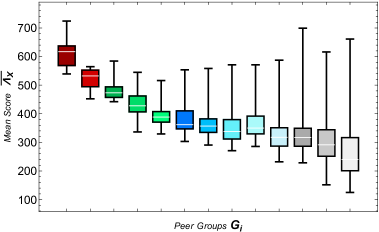
The main result is observed in Figures 4a and 5: the mean subject score curve shows a clear stabilization in the tail (), establishing that almost all research-intensive universities attain the same quality, i.e. the same average research impact in a number of academic subjects. The exception to such region of stability seems to be restricted to the first 100 ranked institutions. Conversely, Figure 4b demonstrates that the remaining variables are strongly correlated with the peer ranking, without considerable deviations among themselves. Interestingly, only a dozen countries appear in the groups of highest impact, representing 40% of all subject rank slots (see Table 4).

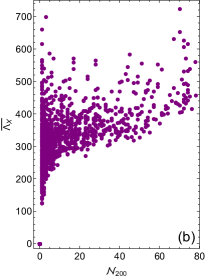
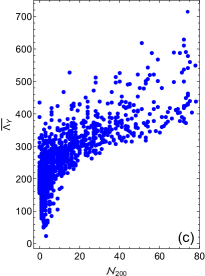
Furthermore, we note in Figure 6a that there is a strong correlation between the number of subjects exceled at and the normalized total subject score. This correlation is weakened when considered the size-dependent mean score per subject in Figure 6c, while Figure 6b demonstrates that no correlation exists with the size-independent mean score. Figure 6b also reveals that excluding the institutions with the scatter plot of the mean score is identical to a normal distribution centered at . This suggests that below the threshold the mean subject score is simply randomic. Therefore, research-intensive institutions seem to mantain the same mean quality (the reader should understand it as the mean research impact per field, that is to say, the degree of leadership at a given subject), except above a threshold which is the only feasible definition of a World-Class institution.
Contrary to common belief, Table 5 shows that specialized institutions do not tend to lead in their respective subjects, as they are underrepresented in the group of leading institutions in their areas of expertise. These institutions are considered specialized because they do not cover more than 20 subjects in terms of departamental structure. In spite of their original names, most technical universities and institutes do not limit their scope to technology and natural sciences, and thus can not be considered specialized institutions. For a comparison, major nominal technical institutions include MIT with , ETH Zurich with , and Technical Univ. Munich with whereas truly specialized institutions are represented by UC San Francisco and the London School of Economics (LSE) both with .
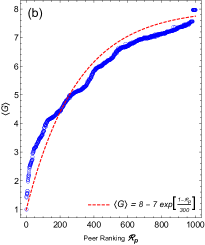
Despite the peer ranking being a measure of homogeneity among institutions of each group and the thresholds not being dependent on comprehensiveness (see section 2), Figure 7a conveys a clear mathematical relationship between the peer ranking and comprehensiveness of the kind:
| (7) |
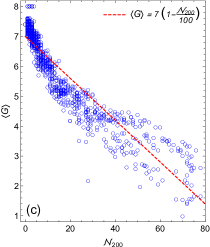
According to eq. (7), it can be stated with a high degree of confidence that only one strong predictor for the continuous league table emerges, namely the institutional comprehensiveness. Moreover, Figure 7b reveals that the mean groupiness also displays an exponential relationship with the peer ranking. Note that the groupiness requires threshold definitions and robustness thereof (see Table 3), whereas the measure of comprehensiveness is self-explanatory and independent of group thresholds. Nonetheless, the groupiness and comprehensiveness seem to be related almost exactly by a linear relationship, as shown in Figure 7c.
3 The World-Class Debate
Another important topic of debate regards whether is possible to reach a definition of world-class institutions (Hazelkorn, 2008). Critics claim that strategic national programs created to help their universities reach the ill-defined level of ”world-class” institutions overlook the major flaw of zero-sum game in league tables, and it would be impossible to have all or many of these institutions defined as world-class (Douglass, 2016). In this section I address this problem. First and foremost, it has been conclusively shown in section 2.1 that the significantly higher mean subject score is what distinguishes world-class institutions from the remaining ones. Secondly, I have also shown this group to be strongly correlated with comprehensiveness of research impact. Therefore, the present analysis has the capability of adding nuance to the debate: a world-class level can be achieved by institutions currently belonging to lower groups without affecting its peers, since the groupiness is strongly correlated with comprehensiveness (see Figure 7c). As a result, it is possible to enlarge the number of world-class institutions without affecting the degree of comprehensiveness of the remaining universities. This is possible because of the conservation principle:
| (8) |
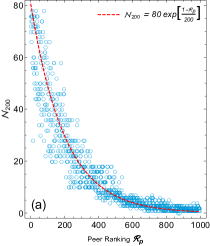
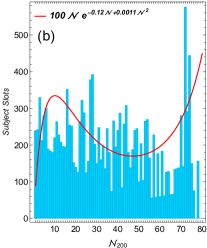
where is the dimensional equivalent of a probability density counting the total number of subject ranking slots taken by all institutions with a given . As long as this integral property of the subject rankings holds, any redistribution of academic performance is possible. In fact, Figure 8a shows that the vast majority of institutions belong to the lowest groups of Table 4. However, in Figure 8b I shift the focus to the histogram of subject ranking slots as a function of comprehensiveness, observing a median value of and thus the equal share of subject rank slots between the half bottom and top half groups. Nonetheless, the histogram is far from being uniformly distributed, displaying two maxima: first of the lowest groups () and the global maximum at the highest groups with . Similarly, Figure 8c breaks down the same histogram into groupiness, revealing a normal distribution centered at the B++ group.

However, the landscape of global research universities is changing quickly due to the rise of institutions from developing nations, in particular from Asia (Veugelers, 2013, 2017; Nature-Index, 2021; Conroy and Plackett, 2022). Hence, the current bibliometric trend will likely result in the convergence of the distribution of excellence in academic subjects to a uniform one in a few decades, decreasing the peak between groups B++ and A in Figure 8c and reallocating them to neighboring lower groups. Therefore, the peer similarity approach removes the zero-sum game issue: although it is not possible for every developed/developing nation to claim 10 universities among the top 100, it is possible that the group of world-class institutions will grow. Consequently, it is possible to answer the questions raised by Altbach and Salmi (2011) and Oliver (2013) on world-class institutions: Firstly, yes it is possible for most of the major 50 economies to have a few world-class universities. Secondly, the present statistical analysis extracted precise characteristics of this class.
The present methodology has shown that continuously stratified ranking tables are obsolete and should be replaced by similarity of university groups. Likewise, the Carnegie classification (Carnegie, 1976; Kosar and Scott, 2018) puts together universities of different groups of research intensity, but the new model is more precise. Unlike Carnegie (1976), the model is able to differentiate between institutions like Caltech and MIT: while the former excels in 28 out of 80 subjects of Table 2 and features a mean subject score of , the latter excels in 67 subjects and reaches . Hence, the two universities can not be considered peers and are not in the same tier. The highest Carnegie classification (group), the R1 institutions, joins together almost all groups of Table 4. The main disparity between the Carnegie (1976) classification and the present approach is that the former merges all the research output of a university, with disproportionate allocation of research funds and efforts into a few subjects of higher impact (see Figure 2) compensating for the lack of it in the remaining subjects. Hence, in a comparison of universities, this methodology will not assess the uneven distribution of research output among subjects.
4 Comparison with other league tables
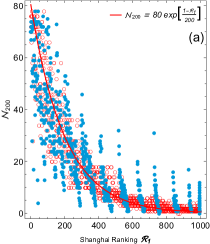


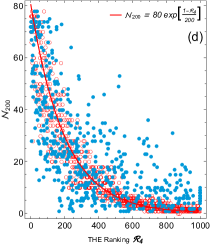

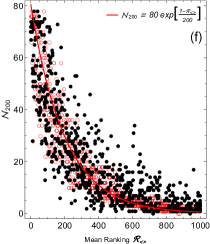
Even though the methodology of the five major university league tables are divergent, their core criteria are research impact. Hence, in this section I shall probe the main results of eq. (7) as well as the mean subject score evolution in Figure 4a against the five major university league tables in an attempt to reveal hidden features of their methodologies. First, I analyze how well the curve in Figure 7a is reproduced in established league tables. As can be observed in Figure 9a, the Shanghai ranking reproduces the same curve quite well. Note, however, that differences as compared to the peer ranking are visible: the Shanghai counterpart shows discrete stratification for (see Table 6 for definitions), which is due to their methodological discrete ranking above this threshold. Moreover, the Shanghai ranking also features a few dozens outliers compared to the peer ranking. Likewise, the US News league table follows the same curve of the peer rank, as shown in Figure 9b. Although the correlation between both QS and THE rankings (see Figures 9c,d) and the number of subjects has a much stronger scatter than the peer ranking, the trend of better ranked institutions to be more comprehensive is still observed. Finally, both curves for the NTU and Mean rankings (see Figures 9e,f) are in good agreement with eq. (7).
Furthermore, Table 6 delineates by how much each institution rank differs between each league table and the peer rank. I found that on average, the vast majority of institutions lie in the confidence interval of the peer rank. This interval supports the view that institutions can not be continuously ranked, as the differences between peers are so small that their positions may change depending on each parameter weight in the overall computation. Thus, Figure 9 and Table 6 confirm the validity of eq. (7), and allows us to discern between the established league tables: Shanghai and US News are the most accurate while QS and THE are the least trustworthy.
| Range | ||||||
|---|---|---|---|---|---|---|
| ; | 32.5% | 26.6% | 16.7% | 20.1% | 25.9% | 28.0% |
| ; | 64.7% | 57.8% | 33.1% | 43.1% | 54.7% | 59.3% |
| ; | 87.5% | 84.7% | 59.9% | 68.3% | 78.8% | 84.5% |
| ; | 26.0% | 30.0% | 13.0% | 31.0% | 29.0% | 25.0% |
| ; | 61.0% | 65.0% | 31.0% | 53.0% | 63.0% | 62.0% |
| ; | 79.0% | 88.0% | 56.0% | 74.0% | 79.0% | 86.0% |
Additionally, I have also checked whether the distribution of mean score as a function of the peer ranking also applies to other league tables. It could be that other league tables assign so different rank positions compared to that the distribution of would not saturate. As it turns out, Figure 10 corroborates the main result that the mean score of universities across eighty academic subjects across all fields tend to saturate rather quickly outside the Elite and World-class groups (see Table 4). Remarkably, even the curve for the QS ranking shows no significant deviation from Figure 4a, despite the former being the least accurate league table.
This assessment of the correlation between the peer rank and these major league tables have have shown surprisingly good fidelity of the measure of comprehensiveness. As such, it allows me to draw the conclusion that regardless of the exact criteria employed, the continuous league position of research-intensive institutions are strongly correlated with academic comprehensiveness. More precisely, the success of institutions in university league tables are strongly influenced by research comprehensiveness and secondarily by high density of score per faculty. The very few institutions, such as Caltech, that are not fully comprehensive (but also not specialized) can appear among the best when their score density per faculty is very high. Conversely, a high score per faculty density can not uplift specialized institutions into groups of comprehensive ones, such as in the case of Scuola Normale Superiore di Pisa.


5 Regional & Institutional Performance
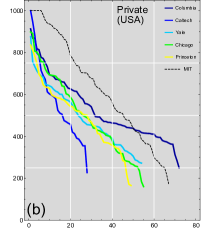
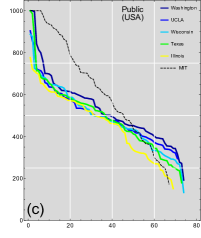
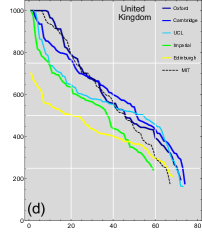
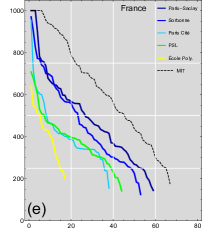
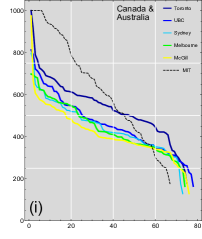
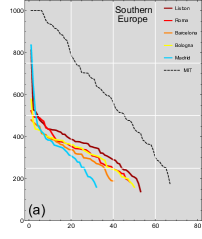
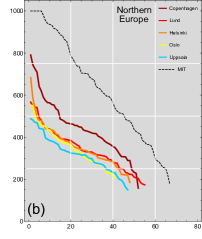
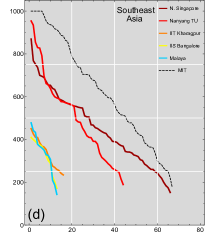
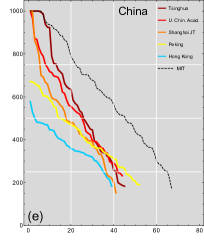
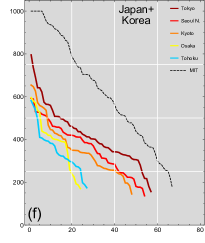
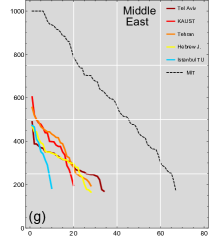
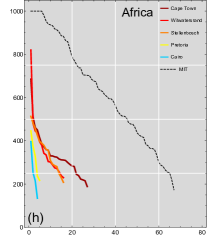
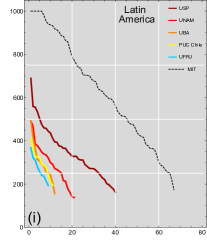
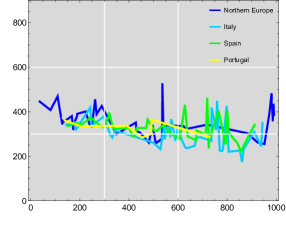
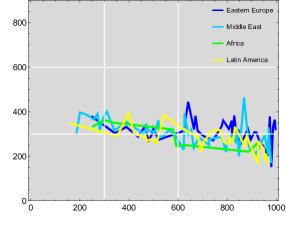
Another relevant aspect of the present analysis regards the regional and individual performance. In the case of comprehensiveness, Figures 11-12 depict the score of each institution (vertical axis) of leading world regions for each of the eighty subjects (horizontal axis). The higher the farther the curve goes, and the higher classification in each subject ranking the higher curve in each plot. For instance, the upper bound of the overall score would entail a constant curve in all subjects. Figure 11a shows that the best ranked institution, Harvard, is still far from this upper bound. In addition, the similarity between all USA institutions belonging to group A++ is evident. Strikingly, the mean curve of this group seems to be well represented by the MIT one. As such, in all remaining panels of Figures 11-12 I compare institutional performance against that of MIT. Figure 11b demonstrates that many private USA institutions believed to be a peer of MIT are indeed at a lower level (A+). Caltech’s subject performance is significantly lower than its peers, but this is compensated by a much higher score per faculty. Conversely, Figure 11c shows the leading public USA institutions perform better than expected of their reputation, being at the same level of the private institutions of Figure 11b. In the United Kingdom, Figure 11d depicts the indiscernible performance of Oxford and Cambridge at par with MIT, both belonging to the A++ group. Moreover, Imperial College and UCL are not too far behind. For the remaining panels (Figures 11e-i and 12), no institution will be found to be performing similarly to MIT except for ETH Zurich in Switzerland and the University of Toronto in Canada. Among the leading countries in academic research, Germany seems to be underperforming in the subject rankings (see Figure 11f), but like Caltech this is compensated by a much higher score per faculty density than its peers. In other words, German institutions perform a bit lower than its peers in leading European countries despite having a much smaller number of faculty per institution. For the remaining major regions of the world, a much lower performance is observed, except for the leading institutions in Denmark, Singapore, China, and Japan. The institutional performance amounts to the likelihood of their perfomance to be among the very best in any randomly chosen academic field. As shown in figures 5 and 10, very few similarity groups have a typical size-independent likelihood exceeding 40%. It is the size of research faculty that ultimately strengthen a stratification of likelihood in performing well in any randomly chosen subject.
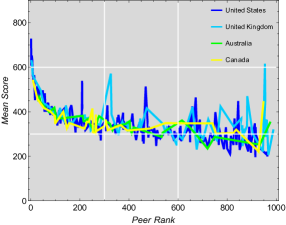
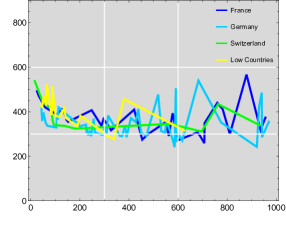
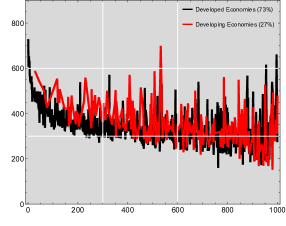
In Figure 13 the regional performance of the mean score across all academic subjects is compared. The overall trend of saturation of mean score for is found in all regions of the globe and their differences are negligible. Therefore, I conclude that not only quality is nearly homogeneously distributed across the leading thousand institutions, it is also regionally or even nationally. Surprisingly, academic quality is found to be worldwide homogeneous even despite economic disparities999The definitions for developed and developing economies can be found at the IMF report., and the only difference between countries/regions is the total number of their institutions and comprehensiveness thereof.

6 Conclusions
The academic world saw in the past two decades an explosion of university league tables and their impact. The question regarding the liability for the assessment of university league tables arose. As Weingart (2005) argues, it is the duty and responsibility of peer-review alone to evaluate institutions and individuals in the research realm. However, as far as university tables are concerned, scientists rarely offer solutions or alternatives to the established frameworks. Addressing such summons, I have attempted to answer the most pressing questions on biases and negative features of league tables, overcoming them. Tangible features of the institutions deemed to be ”world-class” and the relationship of their metrics to the remaining research-intensive institutions were found.
To the author’s knowledge, the present work on university ranking is the first to demonstrate that status development without concurrently affecting the position of peer institutions is possible. Strong evidence supporting the stratification of excellence in academic performance has been found. Moreover, we solve the problem of the zero-sum game through a parameterization of the research quality and output by implementing the idea of how broad the institution coverage of all main subjects of human knowledge are. Although most rankings are based on relative or comparative quality, the present methodology clearly classifies excellence by absolute values. The heart of the present rationale lies in the fact that normalized for subject average h-index, whether the research output or any similar measure of the leading institution in a given subject has the same influence and impact of the leading institution in another subject. Thus, the methodology points to the existence of groups of universities in which performance within each group is almost indistinguishable. Universities in the same similarity group can be considered equal and stratification within groups are hardly found.
Albeit the stratification of academic excellence is real between groups, the present results discredit the typical league table view of scarcity of reputation. The analysis carried out in this study has shown that nearly every research-intensive university excels in a wide range of subjects. Furthermore, it has been unveiled that reputation and prestige often attached to awards and prizes in these fields, is not a proxy for quality. Unsurprisingly, I find that some of the Ivies and similar private institutions in the United States do not measure up to their reputation and prestige. The discrepancy between actual performance and reputation is particularly substantial for Princeton and Caltech. On the other hand, the opposite seems to be true for large public institutions in North America, as their reputation does not measure up to their excellent performance and broad coverage such as the University of Michigan and the University of Wisconsin flagship campuses. Remarkably, the strong correlation between the peer ranking and comprehensiveness of universities is somehow also applicable to five established league tables. As such, I conclude that regardless of the methodology, research-intensive institutions tend to be classified as a function of their comprehensiveness.
The results of the present analysis may be perceived as a paradox: On one hand, the quality of an institution is not correlated with comprehensiveness. On the other hand, there is a strong correlation between comprehensiveness and the mean ranking of the major established league tables. Nevertheless, it should by no means induce the reader to conclude that comprehensiveness is necessary to make a good university. Rather, university league tables will inherently and even unconciously favor comprehensive institutions through their several differing methods, while the mean quality of all these institutions are nearly homogeneous. Hence, comprehensiveness is not a goal to be sought, but the root in the stratification of academic impact and unrelated to academic quality. In fact, comprehensiveness is a proxy for privilege, because the former requires large and steady endowment over decades in order to be achieved. Century-old institutions have a clear advantage in achieving a high level of comprehensiveness, in particular those in countries with generous science funding bodies.
Acknowledgements
The author thanks Jérôme Kasparian for reading the manuscript and adding to its readability.
Conflict of interest
The author declares no conflict of interest.
Data Availability
Core data can be found within personal storage. This includes links to search queries for each of the eighty subjects, league tables of the overall and subject rankings and Google Earth interactive map with 800 universities in the same color stratification within the manuscript.
References
- Adina-Petruta (2015) Adina-Petruta, P., 2015. Global university rankings - a comparative analysis. Procedia Economics and Finance 26, 54–63. 4th World Conference on Business, Economics and Management (WCBEM-2015).
- Agasisti and Bertoletti (2020) Agasisti, T., Bertoletti, A., 2020. Higher education and economic growth: A longitudinal study of european regions 2000–2017. Socio-Economic Planning Sciences , 100940.
- Aguillo et al. (2010) Aguillo, I., Bar-Ilan, J., Levene, M., Ortega, J., 2010. Comparing university rankings. Scientometrics 85, 243–256.
- Altbach and Salmi (2011) Altbach, P.G., Salmi, J., 2011. The road to academic excellence: The making of world-class research universities. The World Bank.
- Althouse et al. (2009) Althouse, B., West, J., Bergstrom, C., Bergstrom, T., 2009. Differences in impact factor across fields and over time. Journal of the American Society for Information Science and Technology 60, 27–34.
- Anselin et al. (1997) Anselin, L., Varga, A., Acs, Z., 1997. Local geographic spillovers between university research and high technology innovations. Journal of Urban Economics 42, 422 – 448.
- Babcock (1911) Babcock, K.C., 1911. A classification of universities and colleges with reference to bachelor’s degrees. US Government Printing Office.
- Biglu (2008) Biglu, M., 2008. The influence of references per paper in the sci to impact factors and the matthew effect. Scientometrics 74, 453–470.
- Bowden (2000) Bowden, R., 2000. Fantasy higher education: University and college league tables. Quality in Higher Education 6, 41–60.
- Brankovic et al. (2018) Brankovic, J., Ringel, L., T., W., 2018. How rankings produce competition: The case of global university rankings. Zeitschrift fur Soziologie 47, 270 – 288.
- Buela-Casal et al. (2007) Buela-Casal, G., Gutiérrez-Martínez, O., Bermúdez-Sánchez, M., Vadillo-Muñoz, O., 2007. Comparative study of international academic rankings of universities. Scientometrics 71, 349–365.
- Buringh and van Zanden (2009) Buringh, E., van Zanden, J., 2009. Charting the ”rise of the west”: Manuscripts and printed books in europe, a long-term perspective from the sixth through eighteenth centuries. Journal of Economic History 69, 409 – 445.
- Cantoni and Yuchtman (2014) Cantoni, D., Yuchtman, N., 2014. Medieval universities, legal institutions, and the commercial revolution. Quarterly Journal of Economics 129, 823 – 887.
- Carnegie (1976) Carnegie, 1976. Carnegie Council on Policy Studies in Higher Education : a Classification of Institutions of Higher Education. Berkeley, California.
- Cartter (1966) Cartter, A.M., 1966. An assessment of quality in graduate education. American Council on Education .
- Chen and Liao (2012) Chen, K.H., Liao, P.Y., 2012. A comparative study on world university rankings: a bibliometric survey. Scientometrics 92, 89–103.
- Chirikov (2021) Chirikov, I., 2021. Does conflict of interest distort global university rankings? UC Berkeley: Center for Studies in Higher Education .
- Clark (2008) Clark, W., 2008. Academic charisma and the origins of the research university. University of Chicago Press.
- Clarke (2002) Clarke, M., 2002. Some guidelines for academic quality rankings. Higher Education in Europe 27, 443–459.
- Conroy and Plackett (2022) Conroy, G., Plackett, B., 2022. Nature index annual tables 2022: China’s research spending pays off. Nature .
- Crow and Dabars (2015) Crow, M.M., Dabars, W.B., 2015. Designing the new American university. JHU Press.
- Curtis (2014) Curtis, J.W., 2014. The employment status of instructional staff members in higher education, fall 2011. American Association of University Professors .
- Dai et al. (2021) Dai, C., Chen, Q., Wan, T., Liu, F., Gong, Y., Wang, Q., 2021. Literary runaway: Increasingly more references cited per academic research article from 1980 to 2019. PLoS ONE 16.
- Dill and Soo (2005) Dill, D., Soo, M., 2005. Academic quality, league tables, and public policy: A cross-national analysis of university ranking systems. Higher Education 49, 495–533.
- Docampo (2013) Docampo, D., 2013. Reproducibility of the shanghai academic ranking of world universities results. Scientometrics 94, 567–587.
- Docampo et al. (2015) Docampo, D., Egret, D., Cram, L., 2015. The effect of university mergers on the shanghai ranking. Scientometrics 104, 175–191.
- Douglass (2016) Douglass, J.A., 2016. The new flagship university: Changing the paradigm from global ranking to national relevancy, in: How Rankings Came to Determine World Class. Palgrave Macmillan US , 9–29.
- Egghe (2007) Egghe, L., 2007. Dynamic h-index: The hirsch index in function of time. Journal of the American Society for Information Science and Technology 58, 452–454.
- Ehrenberg (2000) Ehrenberg, R., 2000. Tuition rising: Why college costs so much? Harvard University Press, Cambridge .
- Ehrenberg (2003) Ehrenberg, R., 2003. Reaching for the brass ring: The u.s. news & world report rankings and competition. The Review of Higher Education 26, 145–162.
- Ehrenberg and Zhang (2005) Ehrenberg, R.G., Zhang, L., 2005. The changing nature of faculty employment. Recruitment, retention and retirement in higher education: Building and managing the faculty of the future , 32–52.
- Fauzi et al. (2020) Fauzi, M., Tan, C.L., Daud, M., Awalludin, M., 2020. University rankings: A review of methodological flaws. Issues in Educational Research 30, 79–96.
- Finardi (2014) Finardi, U., 2014. On the time evolution of received citations, in different scientific fields: An empirical study. Journal of Informetrics 8, 13–24.
- Garrouste and Rodrigues (2014) Garrouste, C.L., Rodrigues, M., 2014. Employability of young graduates in europe. International Journal of Manpower 35, 425–447.
- Gedike (2018) Gedike, F., 2018. ”der Universitäts-Bereiser” Friedrich Gedike Und Sein Bericht an Friedrich Wilhelm II (Classic Reprint). Fb&c Limited.
- Hagstrom (1971) Hagstrom, W.O., 1971. Inputs, outputs, and the prestige of university science departments. Sociology of Education , 375–397.
- Hamilton (1991) Hamilton, D., 1991. Research papers: Who’s uncited now? Science 251, 25.
- Hazelkorn (2008) Hazelkorn, E., 2008. Learning to live with league tables and ranking: The experience of institutional leaders. Higher Education Policy 21, 193–215.
- Hazelkorn (2015) Hazelkorn, E., 2015. Rankings and the reshaping of higher education: The battle for world-class excellence. Palgrave Macmillam, 2nd edition , 1–330.
- Hirsch (2005) Hirsch, J.E., 2005. An index to quantify an individual’s scientific research output. Proceedings of the National Academy of Sciences 102, 16569–16572.
- Inhaber and Przednowek (1976) Inhaber, H., Przednowek, K., 1976. Quality of research and the nobel prizes. Social Studies of Science 6, 33–50.
- Kerr (2001) Kerr, C., 2001. The Uses of the University. Harvard University Press.
- Kosar and Scott (2018) Kosar, R., Scott, D.W., 2018. Examining the carnegie classification methodology for research universities. Statistics and Public Policy 5, 1–12.
- Kosztyan et al. (2019) Kosztyan, Z., Banasz, Z., Csanyi, V., Telcs, A., 2019. Rankings or leagues or rankings on leagues? - ranking in fair reference groups. Tertiary Education and Management 25, 289–310.
- Larsen et al. (2002) Larsen, K., Martin, J.P., Morris, R., 2002. Trade in educational services: Trends and emerging issues. World economy 25, 849–868.
- Lee et al. (2020) Lee, J., Liu, K., Wu, Y., 2020. Does the asian catch-up model of world-class universities work? revisiting the zero-sum game of global university rankings and government policies. Educational Research for Policy and Practice 19, 319–343.
- Mannella and Rossi (2013) Mannella, R., Rossi, P., 2013. On the time dependence of the h-index. Journal of Informetrics 7, 176–182.
- Marginson and van der Wende (2007) Marginson, S., van der Wende, M., 2007. To rank or to be ranked: The impact of global rankings in higher education. Journal of Studies in International Education 11, 306–329.
- Menand et al. (2017) Menand, L., Reitter, P., Wellmon, C., 2017. The Rise of the Research University: A Sourcebook. University of Chicago Press.
- Merisotis (2002) Merisotis, J., 2002. Summary report of the invitational roundtable on statistical indicators for the quality assessment of higher/tertiary education institutions: Ranking and league table methodologies. Higher Education in Europe 27, 475–480.
- Moed et al. (1985) Moed, H., Burger, W., Frankfort, J., Van Raan, A., 1985. The application of bibliometric indicators: Important field- and time-dependent factors to be considered. Scientometrics 8, 177–203.
- Mokyr (2011) Mokyr, J., 2011. The gifts of Athena: Historical Origins of the Knowledge Economy. princeton university press.
- Nature-Index (2021) Nature-Index, 2021. Superpowered science: Charting china’s research rise. Nature 593, S4–S5.
- Oliver (2013) Oliver, D.E., 2013. The road to academic excellence: The making of world-class research universities edited by philip g. altbach and jamil salmi. Comparative Education Review 57, 342–344.
- Ripoll-Soler and de Miguel-Molina (2019) Ripoll-Soler, C., de Miguel-Molina, M., 2019. Higher education mergers in europe: a comparative study of the post-merger phase. Tertiary Education and Management 25, 255–271.
- Sangwal (2011) Sangwal, K., 2011. On the growth of citations of publication output of individual authors. Journal of Informetrics 5, 554–564.
- Schofer and Meyer (2005) Schofer, E., Meyer, J., 2005. The worldwide expansion of higher education in the twentieth century. American Sociological Review 70, 898 – 920.
- Schuster and Finkelstein (2006) Schuster, J.H., Finkelstein, M.J., 2006. The American faculty: The restructuring of academic work and careers. JHU Press.
- Seglen (1992) Seglen, P., 1992. The skewness of science. Journal of the American Society for Information Science 43, 628–638.
- Shanghai (2022) Shanghai, 2022. See https://www.shanghairanking.com .
- Tapper and Palfreyman (2002) Tapper, T., Palfreyman, D., 2002. Understanding collegiality: The changing oxbridge model. Tertiary Education & Management 8, 47–63.
- Taylor (2006) Taylor, J., 2006. Managing the unmanageable: The management of research in research-intensive universities. Higher Education Management and Policy 18, 1–25.
- Taylor and Braddock (2007) Taylor, P., Braddock, R., 2007. International university ranking systems and the idea of university excellence. Journal of Higher Education Policy and Management 29, 245–260.
- Valero and Van Reenen (2019) Valero, A., Van Reenen, J., 2019. The economic impact of universities: Evidence from across the globe. Economics of Education Review 68, 53–67.
- Veugelers (2013) Veugelers, R., 2013. The world innovation landscape: Asia rising? Technical Report. Bruegel Policy Contribution.
- Veugelers (2017) Veugelers, R., 2017. The challenge of China’s rise as a science and technology powerhouse. Technical Report. Bruegel Policy Contribution.
- Veysey (1965) Veysey, L., 1965. The emergence of the American university. The University of Chicago Press.
- Webster (1981) Webster, D.S., 1981. The origins and early history of academic quality rankings of American Colleges, universities, and individual departments, 1888-1925. Ph.D. thesis. University of California, Los Angeles.
- Webster (1986) Webster, D.S., 1986. Jack gourman’s rankings of colleges and universities: a guide for the perplexed. RQ , 323–331.
- Weingart (2005) Weingart, P., 2005. Impact of bibliometrics upon the science system: Inadvertent consequences? Scientometrics 62, 117–131.
- Wilbers and Brankovic (2021) Wilbers, S., Brankovic, J., 2021. The emergence of university rankings: a historical‑sociological account. Higher Education .
- Zemliakova (2018) Zemliakova, T., 2018. German-american academic migration and the emergence of the american research university, 1865–1910. Voprosy Obrazovaniya 1, 290–317.
- Zuckerman (1967) Zuckerman, H., 1967. The sociology of the nobel prizes. Scientific American 217, 25–33.
- Zuckerman (1977) Zuckerman, H., 1977. Scientific elite: Nobel laureates in the United States. Transaction Publishers.
- Zuckerman (1978) Zuckerman, H., 1978. The sociology of the nobel prize: Further notes and queries. how successful are the prizes in recognizing scientific excellence? American Scientist 66, 420–425.