When Less is Enough: Positive and Unlabeled Learning Model for Vulnerability Detection
Abstract
Automated code vulnerability detection has gained increasing attention in recent years. The deep learning (DL)-based methods, which implicitly learn vulnerable code patterns, have proven effective in vulnerability detection. The performance of DL-based methods usually relies on the quantity and quality of labeled data. However, the current labeled data are generally automatically collected, such as crawled from human-generated commits, making it hard to ensure the quality of the labels. Prior studies have demonstrated that the non-vulnerable code (i.e., negative labels) tends to be unreliable in commonly-used datasets, while vulnerable code (i.e., positive labels) is more determined. Considering the large numbers of unlabeled data in practice, it is necessary and worth exploring to leverage the positive data and large numbers of unlabeled data for more accurate vulnerability detection.
In this paper, we focus on the Positive and Unlabeled (PU) learning problem for vulnerability detection and propose a novel model named PILOT, i.e., PositIve and unlabeled Learning mOdel for vulnerability deTection. PILOT only learns from positive and unlabeled data for vulnerability detection. It mainly contains two modules: (1) A distance-aware label selection module, aiming at generating pseudo-labels for selected unlabeled data, which involves the inter-class distance prototype and progressive fine-tuning; (2) A mixed-supervision representation learning module to further alleviate the influence of noise and enhance the discrimination of representations. Extensive experiments in vulnerability detection are conducted to evaluate the effectiveness of PILOT based on real-world vulnerability datasets. The experimental results show that PILOT outperforms the popular weakly supervised methods by 2.78%-18.93% in the PU learning setting. Compared with the state-of-the-art methods, PILOT also improves the performance of 1.34%-12.46% in F1 score metrics in the supervised setting. In addition, PILOT can identify 23 mislabeled from the FFMPeg+Qemu dataset in the PU learning setting based on manual checking.
Index Terms:
Software vulnerability detection, positive and unlabeled learning, source code representationI Introduction
Software vulnerabilities typically refer to specific flaws or oversights within software components that enable attackers to disrupt a computer system or program. In 2022, Trellixd’s team uncovered a security vulnerability in Python’s tarfile module, known as CVE-2007-4559 [1]. This vulnerability had been present in approximately 350,000 open-source projects, potentially creating a significant security risk due to it going unnoticed for so long. Consequently, researchers seek to improve approaches for software vulnerability detection in order to safeguard computer systems and programs from potential attacks.
In recent years, with the increase in the number of software vulnerabilities [2], more and more researchers have been using automated methods for software vulnerability detection. Generally, existing software vulnerability detection methods can be divided into two categories: program analysis (PA)-based methods [3, 4, 5] and learning-based methods [6, 7, 8, 9, 10]. PA-based methods mainly include static analysis [11, 12, 13], dynamic analysis [14, 15], and symbolic execution [16], among others. These methods usually utilize expert knowledge to manually extract features. They primarily focus on specific types of vulnerabilities, e.g. buffer overflow [17] and SQL injection [18], etc.
In comparison, learning-based methods can detect a broader range of software vulnerability types [19], such as various vulnerability in libraries and API calls. Learning-based methods mainly include sequence-based [20, 21, 22] and graph-based approaches [7, 23, 24], both of which require a large amount of annotated data for training. For instance, VulDeePecker [21] and SySeVR [20] treat source code as sequences and extract code gadgets from the source code and use a bidirectional Long Short-Term Memory (LSTM) network for vulnerability detection. Devign [23] and Reveal [24] extract various graph structures (such as Data Flow Graphs [25], and Control Flow Graphs [26]) from the code and leverage Gated Graph Neural Networks to detect vulnerabilities within the code.
Although learning-based methods have made significant progress in software vulnerability detection, the performance of these methods is still limited due to the lack of high-quality labeled data. Specifically, these methods suffer from the following limitations: (1) Lack of labeled data. One major limitation is that existing vulnerability detection methods require a large amount of labeled positive and negative samples. However, manual code review requires expert knowledge [27] and is time-consuming [28], resulting in the lack of high-quality labeled data. (2) Inaccurate labeled data. The accuracy of the labels in vulnerability detection is also a major challenge. The commonly-used labeling methods crawl the labels from public commit [29] or rely on static analyzers [30], which are not foolproof and prone to introducing inaccurate labels. Croft et al.’s [31] research has also identified the presence of noisy data. For example, only 80% of the labels in the FFMPeg+Qemu [23] dataset are reported as accurate. The prior research has also demonstrated that the non-vulnerable labels (i.e., negative labels) are low in quality, while the vulnerable labels (i.e., positive labels) are more reliable [32, 33]. Considering the large numbers of unlabeled data in practice, it is critical to use the higher-quality positive labels and the unlabeled labels for vulnerability detection.
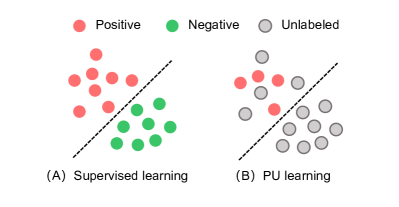
To address the challenges above, we propose a PositIve and unlabeled Learning mOdel for vulnerability deTection, called PILOT. PILOT mainly contains two modules: (1) A distance-aware label selection module, which generates pseudo-labels for selecting high-quality unlabeled data. It consists of the inter-class distance prototype and progressive fine-tuning; (2) A mixed-supervision representation learning module to further alleviate the influence of noise and enhance the discrimination of the vulnerability representation. As shown in Figure 1, different from the supervised learning setting, the positive and unlabeled (PU) learning setting (i.e., PU setting) only requires a few labeled positive samples and some unlabeled samples for training.
We evaluate the effectiveness of PILOT for detecting software vulnerabilities under two settings: PU and supervised settings. Three popular benchmark datasets are adopted for the evaluation, including FFMPeg+Qemu [23], Reveal[24], and Fan et al. [29]. We compare PILOT with four commonly used weakly supervised methods in the PU setting and five existing software vulnerability detection methods in the supervised setting. The results demonstrate that PILOT outperforms all the baseline methods with respect to the F1 score metric. In particular, PILOT achieves 2.78%, 18.44%, and 18.93% in the PU setting on the three datasets, respectively, with relative improvements at 1.34%, 12.46%, and 3.00% absolute improvement in the supervised setting. In addition, PILOT identifies 23 mislabeled samples from the training set of the FFMPeg+Qemu dataset based on manual checking, verifying the inaccurate label issue of existing labels.
In summary, the major contributions of this paper are summarized as follows:
-
1.
We are the first to focus on the positive and unlabeled learning problem for software vulnerability detection.
-
2.
We propose PILOT, a novel vulnerability detection framework under the PU setting. PILOT involves a distance-aware label selection module for providing pseudo-label and a mixed-supervision representation learning module for alleviating the influence of noisy labels in vulnerability detection.
-
3.
We perform an evaluation of PILOT on two settings and three public benchmark datasets, and the results demonstrate the effectiveness of PILOT in software vulnerability detection.
The remaining sections of this paper are organized as follows. Section II introduces the assumptions of positive and unlabeled learning. Section III presents the architecture of PILOT, which includes two modules: a distance-aware label selection module and a mixed-supervision representation learning module. Section IV describes the experimental setup, including datasets, baselines, and experimental settings. Section V presents the experimental results and analysis. Section VI discusses why PILOT can effectively detect code vulnerability and the threats to validity. Section VIII concludes the paper.
II Assumptions of PU Learning
Positive and Unlabeled (PU) learning setting [34, 35, 36] is a weakly supervised classification setup where only PU samples are used for training. It does not require fully supervised data to obtain the same performance as supervised data. In this section, we introduce the assumptions of PU learning, including data assumption and label assumption.
II-A Data Assumption
The PU data in this paper originate from a single training-set scenario [37], meaning that the data come from one single training set. In PU settings, a fraction from the positive samples is selected to be labeled, following the dataset having a fraction of labeled samples. Specifically, the probability density functions of the ground truth distribution is following:
| (1) |
where is the fraction of the positive samples in the dataset, , , and denote the probability density functions of the positive, negative, labeled and unlabeled samples, respectively. In addition, PU learning is required to comply with the separability [38, 39] and smoothness [40, 41] assumptions.
Definition 1 (Separability)
In the hypothesis space, there exists a function that can map positive samples to values greater than or equal to a threshold , and negative samples to values below .
Under the separability assumption, the optimal classifier can classify all labeled samples as positive and a part of dissimilar unlabeled samples as negative. Considering that the optimal classifier is hard to be obtained, one commonly-used approach is to vary the threshold value and select a subset of samples to further train the classifier [34].
Definition 2 (Smoothness)
If the representations of two instances and are similar in the hypothesis space, the probabilities and will also be similar.
The smoothness assumption allows identifying high-quality negative samples as those that are far from all the positive samples. This can be done by using different similarity (or distance) learning measures.
II-B Label Assumption
Another important assumption of PU learning is about the labeling mechanism. It pertains to the selection process for instances labeled as vulnerable (i.e. positive) in the experimental setup. In this paper, we choose the basic assumption for most weakly supervised methods [35, 36, 42] in PU setting, called the Selected Completely At Random (SCAR) assumption [37]:
Definition 3 (Selected Completely At Random)
Labeled samples are selected completely at random, independent of their representations, from the positive samples distribution .
| (2) |
In the SCAR assumption, the probability of selecting a positive sample is constant and equal to the label frequency . Each sample will have a propensity score based on the label frequency . The vulnerabilities observed by programmers are usually independent of the code represention [43]. One example of a difficult-to-identify vulnerability is CWE-369 (Divide By Zero) [44], in which the vulnerable statements present only a small fraction in the source code. Such vulnerabilities are hard to be identified by representation-based vulnerability detection methods [45]. The evaluation of PILOT in this paper is based on the SCAR assumption.
III Proposed Framework
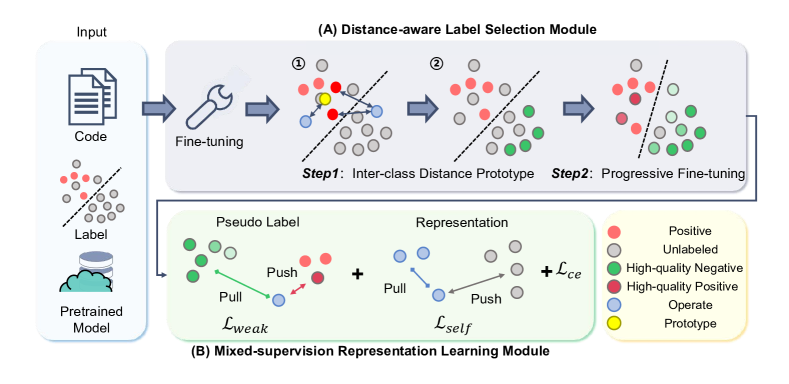
In this section, we formulate the positive and unlabeled learning setting for vulnerability detection and then describe the overall framework of PILOT. As shown in Figure 2, PILOT consists of two main modules: (1) a distance-aware label selection module for providing high-quality pseudo-labels (2) a mixed-supervision representation learning module to further alleviate the effects of noise and enhance the discriminative power of the vulnerability representation.
III-A Problem Formulation
A positive and unlabeled (PU) setting for vulnerability detection is to train a binary classifier in the single-training-set scenario [37], which can distinguish whether a sample is vulnerable or not based on the input source code. In the PU learning setting, only part of the vulnerable samples in the training data are labeled as positive and none of the non-vulnerable ones are labeled, as introduced in Section I.
We denote the PU dataset collected from the real world scenario as , where denotes the set of functions in the raw source code, denotes the class of code function (vulnerable or not), denotes a binary variable representing whether the sample is selected to be labeled, is the number of code function in the dataset. In the PU setting of vulnerability detection, the class of sample is not observed, but the representation of source code can be derived from the label .
The source code labeled with indicates that it belongs to the vulnerable function (positive label):
| (3) |
For the source code samples unlabeled , they can belong to vulnerable or not.
Finally, PILOT learns a mapping from to , to predict whether a code function is vulnerable or not. The prediction function is learned below:
| (4) |
where is the loss function, is the pseudo label we extract from the input source code .
III-B Distance-aware Label Selection Module
In this section, we elaborate on the proposed distance-aware label selection module. It aims to identify High-quality Negative (HN) samples, which can provide pseudo-labeling of unlabeled samples. The module contains two components, i.e., the inter-class distance prototype learning component and progressive fine-tuning component. In the following, we first elaborate on the two components and then provide an algorithm for the overall process.
III-B1 Inter-class Distance Prototype
The inter-class distance prototype learning component aims at identifying high-quality pseudo-labels in unlabeled samples. Labeled positive samples typically represent a small percentage of all training samples. Unlabeled samples may contain both positive and negative samples. Considering the diversity of vulnerabilities [46], we select the corresponding positive prototype for each unlabeled sample based on the smoothness assumption (SectionII-A) and inter-class distance. To select HN samples, we leverage the distance between unlabeled samples and all labeled vulnerability samples. Only those unlabeled samples that exhibit the maximum distance difference is selected as HN samples.
We use the CodeBERT [47] architecture to initialize the representations of code in the PU dataset . We generate the sequence vector for each source code function to capture both the global and local information, which is calculated as follows:
| (5) |
where and denote the first and last layer embedding of CodeBERT [47], respectively. CLS is a special token and is often used as the representation of the sequence [48].
To seek the inter-class distance prototype, we use the positive samples close to the unlabeled samples. For each unlabeled sample , the distance to all positive samples is calculated. The top nearest samples are then selected, and the prototype of sample is the mean vector of the top samples. The sum and mean of the prototype distance for sample are calculated as and :
| (6) |
| (7) |
where denotes the dimension of vector. We sort and , and set the threshold , where and denote the number of unlabeled and positive samples, respectively. is an adjustable hyper-parameter. The smallest samples of and will be selected in the unlabeled samples and only those that satisfy the conditions of both and can be considered as HN samples .
III-B2 Progressive Fine-tuning
As vulnerability (positive) samples are often fewer in number compared to samples without vulnerabilities, it is crucial for PILOT to continually learn vulnerability patterns from labeled (including pseudo-labeled) samples to obtain more pseudo labels. We propose progressive fine-tuning to utilize all available unlabeled data and identify more high-quality labeled samples. First, we fine-tune the pre-trained model using labeled samples as positive and HN samples as negative. The model weights are kept as and no new samples are added. Then, PILOT retains the previous model weights and determines if any unlabeled samples can be confidently predicted. If so, these samples are labeled as High-quality Positive (HP) and HN samples according to the model predicted. Both the HP and HN samples are then used as training data for the next epoch. This process, called progressive, is repeated by until the accuracy of validation set no longer increases. In the progressive step, the quality of added samples decreases with each training epoch. We reduce the high-quality sample’s weights as the number of progressive steps increases, calculated as below:
| (8) |
| (9) |
where and denote the current epoch and progressive fine-tuning training epoch, respectively. is the concatenation set of the pseudo labels we extract and the positive labels, denotes the output predicted by the model, and denotes the number of training samples in Epoch .
III-B3 The Algorithm of Distance-aware Label Selection Module
The overall distance-aware label selection module process is depicted in Algorithm 1, in which inter-class distance prototype selection and progressive fine-tuning correspond to Lines 2-10 and Lines 11-35, respectively. The algorithm takes all the training data (including labeled or not) as the input, and outputs pseudo labels (including and ).
For inter-class distance prototype selection, the algorithm initializes the representation for each sample (Lines 3). Then, the algorithm selects the inter-class prototype for each unlabeled sample, calculates the corresponding distance, and chooses the HN samples based on the inter-class distance. For progressive fine-tuning, the algorithm performs fine-tuning again in labeled and HN samples (Lines 19-23), and then selects the HP and HN samples in the training epoch (Lines 24-34).
III-C Mixed-supervision representation learning module
The mixed-supervision representation learning module aims to mitigate the problem of poor-quality labels. We first combine the CE loss and weakly supervised loss to construct the relation between representation and labels, which enhances the inter-class distance and reduces the intra-class distance for enhancing code representations. To alleviate the problem of label noise, we then involve an unsupervised loss to learn the unsupervised representations for reducing the impact of noisy labels. Specifically, we train by minimizing the loss function calculated as below:
| (10) |
where is a trade-off parameter. is calculated as Eq. 9. and denote the relationships in self-supervised and weakly-supervised scenario, respectively. The followings are the details of each loss function.
Specifically, is mainly used to mine the relation of representation itself, and for each sample , we give a query representation and a set of samples containing one positive sample and other samples from the distribution, computed as below:
| (11) |
where is a temperature hyper-parameter [49]. The sum is over one chosen sample and contrastive samples. The purpose of the is to characterize tries to classify sample as a chosen sample through a vulnerability sample.
The weakly supervised loss function is used to further establish a relation between representations and pseudo-labels:
| (12) |
where is also the same hyper-parameter in Eq. 11, and denotes the pseudo-label of sample .
IV EXPERIMENTAL Setup
In this section, We evaluate the PILOT and aim to answer the following research questions (RQs):
-
RQ1:
How does PILOT perform in vulnerability detection with different weakly supervised methods in PU settings?
-
RQ2:
How does PILOT perform compared with the state-of-the-art vulnerability detection approaches?
-
RQ3:
What is the influence of different modules on the detection performance of PILOT?
-
RQ4:
How do the different hyper-parameters impact the performance of PILOT?
IV-A Datasets
To answer the questions above, we choose three widely-used vulnerability datasets, including FFMPeg+Qemu [23], Reveal [24] and Fan et al. [29]. FFMPeg+Qemu consists of two open-source C projects with a total of 22k samples, out of which 10k samples are vulnerable. The Reveal dataset tracks historical vulnerabilities in two open-source projects, with over 22k and approximately 2k vulnerable samples. Fan et al.’s dataset collects 91 types of vulnerabilities from 348 open-source GitHub projects, with around 188k total samples and 10k vulnerable samples.
IV-B Baselines
In this paper, we compare PILOT with four representative weakly supervised learning methods in the PU setting and five state-of-the-art vulnerability detection methods in the supervised setting.
In RQ1, we compare PILOT with four weakly supervised learning methods in the PU setting:
-
1.
Cosine and Rocchio SVM (CR-SVM) [50]: CR-SVM extracts tf-idf and uses the cosine similarity between unlabeled and labeled samples. Then it uses the iterative SVM to select the optimal classifier.
-
2.
Unbiased PU (uPU) [51]: uPU treats the unlabeled sample as the sum of positive and negative samples with different weights, and constructs a risk estimator to train.
-
3.
Non-negative PU (nnPU) [52]: nnPU constructs a non-negative risk estimator based on the uPU, which adds a limitation to the loss function of risk estimator to alleviate the overfitting problems.
-
4.
Self-PU [53]: Self-PU is a self-paced learning algorithm, self-calibrated instance-awarded loss, and self-distillation strategy to train the model.
In RQ2, we adopt five state-of-the-art vulnerability detection approaches for comparison in the supervised learning setting, including:
-
1.
SySeVR [20]: SySeVR uses statements, program dependencies, and program slicing generated from source code, and utilizes a bidirectional recurrent neural network to vulnerability detection.
-
2.
Devign [23]: Devign constructs a joint graph by Abstract Syntax Tree (AST), CFG, DFG and Natural Code Sequence (NCS) and uses GGNN for vulnerability detection.
-
3.
Reveal [24]: Reveal divides vulnerability detection into two steps: feature extraction steps by GGNN and training steps by multi-layer perceptron and triplet loss.
-
4.
IVDetect [7]: IVDetect constructs a program dependency graph and utilizes a feature-attention graph convolutional network to learn the graph representation.
-
5.
LineVul [47]: LineVul trains on the Transformer architecture. To ensure fairness, we use the word-level tokenizer version for comparison.
IV-C Implementation Details
To ensure the fairness of the experiment, we use the same data split for all approaches. In the PU learning scenario, we randomly label 30% of the training positive samples based on the assumptions (Section II). We repeat the labeling scenario three times and use the mean as the experimental results. In the supervised learning scenario, we randomly partition the datasets into disjoint training, validation, and test sets in a ratio of 8:1:1.
We try our best to reproduce all baseline models from publicly available source code and papers, and use the same hyper-parameter settings as in the original text whenever possible.
We fine-tune the pre-trained model CodeBERT [47] with a learning rate of . The batch size is set to . The top nearest samples is set to 30% to choose prototype samples. The is set to 0.3. During each fine-tuning, we train our model on a server with NVIDIA A100-SXM4-40GB for maximum epochs of 5.
IV-D Evaluation Metrics
We use the following four commonly-used metrics to measure PILOT’s performance:
Precision: . The precision measures the percentage of true vulnerabilities out of all the vulnerabilities that are retrieved. and denote the number of true positives and false positives, respectively.
Recall: . The recall measures the percentage of vulnerable sample that are retrieved out of all vulnerable samples. and denote the number of true positives and false negatives, respectively.
F1 score: . The F1 score is the harmonic mean of precision and recall metrics.
Accuracy: . The accuracy measures the percentage of correctly classified samples out of all samples. represents the number of true negatives and represents the number of all samples.
V Experimental Results
| FFMPeg+Qemu [23] | Reveal [24] | Fan et al. [29] | ||||||||||
|---|---|---|---|---|---|---|---|---|---|---|---|---|
| Baseline | Accuracy | Precision | Recall | F1 score | Accuracy | Precision | Recall | F1 score | Accuracy | Precision | Recall | F1 score |
| Cosine and Rocchio SVM [50] | 48.99 | 45.83 | 60.80 | 52.21 | 86.10 | 7.87 | 9.12 | 7.80 | 85.66 | 9.57 | 6.18 | 6.72 |
| Unbiased PU [51] | 56.08 | 54.43 | 30.15 | 38.74 | 83.09 | 28.79 | 26.55 | 24.75 | 91.44 | 24.52 | 11.22 | 10.62 |
| Non-negative PU [52] | 56.01 | 50.20 | 41.96 | 46.60 | 83.07 | 28.93 | 27.18 | 25.38 | 91.45 | 25.15 | 10.77 | 9.79 |
| Self-PU [53] | 53.69 | 50.15 | 44.30 | 45.85 | 84.41 | 22.01 | 17.32 | 18.61 | 89.52 | 19.75 | 9.39 | 9.04 |
| PILOT | 58.38 | 54.66 | 55.48 | 54.99 | 86.99 | 40.83 | 47.34 | 43.82 | 91.92 | 29.05 | 30.30 | 29.55 |
V-A RQ1. Effectiveness of PILOT in PU setting
To answer RQ1, we compare PILOT with the four PU learning baseline methods with the four performance metrics (i.e. accuracy, precision, recall, and F1 score) on the three datasets. To ensure fairness in the experiment, the same labels are chosen for all the baseline methods, and we choose the labeled samples 3 times and report the averaged results. Table I shows the results, and the performance of PILOT is shown in the bottom row.
From Table I, we can find that PILOT outperforms all PU learning methods in detecting software vulnerabilities across all three datasets and obtains the best results in 11 out of 12 metrics. Specifically, PILOT achieves absolute improvements of 2.78%, 18.44%, and 18.93% over the F1 scores of the best baseline method on the FFMPeg+Qemu [23], Reveal [24] and Fan et al. [29] datasets, respectively. As for accuracy metric, PILOT outperforms baseline methods by at least 2.31%, 0.89%, and 0.47% on these three datasets, respectively. In the unbalanced dataset (i.e. Reveal and Fan et al.), PILOT achieves better performance in all four metrics (eight situations). This is due to the ability of PILOT to better extract high-quality pseudo-labels from unbalanced samples and detect vulnerabilities. Overall, PILOT can be able to detect more vulnerable samples and therefore proved to be more effective in PU settings.
Our results also show that the existing weakly supervised learning methods have much potential for improvement in the area of software vulnerability detection. They ignore the quality of the extracted pseudo-labels and the possible presence of noise in the vulnerability labels. Overall, our results demonstrate the superior performance of PILOT in detecting vulnerabilities, highlighting its potential to improve the effectiveness of computer security measures.
| FFMPeg+Qemu [23] | Reveal [24] | Fan et al.[29] | ||||||||||
|---|---|---|---|---|---|---|---|---|---|---|---|---|
| Baseline | Accuracy | Precision | Recall | F1 score | Accuracy | Precision | Recall | F1 score | Accuracy | Precision | Recall | F1 score |
| SySeVR | 47.85 | 46.06 | 58.81 | 51.66 | 74.33 | 40.07 | 24.94 | 30.74 | 90.10 | 30.91 | 14.08 | 19.34 |
| Devign | 56.89 | 52.50 | 64.67 | 57.95 | 87.49 | 31.55 | 36.65 | 33.91 | 92.78 | 30.61 | 15.96 | 20.98 |
| Reveal | 61.07 | 55.50 | 70.70 | 62.19 | 81.77 | 31.55 | 61.14 | 41.62 | 87.14 | 17.22 | 34.04 | 22.87 |
| IVDetect | 57.26 | 52.37 | 57.55 | 54.84 | - | - | - | - | - | - | - | - |
| LineVul | 62.37 | 61.55 | 48.21 | 54.07 | 87.51 | 43.63 | 56.15 | 49.10 | 94.44 | 50.5 | 28.53 | 36.46 |
| PILOT | 63.14 | 58.23 | 69.88 | 63.53 | 88.96 | 49.14 | 82.38 | 61.56 | 92.70 | 38.00 | 42.56 | 39.46 |
V-B RQ2. Effectiveness of PILOT in supervised setting
To answer RQ2, we compare PILOT with the five vulnerability detection methods on the three datasets in supervised learning settings. All baselines use the labels of the positive and negative samples to train the binary classifier.
Table II shows the results of the vulnerability detection baselines. We can find that PILOT has the best performance in 8 out of 12 cases. For example, on Reveal, PILOT outperforms the best baseline methods by 1.45%, 5.51%, 21.24%, and 12.46% regarding the accuracy, precision, recall, and F1 score, respectively. Compared with the average of previous vulnerability detection methods, PILOT achieves absolute improvement of 4.61%, 7.59%, 22.32%, and 14.88% with respect to the four metrics, respectively.
Our results also show that the graph-based approaches (Devign, Reveal, and IVDetect) perform similarly to PILOT when the samples with vulnerabilities or not are balanced. However, in scenarios where the datasets are unbalanced, the performance of graph-based approaches is worse than PILOT. It may be due to the fact that the graph-based model approaches are hard to capture structural information (e.g., data flow graph and control flow graph) in unbalanced scenarios [54].
The improvement of the experiment is non-trivial, the PILOT only selects positive and unlabeled samples in the PU setting. In contrast, all of the vulnerability detection baselines use all labels in the training process.
V-C RQ3. Effectiveness of different components in PILOT
In this section, we explore the impact of different components on the performance of PILOT. Specifically, we study the two involved modules including the Distance-aware Label Selection (DLS) module and Mixed-supervision Representation Learning module (MRL) module.
| Dataset | Module | Accuracy | F1 score |
|---|---|---|---|
| FFMPeg+Qemu | w/o ID Prototype | 56.30 | 47.35 |
| w/o PFine-tuning | 56.77 | 58.17 | |
| w/o MRL | 58.71 | 55.49 | |
| PILOT | 59.30 | 57.23 | |
| Reveal | w/o ID Prototype | 73.97 | 41.27 |
| w/o PFine-tuning | 60.47 | 32.66 | |
| w/o MRL | 80.43 | 48.20 | |
| PILOT | 85.79 | 54.18 | |
| Fan | w/o ID Prototype | 72.90 | 21.83 |
| w/o PFine-tuning | 57.43 | 18.09 | |
| w/o MRL | 77.77 | 24.19 | |
| PILOT | 87.62 | 28.70 |
V-C1 Distance-aware Label Selection Module
To explore the contribution of the DLS module, we create two variants of PILOT without inter-class distance prototype (i.e. ID Prototype) and progressive fine-tuning (i.e. PFine-tuning), respectively. The other settings of these two vairants are consistent with PILOT. The purpose of the DLS module is to select high-quality labels from unlabeled samples, which requires at least one of the components to construct a binary classifier. Therefore, we separate two variants for the ablation experiments.
As shown in Table III, both ID Prototype and PFine-tuning components can improve the performance of PILOT on all datasets. Specifically, on the unbalanced datasets (i.e. Reveal and Fan et al.), PFine-tuning component achieves an average improvement of 27.76% and 16.07% in terms of accuracy and F1 score, respectively; while ID Prototype only boosts by 13.27% and 9.89%. This indicates that PFine-tuning has a greater effect on the unbalanced dataset. Conversely, on the balanced dataset (i.e. FFMPeg+Qemu), ID Prototype obtains improvements of 3.00% and 9.88% respectively, which outweighs the improvements of PFine-tuning. The results demonstrate that different components of the DLS module focus on the different situations to select high-quality samples, which benefit the performance of vulnerability detection.
V-C2 Mixed-supervision Representation Learning Module
To understand the impact of MRL module, we also deploy a variant of PILOT without the MRL module. Since the above module already constitutes the training of classifier, the variant (i.e. w/o MRL) directly eliminates the training of the MRL module.
Table III shows the performance of the variant on the three datasets. Overall, the accuracy, and F1 score in three datasets achieve higher values with the addition of the MRL module. The MRL module improves the accuracy by 0.59%, 5.36%, and 9.85% on FFMPeg+Qemu, Reveal, and Fan et al.. datasets, respectively. As for the F1 score, the MRL module also brings an improvement of 1.74%, 5.98%, and 4.51% on these three datasets, respectively. The results indicate that MRL module can enhance the discriminative power of the vulnerability representation and bring a performance improvement in vulnerability detection.
V-D RQ4: Influences of Hyper-parameters on PILOT
To answer RQ4, we explore the impact of different hyper-parameters, including the labeling ratio and the top samples chosen in the inter-class distance prototype.
V-D1 Ratio of positive labeling
Table IV shows the performance of PILOT on four metrics with different ratios of positive labeling samples. It means that all negative samples and unlabeled positive samples are considered unlabeled samples. As the ratio of labeling increases, the performance of PILOT also increases gradually. PILOT achieves the best performance when all the positive samples are used as labeling samples. Compared with the performance of the 10% labeling ratio, the 100% labeling ratio can improve it by 14.13%, 20.62%, 11.00%, and 20.80% on four metrics, respectively. It demonstrates that it is important to have a larger number of positive samples to improve the discriminative ability of prototypes formed by positive samples. Additionally, extracted high-quality negative samples are more believable by increasing positive samples, leading to better overall performance.
When dealing with unbalanced datasets such as Reveal and Fan, we observe that performance increases faster when the proportion of labeled samples is below 30%. However, the growth rate of performance decreases as the number of labeled samples continues to increase. In contrast, the growth of performance in FFMPeg+Qemu is more balanced since the limited number of negative samples makes it more difficult to capture high-quality labeled samples.
| Dataset | FFMPeg+Qemu [23] | Reveal [24] | Fan et al.[29] | |||||||||
|---|---|---|---|---|---|---|---|---|---|---|---|---|
| Ratio | Accuracy | Precision | Recall | F1 score | Accuracy | Precision | Recall | F1 score | Accuracy | Precision | Recall | F1 score |
| 10% | 55.93 | 51.93 | 54.66 | 53.26 | 64.69 | 17.46 | 61.48 | 27.20 | 82.08 | 14.08 | 43.22 | 21.24 |
| 30% | 58.38 | 54.66 | 55.48 | 54.99 | 83.96 | 35.11 | 47.40 | 39.75 | 90.17 | 23.97 | 34.84 | 28.40 |
| 50% | 59.77 | 56.54 | 53.71 | 55.09 | 84.43 | 39.46 | 84.43 | 53.79 | 87.20 | 22.11 | 51.09 | 30.86 |
| 70% | 60.65 | 57.38 | 55.78 | 56.57 | 86.41 | 43.10 | 83.20 | 56.78 | 90.01 | 27.85 | 49.38 | 35.61 |
| 100% | 63.14 | 58.23 | 69.88 | 63.53 | 88.96 | 49.14 | 82.38 | 61.56 | 92.99 | 37.97 | 40.10 | 39.00 |
V-D2 Top samples of inter-class distance prototype
We also explore the effect of the number of Top samples of the inter-class distance prototype of PILOT. As shown in Table V, it shows the number and its corresponding accuracy in selecting high-quality negative samples. The higher the accuracy of the recognition, the higher quality of the identified labeled samples is.
Overall, the larger the number of will lead to higher accuracy. However, the number of labels with greater than 30% ratio of labeled samples reaches the recognition accuracy of 75.18%, 99.34%, and 99.24% in the three datasets, respectively, and the growth rate gradually converges to 0. Therefore, in order to reduce computational resource consumption, we choose the 30% ratio of labeled samples as the value of .
In addition, we also present the number of high-quality negative samples (i.e. Num) in Table V. From the results, we can observe that different selections of lead to different sum and mean of the prototype distance (i.e. and ) for sample , leading to differences in the number of high-quality samples selected. For example, the value of 100% selects 7.18%, 7.74%, and 11.76% more high-quality samples than the value of 3. Overall, the higher the value of , the smaller the difference between the and is, and the more high-quality samples are selected.
| Dataset | Devign | Reveal | Fan | |||
|---|---|---|---|---|---|---|
| Acc(%) | Num | Acc(%) | Num | Acc(%) | Num | |
| 3 | 73.03 | 5210 | 99.21 | 4822 | 95.67 | 39564 |
| 5 | 73.25 | 5211 | 99.20 | 4770 | 95.67 | 39438 |
| 30% | 75.18 | 5560 | 99.34 | 5172 | 99.24 | 44264 |
| 50% | 75.25 | 5563 | 99.42 | 5194 | 99.26 | 44279 |
| 100% | 75.30 | 5584 | 99.44 | 5195 | 99.28 | 44217 |
VI Discussion
VI-A Why does PILOT Work?
We identify the advantages of PILOT, which can explain its effectiveness in software vulnerability detection. We also show the two types of incorrectly labeled samples in FFMPeg+Qemu [24].
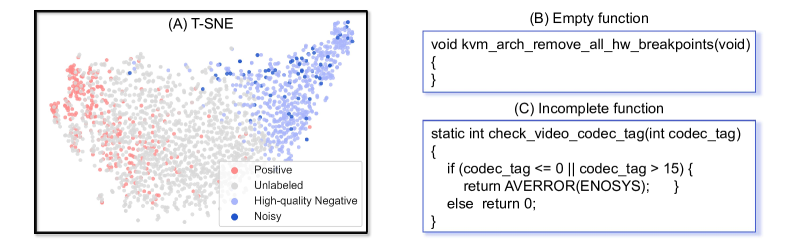
(1) PILOT is able to identify high-quality samples. The proposed DLS module helps PILOT to select high-quality samples from unlabeled samples, which involves the inter-class distance prototype and progressive fine-tuning to identify high-quality samples. As shown in Figure 3(A), the T-SNE of sample distribution illustrates the distinct class discriminability between positive samples and high-quality negative samples. It demonstrates the effectiveness of PILOT. The experimental results show that PILOT can be able to identify 75.18%, 99.34%, and 99.24% high-quality samples in FFMPeg+Qemu, Reveal, and Fan et al., respectively. Overall, as the number of labeled samples increases, the number of high-quality samples and the accuracy rate also increase.
(2) PILOT well leverages the mislabeled data. PILOT also pinpoints the labels that are originally mislabeled in the FFMPeg+Qemu [23]. Specifically, we explore the incorrectly identified high-quality samples in PILOT. By manually examining the code and corresponding labels. We randomly select 200 code samples which are associated with different pseudo-labels generated by PILOT and ground truth from FFMPeg+Qemu for manual checking. To guarantee the quality of the manual checking, one author and two developers joined to label the data, and each of them possess over five years of software development experience. The two developers independently labeled the samples for the presence of vulnerabilities. For the disagreement, the author intervened as a mediator to achieve a consensus. The manual checking shows that the PILOT finds 23 mislabeled samples in the dataset.
We broadly classify these mislabeled samples into two categories: 4(2%) null functions and 19(9.5%) unimplemented functions. Figure 3(B) shows a sample obtained in the FFMPeg+Qemu dataset with an empty function for this code sample. This sample does not have any syntax errors, but is mislabeled as positive. Figure 3(C) shows an example of the unimplemented function, which does not involve any vulnerability but is labeled as positive in the dataset. The case analysis shows that PILOT is able to well leverage the mislabeled data for more accurate vulnerability detection.
VI-B Comparison with Trovon
The recent approach Trovon [56] also aims at mitigating the data noise issue in vulnerability detection. It trains a Seq2seq model [57] based on the code fragment pairs (i.e., the pairs of vulnerable and fixed samples). Our proposed PILOT is essentially different from Trovon in the following aspects:
(1) Training data. The approaches of Trovon [56] and PILOT exhibit significant disparities in the training data. Trovon utilizes a training set that comprises both before-fix (vulnerable) and after-fix (non-vulnerable) pairs to construct a classifier, aiming at investigating the distinctions between these two sets. In contrast, PILOT only utilizes the vulnerable samples as the training data based on the assumption that non-vulnerable samples potentially contain noisy data [32, 33]. Remarkably, PILOT pioneers the positive and unlabeled learning problem in the software vulnerability detection field. The approach involves a distance-aware label selection module and relies on high-quality vulnerable samples in the training process. Furthermore, PILOT incorporates a mixed-supervision representation learning module to continuously train classifiers. These processes help mitigate the impact of noisy labels in vulnerability detection.
(2) Handling of the Noise Issue. Trovon and PILOT address the noise issue in different ways. Specifically, Trovon adopts a methodology to exclusively employ after-fix (non-vulnerable) and before-fix (vulnerable) samples for minimizing noise within the training dataset. However, even after the fixing process, latent vulnerabilities may still persist in the data. This was also highlighted in Croft’s work [32], which revealed that non-vulnerable labels tend to be of subpar quality. Therefore, PILOT evaluates the quality of non-vulnerable labels before usage. Specifically, PILOT incorporates a distance-aware label selection module, which generates pseudo-labels to assist in evaluating the quality of non-vulnerable labels.
(3) Treatment of the Data Scarcity Issue. Another noteworthy aspect of PILOT is its ability to achieve high performance with only a small amount of labeled data. Trovon relies on a large amount of labeled data to build the classifier. Conversely, PILOT utilizes a semi-supervised learning method that demands only a limited number of labeled data. PILOT involves an inter-class distance prototype component derived from a small part of high-quality positive data. Subsequently, it involves a progressive fine-tuning process for further learning.
In summary, the proposed PILOT is novel in its methodology design, and significantly different from Trovon in the training data, handling of the noise issue, and treatment of the data scarcity issue.
VI-C Threats and Limitations
One threat to validity comes from the dataset we construct. Following the positive and unlabeled learning setting, we construct a dataset with unknown labels on the existing dataset using only a portion of the positive labels. However, we do not use external unknown data. In the future, we will further collect a larger benchmark for evaluation.
The second threat to validity is the implementation of baselines. We try our best to replicate these weakly supervised in the PU setting based on the open-source code and the original paper to achieve the best experimental results.
Another validity to threat comes from the selection of positive samples. As we only use a part of the positive labeled samples, the selection of these samples affects the performance of PILOT. We therefore repeatedly select these samples at random and take the average as the experimental results.
VII Related Work
VII-A Software Vulnerability Detection
Software vulnerability detection is critical for ensuring software security by identifying and mitigating potential security risks. Nowadays, learning-based software vulnerability detection, as opposed to program analysis methods [58, 16, 14, 15], has been shown to be more effective in identifying more types and numbers of vulnerabilities. Learning-based vulnerability detection techniques can be broadly classified into two categories based on the representation of source code and the learning model utilized: sequence-based and graph-based methods.
Sequence-based vulnerability detection methods [59, 60, 61, 62, 63] convert code into token sequences. For example, VulDeepecker [21] uses code gadgets as the granularity to train a classifier using a bidirectional (Bi)-LSTM network. Russell et al. [22] utilize Convolutional Neural Networks (CNNs) and Recurrent Neural Networks (RNNs) to fuse different features from function-level source code. SySeVR [20] extracts code gadgets by traversing AST generated from code and also uses a Bi-LSTM network.
Graph-based methods [64, 65, 66, 67, 68, 69, 70] represent software code as graphs and use Graph Neutral Networks (GNNs) for software vulnerability detection. CPGVA [71] combines the AST, CFG, and DFG and generates the code property graph (CPG) to vulnerability detection. Devign adds Natural Code Sequence (NCS) to the CPG and leverages the Gated Graph Neutral Networks (GGNNs), which preserve the programming logic of the source code.
However, all these existing vulnerability detection methods require a large amount of labeled positive and negative samples and fail to achieve good performance with a small labeled size. In this paper, we propose a positive and unlabeled learning model for vulnerability detection for the scenarios without enough labeled data.
VII-B PU Learning
Positive and Unlabeled (PU) learning setting is a weakly supervised learning scenario that aims to learn a classifier with only positive and unlabeled samples [34, 72, 73, 74, 75]. An effective approach [76, 77, 78] considers unlabeled samples as negative samples with noise, and it is common practice to assign small weights to them. For instance, Lee et al. [79] use weighted logistic regression to learn from positive and unlabeled examples. Another popular approach [80, 81, 82] involves incorporating knowledge of class priors into the training process, which adjusts the decision threshold of the classifier based on the estimated class prior probabilities. Ward et al. [83] propose an expectation-maximization algorithm by class prior. Bekker et al. [84] propose a decision tree induction method for straightforward and efficient class prior estimation.
In this paper, we propose a novel PU setting on software vulnerability detection. We also propose a distance-aware label selection module for correctly providing pseudo-label and a mixed-supervision representation learning module for better alleviating the influence of noise.
VIII Conclusion
This paper focuses on the positive and unlabeled learning problem for vulnerability detection and proposes a novel model, named PILOT. PILOT consists of a distance-aware label selection for generating pseudo-labels and a mixed-supervision representation learning module to alleviate the influence of noise. Compared with the state-of-the-art methods, the experimental results on three popular datasets validate the effectiveness of PILOT in PU and supervised settings. In future, we will further collect a larger benchmark and obtain more data for vulnerability detection.
Our source code as well as experimental data are available at: https://github.com/PILOT-VD-2023/PILOT.
Acknowledgment
This research is supported by National Key R&D Program of China (No. 2022YFB3103900), National Natural Science Foundation of China under project (No. 62002084), Natural Science Foundation of Guangdong Province (Project No. 2023A1515011959), Shenzhen Basic Research (General Project No. JCYJ20220531095214031), and the Major Key Project of PCL (Grant No. PCL2022A03).
References
- [1] D. McKee et al., “Trellix advanced research center patches 61,000 vulnerable open-source projects–global security mag online,” 2023.
- [2] G. Lin, S. Wen, Q. Han, J. Zhang, and Y. Xiang, “Software vulnerability detection using deep neural networks: A survey,” Proc. IEEE, vol. 108, no. 10, pp. 1825–1848, 2020.
- [3] D. A. Wheeler, “Flawfinder,” [n.d.]. [Online]. Available: https://dwheeler.com/flawfinder/
- [4] Facebook, “Infer,” [n.d.]. [Online]. Available: https://fbinfer.com/.
- [5] Israel, “Checkmarx,” [n.d.]. [Online]. Available: https://www.checkmarx.com/.
- [6] V. Nguyen, D. Q. Nguyen, V. Nguyen, T. Le, Q. H. Tran, and D. Q. Phung, “Regvd: Revisiting graph neural networks for vulnerability detection,” CoRR, vol. abs/2110.07317, 2021.
- [7] Y. Li, S. Wang, and T. N. Nguyen, “Vulnerability detection with fine-grained interpretations,” in ESEC/SIGSOFT FSE. ACM, 2021, pp. 292–303.
- [8] D. Hin, A. Kan, H. Chen, and M. A. Babar, “Linevd: Statement-level vulnerability detection using graph neural networks,” in MSR. ACM, 2022, pp. 596–607.
- [9] S. Cao, X. Sun, L. Bo, R. Wu, B. Li, and C. Tao, “MVD: memory-related vulnerability detection based on flow-sensitive graph neural networks,” CoRR, vol. abs/2203.02660, 2022.
- [10] S. Gao, C. Gao, C. Wang, J. Sun, D. Lo, and Y. Yu, “Two sides of the same coin: Exploiting the impact of identifiers in neural code comprehension,” in 45th IEEE/ACM International Conference on Software Engineering, ICSE 2023, Melbourne, Australia, May 14-20, 2023. IEEE, 2023, pp. 1933–1945.
- [11] A. Inc, “Clang static analyzer,” [n.d.]. [Online]. Available: https://clang-analyzer.llvm.org/scan-build.html
- [12] J. Viega, J. T. Bloch, Y. Kohno, and G. McGraw, “ITS4: A static vulnerability scanner for C and C++ code,” in 16th Annual Computer Security Applications Conference (ACSAC 2000), 11-15 December 2000, New Orleans, Louisiana, USA. IEEE Computer Society, 2000, p. 257.
- [13] Y. Sui and J. Xue, “SVF: interprocedural static value-flow analysis in LLVM,” in Proceedings of the 25th International Conference on Compiler Construction, CC 2016, Barcelona, Spain, March 12-18, 2016, A. Zaks and M. V. Hermenegildo, Eds. ACM, 2016, pp. 265–266.
- [14] J. Pewny, F. Schuster, L. Bernhard, T. Holz, and C. Rossow, “Leveraging semantic signatures for bug search in binary programs,” in Proceedings of the 30th Annual Computer Security Applications Conference, ACSAC 2014. ACM, 2014, pp. 406–415.
- [15] G. Portokalidis, A. Slowinska, and H. Bos, “Argos: an emulator for fingerprinting zero-day attacks for advertised honeypots with automatic signature generation,” in Proceedings of the 2006 EuroSys Conference, Leuven, Belgium, April 18-21, 2006. ACM, 2006, pp. 15–27.
- [16] R. Baldoni, E. Coppa, D. C. D’Elia, C. Demetrescu, and I. Finocchi, “A survey of symbolic execution techniques,” ACM Comput. Surv., vol. 51, no. 3, pp. 50:1–50:39, 2018.
- [17] D. Larochelle and D. Evans, “Statically detecting likely buffer overflow vulnerabilities,” in 10th USENIX Security Symposium, August 13-17, 2001, Washington, D.C., USA, D. S. Wallach, Ed. USENIX, 2001.
- [18] S. W. Boyd and A. D. Keromytis, “Sqlrand: Preventing SQL injection attacks,” in Applied Cryptography and Network Security, Second International Conference, ACNS 2004, Yellow Mountain, China, June 8-11, 2004, Proceedings, ser. Lecture Notes in Computer Science, M. Jakobsson, M. Yung, and J. Zhou, Eds., vol. 3089. Springer, 2004, pp. 292–302.
- [19] X. Cheng, G. Zhang, H. Wang, and Y. Sui, “Path-sensitive code embedding via contrastive learning for software vulnerability detection,” in ISSTA ’22: 31st ACM SIGSOFT International Symposium on Software Testing and Analysis, Virtual Event, South Korea, July 18 - 22, 2022, S. Ryu and Y. Smaragdakis, Eds. ACM, 2022, pp. 519–531.
- [20] Z. Li, D. Zou, S. Xu, H. Jin, Y. Zhu, and Z. Chen, “Sysevr: A framework for using deep learning to detect software vulnerabilities,” IEEE Trans. Dependable Secur. Comput., vol. 19, no. 4, pp. 2244–2258, 2022.
- [21] Z. Li, D. Zou, S. Xu, X. Ou, H. Jin, S. Wang, Z. Deng, and Y. Zhong, “Vuldeepecker: A deep learning-based system for vulnerability detection,” in 25th Annual Network and Distributed System Security Symposium, NDSS 2018, San Diego, California, USA, February 18-21, 2018. The Internet Society, 2018.
- [22] R. L. Russell, L. Y. Kim, L. H. Hamilton, T. Lazovich, J. Harer, O. Ozdemir, P. M. Ellingwood, and M. W. McConley, “Automated vulnerability detection in source code using deep representation learning,” in ICMLA. IEEE, 2018, pp. 757–762.
- [23] Y. Zhou, S. Liu, J. K. Siow, X. Du, and Y. Liu, “Devign: Effective vulnerability identification by learning comprehensive program semantics via graph neural networks,” in Advances in Neural Information Processing Systems 32: Annual Conference on Neural Information Processing Systems 2019, NeurIPS 2019, 2019, pp. 10 197–10 207.
- [24] S. Chakraborty, R. Krishna, Y. Ding, and B. Ray, “Deep learning based vulnerability detection: Are we there yet?” CoRR, vol. abs/2009.07235, 2020.
- [25] C. Cummins, Z. V. Fisches, T. Ben-Nun, T. Hoefler, M. F. P. O’Boyle, and H. Leather, “Programl: A graph-based program representation for data flow analysis and compiler optimizations,” in Proceedings of the 38th International Conference on Machine Learning, ICML 2021, 18-24 July 2021, Virtual Event, ser. Proceedings of Machine Learning Research, M. Meila and T. Zhang, Eds., vol. 139. PMLR, 2021, pp. 2244–2253.
- [26] X. Huo, M. Li, and Z. Zhou, “Control flow graph embedding based on multi-instance decomposition for bug localization,” in The Thirty-Fourth AAAI Conference on Artificial Intelligence, AAAI 2020, The Thirty-Second Innovative Applications of Artificial Intelligence Conference, IAAI 2020, The Tenth AAAI Symposium on Educational Advances in Artificial Intelligence, EAAI 2020, New York, NY, USA, February 7-12, 2020. AAAI Press, 2020, pp. 4223–4230.
- [27] Z. Han, X. Li, Z. Xing, H. Liu, and Z. Feng, “Learning to predict severity of software vulnerability using only vulnerability description,” in 2017 IEEE International Conference on Software Maintenance and Evolution, ICSME 2017, Shanghai, China, September 17-22, 2017. IEEE Computer Society, 2017, pp. 125–136.
- [28] N. Jovanovic, C. Kruegel, and E. Kirda, “Precise alias analysis for static detection of web application vulnerabilities,” in Proceedings of the 2006 Workshop on Programming Languages and Analysis for Security, PLAS 2006, Ottawa, Ontario, Canada, June 10, 2006, V. C. Sreedhar and S. Zdancewic, Eds. ACM, 2006, pp. 27–36.
- [29] J. Fan, Y. Li, S. Wang, and T. N. Nguyen, “A C/C++ code vulnerability dataset with code changes and CVE summaries,” in MSR ’20: 17th International Conference on Mining Software Repositories, Seoul, Republic of Korea, 29-30 June, 2020, S. Kim, G. Gousios, S. Nadi, and J. Hejderup, Eds. ACM, 2020, pp. 508–512.
- [30] Y. Zheng, S. Pujar, B. L. Lewis, L. Buratti, E. A. Epstein, B. Yang, J. Laredo, A. Morari, and Z. Su, “D2A: A dataset built for ai-based vulnerability detection methods using differential analysis,” in 43rd IEEE/ACM International Conference on Software Engineering: Software Engineering in Practice, ICSE (SEIP) 2021, Madrid, Spain, May 25-28, 2021. IEEE, 2021, pp. 111–120.
- [31] R. Croft, M. A. Babar, and M. M. Kholoosi, “Data quality for software vulnerability datasets,” CoRR, vol. abs/2301.05456, 2023.
- [32] R. Croft, Y. Xie, and M. A. Babar, “Data preparation for software vulnerability prediction: A systematic literature review,” IEEE Trans. Software Eng., vol. 49, no. 3, pp. 1044–1063, 2023.
- [33] R. Croft, M. A. Babar, and H. Chen, “Noisy label learning for security defects,” in 19th IEEE/ACM International Conference on Mining Software Repositories, MSR 2022, Pittsburgh, PA, USA, May 23-24, 2022. ACM, 2022, pp. 435–447.
- [34] J. Bekker and J. Davis, “Learning from positive and unlabeled data: a survey,” Mach. Learn., vol. 109, no. 4, pp. 719–760, 2020.
- [35] E. Cole, O. M. Aodha, T. Lorieul, P. Perona, D. Morris, and N. Jojic, “Multi-label learning from single positive labels,” in IEEE Conference on Computer Vision and Pattern Recognition, CVPR 2021, virtual, June 19-25, 2021. Computer Vision Foundation / IEEE, 2021, pp. 933–942.
- [36] O. Pantazis, G. J. Brostow, K. E. Jones, and O. M. Aodha, “Focus on the positives: Self-supervised learning for biodiversity monitoring,” in 2021 IEEE/CVF International Conference on Computer Vision, ICCV 2021, Montreal, QC, Canada, October 10-17, 2021. IEEE, 2021, pp. 10 563–10 572.
- [37] C. Elkan and K. Noto, “Learning classifiers from only positive and unlabeled data,” in Proceedings of the 14th ACM SIGKDD International Conference on Knowledge Discovery and Data Mining, Las Vegas, Nevada, USA, August 24-27, 2008, Y. Li, B. Liu, and S. Sarawagi, Eds. ACM, 2008, pp. 213–220.
- [38] B. Liu, W. S. Lee, P. S. Yu, and X. Li, “Partially supervised classification of text documents,” in Machine Learning, Proceedings of the Nineteenth International Conference (ICML 2002), University of New South Wales, Sydney, Australia, July 8-12, 2002, C. Sammut and A. G. Hoffmann, Eds. Morgan Kaufmann, 2002, pp. 387–394.
- [39] G. Blanchard, G. Lee, and C. Scott, “Semi-supervised novelty detection,” J. Mach. Learn. Res., vol. 11, pp. 2973–3009, 2010.
- [40] X. Li and B. Liu, “Learning to classify texts using positive and unlabeled data,” in IJCAI-03, Proceedings of the Eighteenth International Joint Conference on Artificial Intelligence, Acapulco, Mexico, August 9-15, 2003, G. Gottlob and T. Walsh, Eds. Morgan Kaufmann, 2003, pp. 587–594.
- [41] K. Pelckmans and J. A. K. Suykens, “Transductively learning from positive examples only,” in 17th European Symposium on Artificial Neural Networks, ESANN 2009, Bruges, Belgium, April 22-24, 2009, Proceedings, 2009.
- [42] C. Gong, T. Liu, J. Yang, and D. Tao, “Large-margin label-calibrated support vector machines for positive and unlabeled learning,” IEEE Trans. Neural Networks Learn. Syst., vol. 30, no. 11, pp. 3471–3483, 2019.
- [43] H. Assal, S. Chiasson, and R. Biddle, “Cesar: Visual representation of source code vulnerabilities,” in 13th IEEE Symposium on Visualization for Cyber Security, VizSec 2016, Baltimore, MD, USA, October 24, 2016, D. M. Best, D. Staheli, N. Prigent, S. Engle, and L. Harrison, Eds. IEEE Computer Society, 2016, pp. 1–8.
- [44] “Divide by zero,” [n.d.]. [Online]. Available: https://cwe.mitre.org/data/definitions/369.html
- [45] X. Cheng, X. Nie, N. Li, H. W. Z. Zheng, and Y. Sui, “How about bug-triggering paths?-understanding and characterizing learning-based vulnerability detectors.” IEEE, 2022.
- [46] D. Zou, S. Wang, S. Xu, Z. Li, and H. Jin, “vuldeepecker: A deep learning-based system for multiclass vulnerability detection,” IEEE Trans. Dependable Secur. Comput., vol. 18, no. 5, pp. 2224–2236, 2021.
- [47] Z. Feng, D. Guo, D. Tang, N. Duan, X. Feng, M. Gong, L. Shou, B. Qin, T. Liu, D. Jiang, and M. Zhou, “Codebert: A pre-trained model for programming and natural languages,” in Findings of the Association for Computational Linguistics: EMNLP 2020, Online Event, 16-20 November 2020, ser. Findings of ACL, T. Cohn, Y. He, and Y. Liu, Eds., vol. EMNLP 2020. Association for Computational Linguistics, 2020, pp. 1536–1547.
- [48] S. Lu, D. He, C. Xiong, G. Ke, W. Malik, Z. Dou, P. Bennett, T. Liu, and A. Overwijk, “Less is more: Pretrain a strong siamese encoder for dense text retrieval using a weak decoder,” in Proceedings of the 2021 Conference on Empirical Methods in Natural Language Processing, EMNLP 2021, Virtual Event / Punta Cana, Dominican Republic, 7-11 November, 2021, M. Moens, X. Huang, L. Specia, and S. W. Yih, Eds. Association for Computational Linguistics, 2021, pp. 2780–2791.
- [49] K. He, H. Fan, Y. Wu, S. Xie, and R. B. Girshick, “Momentum contrast for unsupervised visual representation learning,” in 2020 IEEE/CVF Conference on Computer Vision and Pattern Recognition, CVPR 2020, Seattle, WA, USA, June 13-19, 2020. Computer Vision Foundation / IEEE, 2020, pp. 9726–9735.
- [50] X. Li, B. Liu, and S. Ng, “Negative training data can be harmful to text classification,” in EMNLP. ACL, 2010, pp. 218–228.
- [51] M. C. du Plessis, G. Niu, and M. Sugiyama, “Analysis of learning from positive and unlabeled data,” in NIPS, 2014, pp. 703–711.
- [52] R. Kiryo, G. Niu, M. C. du Plessis, and M. Sugiyama, “Positive-unlabeled learning with non-negative risk estimator,” in NIPS, 2017, pp. 1675–1685.
- [53] X. Chen, W. Chen, T. Chen, Y. Yuan, C. Gong, K. Chen, and Z. Wang, “Self-pu: Self boosted and calibrated positive-unlabeled training,” in ICML, ser. Proceedings of Machine Learning Research, vol. 119. PMLR, 2020, pp. 1510–1519.
- [54] G. Du, J. Zhang, M. Jiang, J. Long, Y. Lin, S. Li, and K. C. Tan, “Graph-based class-imbalance learning with label enhancement,” IEEE Transactions on Neural Networks and Learning Systems, pp. 1–15, 2021.
- [55] V. der Maaten, Laurens, and H. Geoffrey, “Visualizing data using t-sne.” Journal of machine learning research, vol. 9, no. 11, 2008.
- [56] A. Garg, R. Degiovanni, M. Jimenez, M. Cordy, M. Papadakis, and Y. L. Traon, “Learning from what we know: How to perform vulnerability prediction using noisy historical data,” Empir. Softw. Eng., vol. 27, no. 7, p. 169, 2022.
- [57] M. Abadi, A. Agarwal, P. Barham, E. Brevdo, Z. Chen, C. Citro, G. S. Corrado, A. Davis, J. Dean, M. Devin, S. Ghemawat, I. J. Goodfellow, A. Harp, G. Irving, M. Isard, Y. Jia, R. Józefowicz, L. Kaiser, M. Kudlur, J. Levenberg, D. Mané, R. Monga, S. Moore, D. G. Murray, C. Olah, M. Schuster, J. Shlens, B. Steiner, I. Sutskever, K. Talwar, P. A. Tucker, V. Vanhoucke, V. Vasudevan, F. B. Viégas, O. Vinyals, P. Warden, M. Wattenberg, M. Wicke, Y. Yu, and X. Zheng, “Tensorflow: Large-scale machine learning on heterogeneous distributed systems,” CoRR, vol. abs/1603.04467, 2016.
- [58] J. Jang, M. Woo, and D. Brumley, “Redebug: Finding unpatched code clones in entire OS distributions,” login Usenix Mag., vol. 37, no. 6, 2012.
- [59] H. K. Dam, T. Tran, T. Pham, S. W. Ng, J. Grundy, and A. Ghose, “Automatic feature learning for vulnerability prediction,” CoRR, vol. abs/1708.02368, 2017.
- [60] F. Wu, J. Wang, J. Liu, and W. Wang, “Vulnerability detection with deep learning,” in 2017 3rd IEEE International Conference on Computer and Communications (ICCC), 2017, pp. 1298–1302.
- [61] G. Grieco, G. L. Grinblat, L. C. Uzal, S. Rawat, J. Feist, and L. Mounier, “Toward large-scale vulnerability discovery using machine learning,” in CODASPY. ACM, 2016, pp. 85–96.
- [62] X. Li, L. Wang, Y. Xin, Y. Yang, and Y. Chen, “Automated vulnerability detection in source code using minimum intermediate representation learning,” Applied Sciences, vol. 10, no. 5, 2020.
- [63] C. Wang, Y. Yang, C. Gao, Y. Peng, H. Zhang, and M. R. Lyu, “No more fine-tuning? an experimental evaluation of prompt tuning in code intelligence,” in Proceedings of the 30th ACM Joint European Software Engineering Conference and Symposium on the Foundations of Software Engineering, ESEC/FSE 2022, Singapore, Singapore, November 14-18, 2022, A. Roychoudhury, C. Cadar, and M. Kim, Eds. ACM, 2022, pp. 382–394.
- [64] Y. Wu, D. Zou, S. Dou, W. Yang, D. Xu, and H. Jin, “Vulcnn: An image-inspired scalable vulnerability detection system,” in ICSE. ACM, 2022, pp. 2365–2376.
- [65] X. Duan, J. Wu, S. Ji, Z. Rui, T. Luo, M. Yang, and Y. Wu, “Vulsniper: Focus your attention to shoot fine-grained vulnerabilities,” in IJCAI. ijcai.org, 2019, pp. 4665–4671.
- [66] H. Wang, G. Ye, Z. Tang, S. H. Tan, S. Huang, D. Fang, Y. Feng, L. Bian, and Z. Wang, “Combining graph-based learning with automated data collection for code vulnerability detection,” IEEE Trans. Inf. Forensics Secur., vol. 16, pp. 1943–1958, 2021.
- [67] A. V. Phan, M. L. Nguyen, and L. T. Bui, “Convolutional neural networks over control flow graphs for software defect prediction,” in ICTAI. IEEE Computer Society, 2017, pp. 45–52.
- [68] S. Cao, X. Sun, L. Bo, Y. Wei, and B. Li, “BGNN4VD: Constructing bidirectional graph neural-network for vulnerability detection,” Inf. Softw. Technol., vol. 136, p. 106576, 2021.
- [69] X. Wen, Y. Chen, C. Gao, H. Zhang, J. M. Zhang, and Q. Liao, “Vulnerability detection with graph simplification and enhanced graph representation learning,” in 45th IEEE/ACM International Conference on Software Engineering, ICSE 2023, Melbourne, Australia, May 14-20, 2023. IEEE, 2023, pp. 2275–2286.
- [70] X. Wen, C. Gao, J. Ye, Z. Tian, Y. Jia, and X. Wang, “Meta-path based attentional graph learning model for vulnerability detection,” CoRR, vol. abs/2212.14274, 2022.
- [71] X. Wang, T. Zhang, R. Wu, W. Xin, and C. Hou, “CPGVA: code property graph based vulnerability analysis by deep learning,” in ICAIT. IEEE, 2018, pp. 184–188.
- [72] S. S. Khan and M. G. Madden, “One-class classification: taxonomy of study and review of techniques,” Knowl. Eng. Rev., vol. 29, no. 3, pp. 345–374, 2014.
- [73] M. Claesen, F. D. Smet, P. Gillard, C. Mathieu, and B. D. Moor, “Building classifiers to predict the start of glucose-lowering pharmacotherapy using belgian health expenditure data,” CoRR, vol. abs/1504.07389, 2015.
- [74] K. Zupanc and J. Davis, “Estimating rule quality for knowledge base completion with the relationship between coverage assumption,” in Proceedings of the 2018 World Wide Web Conference on World Wide Web, WWW 2018, Lyon, France, April 23-27, 2018, P. Champin, F. Gandon, M. Lalmas, and P. G. Ipeirotis, Eds. ACM, 2018, pp. 1073–1081.
- [75] Z. Wu and J. He, “Fairness-aware model-agnostic positive and unlabeled learning,” in FAccT ’22: 2022 ACM Conference on Fairness, Accountability, and Transparency, Seoul, Republic of Korea, June 21 - 24, 2022. ACM, 2022, pp. 1698–1708.
- [76] T. Ke, B. Yang, L. Zhen, J. Tan, Y. Li, and L. Jing, “Building high-performance classifiers using positive and unlabeled examples for text classification,” in Advances in Neural Networks - ISNN 2012 - 9th International Symposium on Neural Networks, Shenyang, China, July 11-14, 2012. Proceedings, Part II, ser. Lecture Notes in Computer Science, J. Wang, G. G. Yen, and M. M. Polycarpou, Eds., vol. 7368. Springer, 2012, pp. 187–195.
- [77] T. Ke, L. Jing, H. Lv, L. Zhang, and Y. Hu, “Global and local learning from positive and unlabeled examples,” Appl. Intell., vol. 48, no. 8, pp. 2373–2392, 2018.
- [78] C. Hsieh, N. Natarajan, and I. S. Dhillon, “PU learning for matrix completion,” in Proceedings of the 32nd International Conference on Machine Learning, ICML 2015, Lille, France, 6-11 July 2015, ser. JMLR Workshop and Conference Proceedings, F. R. Bach and D. M. Blei, Eds., vol. 37. JMLR.org, 2015, pp. 2445–2453.
- [79] W. S. Lee and B. Liu, “Learning with positive and unlabeled examples using weighted logistic regression,” in ICML. AAAI Press, 2003, pp. 448–455.
- [80] C. Scott, “A rate of convergence for mixture proportion estimation, with application to learning from noisy labels,” in Proceedings of the Eighteenth International Conference on Artificial Intelligence and Statistics, AISTATS 2015, San Diego, California, USA, May 9-12, 2015, ser. JMLR Workshop and Conference Proceedings, G. Lebanon and S. V. N. Vishwanathan, Eds., vol. 38. JMLR.org, 2015.
- [81] S. Jain, M. White, M. W. Trosset, and P. Radivojac, “Nonparametric semi-supervised learning of class proportions,” CoRR, vol. abs/1601.01944, 2016.
- [82] S. Jain, M. White, and P. Radivojac, “Estimating the class prior and posterior from noisy positives and unlabeled data,” in Advances in Neural Information Processing Systems 29: Annual Conference on Neural Information Processing Systems 2016, December 5-10, 2016, Barcelona, Spain, 2016, pp. 2685–2693.
- [83] G. Ward, T. Hastie, S. Barry, J. Elith, and J. R. Leathwick, “Presence-only data and the em algorithm,” Biometrics, vol. 65, no. 2, pp. 554–563, 2009.
- [84] J. Bekker and J. Davis, “Estimating the class prior in positive and unlabeled data through decision tree induction,” in AAAI. AAAI Press, 2018, pp. 2712–2719.