WhatsNext: Guidance-enriched Exploratory Data Analysis with Interactive, Low-Code Notebooks ††thanks: The work was done when Chen Chen1 was an intern at Adobe Research.
Abstract
Computational notebooks such as Jupyter are popular for exploratory data analysis and insight finding. Despite the module-based structure, notebooks visually appear as a single thread of interleaved cells containing text, code, visualizations, and tables, which can be unorganized and obscure users’ data analysis workflow. Furthermore, users with limited coding expertise may struggle to quickly engage in the analysis process. In this work, we design and implement an interactive notebook framework, WhatsNext, with the goal of supporting low-code visual data exploration with insight-based user guidance. In particular, we (1) re-design a standard notebook cell to include a recommendation panel that suggests possible next-step exploration questions or analysis actions to take, and (2) create an interactive, dynamic tree visualization that reflects the analytic dependencies between notebook cells to make it easy for users to see the structure of the data exploration threads and trace back to previous steps.
Index Terms:
Visual analytics; Interactive systems and toolsI Introduction
Computational notebooks, such as Jupyter Notebook [1] and RStudio [2], are the most popular tools for exploratory data analysis (EDA) among data scientists [3, 4]. Computational notebooks have several advantages: (1) users can combine code, text, visualizations, and tables in one environment [5, 4], (2) users can easily change the code to see the intermediate results and debug the behavior, and (3) users can leverage the notebook framework to deploy and share notebooks with the cloud, thereby facilitating collaboration between developers [6].
However, computational notebooks’ code-reliance limits their use by inexperienced programmers like sales managers and doctors [7] who cannot code (or do not have time to code), despite their need for tooling that can support predictive or prescriptive analysis. These users often collaborate with programmers to obtain the desired results, which inevitably delays decision-making. Although Observable [8] aims to alleviate the need for extensive programming expertise by providing APIs and templates for quickly rendering data in a notebook environment, users are still expected to have basic programming knowledge or learn on the fly. To make this form of analysis more accessible to users with varying expertise, one option is to explore a less code-dependent notebook environment; however, no-code or low-code interaction remains under-explored.
Notebooks also have some navigational challenges [9, 5]. A basic notebook collects cells containing code, text, tables, and visualizations into a single, interleaved thread, which may not accurately capture the user’s analysis flow or the complex hierarchy of branching analysis threads. For example, from a single bar chart, the user may want to explore different grouped bar charts by introducing categorical attributes (one at a time), represented as several consecutive new notebook cells. This linear structure cannot clearly reflect the hierarchical relationship between these new cells and the source visualization. The user also cannot easily restore deleted cells or recall how the removed cell contributes to the analysis hierarchy, thus creating barriers to understanding the provenance of steps during data analysis [10, 11, 12]. This navigation issue is one of the major disadvantages of using notebooks for data exploration.
To address these challenges, we introduce WhatsNext, an interactive notebook environment for low-code data exploration that (1) recommends insight-related follow-up questions to interactively generate new visualizations, and (2) visualizes the analysis hierarchy to help users trace the history of diverging analysis threads. WhatsNext augments a standard notebook cell with a no-code interaction panel showing recommended follow-up analysis questions based on the current visualization. WhatsNext also provides a dynamic tree visualization that shows the analytic dependencies between cells; users can thus examine the overall notebook structure, view the cell-node correspondence, open the recommendation panel of a specific cell, and restore deleted cells from the analysis thread visualization.
In summary, we contribute the design of WhatsNext, a novel interactive notebook framework for guidance-enriched visual data analysis, and a next-step recommendation heuristic for efficiently exploring insights from the current visualization.
II Related Work
This work combines research on computational notebooks and visualization recommendation for exploratory data analysis.
II-A Interactions in Computational Notebook Environments
Given their code-reliance, computational notebooks are often used for collaborative programming [13, 14]. Recent work has developed helper functions or built-in widgets to facilitate the overall user experience, for example, by including semantic code search in notebook collections [15] and interactive visual exploration of search results [4], enabling efficient exploration of the cells’ history [16, 17, 18, 19] or providing version control [20], supporting quick decision-point navigation [21], and detecting and resolving staleness issues [12]. To facilitate code editing, Kery et al\xperiod [22, 23] proposed the concept of fluidly moving between code and GUI editing; for example, when a user repositions a table column in the output of a Jupyter notebook cell, the code will automatically update to reflect the new sort order. This work has also inspired research into several more interactive notebook-based prototypes, e.g., Unravel [24] enables structured edits via drag-and-drop and toggle interactions, and Symphony [25] promotes shareable, task-specific data-driven components in Jupyter for ML practitioners. These works aim to improve the usability of notebook environments. However, they still maintain some code-reliance and do not fully explore how to enable a low-code mode for notebooks.
II-B Visualization Recommendation for EDA
Presenting visualization recommendations can help users with data exploration and analysis [26]. To better reflect user intents, many systems leverage user interactions or user inputs to refine the recommendations. For example, Voyager [27] and Voyager 2 [28] leverage user-specified fields and wildcards to iterate on possible data attributes, transformations, and encodings to explore for the final visualization recommendations. VizAssist [29] recommends relevant visualizations based on user-specified analysis objectives (e.g., to discover outliers or to find correlations). Lux [30] was built on Jupyter to provide real-time visualization recommendations of patterns, trends, and analysis directions with optimized computational overheads whenever the user prints a dataframe in their notebooks. Li et al\xperiod [31] developed a system that recommends similar visualizations by extracting the structural information from a user-provided SVG image with GNN-based contrastive learning [32].
With the advances in the NLP field, many systems have introduced natural language interfaces (NLI) for visual analysis and recommendation. These systems can extract a user’s analytical intents by identifying explicit data attributes, numerical values, and chart types in input queries, and facilitate effective conversations with the user by modeling ambiguity properly. DataTone [33] offers interactive ambiguity widgets to let users correct system decisions. Eviza [34] supports language pragmatics in analytical interaction to enable conversations between a user and their data that allow follow-up queries. FlowSense [35] uses semantic parsing and special utterances to understand the dataflow context from plain English, facilitating the creation of multi-view linked visualizations. Snowy [36] generates utterance recommendations to guide conversational visual analysis based on data interestingness and language pragmatics.
III WhatsNext: Guidance for EDA in Notebooks
WhatsNext explores new forms of guidance for computational notebook environments to boost the user’s awareness when performing exploratory data analysis (EDA) in a low-code manner. To this end, we identified four key design goals.
DG1: Low-code. Reduce the difficulty of data exploration [37] to support users with varying levels of programming expertise.
DG2: Insight-driven. Help users better locate relevant information quickly and synthesize compound data insights [38].
DG3: History. Help users recall explored content and navigate efficiently by providing visual cues and simple interactions [39].
DG4: Structure. Reveal the analytic dependencies between cells to make users aware of the overall exploration status [19].
III-A Interface and Pipeline
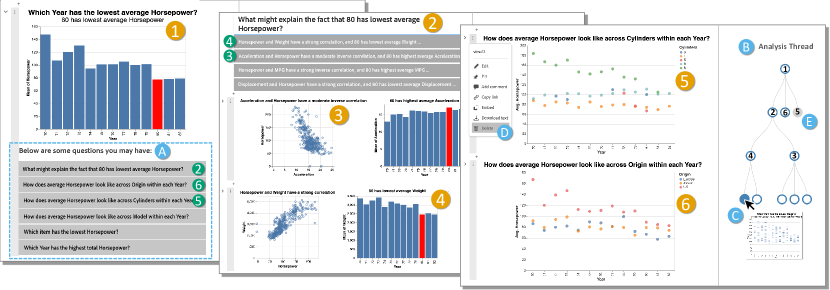
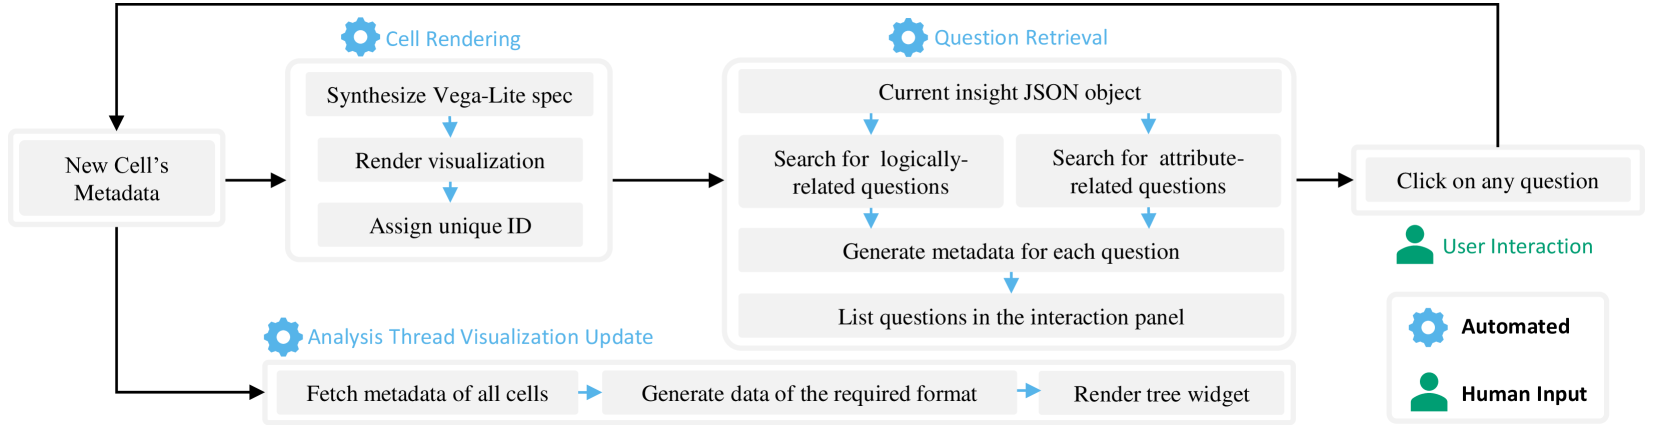
Figure 1 illustrates a typical use case of WhatsNext. To simplify exploratory data analysis, the new, no-code interaction panel (Fig. 1\Circled[inner color=white, fill color=userLabelBlue, outer color=userLabelBlue]A) recommends follow-up questions or actions. Starting from a source visualization (Fig. 1\Circled[inner color=white, fill color=visLabelOrange, outer color=visLabelOrange]1), the user selects the first recommended follow-up question (Fig. 1\Circled[inner color=white, fill color=stepLabelGreen, outer color=stepLabelGreen]2) to automatically generate the next step in the analysis process (Fig. 1\Circled[inner color=white, fill color=visLabelOrange, outer color=visLabelOrange]2). This new cell contains possible explanations for the selected question, which the user can select (Fig. 1\Circled[inner color=white, fill color=stepLabelGreen, outer color=stepLabelGreen]3-4) to generate new visualizations (Fig. 1\Circled[inner color=white, fill color=visLabelOrange, outer color=visLabelOrange]3-4). To accurately capture the branching and hierarchical nature of the analysis process, WhatsNext provides an analysis thread visualization (Fig. 1\Circled[inner color=white, fill color=userLabelBlue, outer color=userLabelBlue]B) to show the overall exploration structure (nodes are annotated with the corresponding cell numbers for clarity in the paper). Tooltips on the analysis thread visualization allow the user to preview the visualizations in the corresponding cell (Fig.1 \Circled[inner color=white, fill color=userLabelBlue, outer color=userLabelBlue]C); the user can jump to any cell by clicking its node. With these interactions, the user can quickly trace back to Fig. 1\Circled[inner color=white, fill color=visLabelOrange, outer color=visLabelOrange]1 and generate two new cells (Fig. 1\Circled[inner color=white, fill color=visLabelOrange, outer color=visLabelOrange]5,6) to explore different breakdowns by year. The user can delete unwanted cells from the cell menu (Fig. 1\Circled[inner color=white, fill color=userLabelBlue, outer color=userLabelBlue]D); the analysis thread visualization maintains corresponding nodes in gray (Fig. 1\Circled[inner color=white, fill color=userLabelBlue, outer color=userLabelBlue]E) as a history from which to restore old cells. The architectural pipeline of WhatsNext is shown in Fig. 2.
III-B The Low-code Design of Notebook Cells
A standard notebook cell consists of two parts: a code editor containing the corresponding code snippet and the executed result [1, 2]. To support data exploration in a low-code manner, we augment the notebook cells in WhatsNext to include an interaction panel with recommendations for new steps in the analysis process in the form of follow-up questions or actions (Fig. 1\Circled[inner color=white, fill color=stepLabelGreen, outer color=stepLabelGreen]2-6). Without writing any code, the user can click on the options presented in the interaction panel, which inserts new notebook cells accordingly. This interaction allows users to focus on the analysis process directly, rather than the intricacies of writing the correct code to meet their needs.
III-C Question-driven Data Insight Exploration
WhatsNext starts with an initial data insight visualization and the underlying tabular data (e.g., both of which can be retrieved from a dashboard), and renders the first notebook cell embedding the visualization (Fig. 2: Cell Rendering). Meanwhile, the back-end utilizes algorithms from Voder [40] to generate a search space of insights for later steps in the pipeline. We choose Voder as the insight generator mainly due to the JSON format and useful information provided with the insights, such as: activeHtml (the insight text), attributes (involved data attributes), relatedVisObjects (candidate visualizations, e.g., mark type, encodings, aggregation), tier (the importance level), and type (the insight type). Voder supports four types of insights: anomalies, correlation, distribution, and extremum. Some insights involve value derivation (e.g., computing the average) and value filtering (e.g., anchoring on a specific value).
WhatsNext then retrieves potential follow-up questions for the visualization (a.k.a., the insight) and displays them in the interaction panel of the cell (Fig. 2: Question Retrieval). WhatsNext considers two kinds of follow-up questions: logically-related questions, whose answers are logically connected to the current insight, and attribute-related questions, whose answer includes insights involving the same attributes as the current cell. For example, given the insight “Cars from the year 1980 have the lowest average horsepower” (Fig. 1\Circled[inner color=white, fill color=visLabelOrange, outer color=visLabelOrange]1), WhatsNext generates six questions, including both logically-related questions (e.g., “What might explain the fact that 1980 has the lowest average horsepower?”) and attribute-related questions (e.g., “Which item has the lowest horsepower?”) as options for how the user might proceed with their analysis.
Attribute-related questions are straightforward to retrieve: the system obtains the attribute set for the current cell’s insight, searches for insights whose attributes overlap, and converts them into questions. For logically-related questions, the system needs to determine which insights are logically related to the current insight; we thus propose retrieval rules based on the insight type (Table I) to search for logically-related insights to present as questions. Table I also provides example insights.
| Given Insight Example | Logically-related Insight Example | Converted Question |
| [Ext] “Cars from the year 1980 have the lowest average Weight” | [Ext] “Cars from the year 1980 have the lowest average Horsepower” + [Cor] “Horsepower and Weight have a strong correlation” | “Why do cars from the year 1980 have the lowest average Weight?” |
| [Ano] “There are three anomalies regarding Weight in the year 1980” | ||
| [Ext] “Cars from Japan in the year 1980 have the lowest average weight” | ||
| [Cor] “Horsepower and Weight have a strong correlation” | [Cor] “Weight and Displacement have a strong correlation” + ______ [Cor] “Horsepower and Displacement have a strong correlation” | “Why do Horsepower and Weight have a strong correlation?” |
| [Ano] “The car ‘renault 18i’ appears to be an outlier regarding Horsepower” | [Dis] “Most values for Horsepower are in the range [75.0, 125.0]” | “What is the major value range of Horsepower?” |
| [Dis] “Most values for Horsepower are in the range [75.0, 125.0]” | [Ano] “The car ‘renault 18i’ seems an outlier regarding Horsepower” | “What are potential outliers regarding Horsepower?” |
| [Dis] “Most values for Horsepower in 1980 are in the range [70.0, 120.0]” | “What is the distribution of Horsepower in the year 1980?” |
Extremum. For an extremum insight involving a categorical variable and a quantitative variable , WhatsNext looks for three kinds of logically-related insights: (1) an extremum insight involving the same categorical variable and another quantitative variable plus a correlation insight between these two quantitative variables , (2) an anomaly insight with the same variable pair ( and ), and (3) an extremum insight with an additional categorical variable . All three insight types reveal possible explanations for the current extremum insight.
Correlation. For a correlation insight involving two quantitative variables , the system identifies two correlation insights that involve and respectively, to expand on the current correlation with two additional correlations.
Anomaly. For an anomaly insight, WhatsNext looks for a distribution insight involving the same quantitative variable to further present the value range for the majority of the data.
Distribution. For a distribution insight, the system looks for (1) an anomaly with the same quantitative variable to show potential outliers, and (2) a distribution insight with an extra categorical variable to reveal drill-down distribution statistics.
The above rules were developed based on three design goals: (1) support potential reasoning about a data insight, (2) enable drill-down analysis by introducing new attributes, and (3) reflect low-level analytic tasks (e.g., Find Anomalies or Correlate [41]). Note that these rules do not require insights to come from Voder [40]; insights simply need to be formatted accordingly.
After the search process, WhatsNext uses a simple but effective template-based method [42] to generate questions from the selected insights. Typically there are multiple questions (generated from multiple insights) to display to the user. Thus, WhatsNext must order the recommended insights appropriately; the interaction panel ordering follows two principles: (1) logically-related questions have higher priority than attribute-related questions, and (2) attribute-related questions are ordered according to the importance level from Voder [40].
When the user selects a question that has multiple possible answers, WhatsNext will present the text of each insight combination in the interaction panel as a possible action to take (Fig. 1\Circled[inner color=white, fill color=stepLabelGreen, outer color=stepLabelGreen]3,4), which functions similarly to a question.
III-D The Analysis Thread Visualization
The analysis thread visualization is updated in real-time to show the structure of the EDA process when notebook cells are added or deleted (Fig. 2: Analysis Thread Visualization Update). When deleting a cell that the user deems unnecessary (Fig. 1\Circled[inner color=white, fill color=userLabelBlue, outer color=userLabelBlue]D), the analysis thread visualization will grey out the corresponding node to indicate its archival status (Fig. 1\Circled[inner color=white, fill color=userLabelBlue, outer color=userLabelBlue]E) and maintain its child nodes, if any. The user can restore deleted cells by simply clicking its corresponding node and selecting “restore this cell”. Two additional node interactions are included to support user navigation: (1) hover shows a mini version of the visualization in the corresponding cell as a tooltip, and (2) click jumps the user directly to the corresponding cell in the notebook. The analysis thread visualization captures the analytic dependencies between notebook cells that would otherwise be hidden or lost in a linear notebook; this view can thus act as a more complete archive of the user’s overall EDA process for quick review.
IV Discussion, Limitations, and Future Work
We discuss the system limitations and three areas for future work to enhance the practical quality of WhatsNext.
(1) Improve connections between the notebook and analysis structure. The analysis thread visualization shows the hidden analytic dependencies between the linearly-ordered cells in the notebook; however, these connections can be further enhanced to reveal other hidden features (e.g., adding attribute or insight-type tags on recommendations or color-encoding nodes to show the recommendation type or unexplored EDA directions).
(2) Support user-customized EDA trajectories. WhatsNext recommends a variety of analysis directions, but these currently cannot be further customized by the user. For example, users might want to specify their analysis intent explicitly or refine the follow-up questions. Future work should determine how best to support these goals while maintaining ecological synchronization between the cells and analysis thread visualization.
(3) Support thread decomposition, switching, and saving. WhatsNext currently supports multi-thread analysis within a single notebook. While the analysis thread visualization can show the overall analysis structure, (1) the tree may get too large to effectively support navigation, and (2) the user may want to decompose their exploration into disjoint threads. Future work could allow users to easily switch amongst analysis sub-threads to reduce the mental difficulty when tracing complex analysis histories. WhatsNext could also allow users to generate and export data insight reports to share their analysis results.
V Conclusion
WhatsNext contributes an interactive notebook framework for low-code visual exploratory data analysis that recommends next-step analysis questions based on the visualization attributes and insights. To support navigation, WhatsNext visualizes the analytic dependencies of diverging analysis trajectories.
References
- [1] T. Kluyver, B. Ragan-Kelley, F. Pérez, B. E. Granger, M. Bussonnier, J. Frederic, K. Kelley, J. B. Hamrick, J. Grout, S. Corlay, P. Ivanov, D. Avila, S. Abdalla, C. Willing, and J. D. Team, “Jupyter Notebooks - a publishing format for reproducible computational workflows,” in International Conference on Electronic Publishing, 2016, https://doi.org/10.3233/978-1-61499-649-1-87.
- [2] J. S. Racine, “RStudio: A Platform-Independent IDE for R and Sweave,” Journal of Applied Econometrics, vol. 27, no. 1, pp. 167–172, 2012, https://doi.org/10.1002/jae.1278.
- [3] S. Lau, I. Drosos, J. M. Markel, and P. J. Guo, “The Design Space of Computational Notebooks: An Analysis of 60 Systems in Academia and Industry,” in 2020 IEEE Symposium on Visual Languages and Human-Centric Computing (VL/HCC), 2020, pp. 1–11, https://doi.org/10.1109/VL/HCC50065.2020.9127201.
- [4] X. Li, Y. Zhang, J. Leung, C. Sun, and J. Zhao, “EDAssistant: Supporting Exploratory Data Analysis in Computational Notebooks with In Situ Code Search and Recommendation,” ACM Transactions on Interactive Intelligent Systems, vol. 13, no. 1, 2023, https://doi.org/10.1145/3545995.
- [5] J. Wenskovitch, J. Zhao, S. Carter, M. Cooper, and C. North, “Albireo: An Interactive Tool for Visually Summarizing Computational Notebook Structure,” in 2019 IEEE Visualization in Data Science (VDS), 2019, pp. 1–10, https://doi.org/10.1109/VDS48975.2019.8973385.
- [6] M. Araya, M. Osorio, M. Díaz, C. Ponce, M. Villanueva, C. Valenzuela, and M. Solar, “JOVIAL: Notebook-based astronomical data analysis in the cloud,” Astronomy and Computing, vol. 25, pp. 110–117, 2018, https://doi.org/10.1016/j.ascom.2018.09.001.
- [7] T. Murallie, “Welcome to the Age of Citizen Data Scientists.” Nov 2021, https://towardsdatascience.com/how-to-become-a-citizen-data-scientist-294660da0494.
- [8] Observable, “Explore, analyze, and explain data as a team.” May 2022, https://observablehq.com/.
- [9] P. J. Guo and M. I. Seltzer, “BURRITO: Wrapping Your Lab Notebook in Computational Infrastructure,” in Proceedings of the 4th USENIX Conference on Theory and Practice of Provenance, 2012, https://www.usenix.org/conference/tapp12/workshop-program/presentation/Guo.
- [10] E. D. Ragan, A. Endert, J. Sanyal, and J. Chen, “Characterizing Provenance in Visualization and Data Analysis: An Organizational Framework of Provenance Types and Purposes,” IEEE Transactions on Visualization and Computer Graphics, vol. 22, no. 1, pp. 31–40, 2016, https://doi.org/10.1109/TVCG.2015.2467551.
- [11] A. Head, F. Hohman, T. Barik, S. M. Drucker, and R. DeLine, “Managing Messes in Computational Notebooks,” in Proceedings of the 2019 CHI Conference on Human Factors in Computing Systems, 2019, p. 1–12, https://doi.org/10.1145/3290605.3300500.
- [12] S. Macke, H. Gong, D. J.-L. Lee, A. Head, D. Xin, and A. Parameswaran, “Fine-Grained Lineage for Safer Notebook Interactions,” Proceedings of the VLDB Endowment, vol. 14, no. 6, p. 1093–1101, 2021, https://doi.org/10.14778/3447689.3447712.
- [13] A. Y. Wang, A. Mittal, C. Brooks, and S. Oney, “How Data Scientists Use Computational Notebooks for Real-Time Collaboration,” Proceedings of the ACM on Human-Computer Interaction, vol. 3, no. CSCW, 2019, https://doi.org/10.1145/3359141.
- [14] K. M. Mendez, L. Pritchard, S. N. Reinke, and D. I. Broadhurst, “Toward collaborative open data science in metabolomics using jupyter notebooks and cloud computing,” Metabolomics, vol. 15, pp. 1–16, 2019, https://doi.org/10.1007/s11306-019-1588-0.
- [15] X. Li, Y. Wang, H. Wang, Y. Wang, and J. Zhao, “NBSearch: Semantic Search and Visual Exploration of Computational Notebooks,” in Proceedings of the 2021 CHI Conference on Human Factors in Computing Systems, 2021, https://doi.org/10.1145/3411764.3445048.
- [16] M. B. Kery, A. Horvath, and B. Myers, “Variolite: Supporting Exploratory Programming by Data Scientists,” in Proceedings of the 2017 CHI Conference on Human Factors in Computing Systems, 2017, p. 1265–1276, https://doi.org/10.1145/3025453.3025626.
- [17] M. B. Kery, B. E. John, P. O’Flaherty, A. Horvath, and B. A. Myers, “Towards Effective Foraging by Data Scientists to Find Past Analysis Choices,” in Proceedings of the 2019 CHI Conference on Human Factors in Computing Systems, 2019, p. 1–13, https://doi.org/10.1145/3290605.3300322.
- [18] M. V. Merino, L. Thomas van Binsbergen, and M. Seraj, “Making the Invisible Visible in Computational Notebooks,” in 2022 IEEE Symposium on Visual Languages and Human-Centric Computing (VL/HCC), 2022, pp. 1–3, https://doi.org/10.1109/VL/HCC53370.2022.9833148.
- [19] Z. J. Wang, K. Dai, and W. K. Edwards, “Stickyland: Breaking the Linear Presentation of Computational Notebooks,” in Extended Abstracts of the 2022 CHI Conference on Human Factors in Computing Systems, 2022, https://doi.org/10.1145/3491101.3519653.
- [20] M. B. Kery and B. A. Myers, “Interactions for Untangling Messy History in a Computational Notebook,” in 2018 IEEE Symposium on Visual Languages and Human-Centric Computing (VL/HCC), 2018, pp. 147–155, https://doi.org/10.1109/VLHCC.2018.8506576.
- [21] N. Weinman, S. M. Drucker, T. Barik, and R. DeLine, “Fork It: Supporting Stateful Alternatives in Computational Notebooks,” in Proceedings of the 2021 CHI Conference on Human Factors in Computing Systems, 2021, https://doi.org/10.1145/3411764.3445527.
- [22] M. B. Kery, D. Ren, F. Hohman, D. Moritz, K. Wongsuphasawat, and K. Patel, “mage: Fluid Moves Between Code and Graphical Work in Computational Notebooks,” in Proceedings of the 33rd Annual ACM Symposium on User Interface Software and Technology, 2020, p. 140–151, https://doi.org/10.1145/3379337.3415842.
- [23] M. B. Kery, D. Ren, K. Wongsuphasawat, F. Hohman, and K. Patel, “The Future of Notebook Programming Is Fluid,” in Extended Abstracts of the 2020 CHI Conference on Human Factors in Computing Systems, 2020, p. 1–8, https://doi.org/10.1145/3334480.3383085.
- [24] N. Shrestha, T. Barik, and C. Parnin, “Unravel: A Fluent Code Explorer for Data Wrangling,” in The 34th Annual ACM Symposium on User Interface Software and Technology, 2021, p. 198–207, https://doi.org/10.1145/3472749.3474744.
- [25] A. Bäuerle, A. A. Cabrera, F. Hohman, M. Maher, D. Koski, X. Suau, T. Barik, and D. Moritz, “Symphony: Composing Interactive Interfaces for Machine Learning,” in Proceedings of the 2022 CHI Conference on Human Factors in Computing Systems, 2022, https://doi.org/10.1145/3491102.3502102.
- [26] L. Grammel, M. Tory, and M.-A. Storey, “How information visualization novices construct visualizations,” IEEE Transactions on Visualization and Computer Graphics, vol. 16, no. 6, pp. 943–952, 2010, https://doi.org/10.1109/TVCG.2010.164.
- [27] K. Wongsuphasawat, D. Moritz, A. Anand, J. Mackinlay, B. Howe, and J. Heer, “Voyager: Exploratory Analysis via Faceted Browsing of Visualization Recommendations,” IEEE Transactions on Visualization and Computer Graphics, vol. 22, no. 1, pp. 649–658, 2016, https:doi.org/10.1109/TVCG.2015.2467191.
- [28] K. Wongsuphasawat, Z. Qu, D. Moritz, R. Chang, F. Ouk, A. Anand, J. Mackinlay, B. Howe, and J. Heer, “Voyager 2: Augmenting visual analysis with partial view specifications,” in Proceedings of the 2017 CHI Conference on Human Factors in Computing Systems, 2017, p. 2648–2659, https://doi.org/10.1145/3025453.3025768.
- [29] F. Bouali, A. E. tahir Guettala, and G. Venturini, “VizAssist: an interactive user assistant for visual data mining,” The Visual Computer, vol. 32, pp. 1447–1463, 2016, https://doi.org/10.1007/s00371-015-1132-9.
- [30] D. J.-L. Lee, D. Tang, K. Agarwal, T. Boonmark, C. Chen, J. Kang, U. Mukhopadhyay, J. Song, M. Yong, M. A. Hearst, and A. G. Parameswaran, “Lux: always-on visualization recommendations for exploratory dataframe workflows,” Proceedings of the VLDB Endowment, vol. 15, no. 3, p. 727–738, 2021, https://doi.org/10.14778/3494124.3494151.
- [31] H. Li, Y. Wang, A. Wu, H. Wei, and H. Qu, “Structure-aware Visualization Retrieval,” in CHI Conference on Human Factors in Computing Systems, 2022, pp. 1–14, https://doi.org/10.1145/3491102.3502048.
- [32] F.-Y. Sun, J. Hoffman, V. Verma, and J. Tang, “InfoGraph: Unsupervised and Semi-supervised Graph-Level Representation Learning via Mutual Information Maximization,” in International Conference on Learning Representations, 2020, https://openreview.net/forum?id=r1lfF2NYvH.
- [33] T. Gao, M. Dontcheva, E. Adar, Z. Liu, and K. G. Karahalios, “Datatone: Managing Ambiguity in Natural Language Interfaces for Data Visualization,” in Proceedings of the 28th Annual ACM Symposium on User Interface Software & Technology, 2015, p. 489–500, https://doi.org/10.1145/2807442.2807478.
- [34] V. Setlur, S. E. Battersby, M. Tory, R. Gossweiler, and A. X. Chang, “Eviza: A Natural Language Interface for Visual Analysis,” in Proceedings of the 29th Annual Symposium on User Interface Software and Technology, 2016, p. 365–377, https://doi.org/10.1145/2984511.2984588.
- [35] B. Yu and C. T. Silva, “Flowsense: A Natural Language Interface for Visual Data Exploration within a Dataflow System,” IEEE Transactions on Visualization and Computer Graphics, vol. 26, no. 1, pp. 1–11, 2020, https://doi.org/10.1109/TVCG.2019.2934668.
- [36] A. Srinivasan and V. Setlur, “Snowy: Recommending Utterances for Conversational Visual Analysis,” in The 34th Annual ACM Symposium on User Interface Software and Technology, 2021, p. 864–880, https://doi.org/10.1145/3472749.3474792.
- [37] M. Beth Kery and B. A. Myers, “Exploring exploratory programming,” in 2017 IEEE Symposium on Visual Languages and Human-Centric Computing (VL/HCC), 2017, pp. 25–29, https://doi.org/10.1109/VLHCC.2017.8103446.
- [38] P. Law, A. Endert, and J. Stasko, “Characterizing Automated Data Insights,” in 2020 IEEE Visualization Conference (VIS), 2020, pp. 171–175, https://doi.org/10.1109/VIS47514.2020.00041.
- [39] A. Rule, A. Tabard, and J. D. Hollan, “Exploration and explanation in computational notebooks,” in Proceedings of the 2018 CHI Conference on Human Factors in Computing Systems, 2018, p. 1–12, https://doi.org/10.1145/3173574.3173606.
- [40] A. Srinivasan, S. M. Drucker, A. Endert, and J. Stasko, “Augmenting Visualizations with Interactive Data Facts to Facilitate Interpretation and Communication,” IEEE Transactions on Visualization and Computer Graphics, vol. 25, no. 1, pp. 672–681, 2019, https://doi.org/10.1109/TVCG.2018.2865145.
- [41] R. Amar, J. Eagan, and J. Stasko, “Low-Level Components of Analytic Activity in Information Visualization,” in Proceedings of the Proceedings of the 2005 IEEE Symposium on Information Visualization, 2005, https://doi.org/10.1109/INFVIS.2005.1532136.
- [42] A. Fabbri, P. Ng, Z. Wang, R. Nallapati, and B. Xiang, “Template-based question generation from retrieved sentences for improved unsupervised question answering,” in Proceedings of the 58th Annual Meeting of the Association for Computational Linguistics, 2020, pp. 4508–4513, https://doi.org/10.18653/v1/2020.acl-main.413.