notes = para , style = \NewExpandableDocumentCommand\mccO1m #2
Flickr Africa: Examining Geo-Diversity in Large-Scale, Human-Centric Visual Data
Abstract.
Biases in large-scale image datasets are known to influence the performance of computer vision models as a function of geographic context. To investigate the limitations of standard Internet data collection methods in low- and middle-income countries, we analyze human-centric image geo-diversity on a massive scale using geotagged Flickr images associated with each nation in Africa. We report the quantity and content of available data with comparisons to population-matched nations in Europe as well as the distribution of data according to fine-grained intra-national wealth estimates. Temporal analyses are performed at two-year intervals to expose emerging data trends. Furthermore, we present findings for an “othering” phenomenon as evidenced by a substantial number of images from Africa being taken by non-local photographers. The results of our study suggest that further work is required to capture image data representative of African people and their environments and, ultimately, to improve the applicability of computer vision models in a global context.
1. Introduction
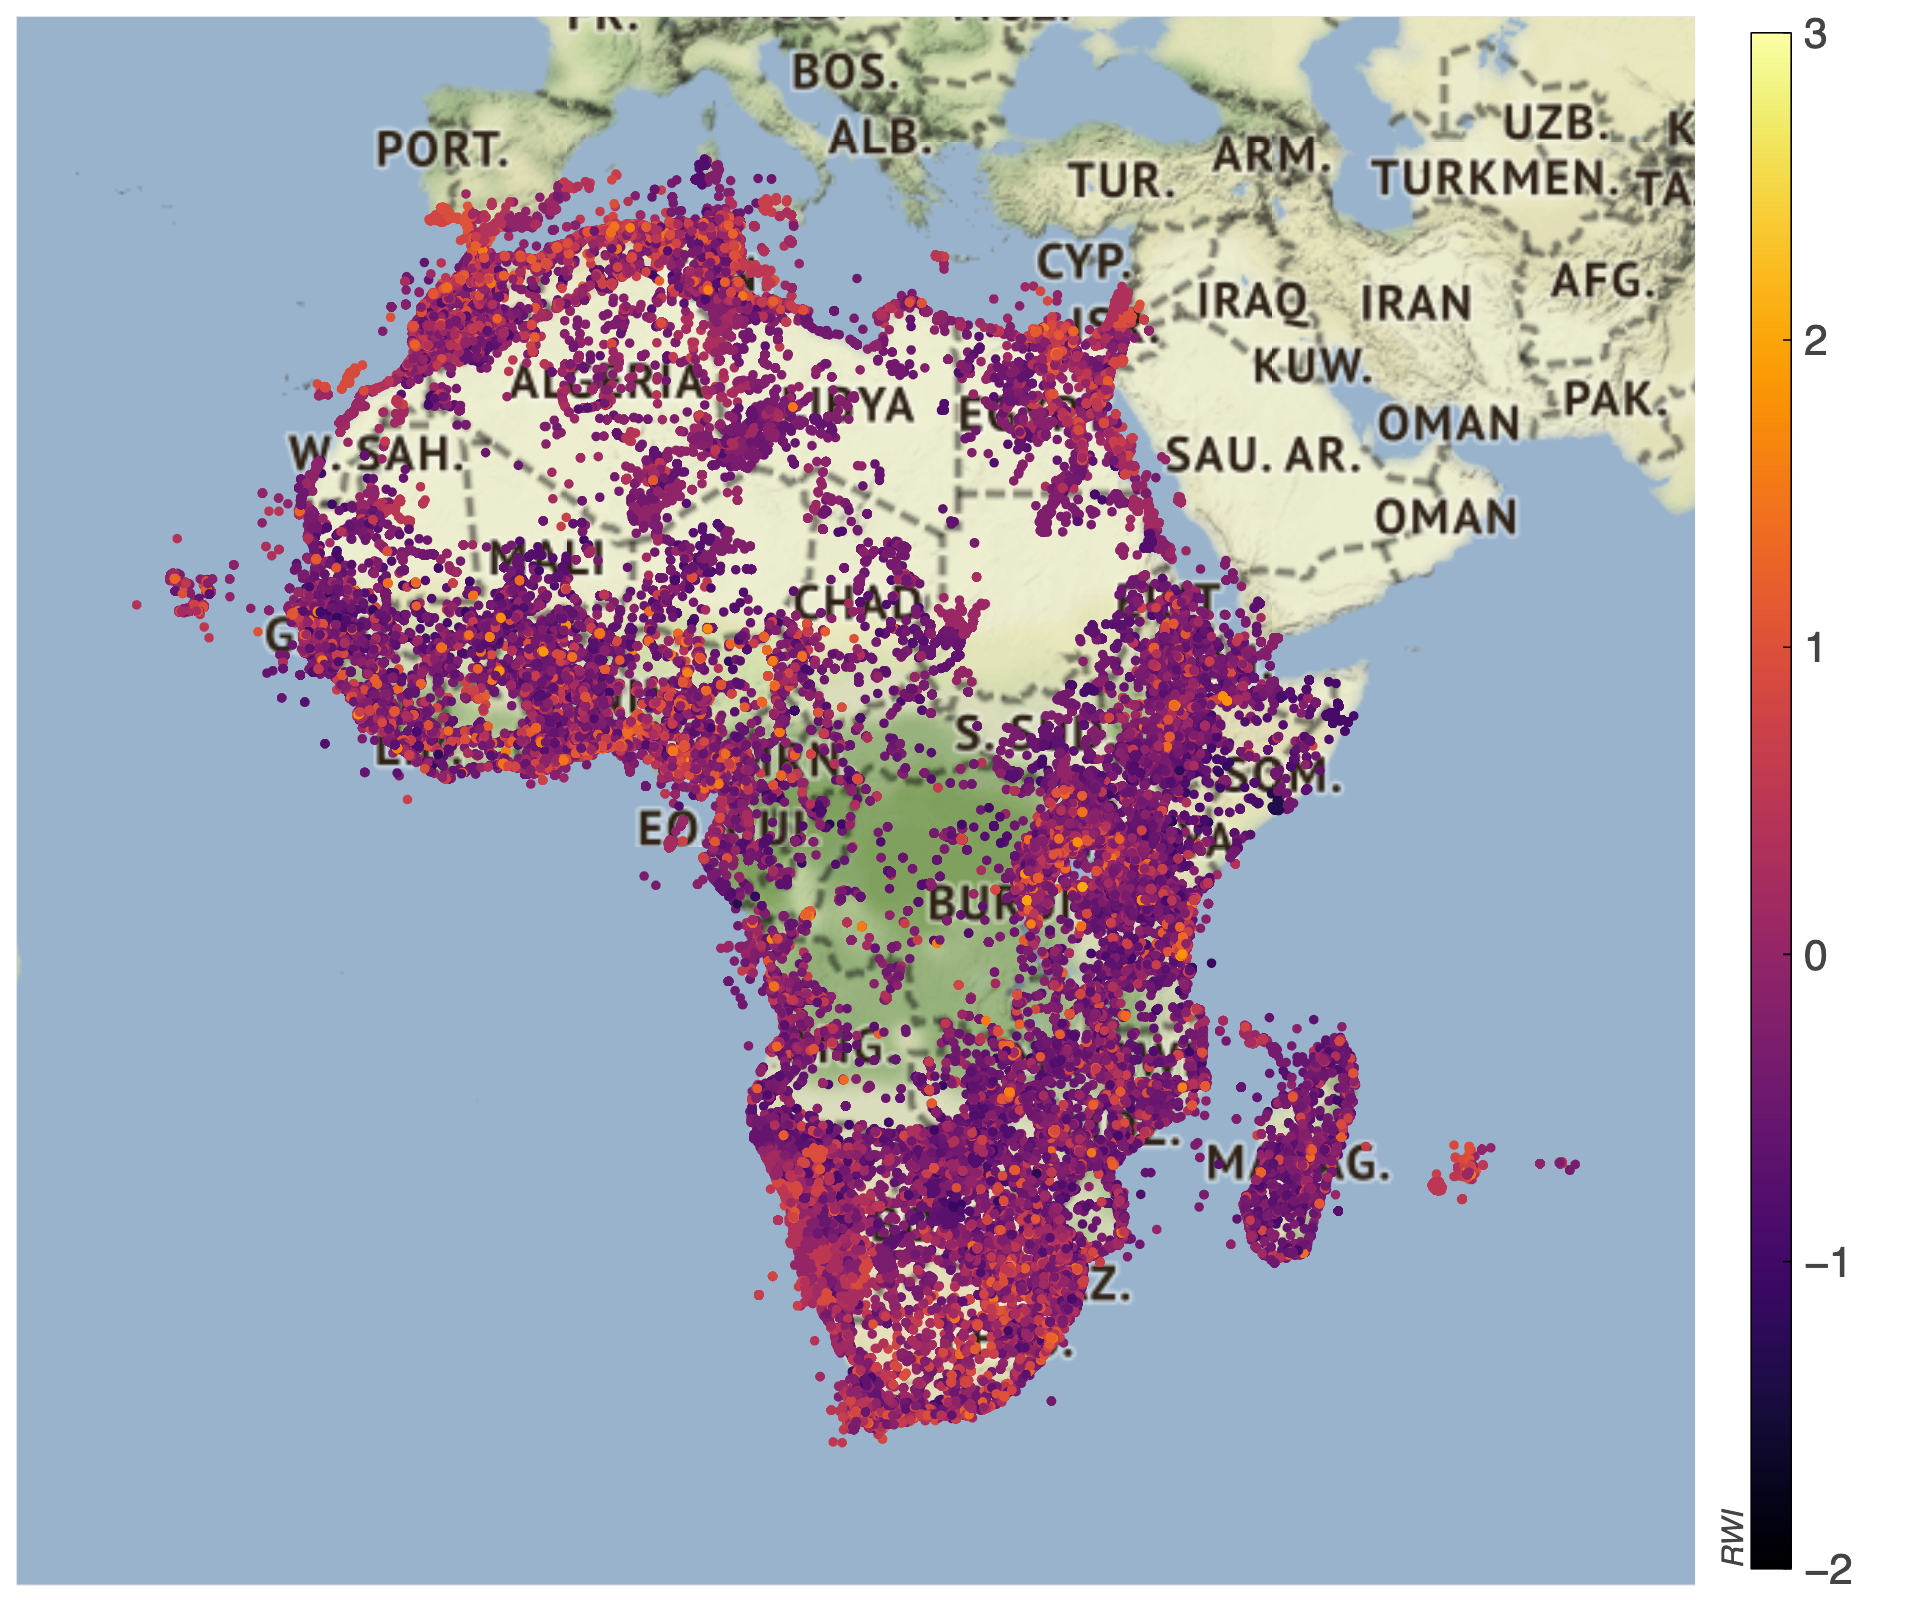
Data collection and processing are crucial to the machine learning (ML) pipeline and are the source of many biases in AI systems, which have been shown to largely stem from a lack of diverse representation in training datasets (Buolamwini and Gebru, 2018). Currently, most large-scale computer vision datasets are collected via webscraping and subsequent data cleaning. For example, the ImageNet database ((Deng et al., 2009); citations per Google Scholar, accessed Sept. 14, 2022) is comprised of images sourced from search engines like Google and Flickr, while the COCO dataset ((Lin et al., 2014); citations per Google Scholar, accessed Sept. 14, 2022) is comprised of images sourced entirely from Flickr. Thus, biases inherent to Flickr influence the performance of models for visual tasks as diverse as object classification, pose estimation, instance segmentation, image captioning, and beyond. Some of these dataset biases have been explored in detail: for ImageNet and the Flickr-sourced Open Images dataset (Kuznetsova et al., 2018) it has been shown that data from India, China, and African and South-East Asian countries is vastly underrepresented despite their large populations (DeVries et al., 2019); while for COCO, data has been shown to be heavily skewed towards lighter-skinned and male individuals (Zhao et al., 2021). In particular, such biases impact the applicability of models in a global context. For instance, DeVries et al. (2019) manually sourced image data from 264 globally-distributed households and demonstrated how object recognition model performance drops when applied in lower-income nations. Motivated by the popularity of datasets sourced using Flickr data, we here analyze million geotagged images in the Flickr database to deeply explore its representation of African people and settings (see Figure 1).
In this paper, we aim to highlight the limitations of webscraping generic and human-centric111That is: involving people, their interactions with each other, and/or their activities in the environments in which they live. image data from Africa for ML training purposes. We analyze image data for every African nation with direct comparisons to population-matched higher-GDP European nations and show that there is far less data available from Africa. We report the distribution of African geotagged image data as a function of fine-grained, intra-national wealth estimates (Chi et al., 2022) and assess data with respect to license restrictions, population size, nominal GDP, Internet usage, and official languages. Additionally, we collect crowdsourced annotations to explore image content, and provide evidence for an “othering” phenomenon as the majority of African geotagged images we analyzed were taken by foreigners, while the opposite trend is shown for select European nations. Such results highlight the importance of considering geodiversity metrics beyond ancestry/ethnicity of individuals within images and, moreover, how the mechanisms by which images are obtained can quantitatively and qualitatively affect how the image corpus represents the world (e.g. imposing a “Western gaze”). Overall, we find that Flickr provides a very limited and skewed representation of African countries which likely contributes to many of the biases in models trained on popular, large-scale image datasets.
1.1. Related work
While prior works have explored diversity beyond Western nations (Sambasivan et al., 2021; Weinberg, 2022), studies of access to, and applicability of, AI systems in Africa remain limited (Abebe et al., 2021; Anane-Sarpong et al., 2018). Scholars such as Abebe et al. (2021) highlight the challenges of data sharing practices in Africa, such as those concerning trust, awareness, and infrastructure, and note that “The continent’s plural and at times divergent norms, practices, and traditions furthermore complicate the African data access and sharing ecosystem.” Computer vision researchers have produced diverse datasets in an effort to reduce model biases and assess fairness outcomes (e.g. (Karkkainen and Joo, 2021)), with some centered specifically on geographic and contextual diversity (AR., 2016; DeVries et al., 2019; Yin et al., 2021; Ayush et al., 2020; Christie et al., 2017; Chi et al., 2019). Such data collection involves trade-offs, however (Xiang, 2022); while manual data collection enables desired contextual diversity specifications to be met, it is expensive and frequently limits access to low-income regions (see e.g. (DeVries et al., 2019)). Thus, researchers have explored more automated methods of scraping diverse data from web platforms and public media, producing datasets such as the Geo-Diverse Visual Commonsense Reasoning dataset (GD-VCR) (Yin et al., 2021), GeoImageNet (Ayush et al., 2020) , Functional Map of the World (fMoW) (Christie et al., 2017), YFCC100M (Thomee et al., 2016), and Open Images Extended (Kuznetsova et al., 2020), among others. Wang et al. (2022) construct an ImageNet-style image data hierarchy across languages and cultures beyond English for visually grounded reasoning. While valuable, these initiatives have not deeply explored intra-national diversity, such as according to regional wealth estimates. Likewise, those datasets which utilize geolocation alone may result in a stereotypical portrayal of people in developing nations.
Geodiversity has been studied from various angles beyond dataset production. Scholars have proposed methods for measuring geodiversity in image datasets (Wesley and Matisziw, 2021; Shankar et al., 2017) or performing geography-aware learning (Ayush et al., 2021). Zhao et al. (2021) expose the propogation of racial and cultural biases into model predictions, while Mandal et al. (2021) study geographical bias in image search and retrieval. Denton et al. (2021) highlight the importance of annotators’ lived experiences on their annotation results.
Additionally, Crandall et al. (2009) and Johnson et al. (2016), among other researchers, have studied volunteered-geographic information (VGI) and its relation to localness in Flickr user-generated content. At metropolitan-area and individual landmark spatial scales, Crandall et al. (2009) use textual and visual image data to develop a classification technique which automatically exposes the relation between location and content in six months of Flickr-scraped images. Johnson et al. (2016) define four localness metrics: n-days, plurality, and location-field, to investigate the localness of user-generated content on Flickr, Twitter, and Swarm. In particular, their work assessed the Flickr-scraped YFCC100M dataset, containing images from thousands of users in the contiguous United States, whereas we focus on Africa and a few population-matched European countries. Notably, the authors found that with recall accuracy, only of Flickr images inspected with the “location field” localness metric (photographer self-reported location information) were local.
2. Methodology
2.1. Data Collection
2.1.1. Flickr Africa
For each nation in Africa, we utilized Flickr queries to construct a dataset of images and associated metadata. Using the FlickrAPI, we scraped images and associated metadata from Flickr between dates -- and -- ( years) by querying by country name (e.g. “Togo”) and the country name + people (e.g. “Togo people”), with the latter querying choice motivated by construction methods of related large image datasets (e.g. COCO, which utilizes the Flickr query “person”). We scraped Flickr data for African countries: {Algeria, Angola, Benin, Botswana, Burkina Faso, Burundi, Cameroon, Cape Verde, Central African Republic (CAF), Chad, Comoros, Ivory Coast, The Democratic Republic of the Congo (DRC), Djibouti, Egypt, Equatorial Guinea, Ethiopia, Eritrea, Gabon, Gambia, Ghana, Guinea, Guinea Bissau, Kenya, Lesotho, Liberia, Libya, Madagascar, Malawi, Mali, Mauritania, Mauritius, Morocco, Mozambique, Namibia, Niger, Nigeria, Republic of Congo, Rwanda, Sao Tome and Principe, Senegal, Seychelles, Sierra Leone, Somalia, South Africa, South Sudan, Sudan, Swaziland, Tanzania, Togo, Tunisia, Uganda, Zambia, and Zimbabwe}. Utilizing Flickr metadata associated with each image, we generated csv images data files ( per country, associated with each query) with values for the following variables: {“license”, “title”, “datetaken”, “image_url”, “country”, “city”, “tags”, “latitude”, “longitude”, “rwi of nearest point”, “distance to nearest rwi labelled point (km)”, “latitude of nearest point”, and “longitude of nearest point”}. City and country information were determined by reverse geo-locating the longitude-latitude values provided in the image metadata using open-source reverse geocode ((Penman, 2020); accuracy analyses in (Kounadi et al., 2013)). All data is available on zenodo.org. The RWI data is described below. Total image counts were recorded and images without valid geotags were excluded.
2.1.2. Population-matched European countries
The data collection process was repeated for four European nations. In the interest of comparing data availability and content to higher-GDP European nations, we chose the following countries as a function of similar population size ((Wikipedia.org, 2022b, d, a)): Switzerland and Sierra Leone (GDP: k vs. k); Cyprus and Djibouti (GDP: k vs. k); Finland and Central African Republic (CAF) (GDP: k vs. k); and Slovenia and Lesotho (GDP: k vs. k). For all countries we collected data pertaining to percentage of internet users (Wikipedia.org, 2022c), nominal GDP (Wikipedia.org, 2022b), population size (Wikipedia.org, 2022d, a) and official languages (Wikipedia.org, 2022e).
2.1.3. Relative Wealth Estimates
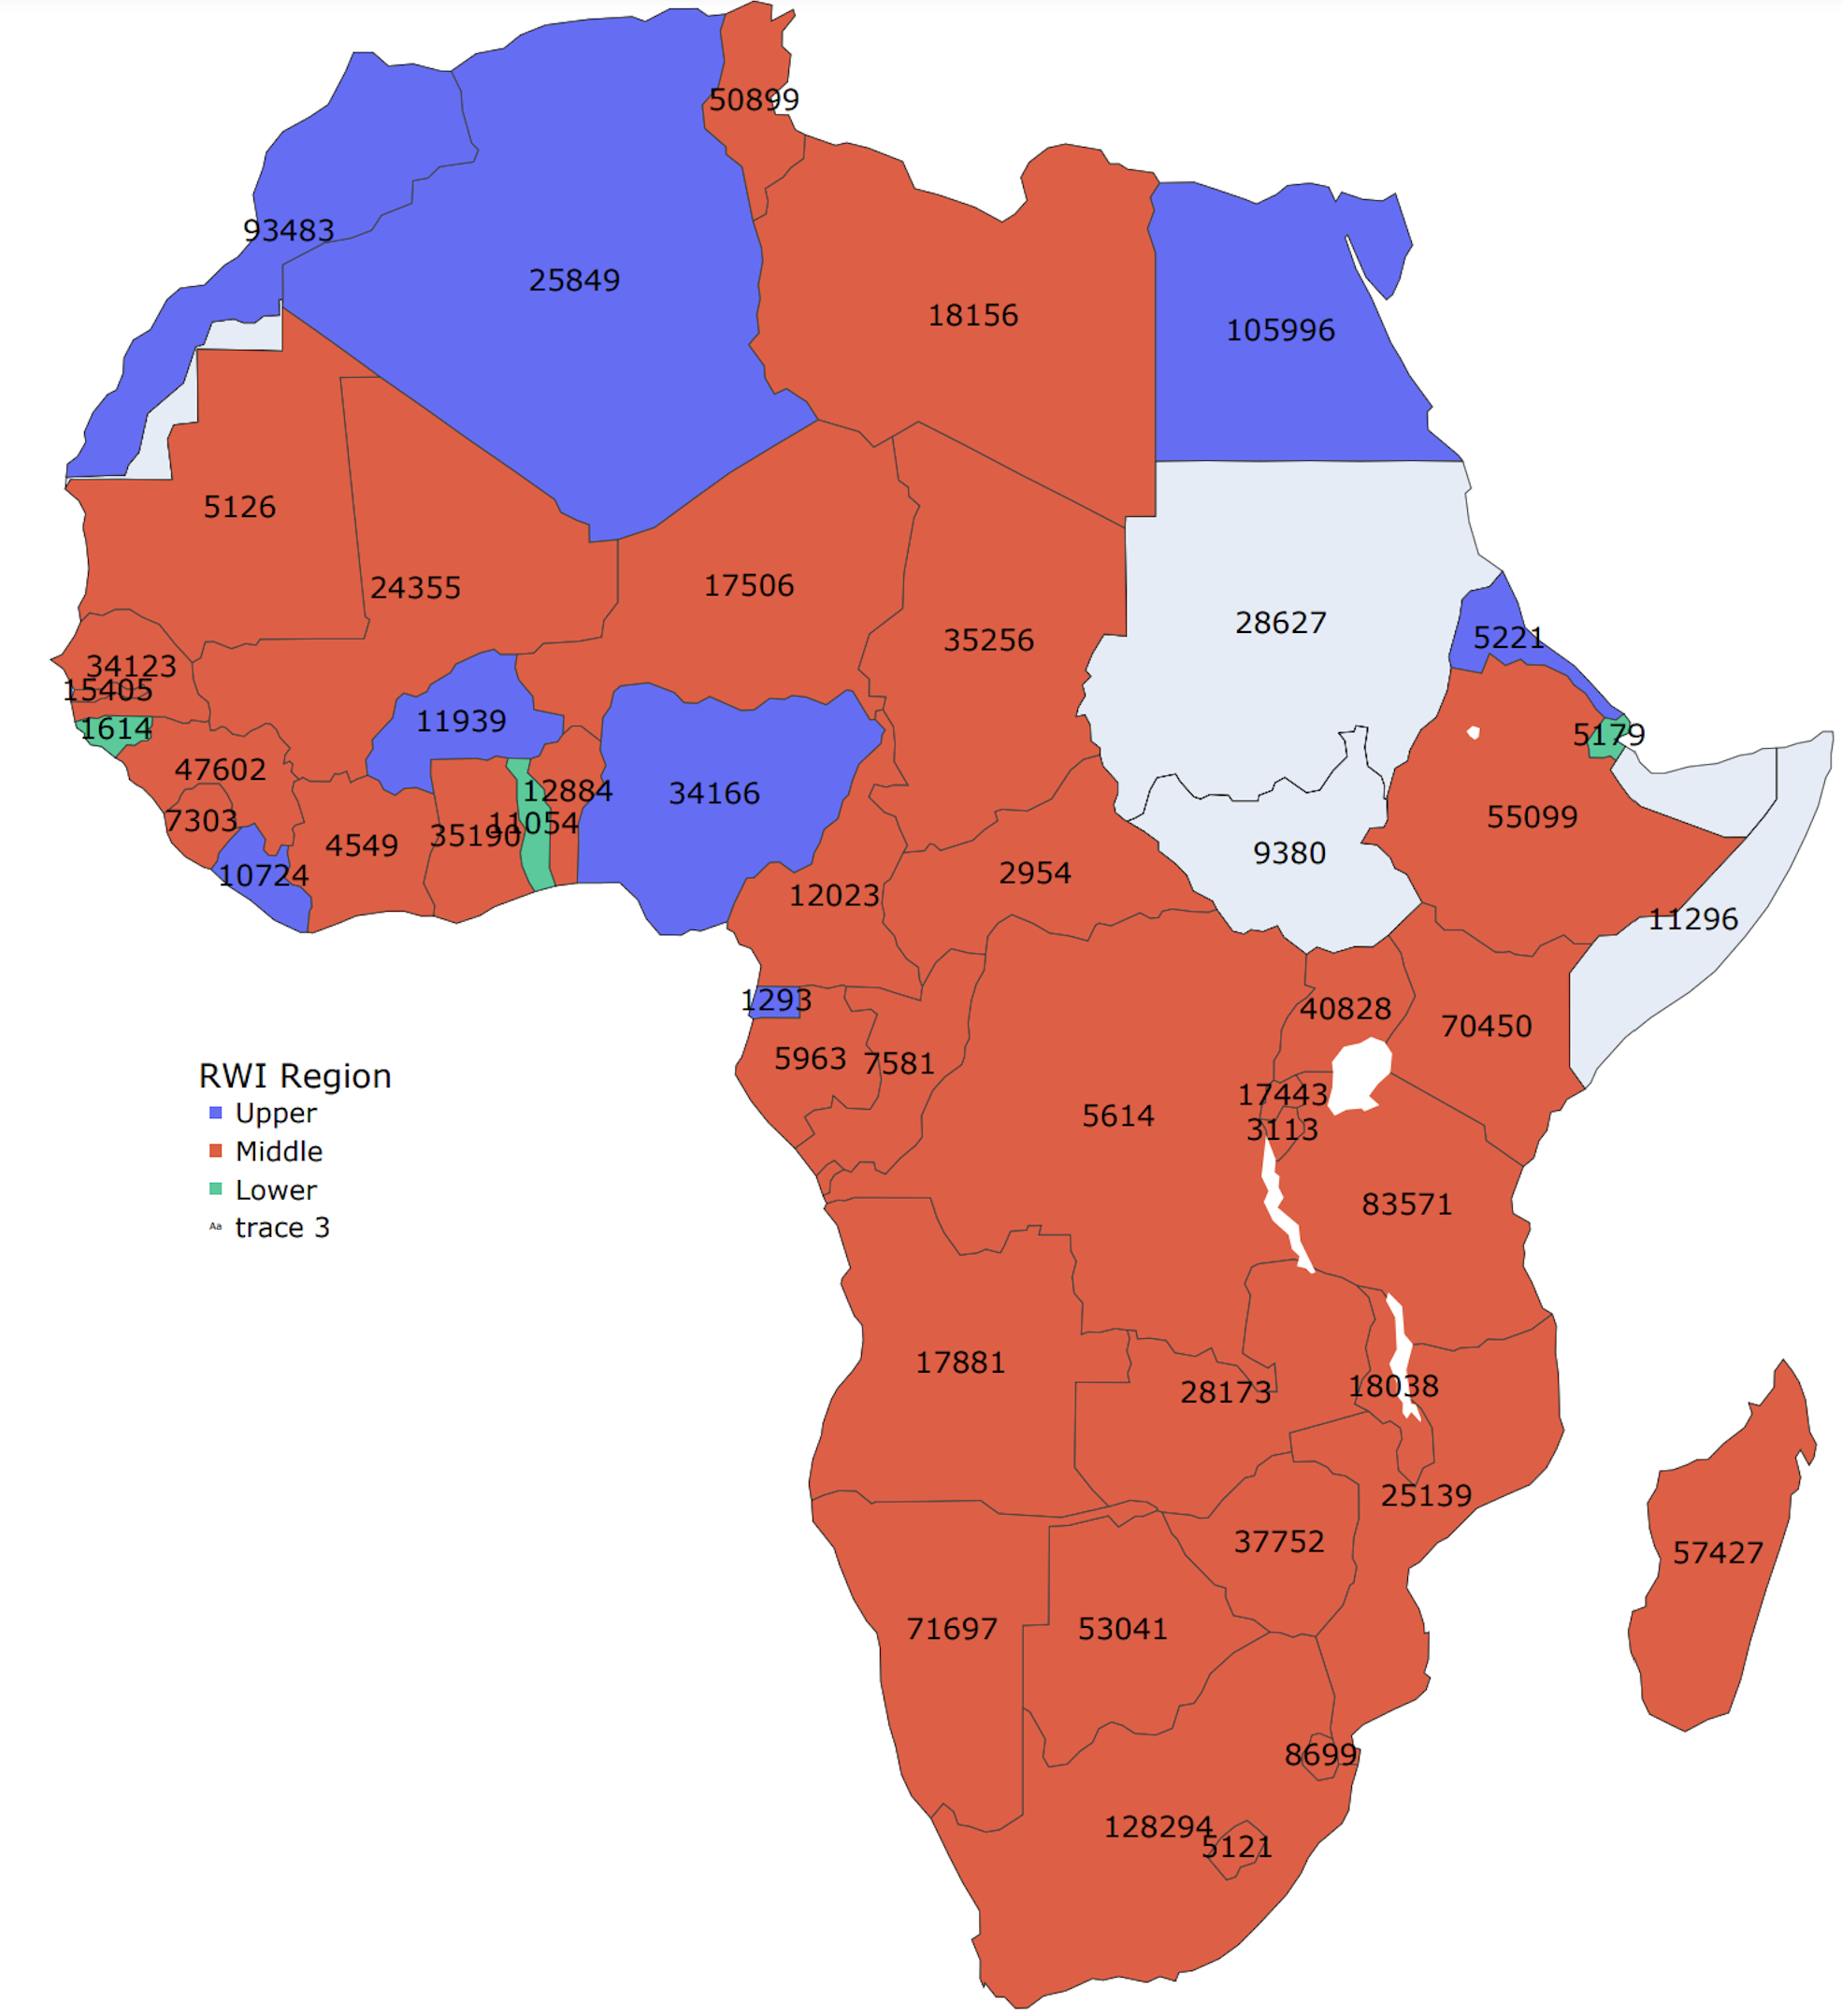
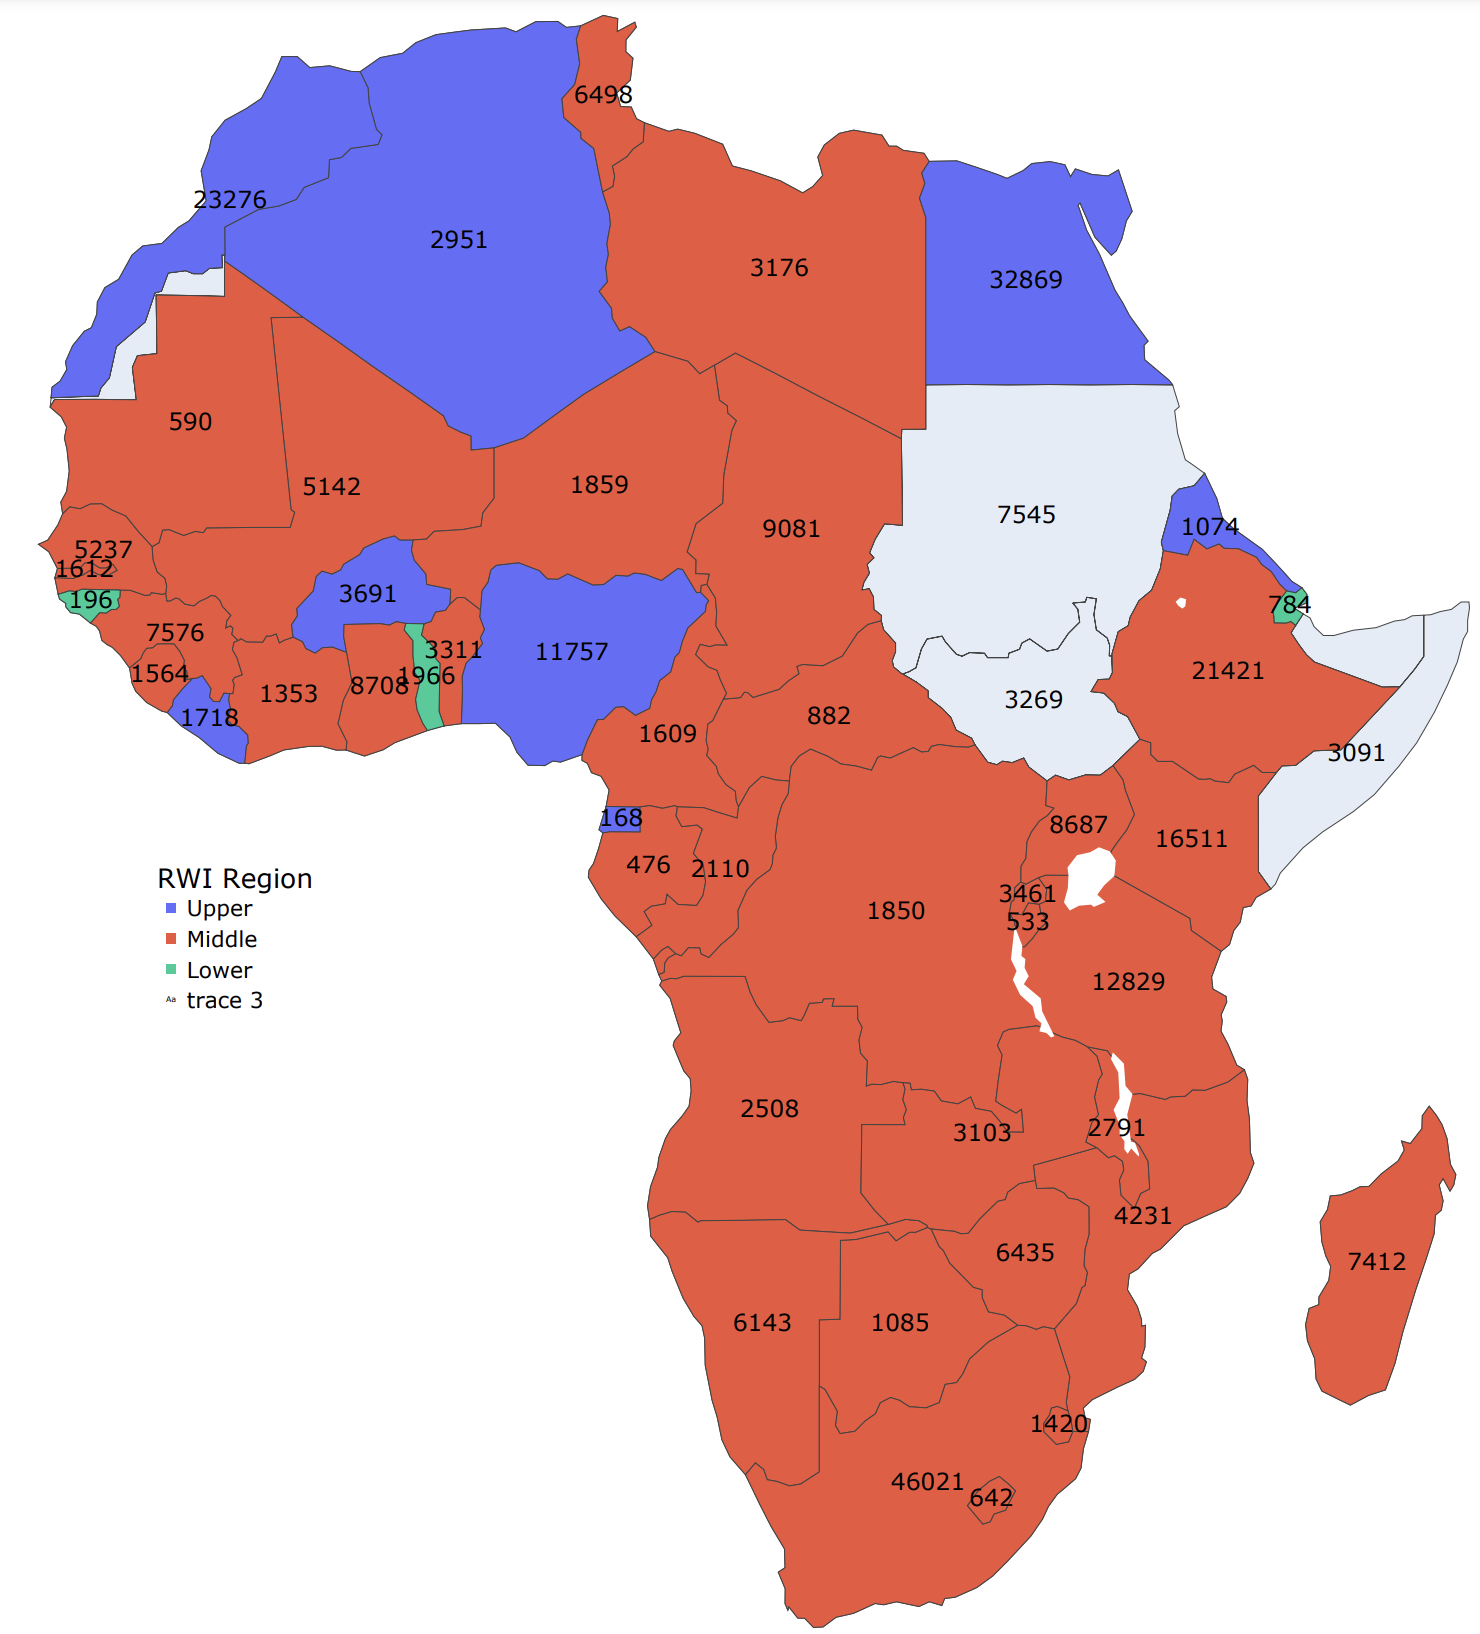
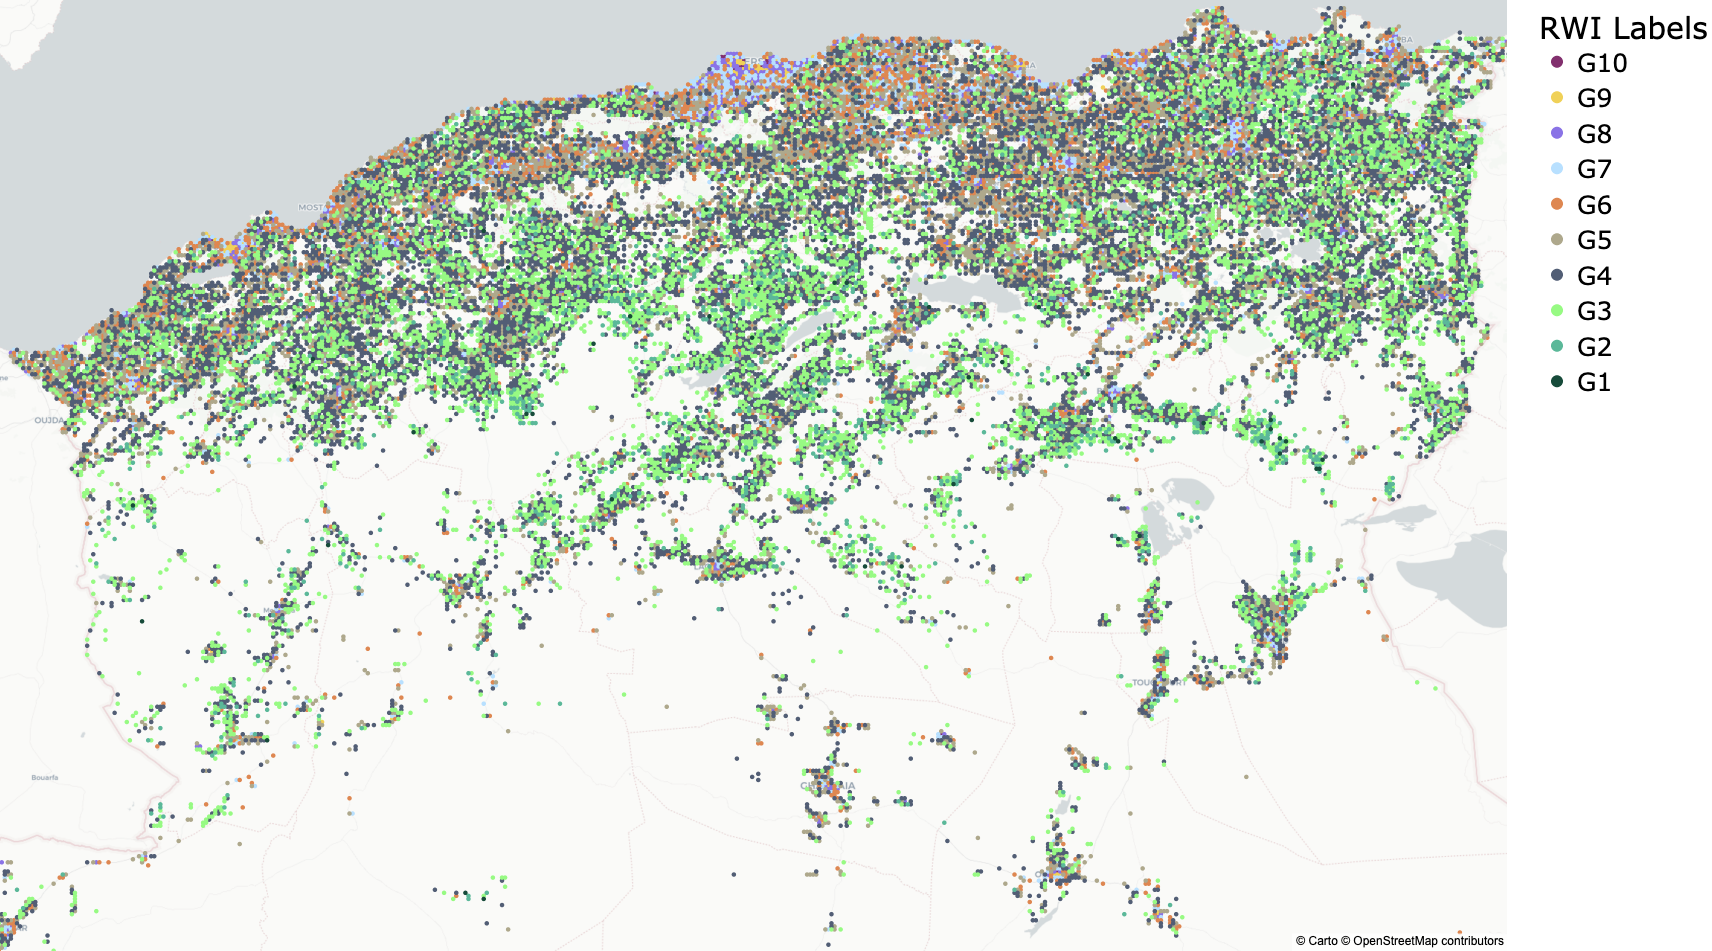
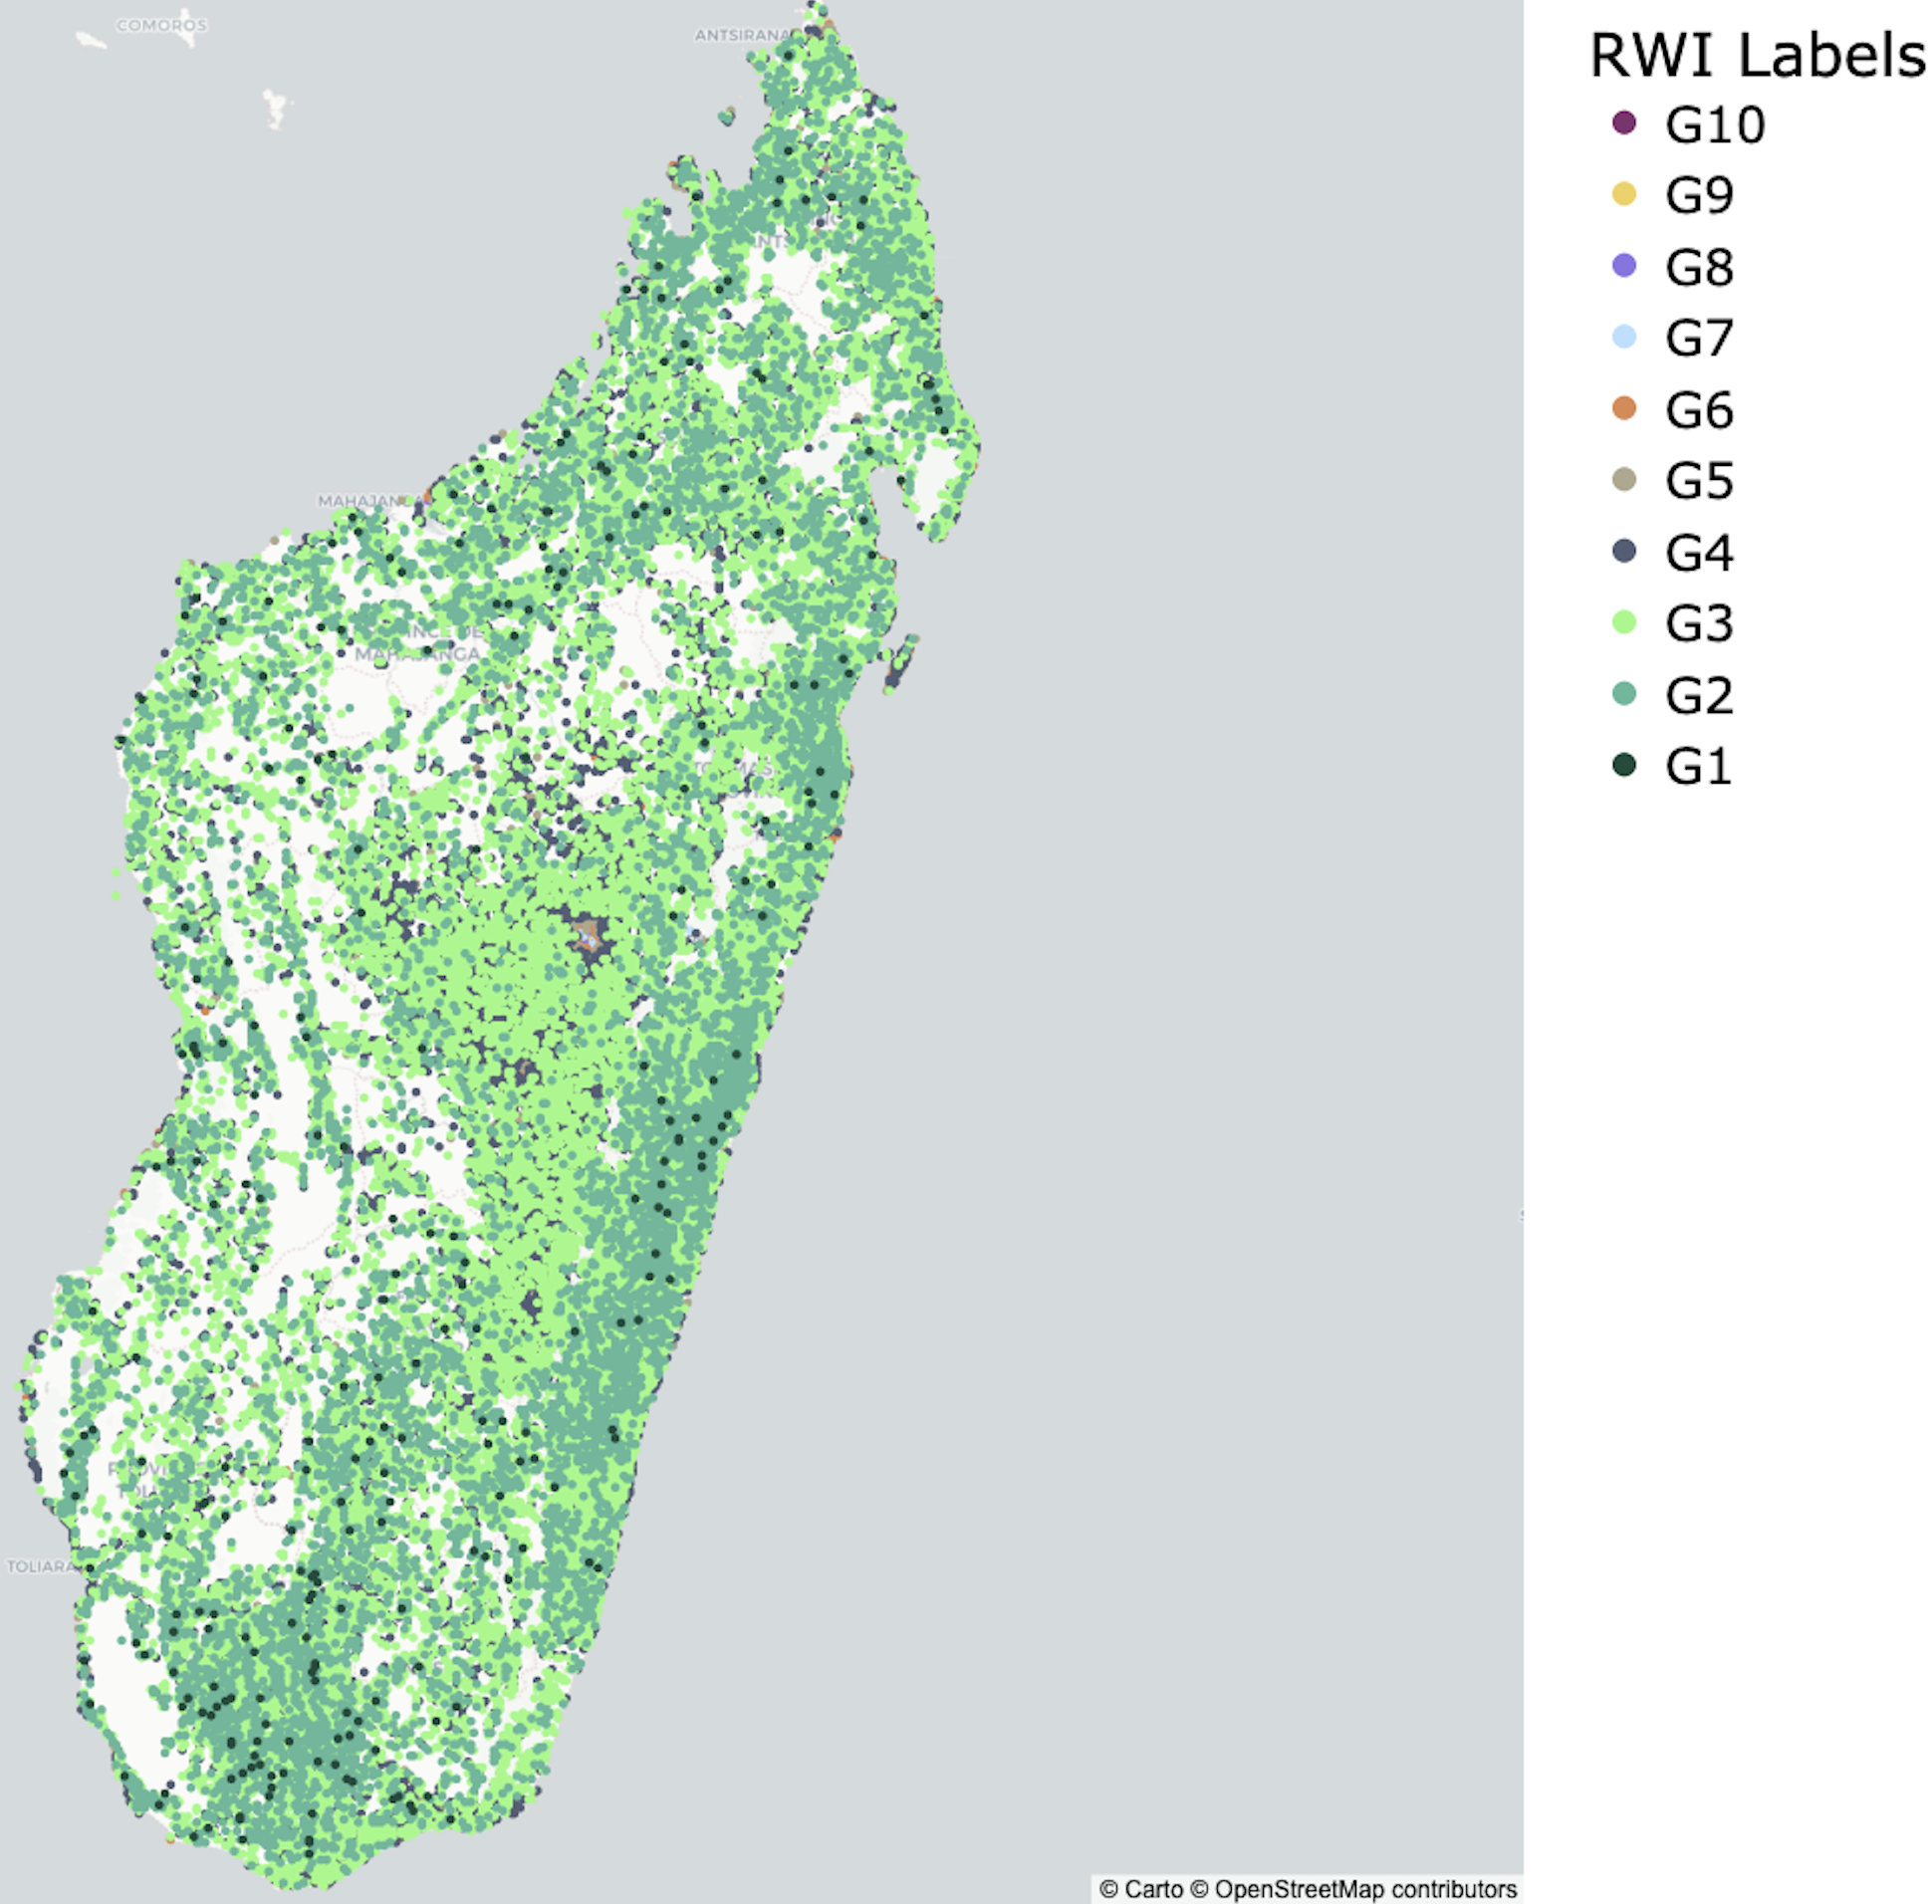
Fine-grained relative wealth estimates were associated with each geotagged image. To assess the image distribution according to local wealth estimates, we utilize the relative wealth index (RWI) data collected from Low and Middle-Income Countries (LMICs) by Facebook’s Data for Good project (Chi et al., 2022). RWI scores are normalized by nation, so the data should only be utilized for intra-national wealth analyses. The RWI dataset contains relative wealth distribution for African countries, such that the following countries are excluded from our original list of nations: {Somalia, Seychelles, Sao Tome and Principe, Sudan, and South Sudan}. Therefore, when analyzing the relationship of RWI to geotagged images, these four countries are excluded. RWI data is provided in the form of 3-lettered iso-codes and the following variables are provided: “quadkey”, “latitude”, “longitude”, “rwi”, and “error”; Nominatim API (Open street map, 2020) was utilized to assign and add variables “country”, “city” to the data files. Using k-nearest neighbour, we computed the nearest RWI-labeled geographic location of each image. Figure 1(a) shows the distribution of RWI-labeled geotagged images with a maximum tolerance limit between the image geotag and the nearest RWI-labeled location.
2.1.4. Manual Content Annotation
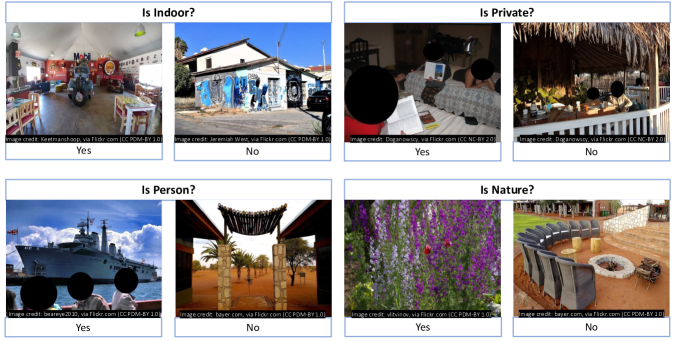
Crowdsourced annotations were collected for six additional image features.
We used Amazon Mechanical Turk (AMT) to collect annotations describing image contents. Each Human Intelligence Task (HIT) involved images, with six binary questions per image as shown in Figure 2. The binary questions required the annotator label the image according to: indoor vs. outdoor setting, public vs. private setting, nature vs. manmade setting, the presence of people, real vs. synthetic image type, and offensive vs. inoffensive content. Below were our definitions of the terms or labels;
-
•
An indoor image is typically within the confines of a building or transportation means, e.g., inside a house, restaurant, or car.
-
•
A private image is taken from a household or residential setting, e.g., kitchen or bathroom.
-
•
A nature image predominantly contains nature or contents within a natural environment, e.g., images of a sky, ocean, water, people and animals outside of towns and cities.
-
•
A real image is not a painting, an image of another image, or an otherwise synthetically generated image.
-
•
An offensive image contains abuse or violence, nudity or suggestive content, hate symbols or writings, and or rude gestures.
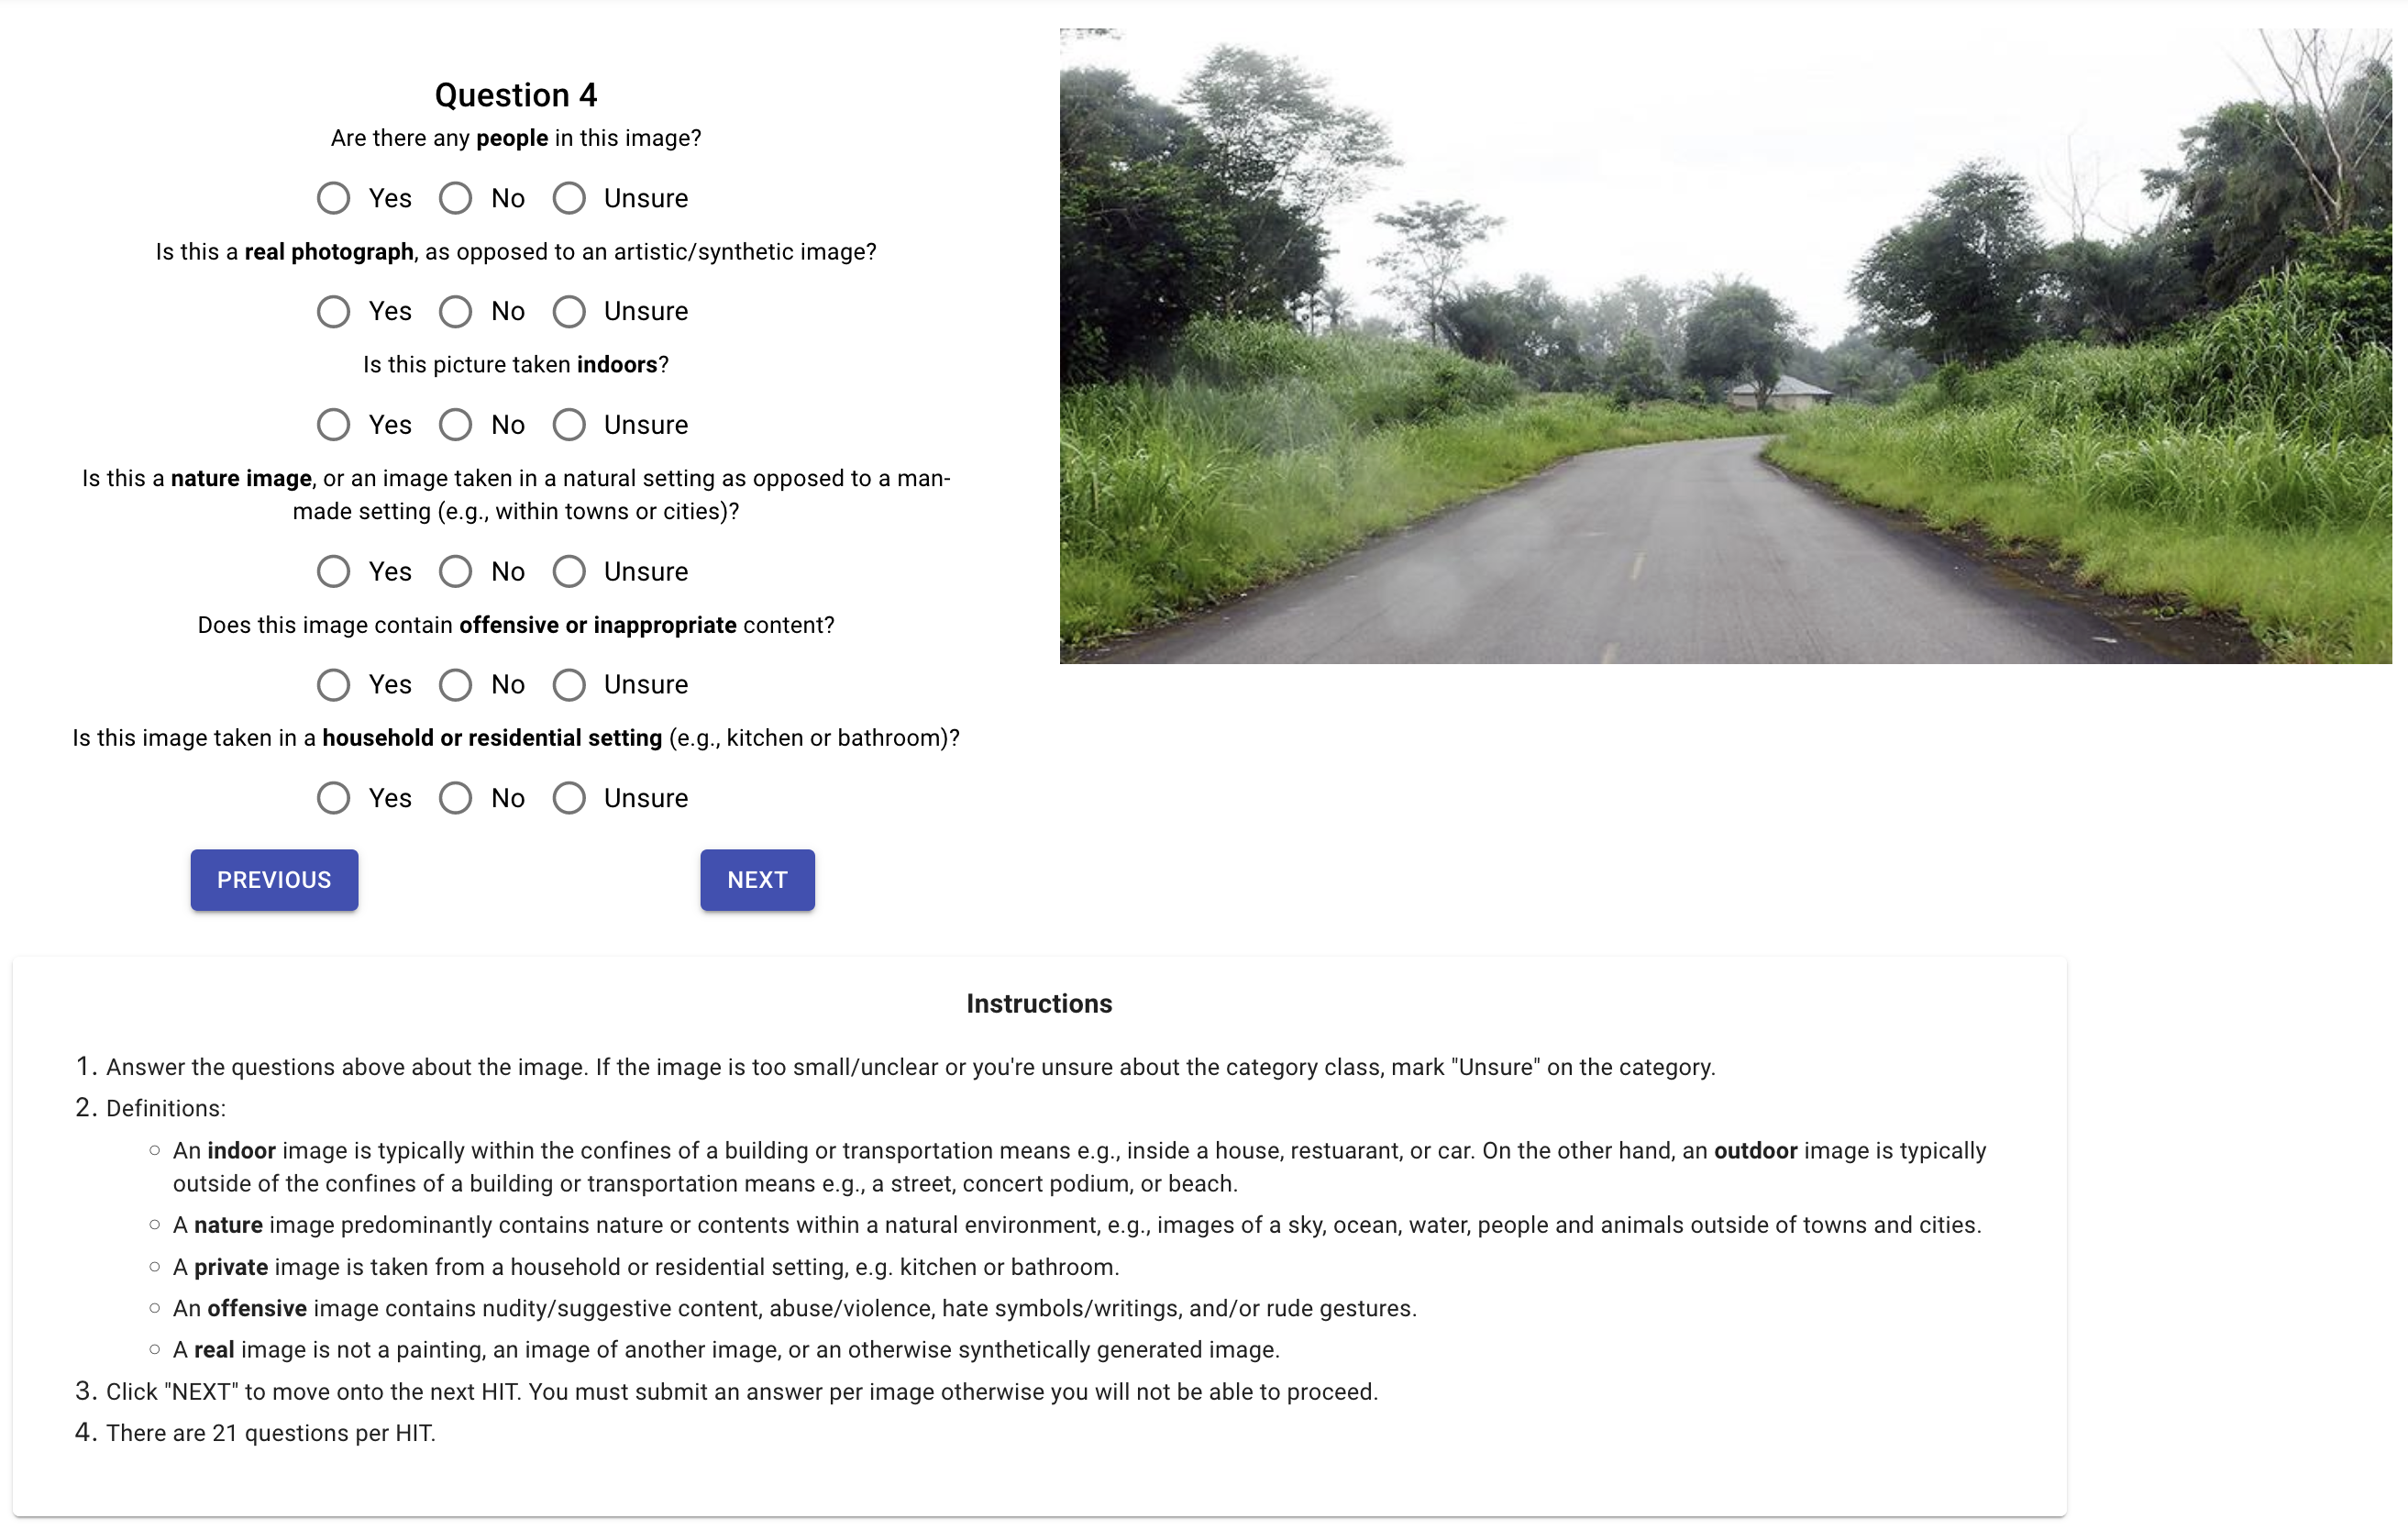
We compensated workers at a rate of USD/hour. We sourced each annotation from three different annotators and chose the majority consensus value, excluding those images marked “Unsure”. To ensure high annotation quality, we recruited workers with at least acceptance rating and completion of + prior tasks. We randomly inserted a gold standard image within each set of standard images to assess annotator performance; if the worker failed on this test image, we discarded the annotations but still paid the worker for their contribution.
2.2. Limitations of Our Approach
We acknowledge four notable limitations of our method. First, we recognize that geolocation data (longitude, latitude) is inherently unreliable. Values may be modified or removed by the Flickr user or otherwise not reflect the location of capture, while reverse geolocation methods are computationally expensive and often fail, particularly with geographic locations close to region borders. This motivates our use of both geotags and country name tags for cross-validation of location, though this restricts us to fewer data samples overall. Secondly, to determine location of photographers to assess localness, we relied on photographers volunteered information of their location from their profile metadata. This doesn’t take into account confounding factors like an immigrant visiting their home nation. Additionally, some forms of geodiversity are difficult or impossible to determine from visual inspection alone, such as an individual’s gender, ethnicity, or religion. Finally, we were limited to obtaining data using only two queries, namely, by country name or country name + “people”. We anticipate future work exploring a wider variety of query terms, both in English and local languages; here, no correlation was determined between dominant national languages and geotagged image availability.
2.3. Ethical Considerations
We note that although the Flickr images analyzed here are all publicly viewable, we show that most have the Flickr default license of “All Rights Reserved”. Thus, we have opted to provide image URLs in lieu of images for direct download to avoid duplication of protected content, particularly in the event that a Flickr user chooses to remove or modify the permissions of an image. We acknowledge the weaknesses of this method in terms of consent, as public Flickr images are typically not taken by those in the images (as pointed out by Birhane and Prabhu (2021)); likewise, Flickr users may wish to avoid the utilization of their images for research purposes. Given that our objective is to critique large-scale image dataset curation strategies which do not respect image licenses (e.g. the methodology for generating the COCO dataset), we deemed it justifiable to perform basic analyses on protected images and to build awareness regarding widespread license violations in standard AI training pipelines.
|
|
|
|
3. Results and Discussion
3.1. Data Availability and Geographic Distribution
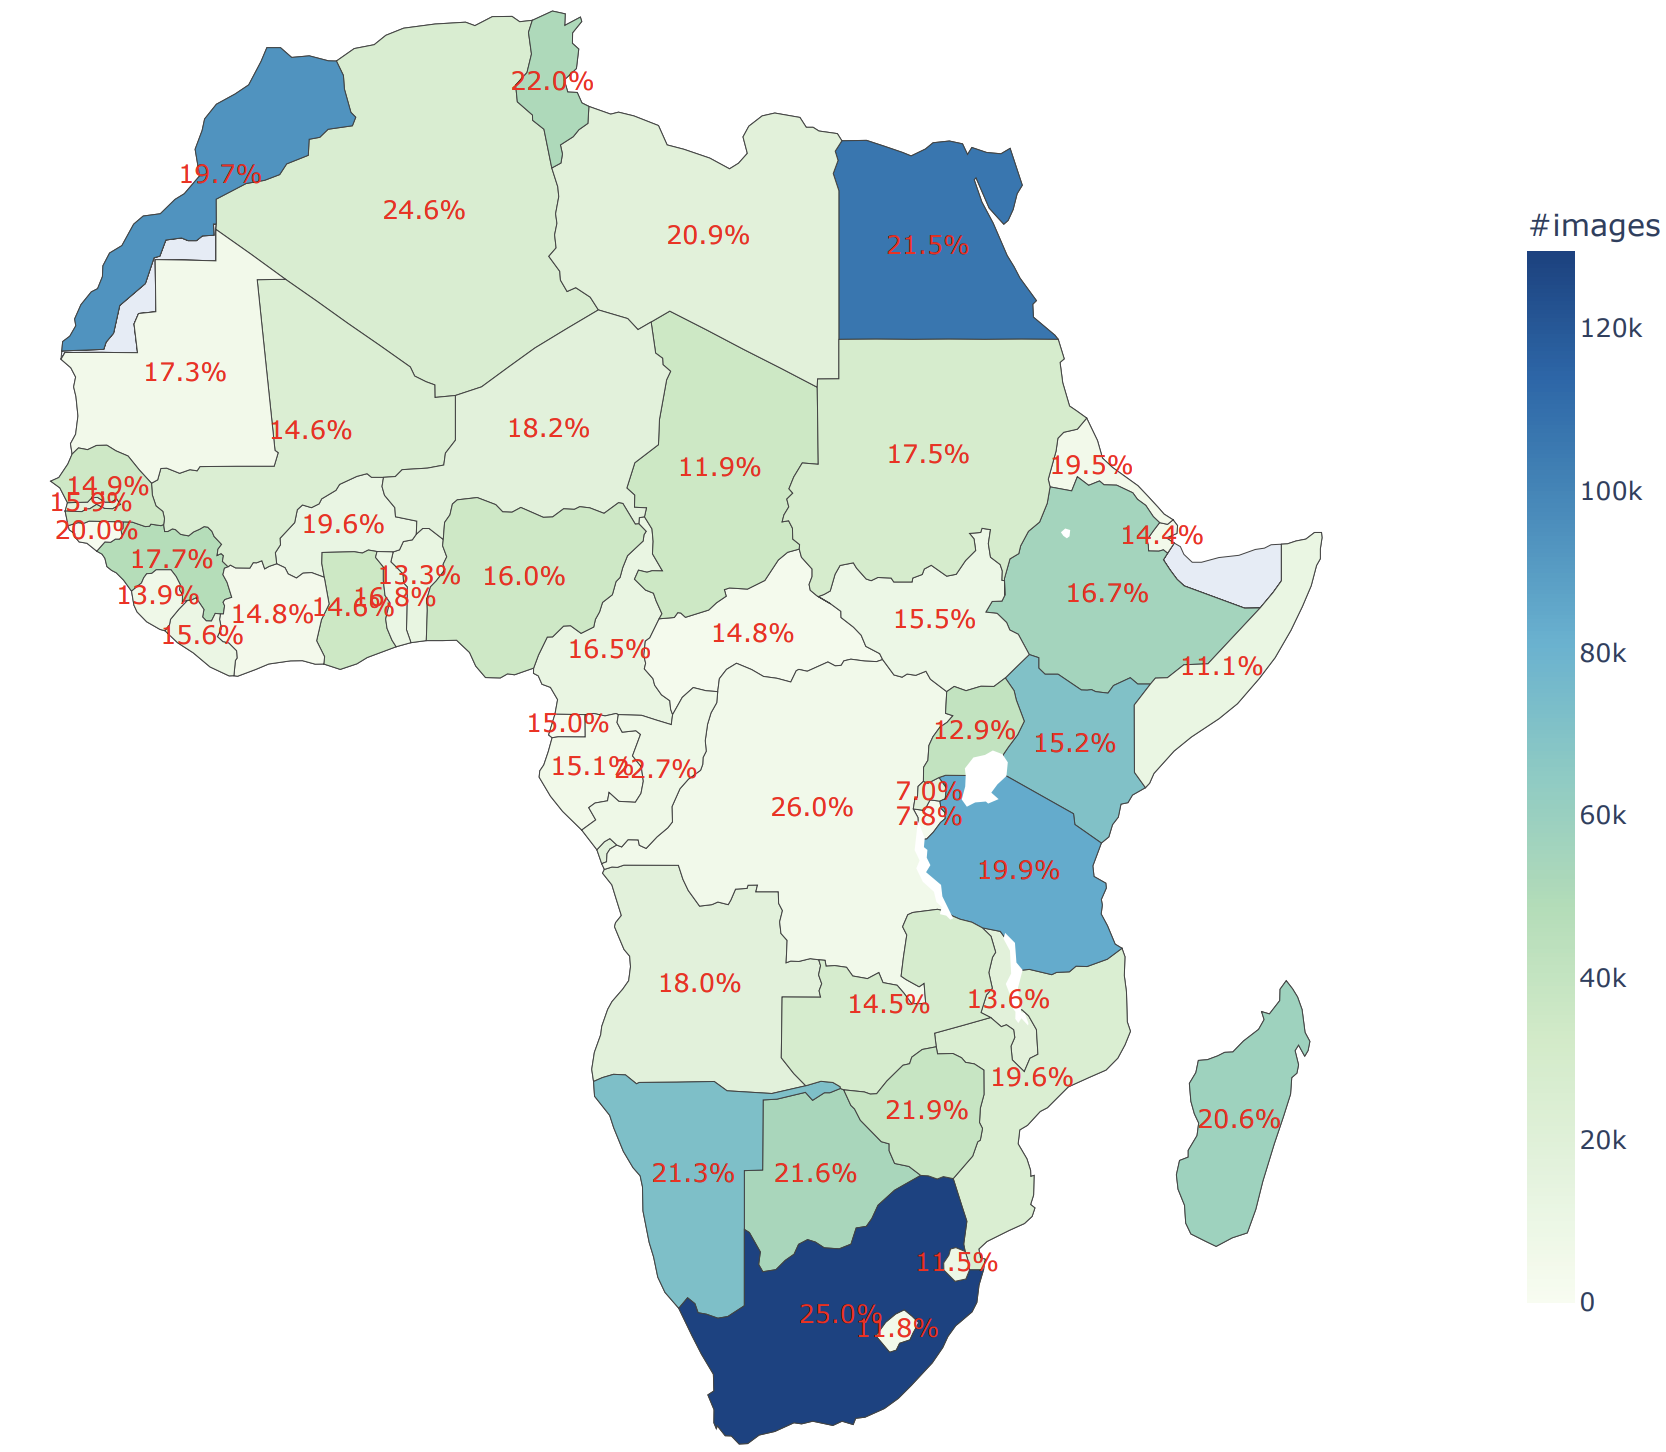
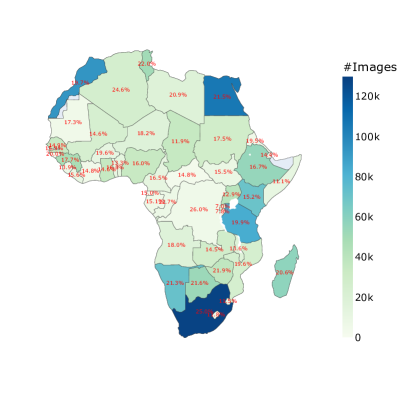
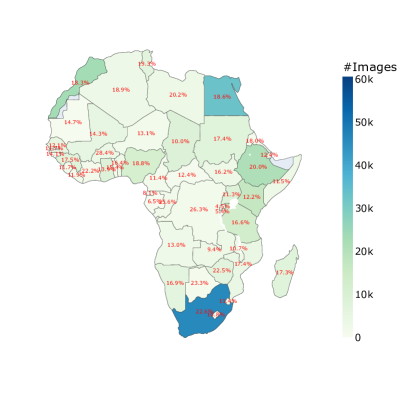
There were very few geotagged images from Africa, as shown in Figures 3(a) and 3(b) and in Appendix Figures 1(a) and 1(b), and Tables A1 and A1. In terms of total geotagged image counts with query-by-name and query-by-name+people from African nations, South Africa ( & ) and Egypt ( & ) had the highest counts, and Equatorial Guinea ( & ) and Sao Tome and Principe ( & ) had the lowest counts. Cape Verde had the highest percentage of geotagged images () from query-by-name and Burkina Faso () had the highest from query-by-name+people. By contrast, Rwanda had the lowest percentage of geotagged images (, ) from both query-by-name and query-by-name+people. African nations with the highest and lowest percentages of geotagged images are summarized in Table 1 and Table 2.
Thus, the low number of African geotagged images indicates the ineffectiveness of Flickr scraping as a data collection methodology in this region and, therefore, a need to explore alternative geodiverse data collection methods, e.g. utilizing manual data collection.
The population-matched European countries had higher numbers and percentages of geotagged images than the corresponding African countries, as is further emphasized in Table 3. For example, with query-by-name, despite relatively similar population sizes, the percentage change of the number of geotagged images from Sierra Leone to Switzerland is , that is, as many total geotagged images as Sierra Leone as shown in Table 3.
Thus, African countries had far fewer images (both geotagged and non-geotagged) than the corresponding European countries of similar population size. We recommend that computer vision experts be cognizant of this discrepancy in Flickr scraped datasets and to consider the corresponding potential for bias when training computer vision models.
We analyzed the statistical effect of factors that might potentially affect taking, uploading and tagging images on Flickr; population-size, internet usage, official language, and countries’ GDP.
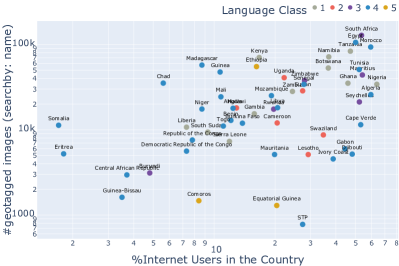
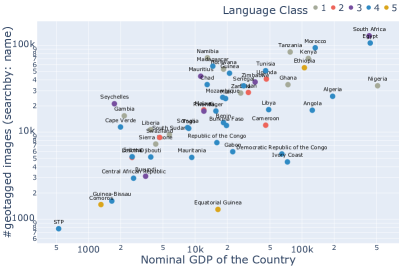
In general, the number of geotagged images increased with population size (correlation: & , query-by-name and query-by-name+people respectively), internet usage ( & ), and GDP ( & ); the latter two are shown in Figure 4.
An investigation of the effect of these variables on the number of geotagged images was found to be statistically significant: (population size: p-value & p-value , query-by-name and query-by-name+people respectively), (internet usage: p-value & p-value ), and (GDP: p-value & p-value ). By contrast, official language was not found to have a meaningful correlation to the number of geotagged images (p-value & p-value ).
Because image dataset queries are typically done in English, to assess the impact of dominant national languages relative to English on geotagged data availability, we coded each of the countries’ official languages ((Wikipedia.org, 2022e)) according to five categories for analysis: - (English is the only official language), - (English is among the two official languages), - (English among atleast three official languages), - (English not among atmost three official languages), and - (English not among atleast three official languages). No correlation was determined for any language category.
Thus, when data collection is required in regions with lower population size, internet usage, and/or GDP, we recommend the use of local, manual data collection techniques in lieu of webscraping whenever feasible. Additionally, RWI information may be useful when assessing diverse areas for data collection.
3.2. Tags and Licenses: Query-Based and Applicability Limitations
|
|
.
The use of both country name tags and geotags (latitude/longitude) was found to be necessary to ensure data was accurately sourced from the country of interest.
The naïve country name querying method is particularly limiting when applied to certain nations, such as Chad, Guinea, and Republic of Congo. Images from query by Chad were predominantly geotagged from United States (), United Kingdom (), and Canada (), with only of the images coming from Chad according to geotag location results. In total images from query by Chad were geotagged from countries. Likewise, images from query by Guinea predominantly came from Papua New Guinea () and United States (), with geotags from countries. Finally, image geotags from query by Republic of Congo mainly reflected the following countries; Congo, The Democratic Republic of the (), United Kingdom (), and United States ().
Thus, we conclude that reliance upon country name queries is insufficient for constructing a geodiverse dataset in the absence of more robust geolocation data. We recommend that data collectors consider using RWI data to source more geographically diverse visual data.
We furthermore report the most frequent tags as the name of the place where the image was taken, for example “Africa” and the country name, in addition to image contents. The least frequent tags were usually those in foreign languages and whose meanings were hard to decipher because of multiple concatenated words.
Thus, in an African context, the utilization of image tags alone to generate datasets with specific image content may be less reliable due to the variable nature of selected tags; we believe this warrants future exploration.
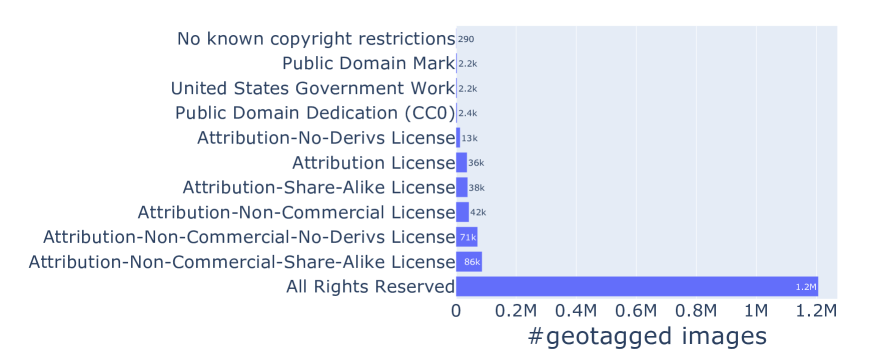
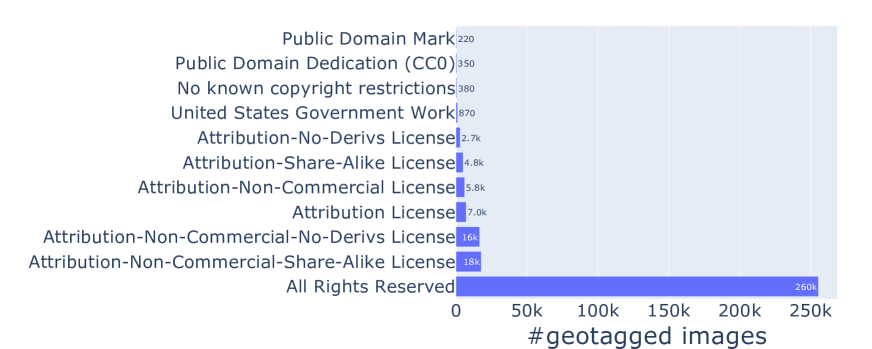
Additionally, the vast majority of images with query-by-name and query-by-name+people respectively are licensed as “All Rights Reserved” (, ), indicating the Flickr default setting when images are uploaded to the platform (see Figure 5(b)).
Thus, those constructing datasets using Flickr Africa data must be aware that most images are unavailable for model training and evaluation without copyright violations, thereby further limiting ethical access to geographically diverse data.
3.3. Geodiversity by RWI
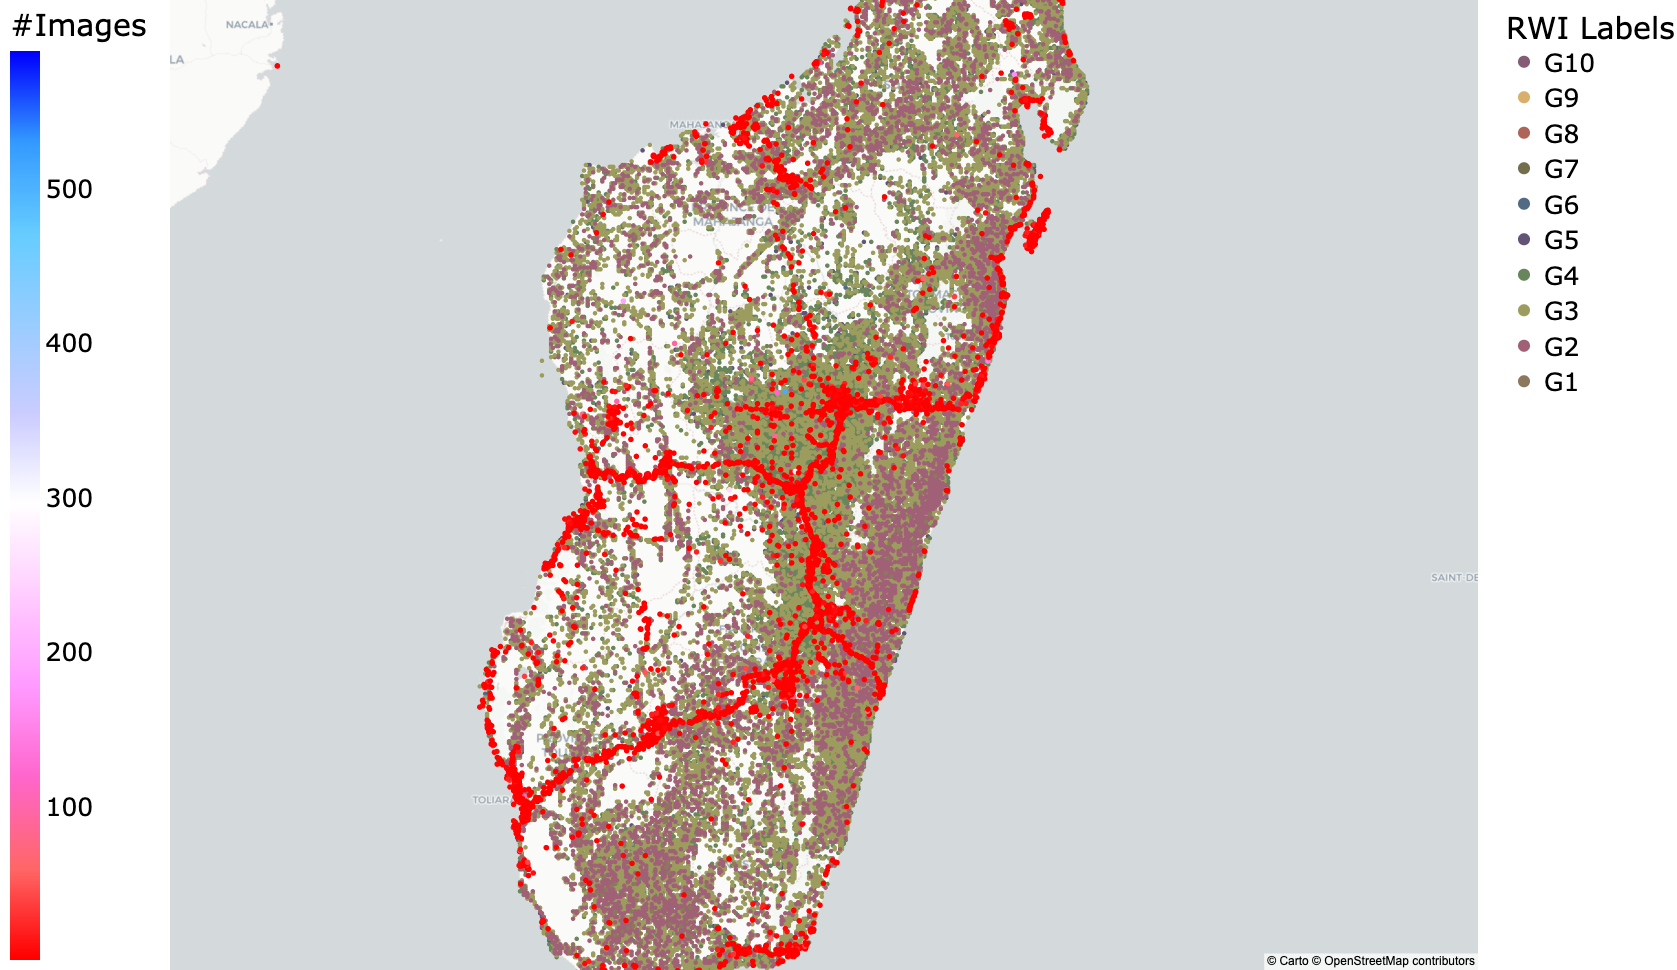
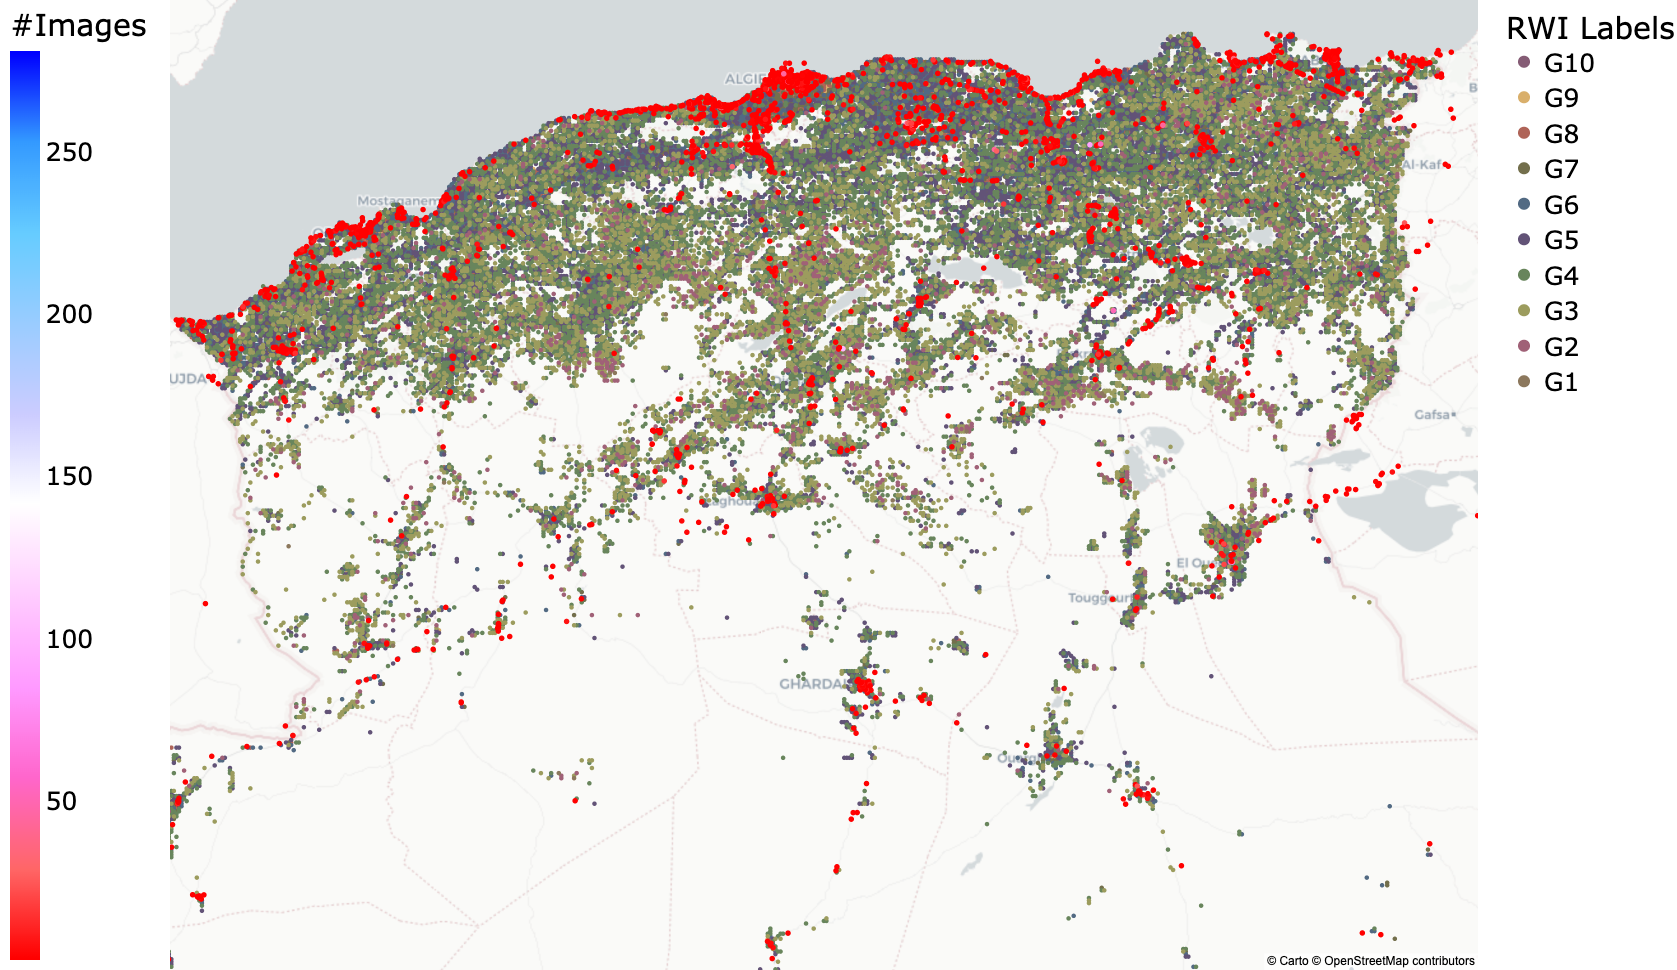
To assess the impact of wealth on the availability of geotagged image data, we examine image counts by RWI values binned into percentile groups, -. For most nations, the majority of image data comes from the middle RWI regions (, and ) and the least from low RWI regions (, and ). However, this is not always the case, e.g. Madagascar and Algeria from which data is sourced from low-income areas (along main roads close to national parks) or high-income areas (in major cities), respectively.
Thus, RWI has potential as a mechanism for constructing geo-diverse datasets in future work.
3.4. Image Content
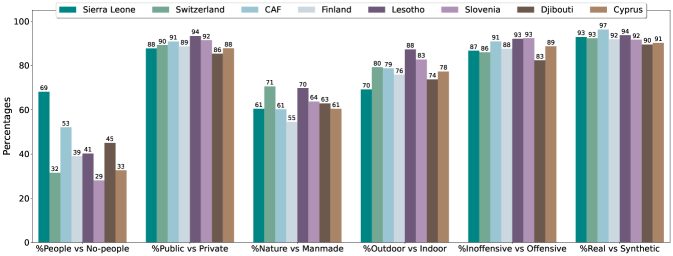
By utilizing crowdsourced annotations, we examine 16,000 images’ content data across 2,000 images from each population-matched African and European nation pair (identical to the image subset in Section 3.5). Sample images by attribute and results for matched African/European nation pairs are shown in Figure 6(a) for each binary attribute with the exception of “offensive” vs. “inoffensive” content and with manually obscured human faces. We collected information about these six attributes to gauge the applicability of African-sourced image datasets for various computer vision tasks: e.g. the presence of people for human-centric tasks such as pose estimation, body part segmentation or face detection; the prevalence of indoor/private settings for specific object recognition tasks; or real/appropriate image content for training dataset viability. Likewise, we originally hypothesized that African images were more likely to be taken by foreigners (which was found to be supported by the data; see Section 3.5); this motivated the count of nature-centric images.
The AMT results revealed that query-by-name images from both African and European countries were predominantly “real” (% and %), “inoffensive” (% and %), “outdoor” (% and %), “public” (% and %), and “nature” (% and %) images. There were negligible variations across nations for the percentage of “real’, “outdoor”, “public”, and “nature” images. However, as shown in Figure 6(b), nations varied in percentage of people in images, and in general most nations’ images did not contain people. For example, of Sierra Leone’s sampled geotagged images contained people, while only of Djibouti’s sampled geotagged images contained people.
Thus, although no major differences between African and European image content were observed according to the six attributes considered, we believe these findings are important in the context of data regarding data quantity. Given that image content was fairly similar across most attributes annotated, and there exist far fewer geotagged images from Africa (see Table 3), we anticipate insufficient African data availability for certain computer vision tasks. For example, the lower prevalence of images captured in “private” and “indoor” settings indicates e.g. household object image data inaccessibility, which thereby impacts downstream object recognition system models consistent with the findings of DeVries et al. (2019).
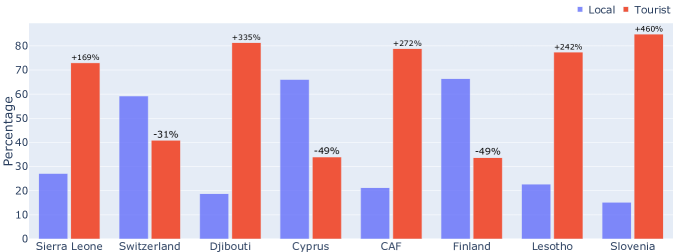
3.5. Local vs. Non-Local Representation
Beyond analyzing the image content of the randomly-sampled images from each of the nations, we examined the local vs. non-local status of those Flickr users who captured and uploaded the geotagged images. An assessment of the residence or origin of the Flickr users revealed that for the African geotagged nations, images were far more likely to be taken by foreigners than locals whereas the opposite trend was observed for higher-GDP European nations, according to comparisons between geotags and Flickr users’ reported locations. For Sierra Leone, of images were captured by foreigners compared to locals, while for Switzerland it was -. The same trend applies to Djibouti and Cyprus (+ and -) and CAF and Finland (+ and -); results are reported in Figure 7.
In general, more images across all nations were taken by non-locals compared to the smaller -image datasets (e.g. see Appendix Figures A11 and A9). However, the prior trends held in the sense that when African countries were considered, far more geotagged images were taken by non-locals than in comparable European nations, e.g., + for Sierra Leone versus + for Switzerland.
Additionally, a random inspection of the Flickr map222When we inspected the map (https://www.flickr.com/map/) on 06-16-2023, 2/2 of the geotagged images were taken by France and Spanish photographers also further shows that images geotagged in Africa are less likely to be taken by the locals.
Thus, the prevalence of non-local representation may explain the image content results described in the previous section, as Flickr users from similar backgrounds may contribute image data from both Africa and Europe. AI practitioners should be wary of stereotyped representations of African life within such datasets given that these images are typically taken by foreigners in public, outdoor locations.
Additionally, current methodologies for image dataset collection are unlikely to capture visual data pertaining to the private, daily life of African people nor visual information the locals of each country consider to be important, resulting in biases propagated by AI systems trained on such data.
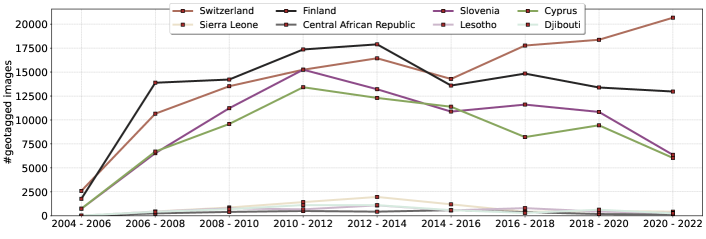
3.6. Temporal Analysis
We performed a temporal analysis to investigate and contextualize the data in time according to data quantity, relative wealth index (RWI) at location of capture, license type and Flickr user origin. We studied the geotagged images distribution in the in approximately 2-year spans time ranges.
Number of geotagged images
In general, there were relatively fewer geotagged images in the years 2004-2006 and 2020-2022, as shown in Figure 8 for population-matched African/European nations and in the Appendix LABEL:table:temporal_name_counts and LABEL:table:temporal_people_counts for all African nations. The image distribution could be the result of factors including less internet penetration and popularity of Flickr from 2004-2006 reducing image uploads, and the COVID-19 pandemic limiting outdoor activities from 2020-2022. This trend held in all analyzed countries with the exception of Switzerland; there, the highest number of images was uploaded in the date range 2020-2022, as shown in Figure 8. The highest number of uploaded and subsequently downloaded geotagged images for most nations came from 2010-2014, potentially explained by the growth of internet usage and exposure to Flickr in different countries within this time span.
RWI regions of image uploads
We explored trends in dominant RWI groups per nation over time, in order to determine if there were observable shifts towards images sourced from higher or lower RWI regions. Over the time range of 2004 to 2022, query-by-name images from Botswana, Libya, Namibia, South Africa, Tunisia, Swaziland, Uganda, Zambia, and Zimbabwe all came from the middle RWI regions. Images from Morocco consistently came from the upper RWI regions. On the other hand, query-by-name+people images from Rwanda and Swaziland all came from the middle RWI regions and those from Morocco all came from upper RWI regions. Lower and middle RWI regions countries had their data distributions varying between lower and middle RWI regions over the years. Countries whose images were from predominantly upper RWI regions had their data distributions varying between middle and upper RWI regions over the years.
Licenses of the uploaded images
We analyzed the quantity of images with various Flickr license options. Images were found to have predominantly the “All Rights Reserved” license type across all time ranges analyzed; as noted in Section 3.2, this substantially limits data usage. There were almost no images licensed under the “Public Domain Dedication (CC0) CC” and “Public Domain Mark CC” among those uploaded to Flickr from to .
Local vs. non-local representation
We performed a temporal analysis of the geotagged images to investigate the local vs. non-local status of Flickr users. For the randomly sampled images from the countries analyzed for image content, we observed differences in sampling dates: that is, Cyprus, Slovenia, and Finland images were mainly sampled from to ; Switzerland images were mainly sampled from to ; and the African nation images were were mainly sampled from to . Following these results, we repeated the temporal analysis across all images sourced from each of the nations. In general, more images across all nations were taken by non-locals compared to the smaller -image datasets. However, the prior trends held in the sense that when African countries were considered, far more geotagged images were taken by non-locals than in comparable European nations, e.g., + for Sierra Leone versus + for Switzerland. Section 3.5 describes implications of non-local representation in image data from Africa; namely, the risk of an “othering” phenomenon and its impact on downstream bias in AI systems.
4. Conclusion and Future Work
Geographical context shapes data, and data shapes the performance of models trained using such data. The key findings from our Flickr Africa data analysis (1) expose the limitations of current large-scale image data collection methodologies, and (2) expose unique data challenges to Africa, including the lack of data crucial to specific domains (e.g. a researcher cannot source sufficient, representative household object data if very few images are taken within indoor/private scenes). Notably, we reported on the extreme lack of data availability when compared to wealthy European nations; for instance when querying by country name, Switzerland had 18x the geotagged image data as Sierra Leone, an African nation of similar population size (8.75M vs. 8.30M, respectively), while Sao Tome and Principle only had (776, 116) geotagged images in total (depending on query). Moreover, data may be even less accessible according to use case, given that most of the Flickr Africa data has a restrictive use license, and certain image content attributes were found to appear less frequently (e.g. private and indoor settings). Nationally, higher quantities of geotagged image data was found to positively correlate with population size, GDP, and Internet usage, but no significant correlation was discovered based on dominant national languages. Additionally, we interrogate where African image data comes from: generally from middle-wealth regions as measured intra-nationally by RWI, though this differs by nation; and with images mainly taken by foreigners, though the opposite trend is identified in wealthier European nations. We discussed how AI systems may propagate biases in accordance with the stereotyped representation of African life by outsiders. Temporal analyses were performed and demonstrated that certain trends, such as dominant RWI region, prevalence of restrictive license type, and non-local representation of African nations in geotagged images held over time.
Looking forward, we encourage new scholarship centering novel methods for sourcing geodiverse datasets and measuring new forms of geodiversity specific to Africa, such as analyses of tribal diversity as opposed to the more commonly studied diversity by race/ethnicity. We openly provide our large-scale dataset to enable future researchers to utilize and augment Flickr Africa for model evaluations across a wide domain of computer vision tasks; likewise, more rigorous bias identification methods (e.g. (Wang et al., 2022)) may uncover still more limitations. Finally, we would be interested to explore the extent to which privacy and consent are respected in Africa.
Acknowledgements.
We wish to thank Jerone Andrews and Dora Zhao in particular for their expertise and assistance with our work pertaining to crowdsourcing. We also express gratitude to the whole SONY AI Ethics team, especially William Thong for great discussions and informative feedback on this research. Lastly, we would like to thank the anonymous reviewers for the insightful feedback that helped improve our paper.References
- (1)
- Abebe et al. (2021) Rediet Abebe, Kehinde Aruleba, Abeba Birhane, Sara Kingsley, George Obaido, Sekou L. Remy, and Swathi Sadagopan. 2021. Narratives and Counternarratives on Data Sharing in Africa. In Proceedings of the 2021 ACM Conference on Fairness, Accountability, and Transparency (Virtual Event, Canada) (FAccT ’21). Association for Computing Machinery, New York, NY, USA, 329–341. https://doi.org/10.1145/3442188.3445897
- Anane-Sarpong et al. (2018) Evelyn Anane-Sarpong, Tenzin Wangmo, Claire Leonie Ward, Osman Sankoh, Marcel Tanner, and Bernice Simone Elger. 2018. ”You cannot collect data using your own resources and put It on open access”: Perspectives from Africa about public health data-sharing. Developing world bioethics 18 4 (Dec. 2018), 394–405. https://pubmed.ncbi.nlm.nih.gov/28745008/
- AR. (2016) Rönnlund AR. 2016. Dollar Street. https://www.gapminder.org/dollar-street.
- Ayush et al. (2021) Kumar Ayush, Burak Uzkent, Chenlin Meng, Kumar Tanmay, Marshall Burke, David Lobell, and Stefano Ermon. 2021. Geography-Aware Self-Supervised Learning. In Proceedings of the IEEE/CVF International Conference on Computer Vision (ICCV). 10181–10190.
- Ayush et al. (2020) Kumar Ayush, Burak Uzkent, Chenlin Meng, Kumar Tanmay, Marshall Burke, David B. Lobell, and Stefano Ermon. 2020. Geography-Aware Self-Supervised Learning. CoRR abs/2011.09980 (2020). arXiv:2011.09980 https://arxiv.org/abs/2011.09980
- Birhane and Prabhu (2021) Abeba Birhane and Vinay Uday Prabhu. 2021. Large Image Datasets: A Pyrrhic Win for Computer Vision?. In Proceedings of the IEEE/CVF Winter Conference on Applications of Computer Vision (WACV). 1537–1547.
- Buolamwini and Gebru (2018) Joy Buolamwini and Timnit Gebru. 2018. Gender Shades: Intersectional Accuracy Disparities in Commercial Gender Classification. In Proceedings of the 1st Conference on Fairness, Accountability and Transparency (Proceedings of Machine Learning Research, Vol. 81), Sorelle A. Friedler and Christo Wilson (Eds.). PMLR, 77–91. https://proceedings.mlr.press/v81/buolamwini18a.html
- Chi et al. (2022) Guanghua Chi, Han Fang, Sourav Chatterjee, and Joshua E. Blumenstock. 2022. Microestimates of wealth for all low- and middle-income countries. Proceedings of the National Academy of Sciences 119, 3 (2022), e2113658119. https://doi.org/10.1073/pnas.2113658119 arXiv:https://www.pnas.org/doi/pdf/10.1073/pnas.2113658119
- Chi et al. (2019) Pei-Yu Peggy Chi, Matthew Long, Akshay Gaur, Abhimanyu Deora, Anurag Batra, and Daphne Luong. 2019. Crowdsourcing Images for Global Diversity. In Proceedings of the 21st International Conference on Human-Computer Interaction with Mobile Devices and Services (Taipei, Taiwan) (MobileHCI ’19). Association for Computing Machinery, New York, NY, USA, Article 79, 10 pages. https://doi.org/10.1145/3338286.3347546
- Christie et al. (2017) Gordon A. Christie, Neil Fendley, James Wilson, and Ryan Mukherjee. 2017. Functional Map of the World. CoRR abs/1711.07846 (2017). arXiv:1711.07846 http://arxiv.org/abs/1711.07846
- Crandall et al. (2009) David J. Crandall, Lars Backstrom, Daniel Huttenlocher, and Jon Kleinberg. 2009. Mapping the World’s Photos. In Proceedings of the 18th International Conference on World Wide Web (Madrid, Spain) (WWW ’09). Association for Computing Machinery, New York, NY, USA, 761–770. https://doi.org/10.1145/1526709.1526812
- Deng et al. (2009) Jia Deng, Wei Dong, Richard Socher, Li-Jia Li, Kai Li, and Li Fei-Fei. 2009. ImageNet: A large-scale hierarchical image database. In 2009 IEEE Conference on Computer Vision and Pattern Recognition. 248–255. https://doi.org/10.1109/CVPR.2009.5206848
- Denton et al. (2021) Emily Denton, Mark Díaz, Ian Kivlichan, Vinodkumar Prabhakaran, and Rachel Rosen. 2021. Whose Ground Truth? Accounting for Individual and Collective Identities Underlying Dataset Annotation. CoRR abs/2112.04554 (2021). arXiv:2112.04554 https://arxiv.org/abs/2112.04554
- DeVries et al. (2019) Terrance DeVries, Ishan Misra, Changhan Wang, and Laurens van der Maaten. 2019. Does Object Recognition Work for Everyone?. In IEEE Conference on Computer Vision and Pattern Recognition Workshops, CVPR Workshops 2019, Long Beach, CA, USA, June 16-20, 2019. Computer Vision Foundation / IEEE, 52–59. http://openaccess.thecvf.com/content_CVPRW_2019/html/cv4gc/de_Vries_Does_Object_Recognition_Work_for_Everyone_CVPRW_2019_paper.html
- Johnson et al. (2016) Isaac L. Johnson, Subhasree Sengupta, Johannes Schöning, and Brent Hecht. 2016. The Geography and Importance of Localness in Geotagged Social Media. In Proceedings of the 2016 CHI Conference on Human Factors in Computing Systems (San Jose, California, USA) (CHI ’16). Association for Computing Machinery, New York, NY, USA, 515–526. https://doi.org/10.1145/2858036.2858122
- Karkkainen and Joo (2021) Kimmo Karkkainen and Jungseock Joo. 2021. FairFace: Face Attribute Dataset for Balanced Race, Gender, and Age for Bias Measurement and Mitigation. In Proceedings of the IEEE/CVF Winter Conference on Applications of Computer Vision. 1548–1558.
- Kounadi et al. (2013) Ourania Kounadi, Thomas J Lampoltshammer, Michael Leitner, and Thomas Heistracher. 2013. Accuracy and privacy aspects in free online reverse geocoding services. Cartography and Geographic Information Science 40, 2 (2013), 140–153.
- Kuznetsova et al. (2020) Alina Kuznetsova, Hassan Rom, Neil Alldrin, Jasper Uijlings, Ivan Krasin, Jordi Pont-Tuset, Shahab Kamali, Stefan Popov, Matteo Malloci, Alexander Kolesnikov, et al. 2020. The open images dataset v4: Unified image classification, object detection, and visual relationship detection at scale. International Journal of Computer Vision 128, 7 (2020), 1956–1981.
- Kuznetsova et al. (2018) Alina Kuznetsova, Hassan Rom, Neil Alldrin, Jasper R. R. Uijlings, Ivan Krasin, Jordi Pont-Tuset, Shahab Kamali, Stefan Popov, Matteo Malloci, Tom Duerig, and Vittorio Ferrari. 2018. The Open Images Dataset V4: Unified image classification, object detection, and visual relationship detection at scale. CoRR abs/1811.00982 (2018). arXiv:1811.00982 http://arxiv.org/abs/1811.00982
- Lin et al. (2014) Tsung-Yi Lin, Michael Maire, Serge Belongie, James Hays, Pietro Perona, Deva Ramanan, Piotr Dollár, and C. Lawrence Zitnick. 2014. Microsoft COCO: Common Objects in Context. In Computer Vision – ECCV 2014, David Fleet, Tomas Pajdla, Bernt Schiele, and Tinne Tuytelaars (Eds.). Springer International Publishing, Cham, 740–755. https://doi.org/10.1007/978-3-319-10602-1_48
- Mandal et al. (2021) Abhishek Mandal, Susan Leavy, and Suzanne Little. 2021. Dataset Diversity: Measuring and Mitigating Geographical Bias in Image Search and Retrieval. In Proceedings of the 1st International Workshop on Trustworthy AI for Multimedia Computing (Virtual Event, China) (Trustworthy AI’21). Association for Computing Machinery, New York, NY, USA, 19–25. https://doi.org/10.1145/3475731.3484956
- Open street map (2020) Open street map. 2020. Open-source geocoding with OpenStreetMap data. https://nominatim.org/. Accessed: 2022-06-15.
- Penman (2020) Richard Penman. 2020. reverse-geocode 1.4.1. https://pypi.org/project/reverse-geocode/#description. Accessed: 2022-06-15.
- Sambasivan et al. (2021) Nithya Sambasivan, Erin Arnesen, Ben Hutchinson, Tulsee Doshi, and Vinodkumar Prabhakaran. 2021. Re-Imagining Algorithmic Fairness in India and Beyond. In Proceedings of the 2021 ACM Conference on Fairness, Accountability, and Transparency (Virtual Event, Canada) (FAccT ’21). Association for Computing Machinery, New York, NY, USA, 315–328. https://doi.org/10.1145/3442188.3445896
- Shankar et al. (2017) Shreya Shankar, Yoni Halpern, Eric Breck, James Atwood, Jimbo Wilson, and D. Sculley. 2017. No Classification without Representation: Assessing Geodiversity Issues in Open Data Sets for the Developing World. https://doi.org/10.48550/ARXIV.1711.08536
- Thomee et al. (2016) Bart Thomee, David A Shamma, Gerald Friedland, Benjamin Elizalde, Karl Ni, Douglas Poland, Damian Borth, and Li-Jia Li. 2016. YFCC100M: The new data in multimedia research. Commun. ACM 59, 2 (2016), 64–73.
- Wang et al. (2022) Angelina Wang, Alexander Liu, Ryan Zhang, Anat Kleiman, Leslie Kim, Dora Zhao, Iroha Shirai, Arvind Narayanan, and Olga Russakovsky. 2022. REVISE: A Tool for Measuring and Mitigating Bias in Visual Datasets. Int. J. Comput. Vision 130, 7 (jul 2022), 1790–1810. https://doi.org/10.1007/s11263-022-01625-5
- Weinberg (2022) L. Weinberg. 2022. Rethinking Fairness: An Interdisciplinary Survey of Critiques of Hegemonic ML Fairness Approaches. The journal of artificial intelligence research 74 (May 2022). https://doi.org/10.1613/jair.1.13196
- Wesley and Matisziw (2021) Aaron M. Wesley and Timothy C. Matisziw. 2021. Methods for Measuring Geodiversity in Large Overhead Imagery Datasets. IEEE Access 9 (2021), 100279–100293. https://doi.org/10.1109/ACCESS.2021.3096034
- Wikipedia.org (2022a) Wikipedia.org. 2022a. List of African countries by population. https://en.wikipedia.org/wiki/List_of_African_countries_by_population. Accessed: 2022-08-27.
- Wikipedia.org (2022b) Wikipedia.org. 2022b. List of countries by GDP (nominal) - IMF. https://en.wikipedia.org/wiki/List_of_countries_by_GDP_(nominal). Accessed: 2022-08-27.
- Wikipedia.org (2022c) Wikipedia.org. 2022c. List of countries by number of Internet users. https://en.wikipedia.org/wiki/List_of_countries_by_number_of_Internet_users. Accessed: 2022-08-27.
- Wikipedia.org (2022d) Wikipedia.org. 2022d. List of European countries by population. https://en.wikipedia.org/wiki/List_of_European_countries_by_population. Accessed: 2022-08-27.
- Wikipedia.org (2022e) Wikipedia.org. 2022e. List of official languages by country and territory. https://en.wikipedia.org/wiki/List_of_official_languages_by_country_and_territory. Accessed: 2022-08-27.
- Xiang (2022) Alice Xiang. 2022. Being ’Seen’ vs. ’Mis-Seen’: Tensions between Privacy and Fairness in Computer Vision. Harvard Journal of Law & Technology (Apr 2022). https://ssrn.com/abstract=4068921
- Yin et al. (2021) Da Yin, Liunian Harold Li, Ziniu Hu, Nanyun Peng, and Kai-Wei Chang. 2021. Broaden the Vision: Geo-Diverse Visual Commonsense Reasoning. In Proceedings of the 2021 Conference on Empirical Methods in Natural Language Processing. Association for Computational Linguistics, Online and Punta Cana, Dominican Republic, 2115–2129. https://doi.org/10.18653/v1/2021.emnlp-main.162
- Zhao et al. (2021) Dora Zhao, Angelina Wang, and Olga Russakovsky. 2021. Understanding and Evaluating Racial Biases in Image Captioning. In Proceedings of the IEEE/CVF International Conference on Computer Vision (ICCV). 14830–14840.
Appendix A Supplemental Data
A.1. Geotagged image distribution
|
|
A.2. Analysis of Flickr user-defined tags for geotagged images
“query-by-name”.
“query-by-name”.
“query-by-name+people”.
“query-by-name+people”.
A.3. Country and city tag distribution for geotagged images
| Query country | #Countries returned | Top country | Frequency | Percentage |
| Tanzania | 104 | Tanzania, United Republic of | 77613 | 92.8707 |
| Seychelles | 86 | Seychelles | 19077 | 89.9307 |
| Cape Verde | 74 | Cape Verde | 10293 | 89.7776 |
| Tunisia | 103 | Tunisia | 45688 | 89.7621 |
| Morocco | 120 | Morocco | 82983 | 88.768 |
| Mauritius | 89 | Mauritius | 38851 | 88.3921 |
| Namibia | 96 | Namibia | 63312 | 88.3049 |
| Gambia | 80 | Gambia | 13596 | 88.2571 |
| Sao Tome and Principe | 22 | Sao Tome and Principe | 674 | 86.8557 |
| Uganda | 122 | Uganda | 34326 | 84.087 |
| Botswana | 74 | Botswana | 43371 | 81.7688 |
| Madagascar | 155 | Madagascar | 45127 | 78.5815 |
| Djibouti | 64 | Djibouti | 4021 | 77.6405 |
| Rwanda | 84 | Rwanda | 13459 | 77.1599 |
| Malawi | 74 | Malawi | 13913 | 77.1316 |
| Kenya | 128 | Kenya | 53006 | 75.2402 |
| Mauritania | 73 | Mauritania | 3830 | 74.7171 |
| Swaziland | 49 | Swaziland | 6495 | 74.6638 |
| Ethiopia | 134 | Ethiopia | 41070 | 74.5386 |
| Burkina Faso | 74 | Burkina Faso | 8881 | 74.3865 |
| Senegal | 127 | Senegal | 24800 | 72.6783 |
| Ghana | 122 | Ghana | 25316 | 71.9429 |
| Guinea-Bissau | 40 | Guinea-Bissau | 1159 | 71.8092 |
| Mozambique | 93 | Mozambique | 17489 | 69.5692 |
| South Africa | 177 | South Africa | 88677 | 69.1201 |
| Sierra Leone | 64 | Sierra Leone | 4934 | 67.5613 |
| Cameroon | 104 | Cameroon | 8112 | 67.4707 |
| Comoros | 47 | Comoros | 966 | 65.7143 |
| Algeria | 102 | Algeria | 16744 | 64.7762 |
| Egypt | 151 | Egypt | 68311 | 64.4492 |
| Burundi | 65 | Burundi | 1927 | 61.9017 |
| Gabon | 86 | Gabon | 3688 | 61.8481 |
| Zimbabwe | 96 | Zimbabwe | 22461 | 59.4962 |
| Benin | 90 | Benin | 7631 | 59.2285 |
| Lesotho | 42 | Lesotho | 3021 | 58.9924 |
| Nigeria | 133 | Nigeria | 20149 | 58.9738 |
| Zambia | 87 | Zambia | 16612 | 58.9643 |
| Libya | 100 | Libyan Arab Jamahiriya | 10553 | 58.1272 |
| Eritrea | 82 | Eritrea | 2920 | 55.928 |
| Togo | 94 | Togo | 6083 | 55.0299 |
| Mali | 129 | Mali | 13352 | 54.8562 |
| Chad | 129 | United States | 19260 | 54.629 |
| Ivory Coast | 78 | Cote d’Ivoire | 2450 | 53.858 |
| South Sudan | 83 | South Sudan | 4864 | 51.855 |
| Sudan | 124 | Sudan | 14010 | 48.9398 |
| Liberia | 110 | Liberia | 5086 | 47.4396 |
| Democratic Republic of the Congo | 86 | Congo, The Democratic Republic of the | 2412 | 42.964 |
| Equatorial Guinea | 54 | Equatorial Guinea | 553 | 42.7688 |
| Republic of Congo | 93 | Congo, The Democratic Republic of the | 3195 | 42.1448 |
| Angola | 117 | Angola | 7487 | 41.8713 |
| Central African Republic | 86 | Central African Republic | 1125 | 38.084 |
| Somalia | 113 | Somalia | 3840 | 33.9943 |
| Guinea | 190 | Papua New Guinea | 14267 | 29.9714 |
| Niger | 147 | Niger | 3517 | 20.0903 |
| Query country | #Cities returned | Top city | Frequency | Percentage | Capital |
| Sao Tome and Principe | 22 | São Tomé | 475 | 70.4748 | São Tomé |
| Eritrea | 82 | Asmara | 1750 | 59.9315 | Asmara |
| Djibouti | 64 | Djibouti | 2326 | 57.8463 | Djibouti |
| Liberia | 110 | Monrovia | 2873 | 56.4884 | Monrovia |
| Seychelles | 86 | La Passe | 10688 | 56.0256 | Victoria |
| Burundi | 65 | Bujumbura | 914 | 47.4312 | Bujumbura |
| Zimbabwe | 96 | Victoria Falls | 9859 | 43.8939 | Harare |
| Equatorial Guinea | 54 | Malabo | 238 | 43.038 | Malabo |
| Angola | 117 | Luanda | 3059 | 40.8575 | Luanda |
| Gabon | 86 | Libreville | 1480 | 40.1302 | Libreville |
| Central African Republic | 86 | Bangui | 427 | 37.9556 | Bangui |
| Rwanda | 84 | Musanze | 4993 | 37.0979 | Kigali |
| Mozambique | 93 | Maputo | 6481 | 37.0576 | Maputo |
| Republic of Congo | 93 | Makoua | 180 | 36.2903 | Brazzaville |
| Lesotho | 42 | Nako | 1045 | 34.5912 | Maseru |
| Togo | 94 | Lomé | 2007 | 32.9936 | Lomé |
| Botswana | 74 | Kasane | 14262 | 32.8837 | Gaborone |
| Niger | 147 | Niamey | 1127 | 32.0444 | Niamey |
| Burkina Faso | 74 | Ouagadougou | 2619 | 29.4899 | Ouagadougou |
| Libya | 100 | Tripoli | 2924 | 27.7078 | Tripoli |
| Morocco | 120 | Marrakesh | 21581 | 26.0065 | Rabat |
| Somalia | 113 | Mogadishu | 983 | 25.599 | Mogadishu |
| Swaziland | 49 | Lobamba | 1655 | 25.4811 | Mbabane and Lobamba |
| Guinea-Bissau | 40 | Bubaque | 291 | 25.1079 | Bissau |
| Cape Verde | 74 | Vila de Sal Rei | 2356 | 22.8893 | Praia |
| Guinea | 190 | Conakry | 621 | 21.6 | Conakry |
| Egypt | 151 | Cairo | 14531 | 21.2718 | Cairo |
| Gambia | 80 | Sukuta | 2887 | 21.2342 | Banjul |
| Ivory Coast | 78 | Abidjan | 503 | 20.5306 | Abidjan and Yamoussoukro |
| Ghana | 122 | Accra | 5114 | 20.2007 | Accra |
| Mauritius | 89 | Quatre Bornes | 7657 | 19.7086 | Port Louis |
| Zambia | 87 | Chipata | 3270 | 19.6846 | Lusaka |
| Mauritania | 73 | Nouadhibou | 707 | 18.4595 | Nouakchott |
| Mali | 129 | Bamako | 2392 | 17.9149 | Bamako |
| Nigeria | 133 | Ikoyi | 3583 | 17.7825 | Abuja |
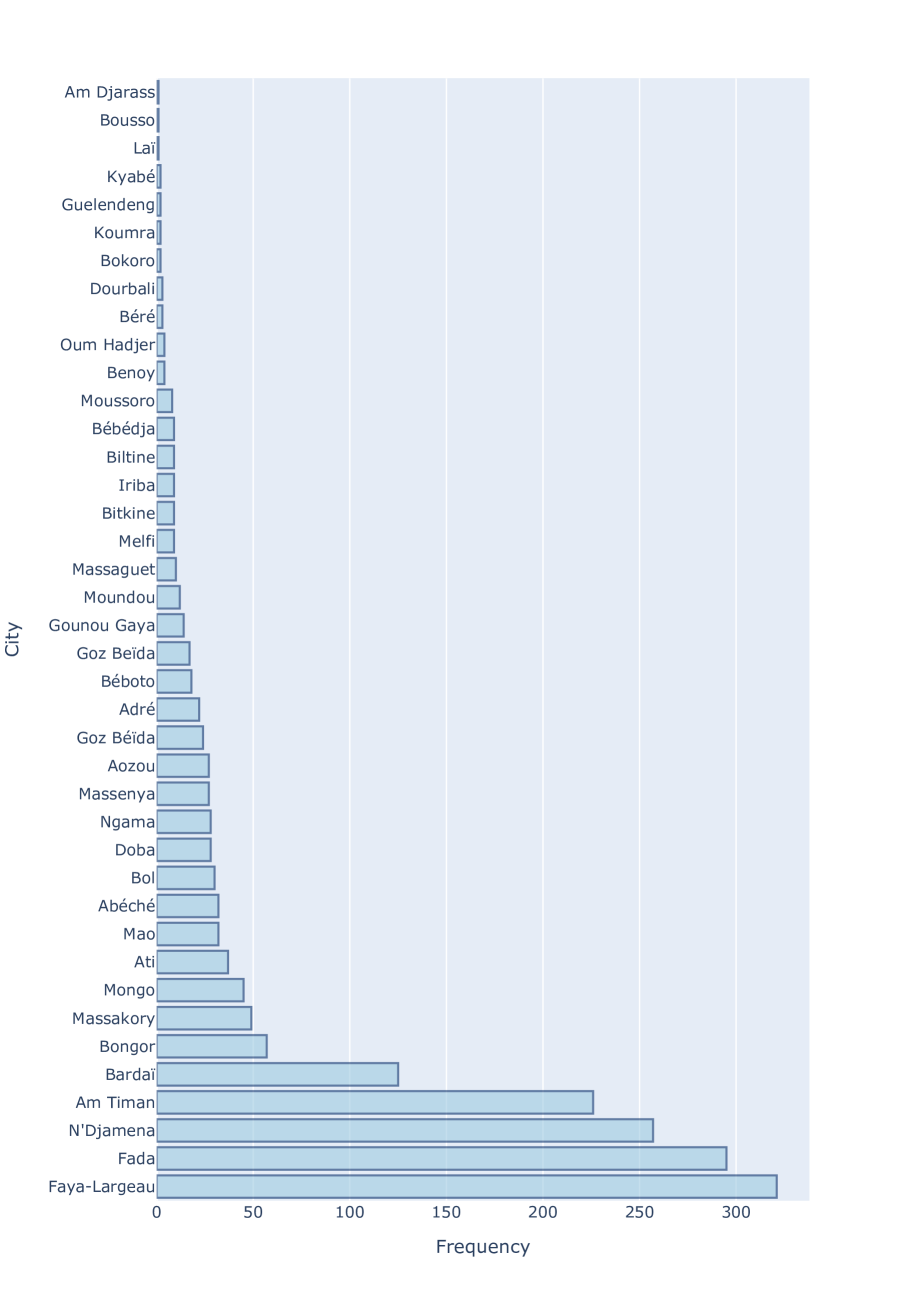
| Chad | 129 | Faya-Largeau | 321 | 17.725 | N’Djamena |
| Benin | 90 | Cotonou | 1334 | 17.4813 | Porto-Novo |
| Algeria | 102 | Algiers | 2909 | 17.3734 | Algiers |
| Tanzania | 104 | Ngorongoro | 13458 | 17.3399 | Dar es Salaam |
| Senegal | 127 | Dakar | 4291 | 17.3024 | Dakar |
| Namibia | 96 | Maltahø̈he | 9938 | 15.6969 | Windhoek |
| Democratic Republic of the Congo | 86 | Yangambi | 378 | 15.6716 | Kinshasa |
| Ethiopia | 134 | Addis Ababa | 6274 | 15.2764 | Addis Ababa |
| Kenya | 128 | Nairobi | 7893 | 14.8908 | Nairobi |
| Tunisia | 103 | Tunis | 6465 | 14.1503 | Tunis |
| Malawi | 74 | Lilongwe | 1942 | 13.9582 | Lilongwe |
| Comoros | 47 | Moroni | 124 | 12.8364 | Moroni |
| South Africa | 177 | Cape Town | 9451 | 10.6578 | Cape Town and Pretoria |
| Cameroon | 104 | Yaoundé | 766 | 9.4428 | Yaoundé |
| Madagascar | 155 | Hell-Ville | 4136 | 9.1652 | Antananarivo |
| Uganda | 122 | Entebbe | 2501 | 7.286 | Kampala |
A.4. Geotagged image distribution by RWI groups
|
|
A.5. Temporal analysis of geotagged images
Geotagged images were assessed in approximately 2-year spans as labeled from A-I, from earlier to later date-time values.
| A: | , :::: — , :::: |
| B: | , :::: — , :::: |
| C: | , :::: — , :::: |
| D: | , :::: — , :::: |
| E: | , :::: — , :::: |
| F: | , :::: — , :::: |
| G: | , :::: — , :::: |
| H: | , :::: — , :::: |
| I: | , :::: — , :::: |
For brevity, we report license type according to the numerical license IDs used by Flickr:
| : | All Rights Reserved |
| : | Attribution-NonCommercial-ShareAlike License |
| : | Attribution-NonCommercial License |
| : | Attribution-NonCommercial-NoDerivs License |
| : | Attribution License |
| : | Attribution-ShareAlike License |
| : | Attribution-NoDerivs License |
| : | No known copyright restrictions |
| : | United States Government Work |
| : | Public Domain Dedication (CC0) |
| : | Public Domain Mark |
| Country | 2004 - 2006 | 2006 - 2008 | 2008 - 2010 | 2010 - 2012 | 2012 - 2014 | 2014 - 2016 | 2016 - 2018 | 2018 - 2020 | 2020 - 2022 |
| Algeria | 54 | 1258 | 1829 | 3417 | 2606 | 1376 | 3639 | 2872 | 471 |
| Angola | 2 | 793 | 1066 | 1526 | 1465 | 2068 | 1087 | 940 | 688 |
| Benin | 205 | 1231 | 1241 | 1212 | 1462 | 1760 | 444 | 889 | 494 |
| Botswana | 101 | 2523 | 1881 | 4680 | 4169 | 5244 | 4765 | 5395 | 2043 |
| Burkina Faso | 26 | 492 | 2514 | 1950 | 1886 | 661 | 1072 | 625 | 183 |
| Burundi | 3 | 496 | 412 | 567 | 485 | 293 | 99 | 67 | 25 |
| Cameroon | 27 | 1216 | 1347 | 1753 | 2688 | 595 | 625 | 213 | 342 |
| Cape Verde | 95 | 422 | 1050 | 2042 | 1877 | 1593 | 1286 | 1237 | 780 |
| CAF | 6 | 114 | 243 | 188 | 260 | 315 | 221 | 82 | 61 |
| Chad | 5 | 48 | 164 | 335 | 558 | 168 | 232 | 690 | 330 |
| Comoros | 0 | 54 | 117 | 165 | 87 | 39 | 196 | 389 | 11 |
| Ivory Coast | 9 | 179 | 249 | 278 | 557 | 281 | 559 | 465 | 61 |
| DRC | 0 | 51 | 342 | 265 | 902 | 824 | 534 | 511 | 206 |
| Djibouti | 31 | 249 | 529 | 961 | 988 | 439 | 221 | 516 | 109 |
| Egypt | 1811 | 8430 | 6712 | 8695 | 8869 | 6271 | 6222 | 10061 | 8709 |
| Equatorial Guinea | 0 | 10 | 66 | 280 | 32 | 21 | 31 | 60 | 5 |
| Ethiopia | 460 | 3172 | 5170 | 8408 | 10038 | 4572 | 4821 | 3174 | 2836 |
| Eritrea | 56 | 807 | 391 | 497 | 518 | 373 | 573 | 261 | 78 |
| Gabon | 10 | 683 | 312 | 115 | 1047 | 230 | 178 | 291 | 99 |
| Gambia | 61 | 1378 | 1762 | 2540 | 3116 | 2111 | 1379 | 1265 | 612 |
| Ghana | 727 | 3511 | 3202 | 5195 | 6272 | 3055 | 1619 | 2536 | 726 |
| Guinea | 9 | 640 | 736 | 852 | 1955 | 1032 | 622 | 486 | 226 |
| Guinea-Bissau | 0 | 170 | 213 | 86 | 547 | 67 | 174 | 70 | 37 |
| Kenya | 1171 | 6690 | 6989 | 11238 | 9290 | 6557 | 7065 | 6123 | 6473 |
| Lesotho | 15 | 413 | 743 | 654 | 1000 | 517 | 684 | 379 | 235 |
| Liberia | 4 | 465 | 585 | 1384 | 1514 | 925 | 251 | 419 | 216 |
| Libya | 33 | 1739 | 3266 | 1933 | 857 | 365 | 234 | 106 | 73 |
| Madagascar | 354 | 3314 | 6036 | 7412 | 8374 | 5298 | 5347 | 6833 | 2672 |
| Malawi | 54 | 1268 | 2792 | 3191 | 2639 | 3039 | 1512 | 717 | 170 |
| Mali | 51 | 2478 | 3246 | 3751 | 2007 | 1156 | 509 | 550 | 322 |
| Mauritania | 14 | 366 | 504 | 457 | 788 | 264 | 202 | 341 | 164 |
| Mauritius | 78 | 3115 | 4333 | 5534 | 6502 | 7385 | 6256 | 4787 | 883 |
| Morocco | 1134 | 9253 | 9558 | 12840 | 12188 | 12230 | 10289 | 9288 | 4528 |
| Mozambique | 316 | 1692 | 3015 | 5243 | 5531 | 2519 | 1718 | 1370 | 588 |
| Namibia | 82 | 1379 | 2471 | 3897 | 3769 | 4003 | 3770 | 4129 | 1408 |
| Niger | 43 | 581 | 2019 | 1726 | 1378 | 793 | 924 | 395 | 491 |
| Nigeria | 262 | 1352 | 3208 | 4663 | 3141 | 3212 | 2470 | 1788 | 1302 |
| Republic of Congo | 0 | 78 | 446 | 751 | 1276 | 1042 | 624 | 610 | 224 |
| Rwanda | 244 | 2212 | 2847 | 2979 | 3319 | 1636 | 1242 | 587 | 395 |
| Sao Tome and Principe | 0 | 6 | 0 | 2 | 2 | 5 | 5 | 6 | 3 |
| Senegal | 263 | 3345 | 3986 | 5370 | 4734 | 4267 | 2618 | 2250 | 1152 |
| Seychelles | 0 | 7 | 20 | 18 | 32 | 15 | 35 | 40 | 14 |
| Sierra Leone | 1 | 374 | 728 | 1272 | 1650 | 935 | 198 | 128 | 55 |
| Somalia | 30 | 62 | 209 | 839 | 313 | 300 | 339 | 412 | 387 |
| South Africa | 1273 | 8854 | 7618 | 10576 | 11472 | 10292 | 9956 | 12215 | 11446 |
| South Sudan | 0 | 11 | 45 | 203 | 282 | 309 | 354 | 149 | 161 |
| Sudan | 0 | 134 | 425 | 735 | 525 | 430 | 433 | 342 | 436 |
| Swaziland | 15 | 376 | 1017 | 1192 | 2055 | 1076 | 1164 | 677 | 198 |
| Tanzania | 904 | 8022 | 8233 | 12414 | 13087 | 6851 | 9032 | 8222 | 5001 |
| Togo | 109 | 555 | 1349 | 2098 | 1177 | 932 | 470 | 290 | 312 |
| Tunisia | 446 | 4522 | 6867 | 9938 | 7888 | 6801 | 3799 | 3163 | 1934 |
| Uganda | 338 | 3665 | 4567 | 6681 | 5901 | 4616 | 3721 | 4802 | 876 |
| Zambia | 133 | 2546 | 3833 | 4143 | 4487 | 2433 | 2838 | 2384 | 490 |
| Zimbabwe | 49 | 2346 | 1862 | 4643 | 4791 | 4511 | 2855 | 2685 | 1011 |
| Country | 2004 - 2006 | 2006 - 2008 | 2008 - 2010 | 2010 - 2012 | 2012 - 2014 | 2014 - 2016 | 2016 - 2018 | 2018 - 2020 | 2020 - 2022 |
| Algeria | 0 | 36 | 65 | 314 | 508 | 156 | 116 | 185 | 17 |
| Angola | 0 | 49 | 53 | 278 | 186 | 209 | 44 | 168 | 9 |
| Benin | 79 | 104 | 205 | 243 | 323 | 706 | 113 | 128 | 3 |
| Botswana | 2 | 15 | 94 | 52 | 51 | 87 | 54 | 192 | 120 |
| Burkina Faso | 0 | 44 | 318 | 514 | 631 | 199 | 402 | 153 | 9 |
| Burundi | 1 | 42 | 53 | 104 | 71 | 57 | 8 | 9 | 2 |
| Cameroon | 4 | 100 | 147 | 285 | 198 | 96 | 245 | 35 | 9 |
| Cape Verde | 15 | 28 | 81 | 142 | 180 | 229 | 75 | 364 | 24 |
| CAF | 0 | 2 | 69 | 78 | 109 | 61 | 53 | 12 | 6 |
| Chad | 1 | 6 | 62 | 123 | 130 | 36 | 83 | 139 | 7 |
| Comoros | 0 | 7 | 12 | 51 | 11 | 5 | 24 | 72 | 1 |
| Ivory Coast | 0 | 4 | 23 | 87 | 51 | 27 | 141 | 169 | 9 |
| DRC | 0 | 28 | 86 | 133 | 304 | 147 | 230 | 217 | 15 |
| Djibouti | 2 | 31 | 43 | 121 | 151 | 104 | 31 | 122 | 0 |
| Egypt | 155 | 1408 | 1882 | 3864 | 6511 | 2384 | 1281 | 2204 | 326 |
| Equatorial Guinea | 0 | 0 | 3 | 102 | 4 | 3 | 0 | 8 | 2 |
| Ethiopia | 39 | 664 | 889 | 3801 | 5752 | 2265 | 1920 | 1483 | 999 |
| Eritrea | 0 | 129 | 25 | 173 | 214 | 19 | 24 | 120 | 3 |
| Gabon | 0 | 58 | 6 | 9 | 90 | 25 | 5 | 26 | 2 |
| Gambia | 2 | 90 | 122 | 385 | 350 | 201 | 158 | 81 | 43 |
| Ghana | 56 | 453 | 643 | 1520 | 1554 | 808 | 456 | 743 | 135 |
| Guinea | 1 | 48 | 63 | 246 | 354 | 255 | 75 | 114 | 22 |
| Guinea-Bissau | 0 | 11 | 17 | 26 | 64 | 4 | 21 | 19 | 2 |
| Kenya | 103 | 1238 | 1361 | 3885 | 3053 | 1513 | 1190 | 1007 | 218 |
| Lesotho | 1 | 14 | 40 | 115 | 127 | 120 | 60 | 67 | 20 |
| Liberia | 0 | 53 | 103 | 426 | 268 | 288 | 59 | 204 | 11 |
| Libya | 2 | 62 | 278 | 456 | 125 | 40 | 31 | 22 | 3 |
| Madagascar | 31 | 316 | 482 | 1164 | 1652 | 630 | 721 | 770 | 319 |
| Malawi | 2 | 174 | 450 | 462 | 679 | 290 | 237 | 72 | 4 |
| Mali | 6 | 369 | 729 | 923 | 629 | 304 | 116 | 182 | 26 |
| Mauritania | 3 | 37 | 36 | 52 | 136 | 61 | 15 | 19 | 10 |
| Mauritius | 1 | 208 | 124 | 520 | 1223 | 1753 | 1447 | 582 | 33 |
| Morocco | 75 | 1201 | 1775 | 4490 | 4445 | 3708 | 2629 | 1768 | 225 |
| Mozambique | 30 | 145 | 297 | 1049 | 1029 | 363 | 183 | 161 | 108 |
| Namibia | 1 | 125 | 192 | 529 | 438 | 443 | 490 | 385 | 32 |
| Niger | 1 | 50 | 96 | 373 | 352 | 196 | 131 | 79 | 12 |
| Nigeria | 87 | 256 | 476 | 1362 | 836 | 2167 | 817 | 772 | 89 |
| Republic of Congo | 0 | 28 | 91 | 175 | 318 | 166 | 233 | 253 | 19 |
| Rwanda | 13 | 260 | 285 | 604 | 737 | 226 | 433 | 129 | 18 |
| Sao Tome and Principe | 0 | 0 | 0 | 1 | 0 | 0 | 0 | 4 | 3 |
| Senegal | 38 | 289 | 373 | 905 | 643 | 749 | 452 | 323 | 69 |
| Seychelles | 0 | 1 | 3 | 3 | 6 | 0 | 3 | 0 | 11 |
| Sierra Leone | 0 | 31 | 75 | 356 | 454 | 280 | 24 | 25 | 3 |
| Somalia | 2 | 25 | 95 | 313 | 102 | 57 | 112 | 112 | 7 |
| South Africa | 187 | 2066 | 2696 | 5146 | 4282 | 3124 | 2593 | 2757 | 673 |
| South Sudan | 0 | 1 | 34 | 49 | 66 | 74 | 36 | 26 | 12 |
| Sudan | 0 | 16 | 87 | 217 | 154 | 87 | 50 | 70 | 15 |
| Swaziland | 3 | 27 | 55 | 206 | 425 | 169 | 112 | 192 | 26 |
| Tanzania | 48 | 784 | 1070 | 2727 | 2473 | 973 | 1032 | 1125 | 642 |
| Togo | 7 | 69 | 299 | 440 | 238 | 291 | 98 | 122 | 14 |
| Tunisia | 38 | 213 | 407 | 1485 | 1928 | 451 | 441 | 360 | 28 |
| Uganda | 53 | 886 | 477 | 1877 | 1232 | 1162 | 381 | 640 | 20 |
| Zambia | 6 | 333 | 231 | 544 | 588 | 287 | 285 | 192 | 21 |
| Zimbabwe | 1 | 127 | 73 | 458 | 456 | 392 | 143 | 106 | 38 |
| Country | 2004 - 2006 | 2006 - 2008 | 2008 - 2010 | 2010 - 2012 | 2012 - 2014 | 2014 - 2016 | 2016 - 2018 | 2018 - 2020 | 2020 - 2022 |
| Algeria | upper | upper | middle | middle | upper | upper | middle | middle | upper |
| Angola | lower,upper | middle | middle | middle | middle | lower | middle | middle | middle |
| Benin | upper | middle | middle | upper | middle | middle | upper | upper | middle |
| Botswana | middle | middle | middle | middle | middle | middle | middle | middle | middle |
| Burkina Faso | middle | upper | upper | upper | middle | lower | upper | upper | middle |
| Burundi | upper | middle | middle | middle | middle | middle | middle | middle | middle |
| Cameroon | lower | middle | upper | middle | middle | middle | middle | middle | middle |
| Cape Verde | middle | middle | middle | middle | middle | middle | middle | lower | middle |
| CAF | middle | middle | middle | middle | middle | upper | upper | middle | middle |
| Chad | middle | lower | upper | upper | middle | middle | upper | middle | middle |
| Comoros | undefined | middle | middle | middle | middle | middle | lower | middle | middle |
| Ivory Coast | upper | middle | upper | middle | middle | middle | middle | middle | middle |
| DRC | undefined | middle | middle | middle | middle | lower | lower | middle | middle |
| Djibouti | upper | middle | lower | upper | lower | middle,upper | upper | upper | lower |
| Egypt | upper | upper | middle | upper | upper | upper | middle | upper | upper |
| Equatorial Guinea | undefined | middle | upper | upper | middle | middle | middle | lower,middle | middle |
| Ethiopia | middle | upper | upper | lower | lower | middle | upper | middle | middle |
| Eritrea | middle | upper | lower | upper | upper | upper | upper | middle | middle |
| Gabon | upper | middle | middle | upper | middle | middle | middle | middle | middle |
| Gambia | upper | middle | middle | middle | middle | middle | middle | middle | middle |
| Ghana | upper | middle | middle | middle | middle | middle | middle | middle | middle |
| Guinea | upper | upper | middle | middle | lower | lower | middle | middle | middle |
| Guinea-Bissau | undefined | lower | lower | upper | lower | lower | lower,middle | middle | middle |
| Kenya | middle | middle | middle | middle | middle | middle | middle | middle | middle |
| Lesotho | middle | lower | middle | middle | middle | middle | middle | middle | middle |
| Liberia | middle | middle | middle | upper | middle | upper | middle | upper | middle |
| Libya | middle | middle | middle | middle | middle | middle | middle | middle | middle |
| Madagascar | lower | middle | middle | middle | middle | middle | middle | middle | middle |
| Malawi | middle | middle | middle | middle | middle | lower | middle | lower | middle |
| Mali | upper | upper | lower | lower | middle | middle | middle | upper | middle |
| Mauritania | upper | middle | middle | upper | middle | middle | middle | middle | middle |
| Mauritius | middle | middle | middle | middle | middle | middle | upper | middle | middle |
| Morocco | upper | upper | upper | upper | upper | upper | upper | upper | upper |
| Mozambique | middle | middle | middle | middle | middle | middle | middle | upper | lower |
| Namibia | middle | middle | middle | middle | middle | middle | middle | middle | middle |
| Niger | middle | upper | lower | middle | middle | upper | middle | middle | middle |
| Nigeria | upper | upper | upper | upper | middle | upper | middle | middle | middle |
| Republic of Congo | undefined | middle | middle | middle | middle | lower | lower | middle | middle |
| Rwanda | middle | middle | middle | middle | middle | middle | middle | middle | lower |
| Senegal | middle | upper | middle | upper | middle | middle | middle | middle | middle |
| Sierra Leone | upper | middle | upper | middle | middle | middle | lower | lower | middle |
| South Africa | middle | middle | middle | middle | middle | middle | middle | middle | middle |
| Swaziland | middle | middle | middle | middle | middle | middle | middle | middle | middle |
| Tanzania | upper | middle | middle | middle | middle | middle | middle | middle | middle |
| Togo | upper | lower | middle | lower | upper | lower | upper | middle | lower |
| Tunisia | middle | middle | middle | middle | middle | middle | middle | middle | middle |
| Uganda | middle | middle | middle | middle | middle | middle | middle | middle | middle |
| Zambia | middle | middle | middle | middle | middle | middle | middle | middle | middle |
| Zimbabwe | middle | middle | middle | middle | middle | middle | middle | middle | middle |
| Country | 2004 - 2006 | 2006 - 2008 | 2008 - 2010 | 2010 - 2012 | 2012 - 2014 | 2014 - 2016 | 2016 - 2018 | 2018 - 2020 | 2020 - 2022 |
| Algeria | undefined | upper | upper | middle | upper | upper | upper | upper | lower,middle |
| Angola | undefined | middle | upper | upper | upper | middle | middle | middle | middle |
| Benin | upper | upper | upper | lower | upper | middle | upper | lower,upper | middle |
| Botswana | upper | lower | upper | middle | lower | lower | upper | middle | lower |
| Burkina Faso | undefined | upper | lower | upper | upper | lower | middle | upper | middle |
| Burundi | lower | lower | middle | upper | middle | middle | middle | middle | middle |
| Cameroon | lower | middle | lower | lower | middle | middle | lower | middle | middle |
| Cape Verde | middle | middle | middle | middle | middle | upper | middle,upper | lower | upper |
| CAF | undefined | lower,middle | middle | lower | middle | middle | upper | middle | middle |
| Chad | middle | middle | middle | upper | lower | middle | middle | lower | lower |
| Comoros | undefined | middle | lower,middle | middle | upper | lower,upper | lower | upper | middle |
| Ivory Coast | undefined | upper | upper | middle | lower | middle | middle | lower | middle |
| DRC | undefined | middle | lower | middle | middle | lower | lower | middle | lower |
| Djibouti | upper | lower | middle | upper | lower | upper | upper | upper | undefined |
| Egypt | middle | middle | middle | upper | upper | middle | middle | middle | upper |
| Equatorial Guinea | undefined | undefined | upper | upper | middle | upper | undefined | lower | middle |
| Ethiopia | middle | lower | lower | lower | lower | lower | lower | middle | lower |
| Eritrea | undefined | upper | lower | upper | upper | middle | upper | middle | middle |
| Gabon | undefined | upper | middle | upper | upper | middle | middle | middle | middle |
| Gambia | middle | upper | middle | middle | middle | upper | middle | upper | middle |
| Ghana | upper | middle | upper | middle | middle | upper | middle | upper | upper |
| Guinea | upper | lower | lower | upper | lower | upper | middle | middle | lower |
| Guinea-Bissau | undefined | lower | lower | lower | lower | lower | middle | middle | middle |
| Kenya | upper | middle | middle | middle | upper | middle | middle | middle | middle |
| Lesotho | middle | lower | middle | middle | upper | middle | middle | middle | middle |
| Liberia | undefined | lower | middle | upper | middle | lower | middle | upper | upper |
| Libya | lower,upper | middle | upper | middle | middle | middle | middle | upper | middle |
| Madagascar | lower | lower | lower | middle | middle | middle | middle | middle | middle |
| Malawi | middle,upper | middle | middle | middle | middle | lower | middle | middle | middle |
| Mali | upper | lower | lower | middle | middle | upper | lower | middle | middle |
| Mauritania | upper | upper | upper | upper | upper | middle | middle | middle | middle |
| Mauritius | middle | middle | middle | middle | upper | upper | upper | upper | middle |
| Morocco | upper | upper | upper | upper | upper | upper | upper | upper | upper |
| Mozambique | middle | middle | middle | upper | upper | upper | upper | upper | middle |
| Namibia | middle | upper | middle | middle | upper | middle | middle | middle | middle |
| Niger | upper | middle | lower | middle | upper | upper | upper | middle | lower |
| Nigeria | upper | upper | upper | upper | middle | upper | upper | middle | lower |
| Republic of Congo | undefined | middle | middle | lower | middle | lower | lower | middle | lower |
| Rwanda | middle | middle | middle | middle | middle | middle | middle | middle | middle |
| Senegal | lower | upper | upper | upper | upper | upper | upper | upper | middle |
| Sierra Leone | undefined | middle | upper | lower | middle | upper | lower | lower | middle |
| South Africa | upper | upper | middle | upper | upper | middle | upper | middle | middle |
| Swaziland | middle | middle | middle | middle | middle | middle | middle | middle | middle |
| Tanzania | lower | upper | middle | middle | middle | middle | middle | middle | middle |
| Togo | upper | lower | middle | lower | lower,upper | lower | upper | middle | upper |
| Tunisia | upper | middle | middle | upper | upper | middle | upper | upper | middle |
| Uganda | middle | middle | middle | middle | upper | middle | middle | middle | lower |
| Zambia | lower | upper | upper | middle | middle | middle | lower | middle | middle |
| Zimbabwe | middle | upper | upper | middle | upper | middle | lower | middle | middle |
| Country | 2004 - 2006 | 2006 - 2008 | 2008 - 2010 | 2010 - 2012 | 2012 - 2014 | 2014 - 2016 | 2016 - 2018 | 2018 - 2020 | 2020 - 2022 |
| Algeria | [0]:38 | [0]:1077 | [0]:1617 | [0]:2910 | [0]:2220 | [0]:1270 | [0]:2679 | [0]:2441 | [0]:401 |
| Angola | [0]:2 | [0]:724 | [0]:891 | [0]:1351 | [0]:1178 | [2]:986 | [0]:1007 | [0]:793 | [0]:632 |
| Benin | [0]:199 | [0]:1087 | [0]:797 | [0]:1055 | [0]:1076 | [0]:1524 | [0]:404 | [0]:675 | [1]:200 |
| Botswana | [0]:92 | [0]:1451 | [0]:1648 | [0]:3597 | [0]:3471 | [0]:4245 | [0]:4042 | [0]:4587 | [0]:1914 |
| Burkina Faso | [1]:24 | [0]:383 | [0]:1656 | [0]:1313 | [0]:1709 | [0]:579 | [0]:934 | [0]:534 | [0]:136 |
| Burundi | [1]:3 | [0]:296 | [0]:380 | [0]:446 | [0]:477 | [0]:217 | [0]:95 | [0]:60 | [0]:25 |
| Cameroon | [2]:21 | [0]:646 | [0]:813 | [0]:1003 | [0]:1482 | [0]:374 | [0]:373 | [0]:151 | [0]:158 |
| Cape Verde | [0]:95 | [0]:388 | [0]:857 | [0]:1922 | [0]:1606 | [0]:1205 | [0]:1229 | [0]:1198 | [0]:568 |
| Central African Republic | [1]:6 | [5]:39 | [0]:104 | [0]:175 | [0]:236 | [0]:292 | [3]:121 | [0]:64 | [0]:61 |
| Chad | [0]:5 | [0]:47 | [6]:65 | [0]:178 | [0]:502 | [0]:89 | [0]:211 | [0]:642 | [0]:327 |
| Comoros | [all]:0 | [0]:35 | [0]:72 | [0]:165 | [0, 4]:42 | [0]:38 | [0]:104 | [0]:386 | [3]:6 |
| Ivory Coast | [0]:9 | [0]:87 | [0]:112 | [0]:180 | [2]:376 | [0]:181 | [0]:550 | [0]:340 | [0]:55 |
| Democratic Republic of the Congo | [all]:0 | [0, 5]:22 | [0]:256 | [0]:246 | [0]:814 | [0]:669 | [0]:328 | [3]:232 | [3]:153 |
| Djibouti | [1]:22 | [0]:238 | [0]:502 | [0]:906 | [0]:882 | [0]:367 | [0]:178 | [0]:503 | [0]:76 |
| Egypt | [0]:1414 | [0]:6216 | [0]:5447 | [0]:6831 | [0]:7015 | [0]:4038 | [0]:4235 | [0]:7753 | [0]:7050 |
| Equatorial Guinea | [all]:0 | [0, 3]:5 | [0]:45 | [6]:145 | [0]:22 | [0]:12 | [0]:30 | [0]:53 | [0]:5 |
| Ethiopia | [0]:189 | [0]:2304 | [0]:4222 | [0]:7170 | [0]:8647 | [0]:3864 | [0]:4368 | [0]:2593 | [0]:2744 |
| Eritrea | [1]:38 | [0]:732 | [0]:375 | [0]:468 | [0]:372 | [0]:244 | [0]:346 | [0]:256 | [0]:74 |
| Gabon | [0]:7 | [0]:555 | [0]:157 | [0]:70 | [0]:460 | [0]:218 | [0]:164 | [0]:175 | [0]:98 |
| Gambia | [0]:57 | [0]:967 | [0]:1587 | [0]:1908 | [0]:2795 | [0]:1858 | [0]:1269 | [0]:1181 | [0]:595 |
| Ghana | [0]:410 | [0]:2236 | [0]:2411 | [0]:4061 | [0]:4952 | [0]:2554 | [0]:1402 | [0]:1503 | [0]:526 |
| Guinea | [0]:8 | [0]:456 | [0]:651 | [0]:600 | [0]:1267 | [0]:392 | [0]:534 | [0]:370 | [0]:200 |
| Guinea-Bissau | [all]:0 | [0]:162 | [0]:211 | [0]:79 | [0]:257 | [0]:53 | [0]:125 | [0]:66 | [0]:36 |
| Kenya | [0]:596 | [0]:5012 | [0]:5529 | [0]:9253 | [0]:7414 | [0]:5264 | [0]:5679 | [0]:5460 | [0]:5639 |
| Lesotho | [2, 6]:5 | [0]:326 | [0]:593 | [0]:587 | [0]:864 | [0]:477 | [0]:632 | [0]:319 | [0]:226 |
| Liberia | [1]:3 | [0]:463 | [0]:446 | [0]:847 | [0]:668 | [0]:464 | [0]:181 | [0]:413 | [0]:196 |
| Libya | [0]:32 | [0]:1156 | [0]:2716 | [0]:1662 | [0]:688 | [0]:322 | [0]:157 | [0]:86 | [0]:69 |
| Madagascar | [3]:177 | [0]:2345 | [0]:4059 | [0]:6141 | [0]:6332 | [0]:3845 | [0]:4779 | [0]:5938 | [0]:2063 |
| Malawi | [0]:43 | [0]:1173 | [0]:2425 | [0]:2520 | [0]:1982 | [0]:2465 | [0]:1448 | [0]:675 | [0]:128 |
| Mali | [0]:28 | [0]:1931 | [0]:2997 | [0]:3412 | [0]:1792 | [0]:951 | [0]:389 | [0]:462 | [0]:295 |
| Mauritania | [0]:14 | [0]:278 | [0]:449 | [0]:255 | [1]:275 | [0]:106 | [0]:169 | [0]:313 | [0]:162 |
| Mauritius | [0]:64 | [0]:2606 | [0]:3740 | [0]:4696 | [0]:5785 | [0]:6782 | [0]:6037 | [0]:2878 | [0]:833 |
| Morocco | [0]:660 | [0]:6814 | [0]:7921 | [0]:10778 | [0]:9598 | [0]:9372 | [0]:9088 | [0]:7670 | [0]:3691 |
| Mozambique | [0]:296 | [0]:1244 | [0]:2219 | [0]:3901 | [0]:4380 | [0]:1919 | [0]:1481 | [0]:946 | [0]:409 |
| Namibia | [0]:79 | [0]:872 | [0]:2137 | [0]:3146 | [0]:3307 | [0]:2226 | [0]:3369 | [0]:3821 | [0]:1347 |
| Niger | [0]:37 | [0]:503 | [0]:1930 | [0]:1298 | [0]:1149 | [0]:664 | [0]:801 | [0]:359 | [0]:482 |
| Nigeria | [0]:260 | [0]:1075 | [0]:2583 | [0]:4214 | [0]:2505 | [0]:2833 | [0]:2228 | [0]:1572 | [0]:1231 |
| Republic of Congo | [all]:0 | [0]:44 | [0]:357 | [0]:717 | [0]:1184 | [0]:862 | [0]:421 | [0]:263 | [3]:154 |
| Rwanda | [5]:165 | [0]:1597 | [0]:2368 | [0]:2607 | [0]:2945 | [0]:1387 | [0]:996 | [0]:461 | [0]:387 |
| Sao Tome and Principe | [all]:0 | [0]:6 | [all]:0 | [0]:2 | [0, 1]:1 | [0]:5 | [0]:5 | [0]:6 | [0]:3 |
| Senegal | [0]:181 | [0]:2679 | [0]:3106 | [0]:4400 | [0]:3646 | [0]:3999 | [0]:2114 | [0]:2067 | [0]:962 |
| Seychelles | [all]:0 | [0]:7 | [0]:17 | [0]:14 | [0]:28 | [0]:9 | [0]:24 | [1]:25 | [0]:13 |
| Sierra Leone | [5]:1 | [0]:349 | [0]:675 | [0]:976 | [0]:824 | [0]:543 | [0]:126 | [0]:90 | [0]:55 |
| Somalia | [1]:19 | [0]:32 | [0]:177 | [0]:649 | [0]:262 | [0]:284 | [0]:243 | [0]:337 | [0]:370 |
| South Africa | [0]:655 | [0]:6044 | [0]:5349 | [0]:8451 | [0]:9265 | [0]:8786 | [0]:8345 | [0]:9222 | [0]:10330 |
| South Sudan | [all]:0 | [0]:10 | [5]:30 | [0]:200 | [0]:110 | [0]:255 | [0]:324 | [0]:136 | [0]:156 |
| Sudan | [all]:0 | [0]:108 | [0]:343 | [0]:536 | [0]:316 | [0]:354 | [0]:382 | [0]:272 | [0]:415 |
| Swaziland | [0]:15 | [0]:267 | [0]:849 | [0]:966 | [0]:1896 | [0]:964 | [0]:966 | [0]:537 | [0]:144 |
| Tanzania | [0]:668 | [0]:6444 | [0]:5971 | [0]:9846 | [0]:10651 | [0]:5803 | [0]:7821 | [0]:7689 | [0]:4551 |
| Togo | [1]:73 | [0]:419 | [0]:865 | [0]:1391 | [0]:932 | [0]:872 | [0]:438 | [0]:249 | [1]:243 |
| Tunisia | [0]:277 | [0]:3434 | [0]:5386 | [0]:8053 | [0]:5738 | [0]:6076 | [0]:3204 | [0]:2972 | [0]:1751 |
| Uganda | [3]:267 | [0]:2904 | [0]:3410 | [0]:5491 | [0]:4502 | [0]:3973 | [0]:3047 | [0]:4527 | [0]:625 |
| Zambia | [0]:81 | [0]:2186 | [0]:3108 | [0]:3760 | [0]:3622 | [0]:1791 | [0]:2448 | [0]:2008 | [0]:350 |
| Zimbabwe | [0]:35 | [0]:1896 | [0]:1506 | [0]:3522 | [0]:3966 | [0]:3620 | [0]:2580 | [0]:2476 | [0]:887 |
| Country | 2004 - 2006 | 2006 - 2008 | 2008 - 2010 | 2010 - 2012 | 2012 - 2014 | 2014 - 2016 | 2016 - 2018 | 2018 - 2020 | 2020 - 2022 |
| Algeria | [all]:0 | [0]:29 | [0]:46 | [0]:259 | [0]:459 | [0]:147 | [0]:103 | [0]:157 | [0]:16 |
| Angola | [all]:0 | [0]:32 | [0]:50 | [0]:267 | [0]:156 | [0]:127 | [0]:41 | [0]:162 | [0]:9 |
| Benin | [0]:78 | [0]:88 | [0]:189 | [0]:170 | [0]:306 | [0]:689 | [0]:108 | [0]:88 | [0]:3 |
| Botswana | [0]:2 | [0]:15 | [2]:83 | [0]:34 | [0]:34 | [0]:52 | [0]:50 | [0]:191 | [0]:120 |
| Burkina Faso | [all]:0 | [0]:35 | [0]:253 | [0]:367 | [0]:590 | [0]:186 | [0]:299 | [0]:115 | [0]:9 |
| Burundi | [1]:1 | [0]:35 | [0]:50 | [0]:74 | [0]:71 | [1]:31 | [0]:8 | [0]:9 | [0]:2 |
| Cameroon | [2]:4 | [0]:55 | [0]:122 | [0]:240 | [0]:161 | [0]:67 | [3]:158 | [0]:19 | [0]:9 |
| Cape Verde | [0]:15 | [0]:24 | [0]:43 | [0]:137 | [0]:160 | [0]:206 | [0]:71 | [0]:350 | [0]:21 |
| Central African Republic | [all]:0 | [0, 3]:1 | [0]:24 | [0]:77 | [0]:109 | [0]:54 | [3]:40 | [0]:9 | [0]:6 |
| Chad | [0]:1 | [0]:6 | [0]:57 | [2]:55 | [0]:128 | [0]:21 | [0]:68 | [0]:135 | [0]:7 |
| Comoros | [all]:0 | [0]:4 | [0]:7 | [0]:51 | [0]:7 | [0]:5 | [0]:13 | [0]:72 | [0]:1 |
| Ivory Coast | [all]:0 | [0]:3 | [0]:18 | [0]:64 | [0]:31 | [0]:24 | [0]:141 | [0]:142 | [0]:9 |
| Democratic Republic of the Congo | [all]:0 | [5]:19 | [0]:66 | [0]:124 | [0]:291 | [0]:122 | [3]:199 | [3]:158 | [3]:13 |
| Djibouti | [0]:2 | [0]:30 | [0]:42 | [0]:114 | [0]:150 | [0]:92 | [0]:31 | [0]:118 | [all]:0 |
| Egypt | [0]:88 | [0]:1212 | [0]:1527 | [0]:2943 | [0]:5808 | [0]:2020 | [0]:982 | [0]:1657 | [0]:307 |
| Equatorial Guinea | [all]:0 | [all]:0 | [3]:3 | [6]:87 | [0]:4 | [4]:3 | [all]:0 | [0]:7 | [0]:2 |
| Ethiopia | [0]:34 | [0]:544 | [0]:718 | [0]:3311 | [0]:5187 | [0]:2180 | [0]:1745 | [0]:1361 | [0]:987 |
| Eritrea | [all]:0 | [0]:126 | [0]:23 | [0]:170 | [0]:208 | [0]:16 | [0]:11 | [0]:120 | [0]:3 |
| Gabon | [all]:0 | [0]:57 | [0]:3 | [0]:6 | [0]:38 | [0]:25 | [0]:4 | [0]:23 | [0]:2 |
| Gambia | [0]:2 | [1]:39 | [0]:110 | [0]:267 | [0]:339 | [0]:187 | [0]:127 | [0]:80 | [0]:43 |
| Ghana | [0]:44 | [0]:295 | [0]:495 | [0]:1187 | [0]:1315 | [0]:713 | [0]:354 | [0]:410 | [0]:135 |
| Guinea | [0]:1 | [0]:46 | [0]:42 | [0]:142 | [0]:216 | [6]:86 | [0]:70 | [1]:71 | [0]:22 |
| Guinea-Bissau | [all]:0 | [0]:11 | [0]:17 | [0]:21 | [0]:57 | [0]:4 | [0]:21 | [0]:19 | [0]:2 |
| Kenya | [0]:39 | [0]:1029 | [0]:1158 | [0]:3292 | [0]:2293 | [0]:1181 | [0]:958 | [0]:769 | [0]:194 |
| Lesotho | [2]:1 | [0]:9 | [0]:33 | [0]:106 | [0]:111 | [0]:113 | [0]:56 | [0]:65 | [0]:20 |
| Liberia | [all]:0 | [0]:52 | [0]:84 | [0]:223 | [0]:158 | [6]:144 | [3]:35 | [0]:203 | [0]:11 |
| Libya | [0]:2 | [0]:51 | [0]:229 | [0]:395 | [0]:111 | [0]:37 | [1]:20 | [0]:17 | [0]:2 |
| Madagascar | [3]:19 | [0]:150 | [0]:360 | [0]:1049 | [0]:1305 | [0]:431 | [0]:666 | [0]:624 | [1]:194 |
| Malawi | [0]:2 | [0]:165 | [0]:437 | [0]:351 | [0]:546 | [0]:262 | [0]:233 | [0]:67 | [0]:4 |
| Mali | [0, 4]:3 | [0]:324 | [0]:711 | [0]:841 | [0]:557 | [0]:243 | [0]:90 | [0]:166 | [0]:26 |
| Mauritania | [0]:3 | [0]:32 | [0]:35 | [4]:30 | [0]:69 | [1]:23 | [0]:13 | [0]:16 | [0]:10 |
| Mauritius | [0]:1 | [0]:187 | [0]:104 | [0]:435 | [0]:1148 | [0]:1648 | [0]:1412 | [0]:542 | [0]:33 |
| Morocco | [0]:47 | [0]:921 | [0]:1433 | [0]:3804 | [0]:3600 | [0]:3279 | [0]:2022 | [0]:1425 | [0]:211 |
| Mozambique | [0]:26 | [0]:110 | [0]:211 | [0]:846 | [0]:938 | [0]:323 | [0]:166 | [0]:85 | [1]:94 |
| Namibia | [0]:1 | [0]:115 | [0]:184 | [0]:476 | [0]:403 | [0]:328 | [0]:470 | [0]:375 | [0]:32 |
| Niger | [0]:1 | [0]:43 | [0]:93 | [0]:291 | [0]:309 | [0]:182 | [0]:104 | [0]:72 | [0]:11 |
| Nigeria | [0]:87 | [0]:219 | [0]:451 | [0]:1194 | [0]:742 | [0]:2011 | [0]:742 | [0]:702 | [0]:87 |
| Republic of Congo | [all]:0 | [5]:19 | [0]:70 | [0]:167 | [0]:305 | [0]:141 | [3]:200 | [3]:153 | [3]:13 |
| Rwanda | [5]:9 | [0]:175 | [0]:254 | [0]:561 | [0]:655 | [0]:192 | [0]:250 | [0]:98 | [0]:18 |
| Sao Tome and Principe | [all]:0 | [all]:0 | [all]:0 | [0]:1 | [all]:0 | [all]:0 | [all]:0 | [0]:4 | [0]:3 |
| Senegal | [3]:34 | [0]:224 | [0]:266 | [0]:710 | [0]:511 | [0]:691 | [0]:384 | [0]:301 | [0]:69 |
| Seychelles | [all]:0 | [0]:1 | [0]:2 | [0]:3 | [0]:5 | [all]:0 | [1]:2 | [all]:0 | [0]:11 |
| Sierra Leone | [all]:0 | [0]:29 | [0]:66 | [0]:273 | [0]:262 | [0]:177 | [0]:14 | [0]:16 | [0]:3 |
| Somalia | [0]:2 | [1]:21 | [0]:90 | [0]:258 | [0]:84 | [0]:52 | [3]:82 | [0]:80 | [0]:7 |
| South Africa | [0]:106 | [0]:1563 | [0]:2111 | [0]:3941 | [0]:3358 | [0]:2541 | [0]:2010 | [0]:2482 | [0]:658 |
| South Sudan | [all]:0 | [0]:1 | [5]:30 | [0]:48 | [0]:37 | [0]:68 | [0]:22 | [0]:23 | [0]:12 |
| Sudan | [all]:0 | [0]:16 | [0]:53 | [0]:131 | [0]:119 | [0]:79 | [0]:32 | [0]:65 | [0]:15 |
| Swaziland | [0]:3 | [0]:23 | [0]:38 | [0]:164 | [0]:413 | [0]:132 | [0]:108 | [0]:192 | [0]:20 |
| Tanzania | [0]:41 | [0]:613 | [0]:886 | [0]:2256 | [0]:1817 | [0]:839 | [0]:853 | [0]:1089 | [0]:627 |
| Togo | [4]:6 | [0]:40 | [0]:267 | [0]:239 | [0]:224 | [0]:284 | [0]:92 | [0]:111 | [0]:14 |
| Tunisia | [3]:23 | [0]:148 | [0]:296 | [0]:1180 | [0]:1494 | [0]:331 | [0]:339 | [0]:338 | [0]:27 |
| Uganda | [3]:48 | [0]:735 | [0]:374 | [0]:1609 | [0]:1043 | [0]:932 | [0]:300 | [0]:611 | [0]:20 |
| Zambia | [0]:5 | [0]:314 | [0]:193 | [0]:454 | [0]:314 | [0]:234 | [0]:183 | [0]:152 | [0]:15 |
| Zimbabwe | [1]:1 | [0]:121 | [0]:49 | [0]:405 | [0]:412 | [0]:264 | [0]:113 | [0]:98 | [0]:37 |
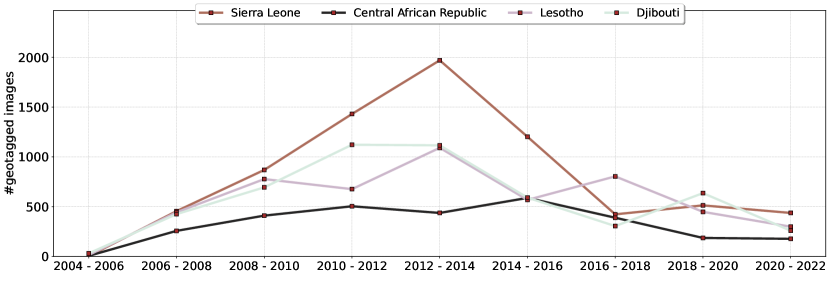
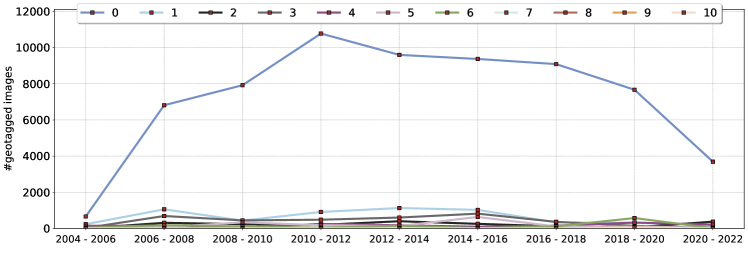
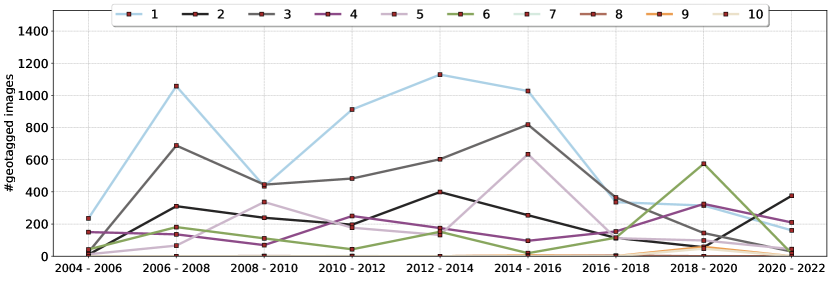
A.6. Local vs. non-local representation by self-reported photographer’s locations
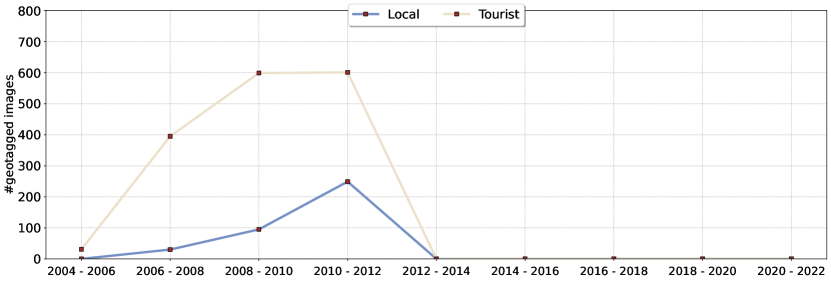
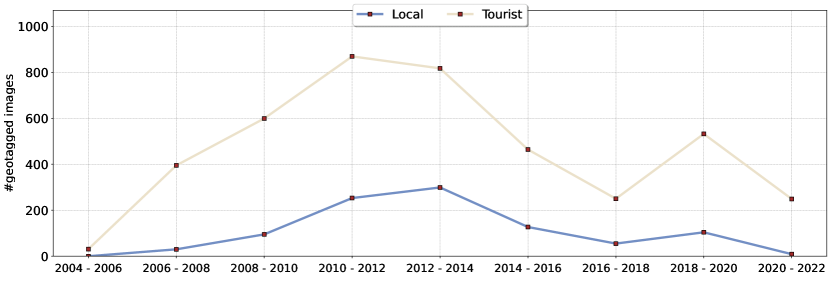
A.7. Selected samples of geotagged images