On the relative abundances of Cavansite and Pentagonite
Abstract
Cavansite is a visually stunning blue vanadosilicate mineral with limited occurrences worldwide, whereas Pentagonite is a closely related dimorph with similar physical and chemical properties, yet is extremely rare. The reasons behind Pentagonite’s exceptional rarity remain largely unknown. In this study, we utilize density functional theory (DFT) to investigate the electronic structures of Cavansite and Pentagonite at ground state and finite pressures. We then employ the Boltzmann probability model to construct a comprehensive phase diagram that reveals the abundance of each species across a wide range of pressure and temperature conditions. Our analysis reveals the key factors that contribute to the relative scarcity of Pentagonite, including differences in structural arrangement and electronic configurations between the two minerals.
Specifically, because of the peculiar arrangements of SiO4 polyhedra, Cavansite forms a compact structure (about 2.7% less in volume) resulting in lower energy. We also show that at a temperature of about 600K only about 1% Pentagonite can be formed. This probability is only slightly enhanced within a pressure range of up to about 3GPa.
We also find that vanadium induces a highly localized state in both of these otherwise large band gap insulators resulting in extremely weak magnetic phase that is unlikely to be observed at any reasonable finite temperature.
Finally, our dehydration studies reveal that water molecules are loosely bound inside the microporous crystals of Cavansite and Pentagonite, suggesting potential applications of these minerals in various technological fields.
pacs:
71.15.Mb,71.20.Ps,96.20.Dt,82.30.Vy,02.70.RrI Introduction
Since its discovery[1] in the 1960s, Cavansite has been a highly coveted mineral due to its spectacular greenish-blue appearance. It is found in clusters of acicular crystals, with individual crystals being sub-millimeter in size. Pentagonite, though chromatically similar, is known for the twining that leads to a near-five-fold-symmetrical structure giving it its name. Being dimorphs, both have the same chemical formula – Ca(VO)Si4OH2O – and both are orthorhombic crystals with Pentagonite having slightly larger (by about 2% in volume) unit cell. The other common interesting structural character of these dimorphs is the presence of large cavities in their atomic structure due to tetrahedral-pyramidal arrangements of vanadosilicate complexes. The sheets of SiO4 are intertwined in a maze that accommodates calcium and vanadium atoms. In fact they are the only known naturally occurring microporous vanadosilicates [2]. The resulting tunnels are naturally occupied by water which may be dehydrated at higher temperatures [3, 4]. Such materials are of technological importance due to their ion-exchange, catalytic or sorption applications. Because vanadium in these complex structures can be in multiple oxidation states they are expected to show catalytic activity; specifically, for selective partial oxidation of ethanol at elevated temperatures [5].
| Locality | Lava type | Host locale | Mineral association | Reference |
| Columbia River Flood Basalt Province, USA | ||||
| Qwyhee Dam, Oregon | Rhyolite, tuff breccia intruded by dyke | Red tuff breccia | Cavansite, heulandite, stilbite, calcite, apophyllite, analcime, rare pentagonite , native copper | Staples et al.[1] |
| Charles W. Chapman quarry, Goble, Oregon | Rubbly pahoehoe intruded by dykes | Cavity filling, calcite veins | Cavansite, calcite, heulandite, thomsonite, native copper | Staples et al.[1] |
| Deccan traps, India | ||||
| Wagholi, Pune | Rubbly pahoehoe | Flow top breccia (FTB) | Cavansite, Pentagonite, stilbite, mordenite, heulandite, calcite, apophyllite, native copper | Evans [6], Birch [7], Kothvala [8]; Cook [9], Blass et al. [10], Powar and Byrappa[11]; Ottens [12], Makki [13] |
| Sutarwadi, Pune | Sheet pahoehoe | Gas blister | Cavansite, stilbite | Mookherjee and Phadke [14] |
| Yedgaon Dam, Narayangaon | Sheet pahoehoe | Cavity filling | Cavansite | Mookherjee and Phadke [14] |
| Surli Ghat, Karad | Rubbly pahoehoe | FTB | Cavansite | Mookherjee and Phadke [14] |
| Lonavala Quarry | Sheet pahoehoe | Cavity filling | Cavansite, calcite, heulandite-Ca, modernite, pentagonite, quartz | Praszkier and Siuda, [15] |
| Indori, Talegaon | Sheet pahoehoe | Cavity filling | Cavansite, stilbite, apophyllite, mesolite, modernite, heulandite, calcite | Praszkier, [16] |
| Rio Grande do Sul, Brazil | ||||
| Morro Reuter, Brazil | Vesicular basalt | Vein filing | Cavansite, quartz | Frank et al., 2004 [17] |
| New Zealand | ||||
| Aranga Quarry, Dargaville | likely Rubbly pahoehoe | Red breccia | Cavansite, chabazite-Ca, calcite, okenite, native copper, chrysocolla | Frank et al [17] |
Although first discovered in Oregon, U.S.A., arguably best samples of these dimorphs are known to originate from Pune (formerly Poona), India [3, 4]. Worldwide, these minerals are known to be found at ten locations corresponding to only four basaltic planes (see Table LABEL:tab:locations). The table, wherever possible, also describes the associated minerals in the corresponding lava flows and shows that the two minerals are found among the upper flows of pahohoe-type lava. (Unlike the aa-type flow, a pahohoe-type lava flow is characterized by a relatively smooth surface.) Moreover, the two minerals are formed inside cavities or brecciated surfaces. We note that there are at least three sites where Cavansite and Pentagonite co-occur: However, Pentagonite is never found without Cavansite, but the converse is not true. This gives a clear indication that Cavansite is significantly more abundant than Pentagonite. Unfortunately, quantitative field measurements of their relative abundances are absent in field studies due to their rarity, however it has been seen that it is nearly impossible to find reasonably large samples of Pentagonite [18].
Exact processes of the formation of Cavansite and Pentagonite are uncertain, but because they can be found at the same location indicates that similar chemical and physical environments might have been responsible for their formation. It has been noted that their mineral associations and modes of occurrence are often similar [1]. Yet, Pentagonite remains significantly rarer. In this study, we have used state-of-the-art density functional theory (DFT) calculations to explore this question. This allows us to deduce the formation energies of these minerals and construct a phase diagram of their relative abundances, which sheds light on why Cavansite remains dominant in the field. It may be noted that there have been no previous electronic structure investigation on these minerals.
II Computational Details
Our DFT calculations were performed using the plane wave basis set and within the Perdew-Burke-Ernzerhof (PBE) generalized gradient approximation [19], using Quantum ESPRESSO[20].
To ensure accuracy, we used the latest curated pseudopotentials [21, 22, 23] compiled by Materials Cloud [24, 25]. We carried out full unconstrained and spin-polarized unit cell optimizations starting from experimentally reported unit cells consisting of four chemical formula units. To ascertain accuracy further, a rather high kinetic-energy cutoff of 950 eV was used for the plane wave basis set, and an automatic 333 Monkhorst-Pack grid of was used to sample the -space during unit cell optimizations.
For subsequent non-self-consistent calculations, a finer grid was used, and for band structure calculations, 30 -points were used along the each symmetry line in Brillouin zone. Finally, as will be detailed later on, we used DFT-D3 treatment of Grimme et al. [26] to account for van der Waals’ correction which, as it turns out, plays a vital role in determining lattice structures.
III Results and discussion
III.1 Electronic structure
(a) (b)
(c) (d)
(e) (f)
(a) (b)
 (c) (d)
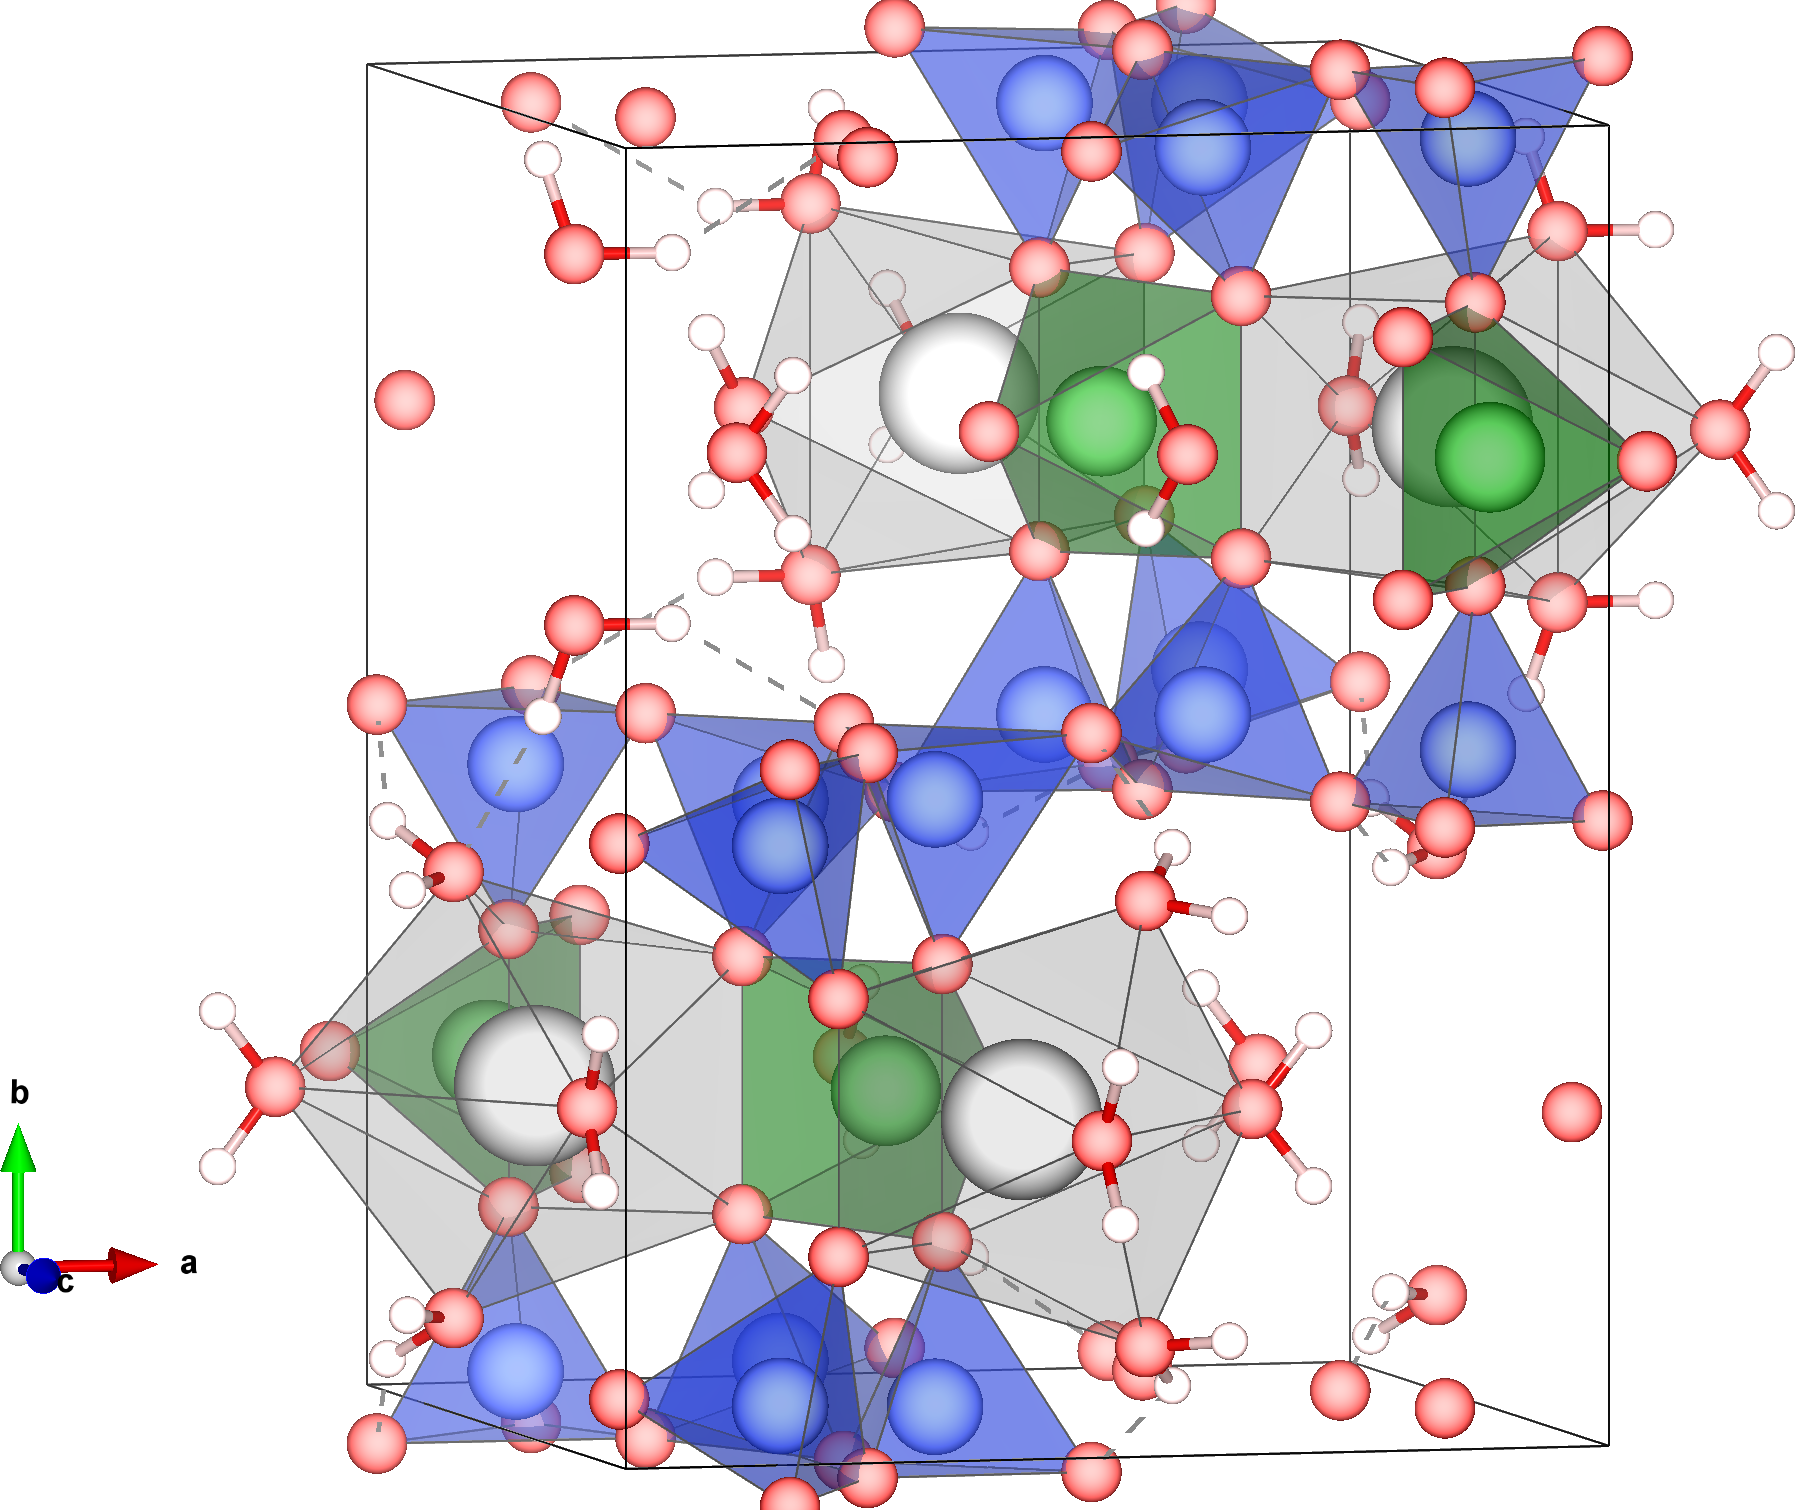
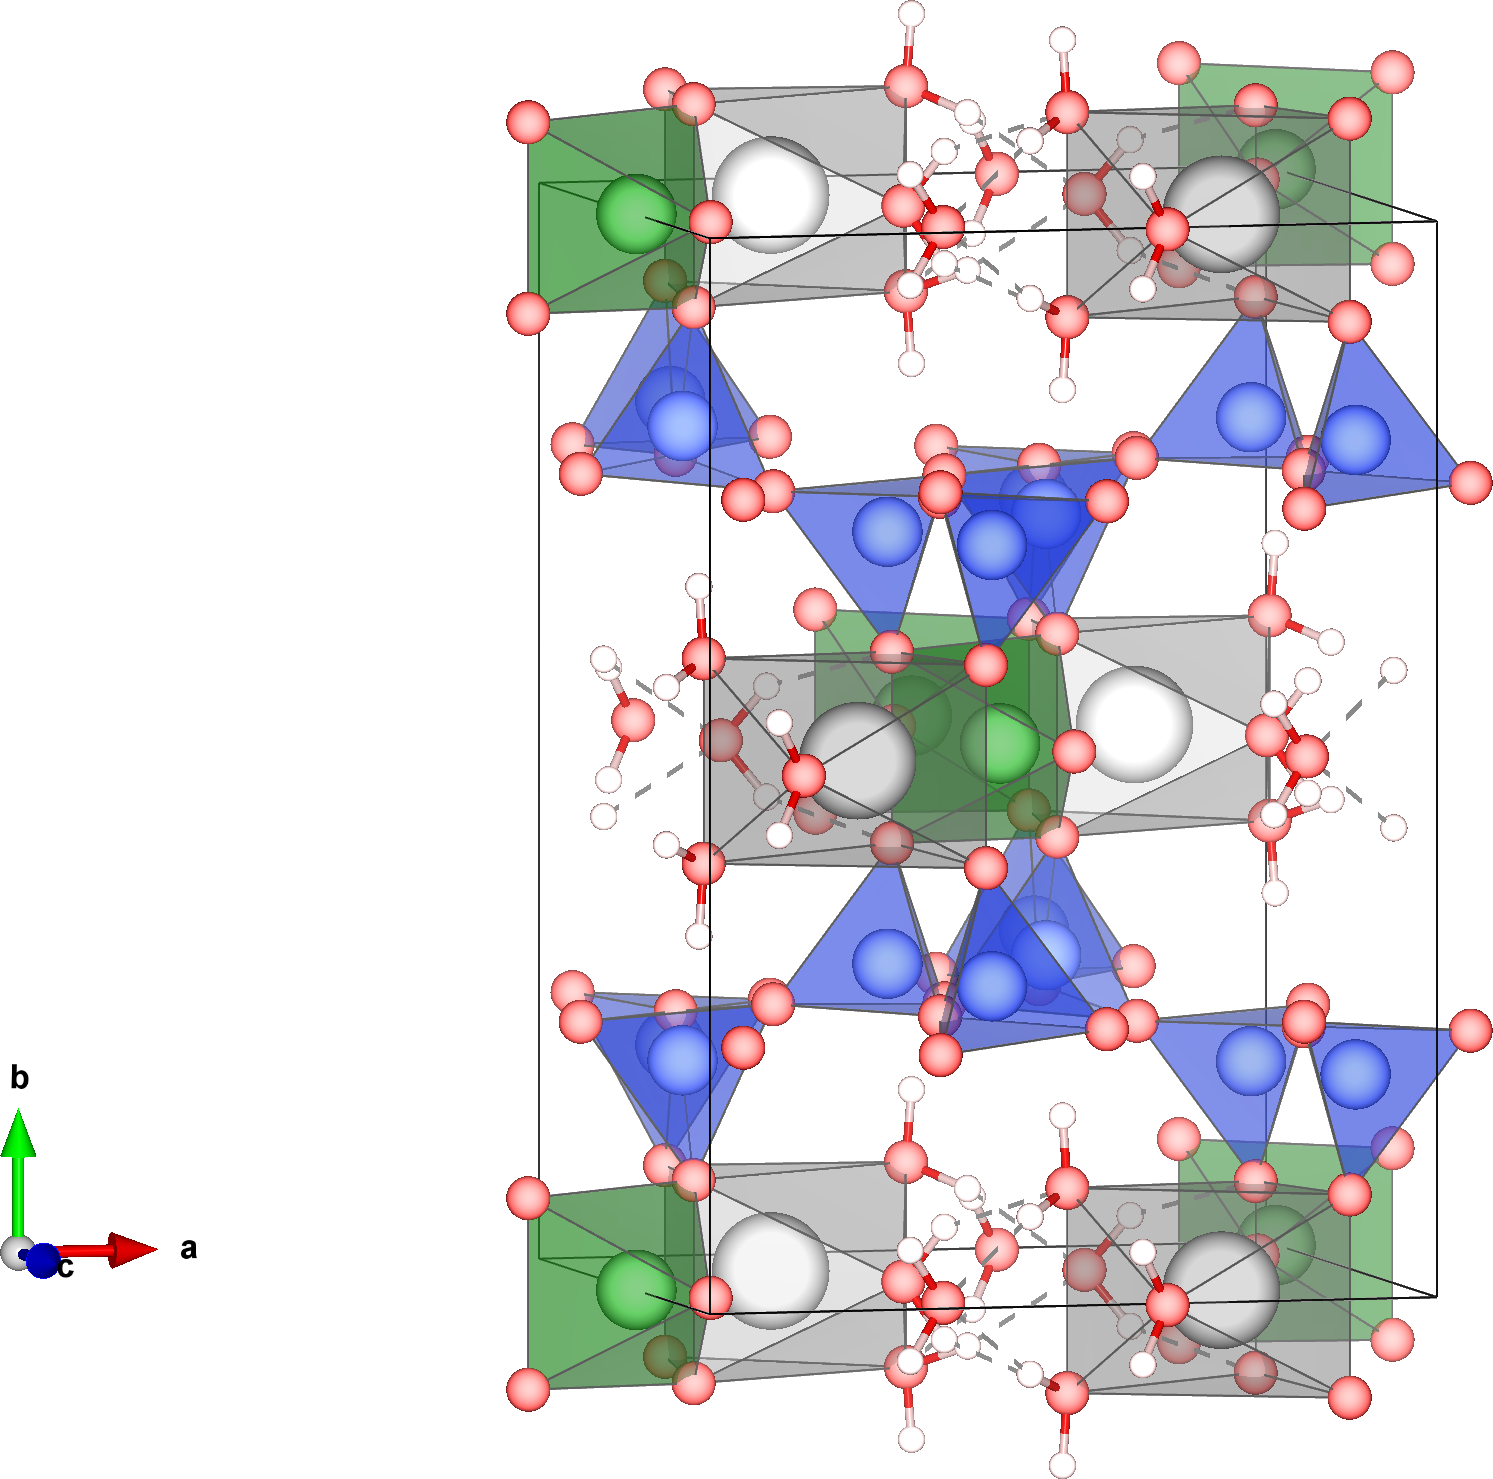
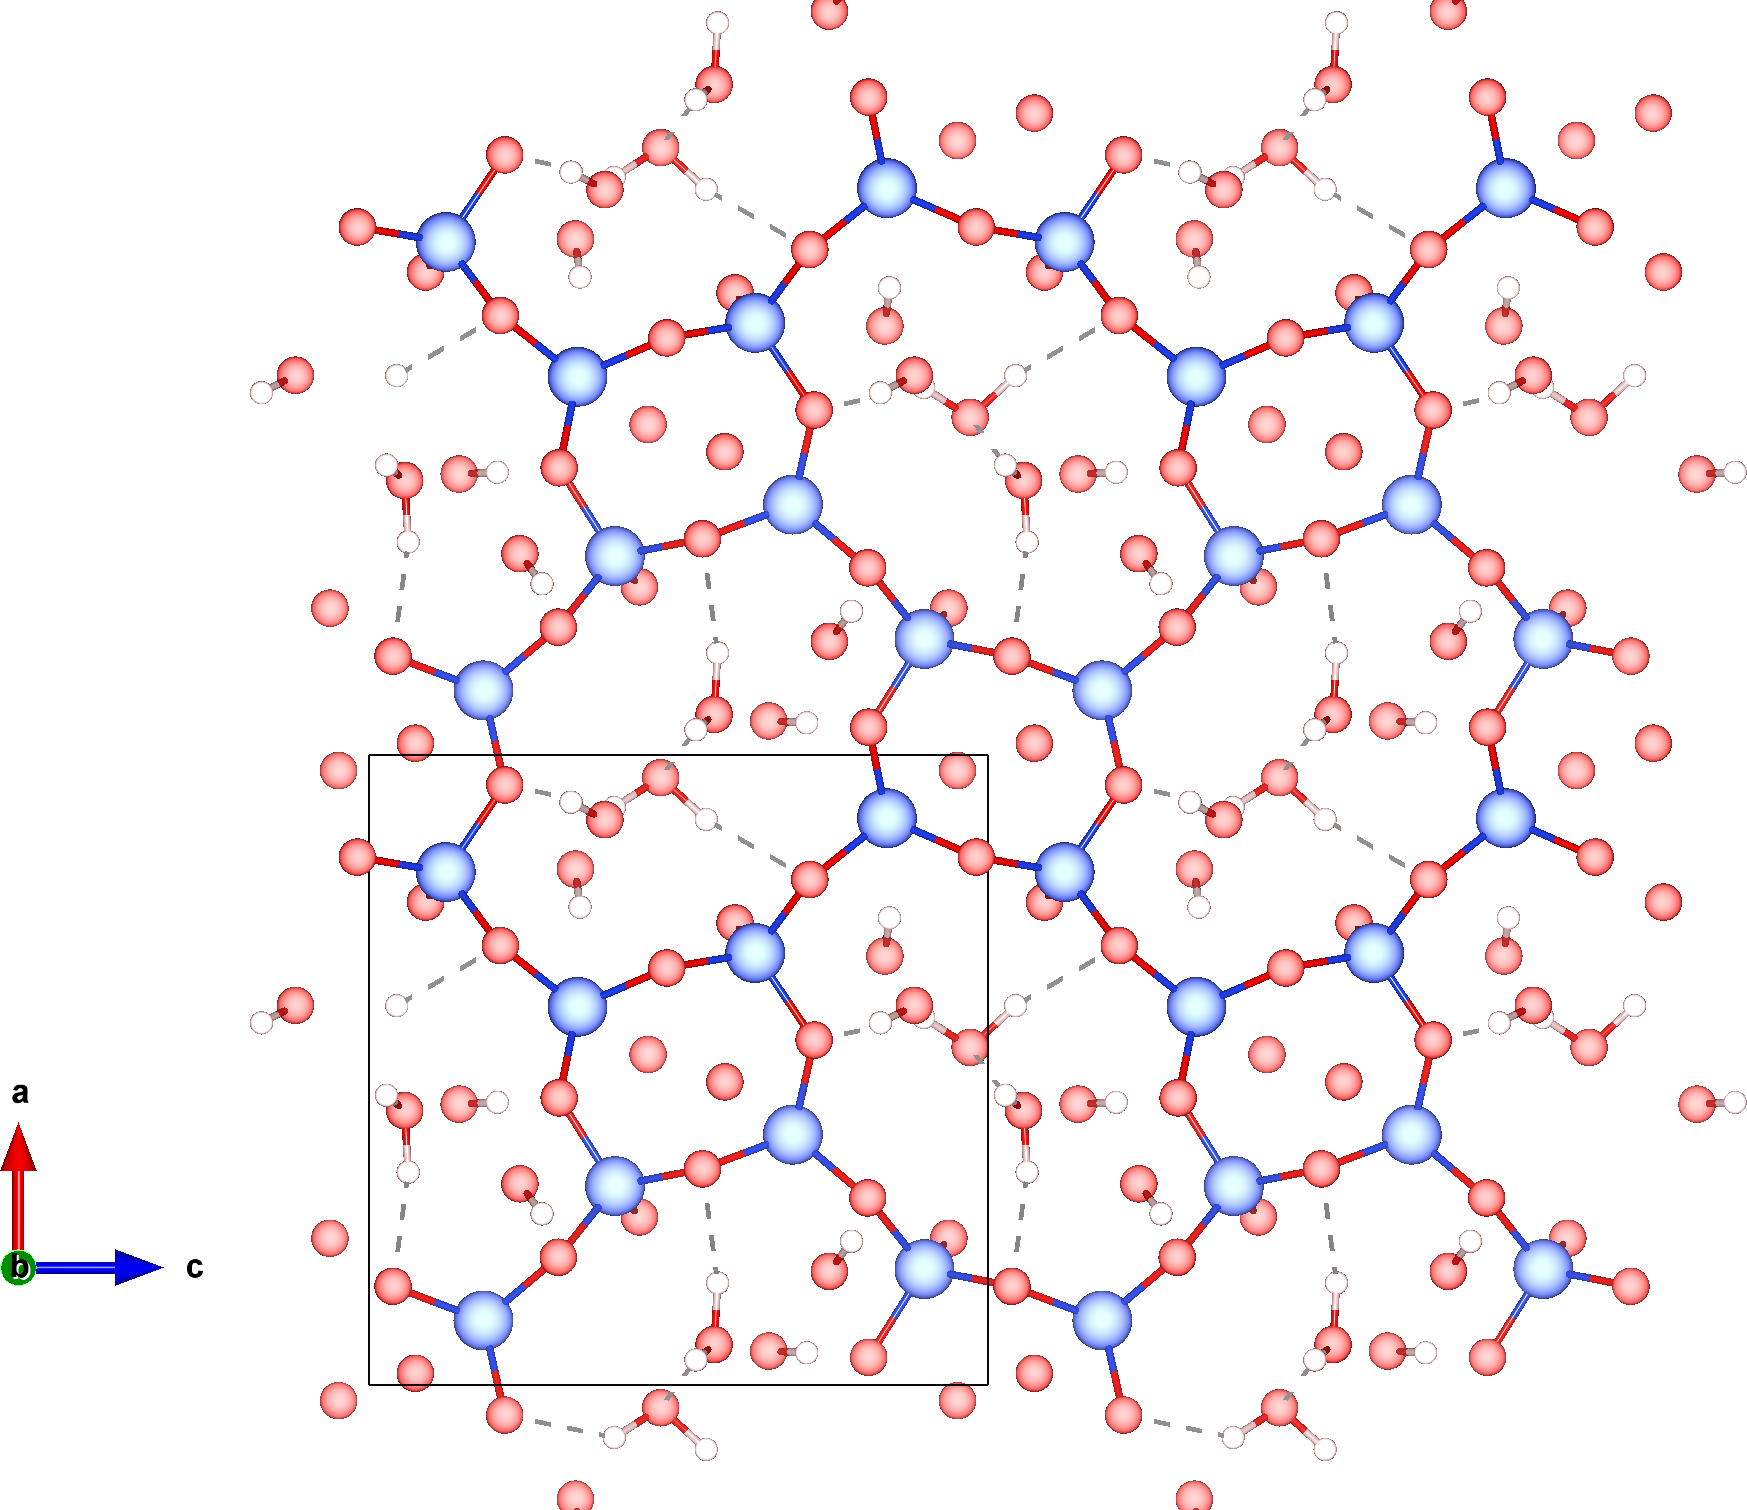
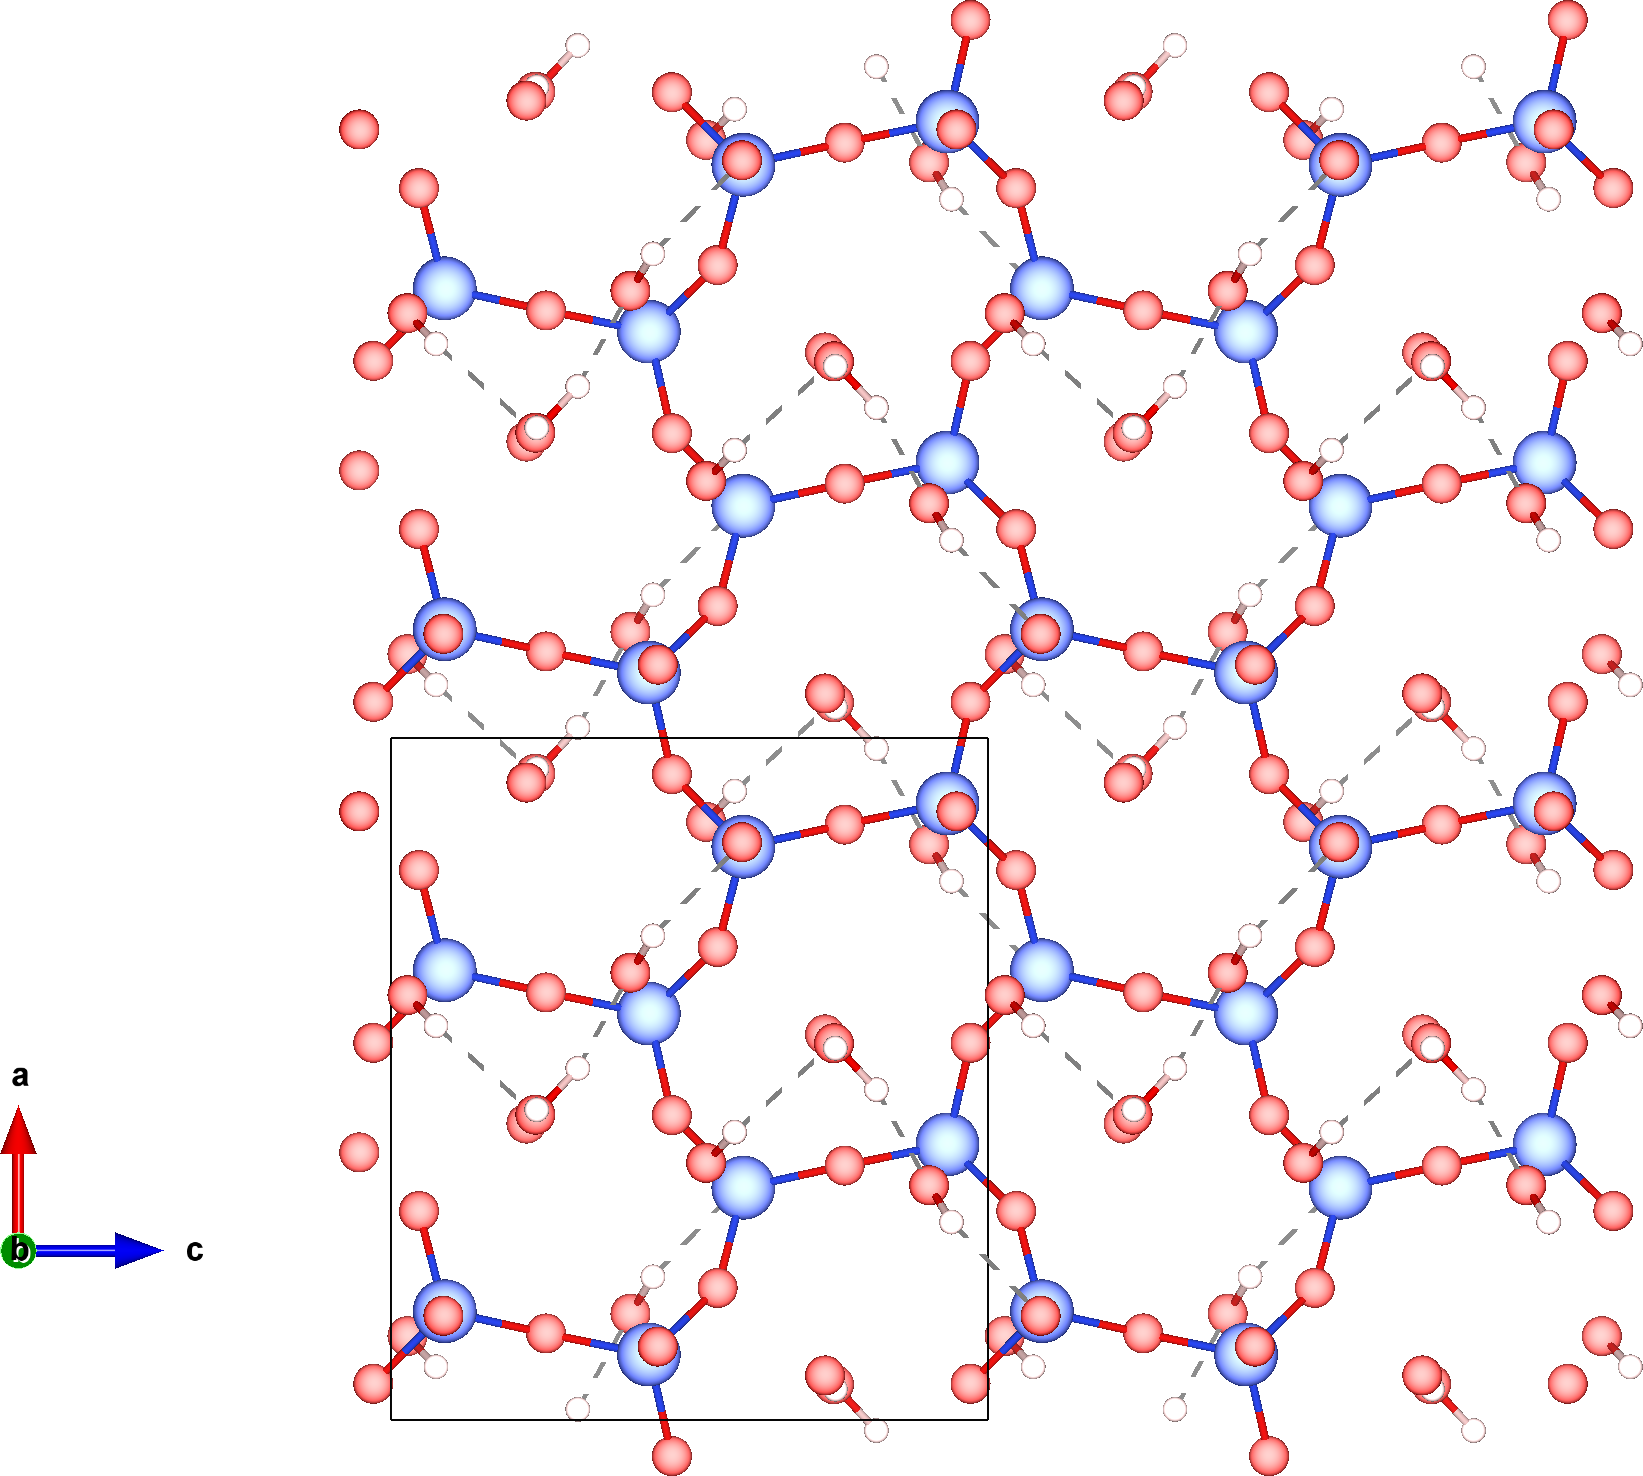
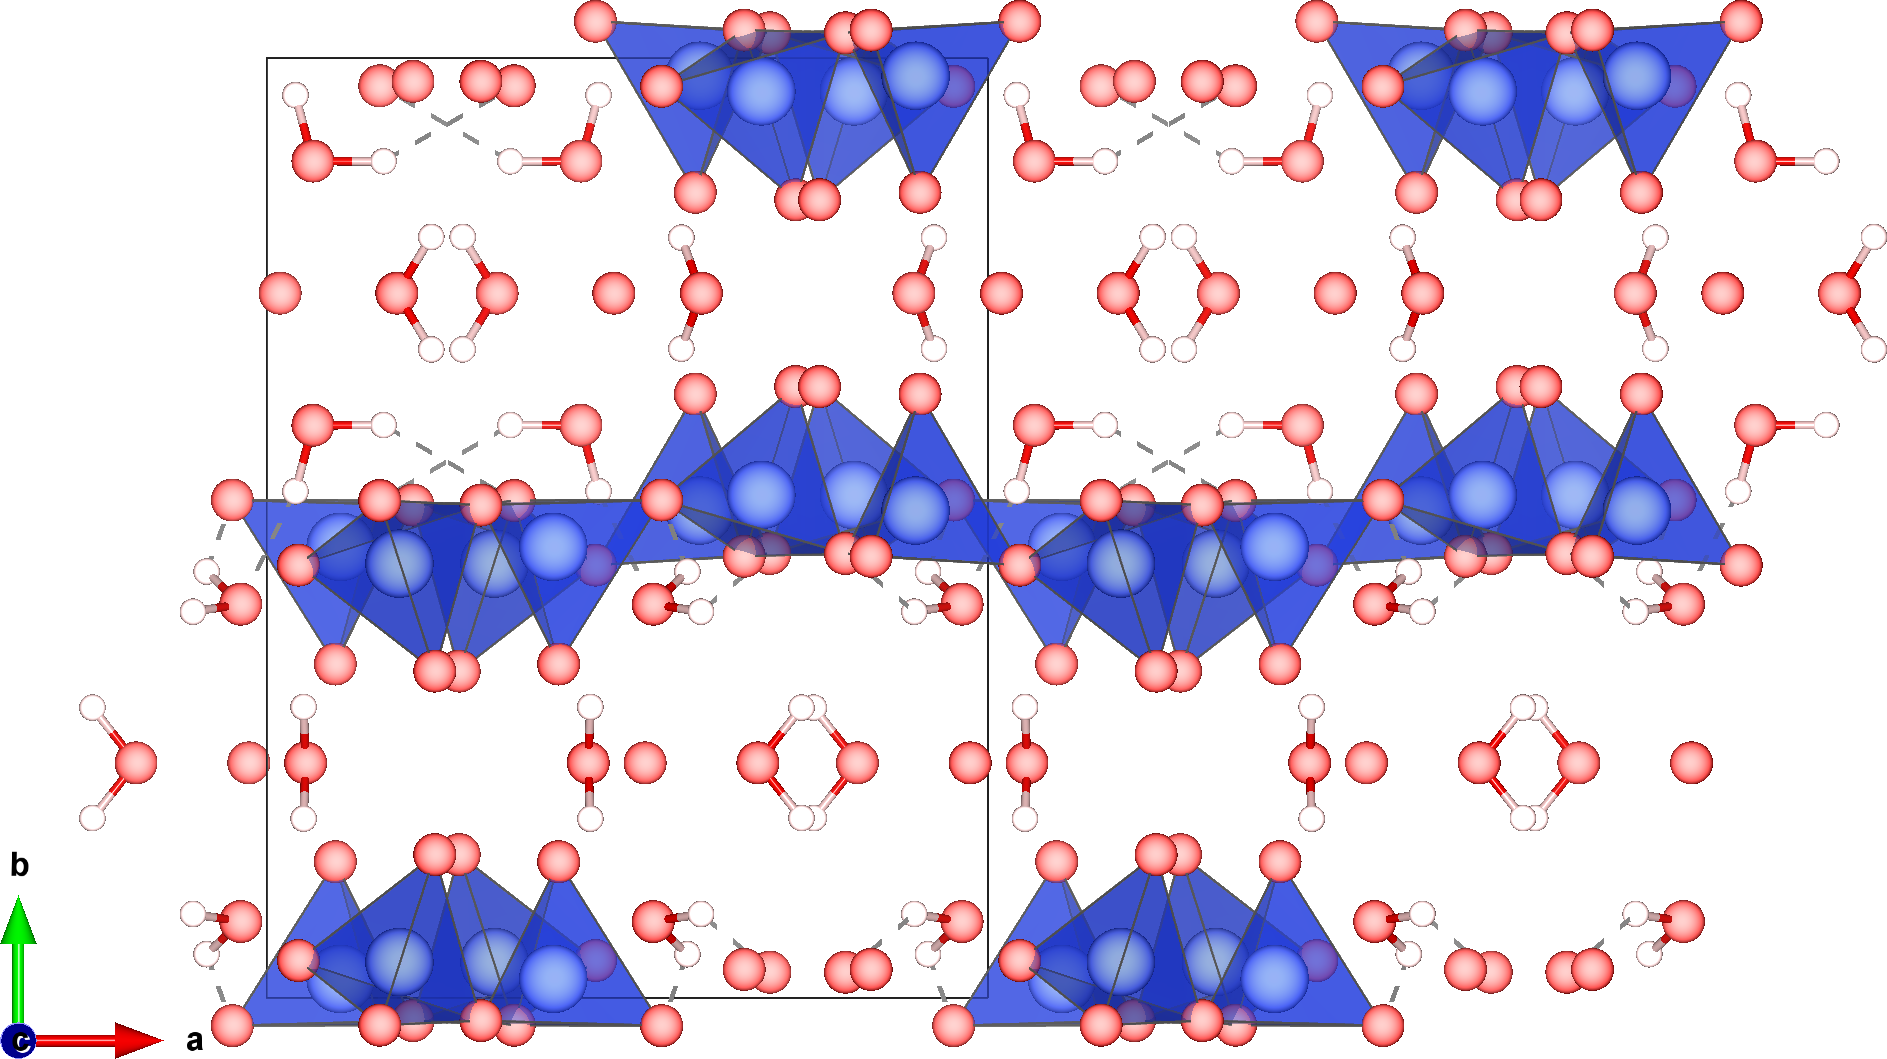
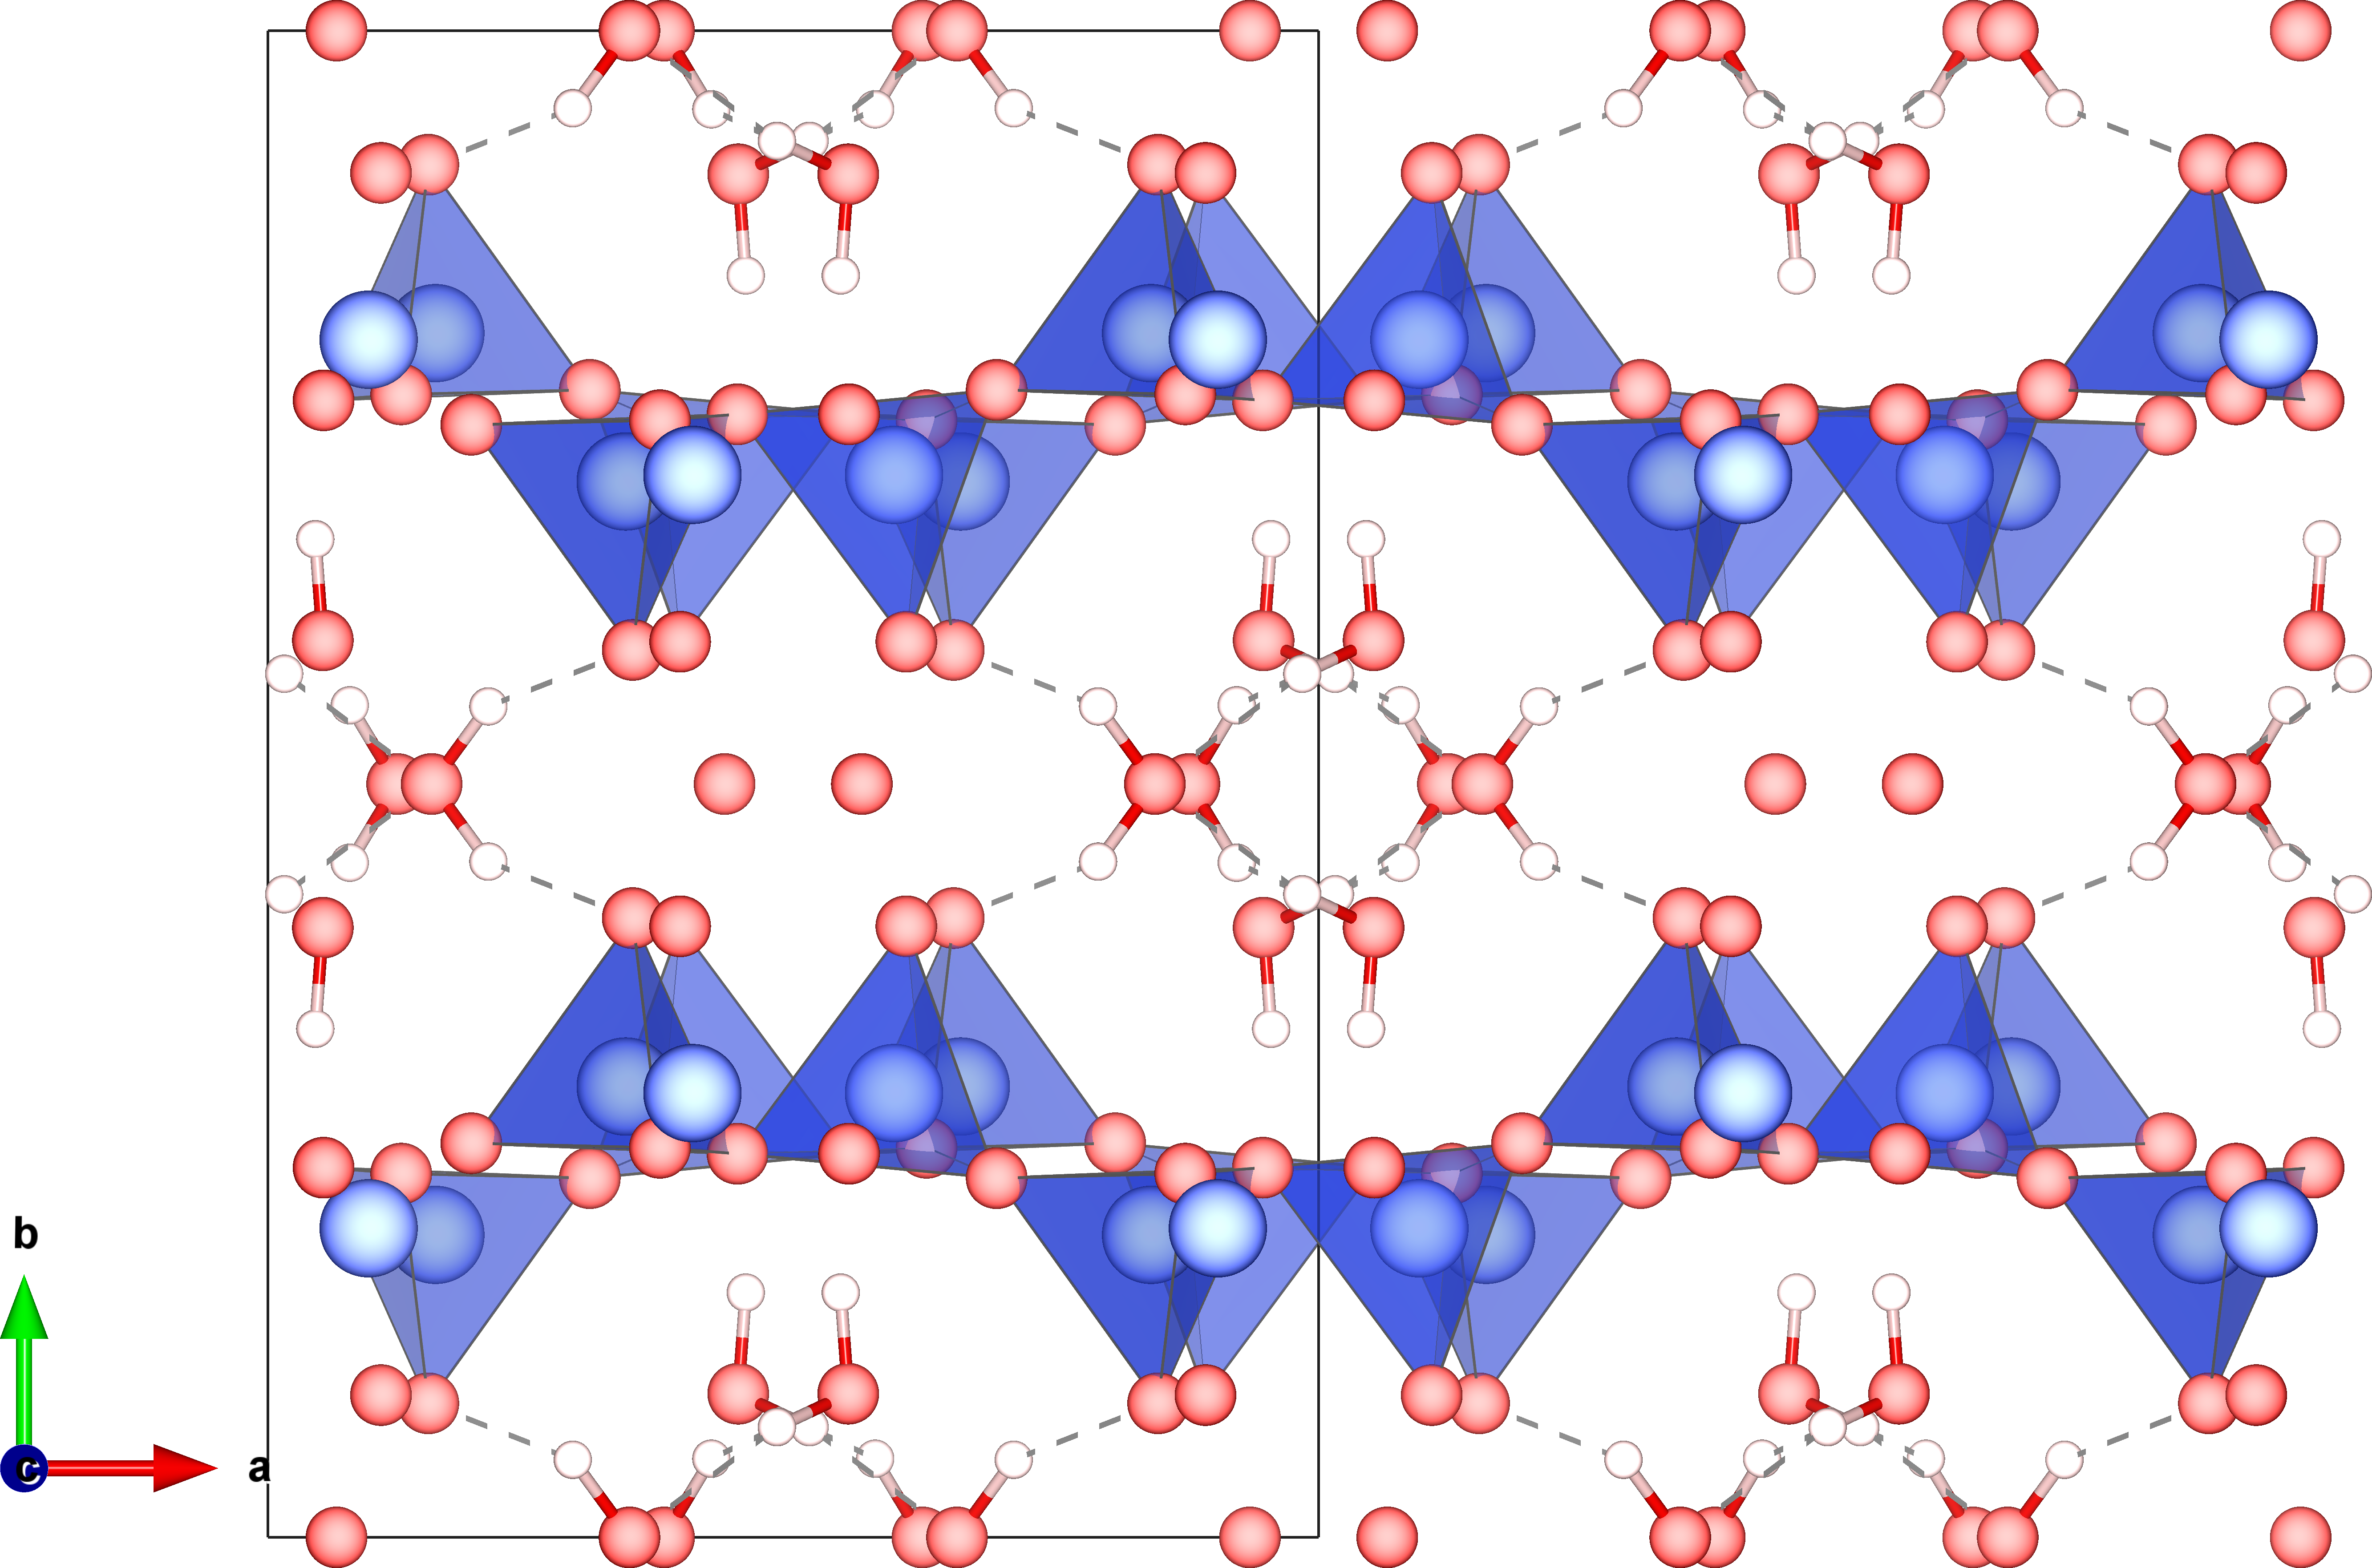
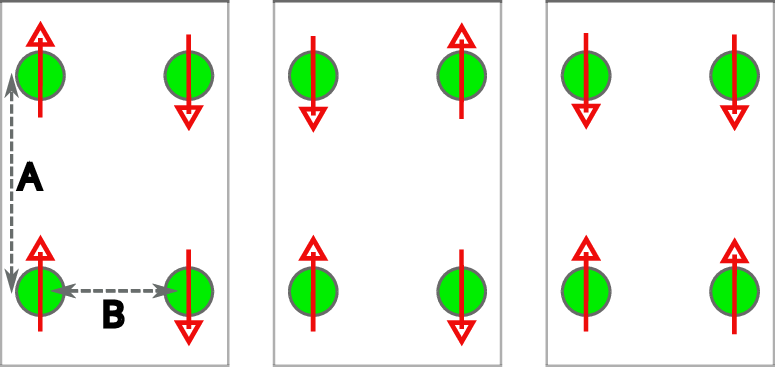
We begin by examining the fully optimized unit cells (see Fig. 1) of both systems with knowledge that the presence of transition atoms (Vanadium) warrants a full spin-polarized calculations. There are four vanadium atoms which gives rise to four possible magnetic configurations: one ferromagnetic and three antiferromagnetic. Figure 2 shows the schematics of three antiferromagnetic phases. The ferromagnetic phase is not shown. We perform all four calculations by initiating appropriate moments on the vanadium atoms and then fully relaxing the unit cell.
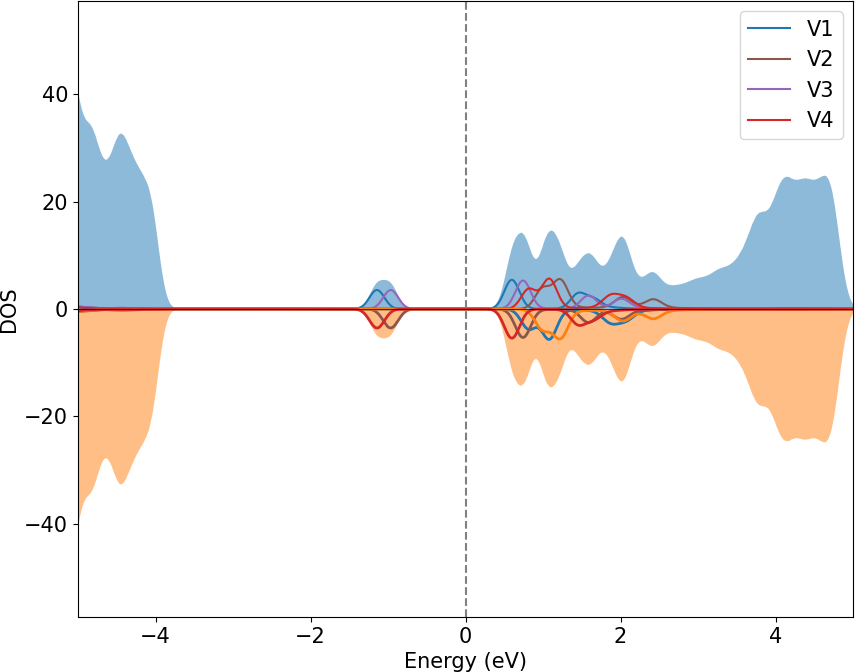
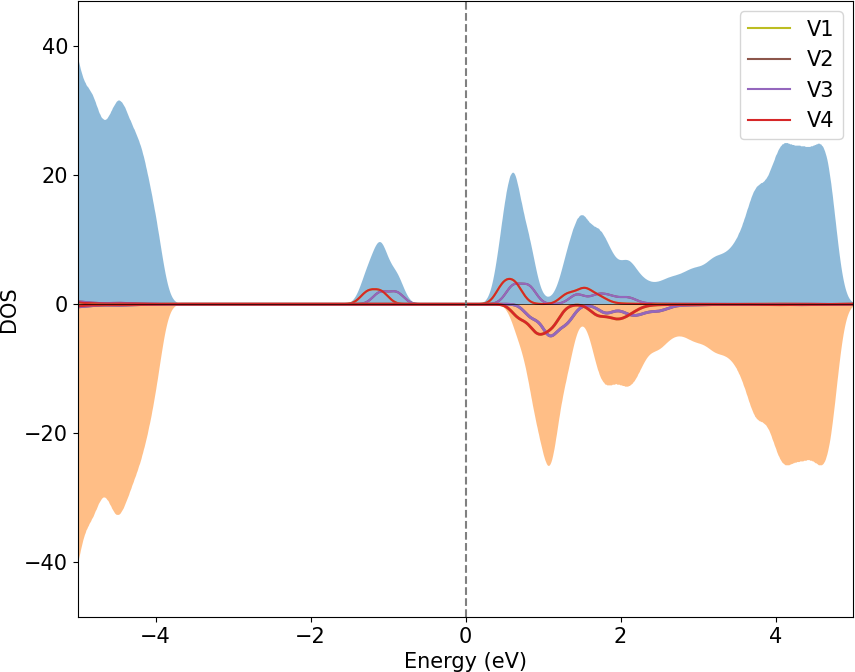
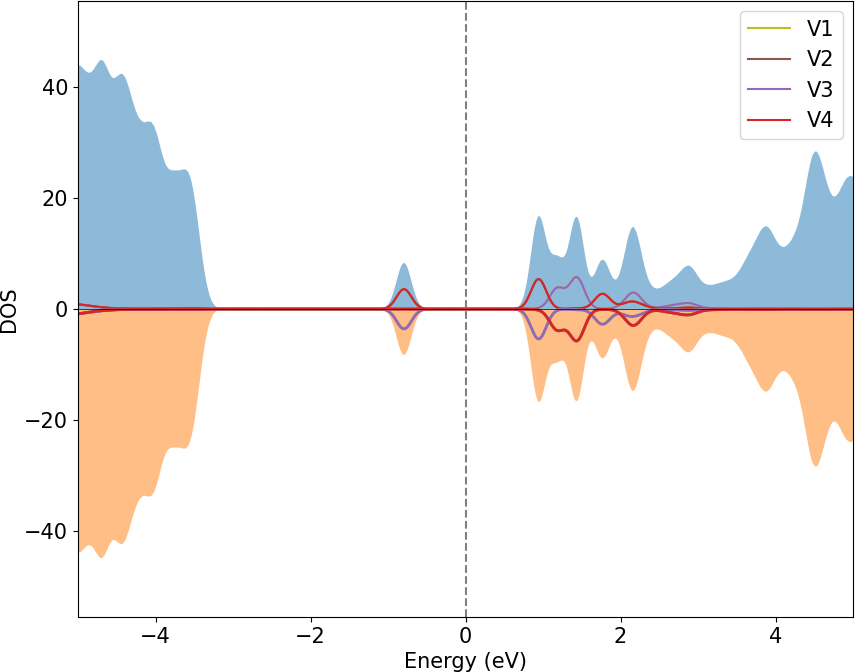
We first note that the optimized unit cells for all four configurations are numerically identical up to three decimal places for both the minerals. The unit cells are orthorhombic, with cell parameters for Cavansite being Å, Å, Å, with volume 1256.19Å3, and those for Pentagonite being Å, Å, Åwith volume 1291.19Å3. This implies that the Pentagonite unit cell is 2.7% larger in volume, which is consistent with the experimental findings. The ground state for both the minerals is an antiferromagnetic phase – AF1 – with localized moments on the vanadium atoms arranged in such a way that the nearest vanadium atoms are antiferromagnetically coupled while the next-nearest ones are ferromagnetically coupled (Figure 2)(a). Each atom has about 0.667 of moment due to partial occupancy of -orbitals. The electronic density of states (DOS) along with the contribution by vanadium are shown in Fig. 3. The left panel of the figure shows the DOS corresponding antiferromagnetic phase of Cavansite (top) and Pentagonite (bottom), and the right panel shows the same for ferromagnetic phase. We notice a highly localized -states at eV arising from vanadium atoms as a mid-gap state in an otherwise large band gap ( 4.6 eV) for all the cases. The differentiating factor between the two minerals is that for Pentagonite the contribution from all the four atoms is degenerate in the mid-gap state while for Cavansite the pairs of nearest neighbors are degenerate and there is a marginal shift between the two pairs. This can easily be attributed to larger separation of next nearest neighbors: 6.88Å for Cavansite against 8.82Å for Pentagonite (see Figure 2), resulting in a weaker coupling.
Although the magnetic coupling among the vanadium atoms appears stronger in Cavansite than in Pentagonite, it is anything but strong in absolute terms. The energy difference between the ground state antiferromagnetic and ferromagnetic phases is barely 0.6meV for Cavansite and 0.1meV for Pentagonite. The approximate Curie temperature can be obtained using the formula
where the effective exchange constant () is taken to be the difference in total energies of the magnetic phases , is the number of contributing magnetic atoms in the system ( in our case) and is the Boltzmann constant. This gives us the two s to be 1.32K and 0.26K respectively for Cavansite and Pentagonite. We therefore speculate that the magnetic vanadium ions interact extremely weakly with each other and, for all practical purposes, it would be difficult to experimentally detect any magnetic response from either of the minerals.
Overall, we found that Cavansite is energetically lower by 0.26eV per formula unit than Pentagonite. This can be attributed to the structural differences. Both the unit cells are characterized by the sheets of Si-O4 polyhedra in the a-c plane, stacked along the c axis. Also, the Si-O4 polyhedra form rings when viewed along the longer b axis. Four water molecules per formula unit reside among the voids created by the sheets and the intermediate atoms of calcium and vanadium. However, there are a few important differences in the structures that we wish to highlight. In Cavansite, calcium atoms have eight coordinating oxygen atoms: four from SiO4 polyhedra and four from water. On the other hand, in Pentagonite the calcium atoms have seven oxygen atoms: four from SiO4 polyhedra and only three from water. One remaining water molecule is hydrogen-bonded with other water molecules and oxygen atoms of silicate sheets. The polyhedral rings in Pentagonite are 6-membered rings, while those in Cavansite are larger 8-membered rings joined via smaller 4-membered rings. This rearrangement is also associated with the restructuring of SiO4 sheets. Notice from Fig. 1 (bottom panel) that for Pentagonite the polyhedra are almost parallel (and anti-parallel) to each other, but for Cavansite they are tilted alternatively by 20∘ and 22.5∘. This restructuring enables more compact packing (hence the reduction in volume) thereby lowering the energy.
Therefore, from the ground state energies it is reasonable to expect Cavansite being more abundant than Pentagonite. Yet one cannot ignore the effects of pressure and temperature during their formation, which we shall explore now.
III.2 Temperature-dependent abundance
Approximate temperature-dependent of a two-state system may be modeled using the Boltzmann probability model that calculates the probabilities of occurrence of each mineral at given temperature using their ground state energiesas
| (1) |
where is the probability of formation of state (for {Cavansite, Pentagonite}.) at temperature , is the energy of the state . Because we have assumed a two-state system, we must have .
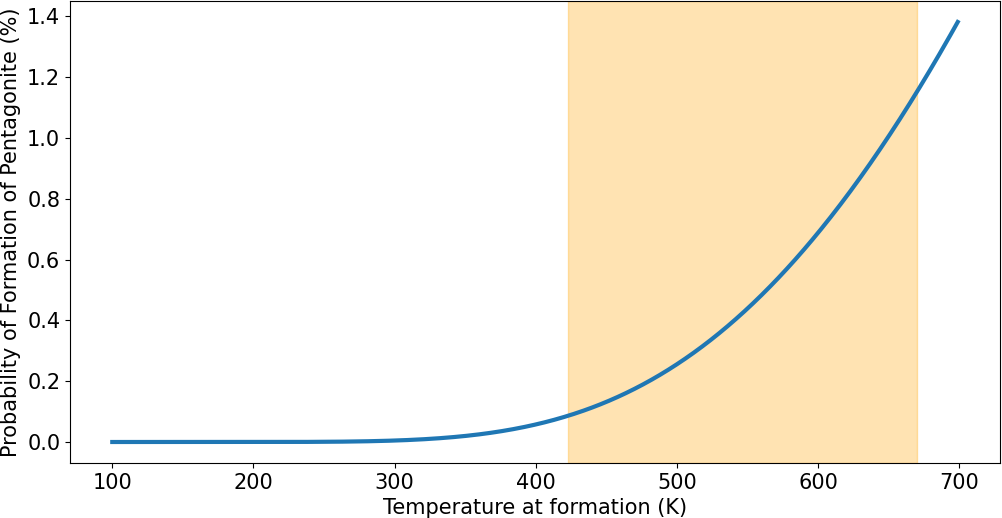
We show the computed probability of formation of Pentagonite at zero pressure in Figure 4. As of today, it is not clear what the crystallization temperatures for Cavansite and Pentagonite in lava flows are, but as reported[4], Cavansite maintains crystallinity even when heated up to 670K. The lava temperature at the time of formation is expected to be around or below this temperature down to 450K. For visualization purposes, we have highlighted this area in the figure. We thus expect about 1% Pentagonite and 99% Cavansite at around 650K. In other words, for every 99 unit weight of Cavansite, one would find barely 1 unit weight of Pentagonite. These numbers provide an explanation of why it is difficult to find Pentagonite in the field.
A few caveats are in place here. The two-state Boltzmann probability model (Eq. 1) is a fairly simplistic view of what is arguably an extremely complex system of multiple interacting atomic and chemical units in a cooling-lava environment. Specifically, this model assumes that there are no competing minerals during the formation of Cavansite and Pentagonite. While atomistically modeling of the cooling of a lava flow is practically impossible, we do believe that the two-state Boltzmann probability model offers a useful approximation.
III.3 Pressure-dependent abundance
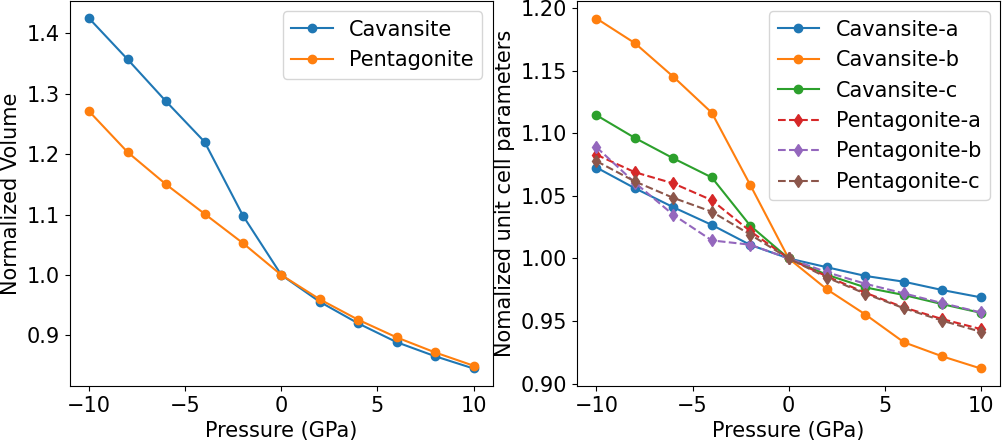
To examine the effect of pressure on the formation of Cavansite and Pentagonite, we optimize the unit cells (anisotropically) at a specific target pressure. Figure 5 presents the results of these optimizations including modified unit cell parameters and volumes normalized with respect to the ground state (i.e, at zero pressure).
The figure illustrates the effect of pressure within the range of -GPa to GPa. It is worth noting that negative pressure, which corresponds to tensile strain (stretching of the unit cell), is purely of theoretical interest and is unlikely to be observed in geological conditions. It is evident from the figures that the lattice structure of Cavansite experiences a significant change primarily driven by the variations along the b axis. Variations in unit cell of Pentagonite are relatively monotonous. This observation is consistent with the experimental finding by Danisi et al [27] (see Figure 5) who have noted similar anisotropic compressibility along the b axis only for Cavansite.
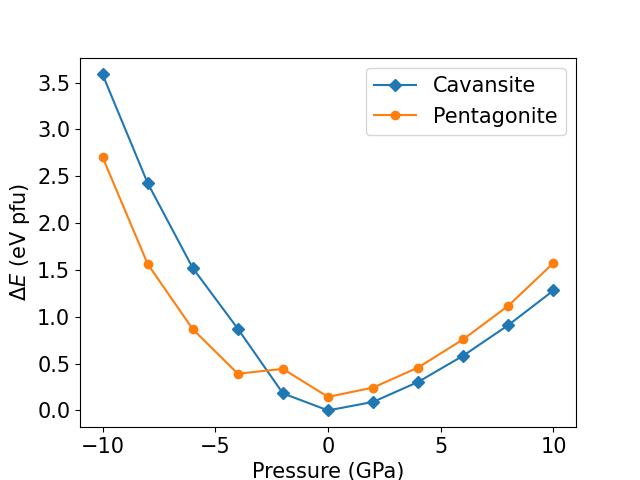
The fact that Pentagonite displays less compressibility along all axes suggests a high bulk modulus. To find the bulk modulus, we fit the Birch-Murnaghan equation of state to the volume-energy data. Figure 6 shows the energies (with respect to the ground state energy of Cavansite) as a function of volume. From these data, we obtain estimated bulk modulii of 33.7GPa and 41.1GPa for Cavansite and Pentagonite respectively. These numbers are in excellent agreement with those observed experimentally (38 GPa and 49 GPa respectively) [27]. Importantly, for all positive pressures, Cavansite remains lower in energy (hence favored). Negative pressures, however, show a phase transition around GPa in favor of Pentagonite.
This is consistent with the rather large volume jump as seen in case of Cavansite in Figure 5.
III.4 Pressure-Temperature (P-T) phase diagram
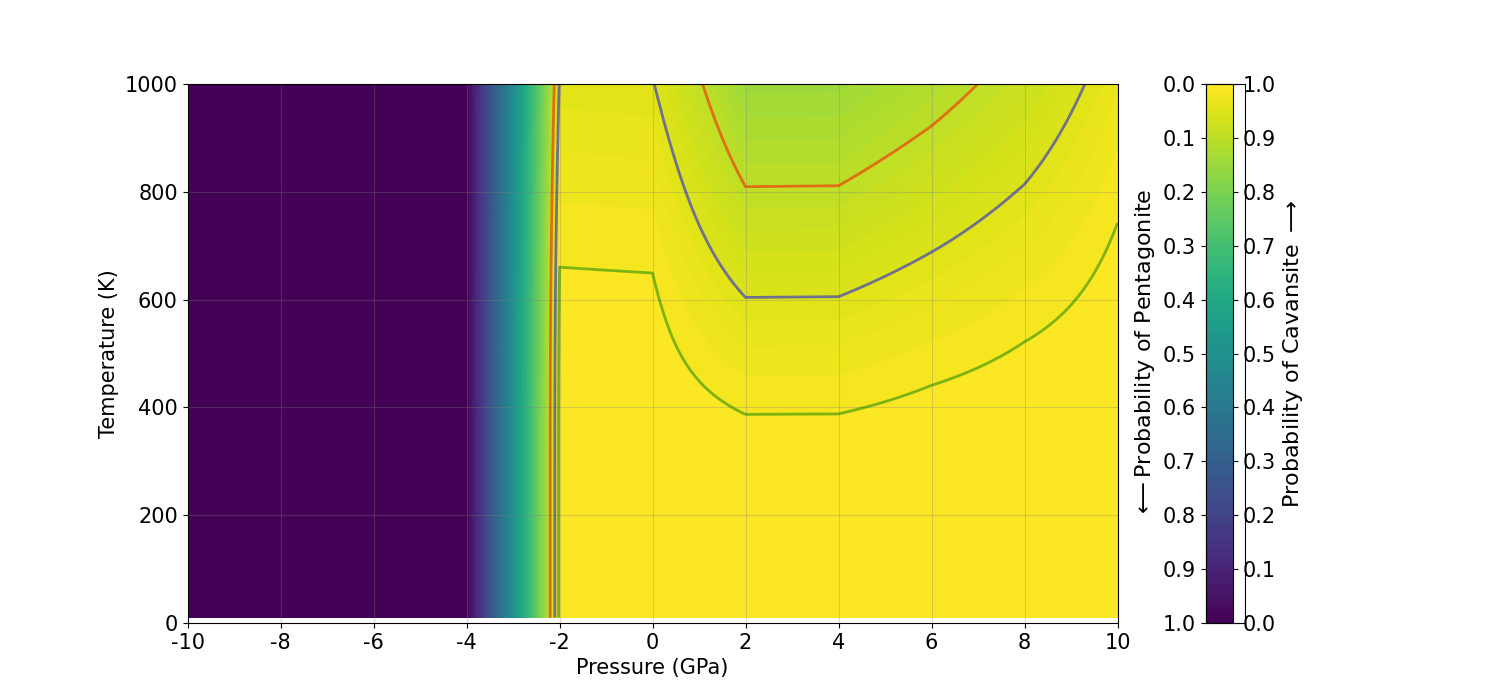
Now that we have seen the effects of pressure and temperature separately, we combine them to build a P-T phase diagram. Using Eq 1, we compute probabilities for a range of temperatures and pressures for both the systems. The resulting phase diagram is shown in Figure 7 in which color indicates the probabilities of formation of the two species.
We note that, for negative pressures, Pentagonite dominates the P-T diagram. However, as mentioned before, negative pressures are unlikely to occur in realistic circumstances and can only be investigated in an experimental setting. The vertical band around GPa indicates phase transition to a Cavansite-rich zone on the right. For all practical purposes, the region on the right of zero pressure is of geological importance. Clearly it is dominated by Cavansite which is favored over Pentagonite. The contours corresponding to 99%, 95% and 90% probability of formation of Cavansite are overlaid for convenience. Because in our model, these contours also indicate the 1%, 5% and 10% probabilities of formation of Pentagonite. Clearly, pressure and temperature both aid the formation of Pentagonite ever so slightly, with the effect becoming less prominent at higher pressures. It appears that there is fairly narrow window in the P-T plane which favors the existance of Pentagonite.
We note that our results agree with Ishida et al [28] who have noted that Pentagonite is a high-temperature polymorph of Cavansite. For pressures less than 2GPa, we note that about 1% formation probability of Pentagonite requires temperatures of 400K to 600K. A higher probability requires even higher temperatures. In other words, presence of Pentagonite in the lava flow may suggest higher lava temperatures.
III.5 Dehydration of crystals
| a | b | c | ||
|---|---|---|---|---|
| Cavansite | 9.940 | 12.944 | 9.764 | |
| 25% dehydrated Cavansite | 9.724 | 13.404 | 9.606 | -4.2 |
| 50% dehydrated Cavansite | 9.577 | 12.782 | 9.472 | -96.8 |
| 75% dehydrated Cavansite | 9.309 | 12.557 | 9.358 | -162.3 |
| Dehydrated Cavansite | 8.960 | 12.102 | 9.046 | -275.4 |
| Pentagonite | 10.093 | 14.475 | 8.838 | |
| 25% dehydrated Pentagonite | 10.034 | 14.006 | 8.850 | -47.8 |
| 50% dehydrated Pentagonite | 10.026 | 13.863 | 8.905 | -53.6 |
| 75% dehydrated Pentagonite | 9.932 | 13.256 | 8.726 | -142.4 |
| Dehydrated Pentagonite | 10.012 | 12.318 | 9.032 | -177.3 |
We now investigate the effect of precense of water in the structure, by removing one water molecule at a time and then performing full unit cell relaxations. For each (de)hydration level there are multiple different unit cell configurations possible. Specifically, for water molecules per unit cell, we have unit cell configurations (.
We systematically generate and fully optimize all these configurations for each and report here only the one with the lowest energy.
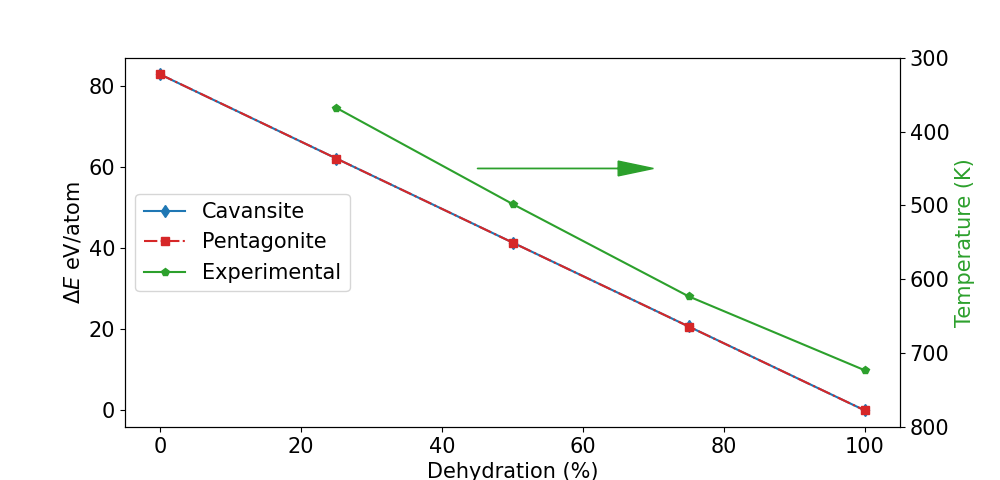
See Table 2 for our optimized parameters and the corresponding experimental values. We note here that the experimental values are at much higher temperatures as against our zero-temperature calculations. As expected, the unit cell volume decreases upon removal of water indicating the reduction in volume of the voids inside a unit cell. Figure 8 shows the change in energies as a function of dehydration (zero of the energies are set to fully hydrated ground state energies of corresponding crystals). We note surprising linear behavior indicating the energy required to remove each water molecule is uniformly increasing. This is a result of rather weak binding of water molecules to the underlying zeolite scaffolding. In fact same phenomenon is observed in experiments by Ishida et al [28] who have reported the temperatures of complete removal of individual water molecules from Cavansite crystals. Notice a near straight line (in Figure 8) for the reported temperatures, consistent with the energies.
At this stage we wish to comment on the role of van der Waals (vdW) interaction. We note here that without vdW corrections, DFT calculations overestimate typical cell lengths by about 10% when compared to uncorrected calculations. This is, of course, expected because non-vdW-corrected DFT functionals do not accurately capture the long-range attractive vdW interactions. We also note that in absence of vdW correction, the ground state energy of dehydrated Pentagonite is lower than that of dehydrated Cavansite. On the other hand, our vdW-corrected calculations predict that the energetically more favourable ground state structure is Cavansite. This issue can be conclusively resolved perhaps only through experiments.
IV Implications of our results to mineralisation
Our computational results have interesting implications to the current understanding of the mineralisation processes leading to the formation of Cavansite and Pentagonite. We elaborate on this below.
Wagholi, Pune, India, is the seat of perhaps the largest deposits of both Cavansite and Pentagonite. Here, a thick (10m), massive basaltic lava flow is exposed and is quarried for road metal and aggregates. At its base, its contact with the lower lava flow is marked by sporadic patches of flow-top breccia. This highly oxidised, glassy breccia has high porosity and permeability with copious irregular and haphazard vugs and cavities containing heulandite, stilbite, a rare green appophylite, and two generations of calcite. Radiated aggregates or sheaf-like crystals of Cavansite grow on top of heulandite, stilbite and calcite. In 1998, the rarer Pentagonite was discovered to co-occur with its diamorph Cavansite in some of the cavities [10]. Cavansite and Pentagonite occurrences at Wagholi are characterised by high vanadium concentrations of 600-750 ppm in the host basalts [29]. Thus, the presence of vanadium-bearing minerals suggests in situ scavenging of vanadium from glassy basalt by hydrothermal fluids and their subsequent deposition in micro niche environments [12].
The findings of our study suggest the following possibilites about the mineralisation processes that lead to the deposition of Cavansite and Pentagonite.
-
1.
We speculate that Cavansite may have been deposited first by hydrothermal fluids under saturated conditions (which is a common process for zeolite formation in cavities over relevant geological time scales). Pentagonite got deposited only after the temperature in the cavities rose and evaporated the fluid in the cavites at slightly faster rates (explaining relatively small crystal sizes). The top layer of lava mentioned earlier could be one possible reason for temperature rise in the lower layer because of blanketing of the lower layer.
-
2.
The observed abundances of Cavansite and Pentagonite are explained through two mechanisms which may act separately or in tandem under geological conditions:
-
(a)
Through the fundamental physics of these two minerals leading to the probabilities we presented earlier (1% for Pentagonite and 99% for Cavansite in the relevant lava temperature range of 450-650K. We speculate that the thick lava flows from Wagholi might have cooled under a similar thermal regime (perhaps even lower) when zeolite mineralisation was initiated in the breccia cavities.
One must also remember that breccia are known to experience considerable overburden pressure in addition to the fluid pressure in the cavities. In the P-T phase diagram (Figure 7), there is a distinct area around 4GPa at high enough temperatures where we see a significant probability of formation of Pentagonite. However, these conditions are rarely achieved in real-life lava flows. Consequently, the probability of formation of Pentagonite remains significantly low despite higher temperatures.
-
(b)
Via the normal geological spatiotemporal variability of prevailing temperature and pressure conditions, suggesting that only a limited fraction of vugs and cavities may have been exposed to appropriate temperature and pressure conditions favouring the formation of Pentagonite.
-
(a)
V Conclusion
In this work, we have performed extensive DFT calculations to examine the electronic structures, structural properties, and relative abundances of two microporous vanadosilicate dimorphs, namely Cavansite and Pentagonite. We find that the structural arrangements of SiO4 tetrahedra as well as the differently-coordinated calcium atoms are responsible for the lower ground state energy of Cavansite at zero pressure and zero temperature. To mimic field conditions in the lava flows where these minerals are formed, we extended our calculations to compute electronic structures under pressure. To model the effect of temperature on the relatively abundances of the two minerals, we used a two-state Boltzmann probability model. This enabled us to construct a comprehensive pressure-temperature-abundance phase diagram for the two minerals. This phase diagram explains why Cavansite is significantly more abundant than Pentagonite. Our model shows that the formation of Pentagonite is assisted by both pressure and temperature although this effect is most pronounced over a limited range of (negative) pressures. This study provides insights into mineralization processes that lead to or contribute to the deposition of Cavansite and Pentagonite in the observed proportions.
Our DFT calculations have also predicted a highly localized weak magnetic state due to vanadium atoms that is associated with weak magnetic ordering at very low temperatures (Curie temperatures around 1K). We have also investigated hydration in both the minerals to find that water is rather loosely bound to the crystal structure. This work provides new insights both for the geological and material science aspects of vanadosilicate minerals and paves way for further studies on their formation and properties.
Acknowledgements.
BSP would like to thank Andrey Tokarev for valuable comments.References
- Staples et al. [1973] L. W. Staples, H. T. Evans Jr, and J. R. Lindsay, Cavansite and pentagonite, new dimorphous calcium vanadium silicate minerals from oregon, American Mineralogist: Journal of Earth and Planetary Materials 58, 405 (1973).
- Danisi et al. [2015a] R. M. Danisi, T. Armbruster, R. Arletti, G. D. Gatta, G. Vezzalini, S. Quartieri, and V. Dmitriev, Elastic behavior and pressure-induced structural modifications of the microporous ca(vo)si4o10·4h2o dimorphs cavansite and pentagonite, Microporous and Mesoporous Materials 204, 257 (2015a).
- Phadke and Apte [1994] A. V. Phadke and A. Apte, Thermal behaviour of cavansite from wagholi, india, Mineralogical Magazine 58, 501 (1994).
- Danisi et al. [2012] R. M. Danisi, T. Armbruster, and B. Lazic, In situ dehydration behavior of zeolite-like cavansite: A single-crystal x-ray study, American Mineralogist 97, 1874 (2012).
- Cymes [2020] B. A. Cymes, Catalytic Properties of Novel Microporous Minerals, Ph.D. thesis, Miami University (2020).
- Evans Jr [1973] H. T. Evans Jr, The crystal structures of cavansite and pentagonite, American Mineralogist: Journal of Earth and Planetary Materials 58, 412 (1973).
- Birch [1977] W. Birch, Cavansite from the poonah district, india, Mineralogical Record 8, 61 (1977).
- Kothavala [1991] R. Kothavala, The wagholi cavansite locality near poona, india, The Mineralogical Record 22, 415 (1991).
- Cook [1996] R. B. Cook, Connoisseur’s choices: Cavansite: Near wagholi, poona district, maharashtra, india, Rocks & Minerals 71, 180 (1996).
- Ottens et al. [2000] B. Ottens, G. Blass, and H. Graf, Cavansit und pentagonit, Mineralien-Welt 2, 59 (2000).
- Powar and Byrappa [2001] K. Powar and K. Byrappa, X-ray, thermal and infrared studies of cavansite from wagholi western maharashtra, india, Journal of Mineralogical and Petrological Sciences 96, 1 (2001).
- Ottens [2003] B. Ottens, Minerals of the deccan traps, india, The Mineralogical Record 34, 5 (2003).
- Makki [2005] M. F. Makki, Collecting cavansite in the wagholi quarry complex pune, maharashtra, india, Mineralogical Record 36, 507 (2005).
- Mookherjee and Phadke [1998] A. Mookherjee and A. Phadke, Thermo-dilametric study of cavansite from wagholi, india, Gondwana Geological Magazine 13, 23 (1998).
- Praszkier and Siuda [2007] T. Praszkier and R. Siuda, The lonavala quarry: Pune district, maharashtra, india, Mineralogical Record 38, 185 (2007).
- Praszkier [2009] T. Praszkier, Cavansit und pentagonit aus indien, Mineralien-Welt 20, 16 (2009).
- Frank et al. [2004] H. Frank, P. Alegre, and J. Thornton, Cavansit: Neu aus sudbrasilien und aus neuseeland, Mineralien magazin lapis , 41 (2004).
- White [2002] J. S. White, Let’s get it right: Cavansite or pentagonite?, Rocks & Minerals 77, 274 (2002).
- Perdew et al. [1996] J. P. Perdew, K. Burke, and M. Ernzerhof, Generalized gradient approximation made simple, Physical review letters 77, 3865 (1996).
- Giannozzi et al. [2009] P. Giannozzi, S. Baroni, N. Bonini, M. Calandra, R. Car, C. Cavazzoni, D. Ceresoli, G. L. Chiarotti, M. Cococcioni, I. Dabo, et al., Quantum espresso: a modular and open-source software project for quantum simulations of materials, Journal of physics: Condensed matter 21, 395502 (2009).
- Garrity et al. [2014] K. F. Garrity, J. W. Bennett, K. M. Rabe, and D. Vanderbilt, Pseudopotentials for high-throughput dft calculations, Computational Materials Science 81, 446 (2014).
- Dal Corso [2014] A. Dal Corso, Pseudopotentials periodic table: From h to pu, Computational Materials Science 95, 337 (2014).
- Kucukbenli et al. [2014] E. Kucukbenli, M. Monni, B. Adetunji, X. Ge, G. Adebayo, N. Marzari, S. De Gironcoli, and A. D. Corso, Projector augmented-wave and all-electron calculations across the periodic table: a comparison of structural and energetic properties, arXiv preprint arXiv:1404.3015 (2014).
- Lejaeghere et al. [2016] K. Lejaeghere, G. Bihlmayer, T. Björkman, P. Blaha, S. Blügel, V. Blum, D. Caliste, I. E. Castelli, S. J. Clark, A. D. Corso, S. de Gironcoli, T. Deutsch, J. K. Dewhurst, I. D. Marco, C. Draxl, M. Dułak, O. Eriksson, J. A. Flores-Livas, K. F. Garrity, L. Genovese, P. Giannozzi, M. Giantomassi, S. Goedecker, X. Gonze, O. Grånäs, E. K. U. Gross, A. Gulans, F. Gygi, D. R. Hamann, P. J. Hasnip, N. A. W. Holzwarth, D. Iuşan, D. B. Jochym, F. Jollet, D. Jones, G. Kresse, K. Koepernik, E. Küçükbenli, Y. O. Kvashnin, I. L. M. Locht, S. Lubeck, M. Marsman, N. Marzari, U. Nitzsche, L. Nordström, T. Ozaki, L. Paulatto, C. J. Pickard, W. Poelmans, M. I. J. Probert, K. Refson, M. Richter, G.-M. Rignanese, S. Saha, M. Scheffler, M. Schlipf, K. Schwarz, S. Sharma, F. Tavazza, P. Thunström, A. Tkatchenko, M. Torrent, D. Vanderbilt, M. J. van Setten, V. V. Speybroeck, J. M. Wills, J. R. Yates, G.-X. Zhang, and S. Cottenier, Reproducibility in density functional theory calculations of solids, Science 351, aad3000 (2016), https://www.science.org/doi/pdf/10.1126/science.aad3000 .
- Prandini et al. [2018] G. Prandini, A. Marrazzo, I. E. Castelli, N. Mounet, and N. Marzari, Precision and efficiency in solid-state pseudopotential calculations, npj Computational Materials 4, 72 (2018).
- Grimme et al. [2010] S. Grimme, J. Antony, S. Ehrlich, and H. Krieg, A consistent and accurate ab initio parametrization of density functional dispersion correction (dft-d) for the 94 elements h-pu, The Journal of Chemical Physics 132, 154104 (2010), https://doi.org/10.1063/1.3382344 .
- Danisi et al. [2015b] R. M. Danisi, T. Armbruster, R. Arletti, G. D. Gatta, G. Vezzalini, S. Quartieri, and V. Dmitriev, Elastic behavior and pressure-induced structural modifications of the microporous ca (vo) si4o10· 4h2o dimorphs cavansite and pentagonite, Microporous and Mesoporous Materials 204, 257 (2015b).
- Ishida et al. [2009] N. Ishida, M. Kimata, N. Nishida, T. Hatta, M. Shimizu, and T. Akasaka, Polymorphic relation between cavansite and pentagonite: genetic implications of oxonium ion in cavansite, Journal of mineralogical and petrological sciences 104, 241 (2009).
- Ghodke et al. [1984] S. Ghodke, K. Powar, and N. Kanegoankar, Trace elements distribution in deccan trap flows in dive ghat area, pune district, maharashtra, in Proc. Symp. on Deccan Traps and Bauxites, Geological Survey of India. Special Publication, 14 (1984) pp. 55–62.