1]Dipartimento di Fisica e Astronomia, Università di Bologna, Bologna, Italy
2]Center for Astrophysics Harvard & Smithsonian, Cambridge, MA, USA
3]Centre for Astrophysics and Supercomputing, Swinburne University of Technology, Hawthorn, Victoria, Australia 4]ARC Centre of Excellence for All Sky Astrophysics in 3 Dimensions (ASTRO 3D), Australia
5]Research School of Astronomy and Astrophysics, Australian National University, Canberra, ACT, Australia
6]Department for Astrophysical and Planetary Science, University of Colorado, Boulder, CO, USA
7]Department of Astronomy & Astrophysics, The Pennsylvania State University, University Park, PA, USA 8]Institute for Gravitation and the Cosmos, The Pennsylvania State University, University Park, PA, USA 9]Institute for Computational & Data Sciences, The Pennsylvania State University, University Park, PA, USA
10]Kavli Institute for Cosmology, University of Cambridge, Cambridge, UK 11]Cavendish Laboratory, University of Cambridge, Cambridge, UK
12]MIT Kavli Institute for Astrophysics and Space Research, Cambridge, MA, USA
13]Columbia Astrophysics Laboratory, Columbia University, New York, NY, USA
14]Leibniz Institute for Astrophysics, Potsdam, Germany
Massive and Multiphase Gas Outflow in a Quenching Galaxy at
Abstract
Large-scale outflows driven by supermassive black holes are thought to play a fundamental role in suppressing star formation in massive galaxies. However, direct observational evidence for this hypothesis is still lacking, particularly in the young universe where star formation quenching is remarkably rapid [1, 2, 3], thus requiring effective removal of gas [4] as opposed to slow gas heating [5, 6]. While outflows of ionized gas are commonly detected in massive distant galaxies [7], the amount of ejected mass is too small to be able to suppress star formation [8, 9]. Gas ejection is expected to be more efficient in the neutral and molecular phases [10], but at high redshift these have only been observed in starbursts and quasars [11, 12]. Using deep spectroscopy from JWST, here we show the presence of an outflow of neutral and ionized gas in a massive galaxy observed during the rapid quenching of its star formation, at a redshift of z=2.445. The outflowing mass is mostly in the neutral phase, and the mass outflow rate is larger than the residual star formation rate, indicating that the gas ejection is likely to have a strong impact on the evolution of the galaxy. We do not detect X-ray or radio activity; however the presence of a supermassive black hole is suggested by the properties of the ionized gas emission lines. We thus conclude that supermassive black holes are able to rapidly suppress star formation in massive galaxies by efficiently ejecting neutral gas.
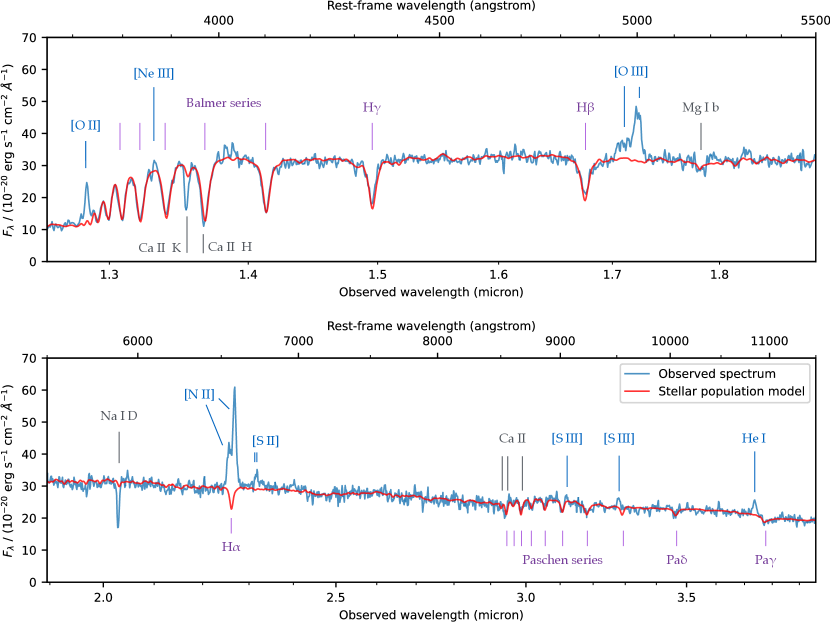
We observed the galaxy COSMOS-11142 as part of the Blue Jay survey, a Cycle-1 JWST program that targeted about 150 galaxies uniformly distributed in redshift () and stellar mass (). COSMOS-11142 is among the most massive targets, with , and is one of the 17 objects that are classified as quiescent according to the rest-frame colors [13]. This is confirmed by the JWST/NIRSpec spectrum, shown in Figure 1, which covers the rest-frame range from 3000 Å to 1.4 µm and features several stellar absorption lines and relatively weak emission lines from ionized gas. The presence of deep Balmer absorption lines clearly indicates that the galaxy is in the “post-starburst” phase immediately following the rapid quenching of a star formation episode.
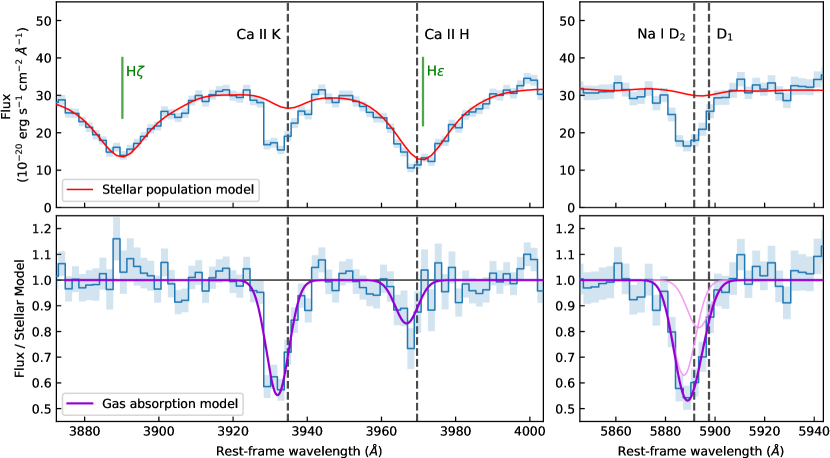
We fit stellar population models to the observed spectroscopy together with the photometry, which covers a wider wavelength range from the ultraviolet to the mid-infrared. The best-fit spectral model is shown in red in Figure 1, and includes stellar light, absorption by dust, and re-emission by dust at longer wavelengths, but does not include the contribution of gas. By analyzing the difference between the data and the model we detect several emission lines due to warm ionized gas: [O II], [Ne III], , [O III], , [N II], [S II], [S III], He I. We also detect three absorption lines, Ca II K, Ca II H, Na I D, which are not correctly reproduced by the stellar model. Unlike the other absorption lines visible in the spectrum, these three are resonant lines, meaning that they can be produced both by stars and by intervening gas, because they involve transitions out of the atomic ground level. The detection of extra absorption in these lines is thus revealing the presence of cold gas. Since the energy required to ionize Na I and Ca II (5.1 and 11.9 eV respectively) is smaller than that required to ionize hydrogen (13.6 eV), these lines probe gas in the neutral atomic phase (i.e., where hydrogen atoms are neutral).
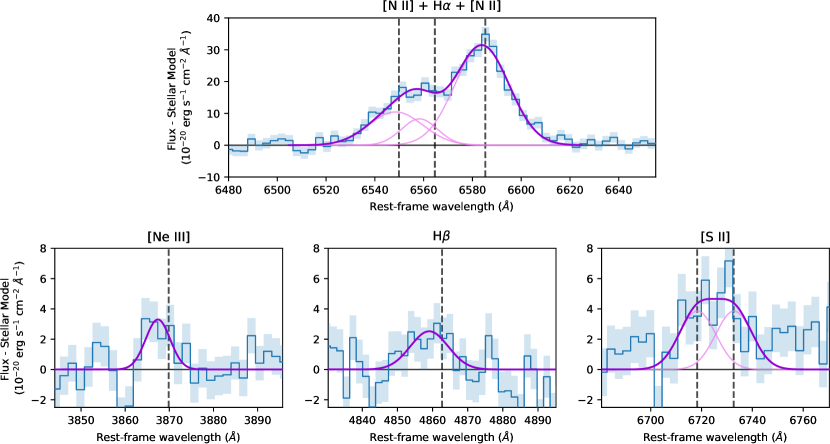
We fit a Gaussian profile to each gas emission and absorption line, obtaining a measure of their flux, line width , and velocity offset with respect to the systemic velocity of the galaxy. We show a selection of lines in the left column of Figure 2: a remarkable diversity of kinematics is apparent, with a wide range of measured line widths and velocity offsets. The presence of blueshifted lines, both in absorption and in emission, with velocity offsets of hundreds of km/s is the unmistakable sign of a gas outflow.
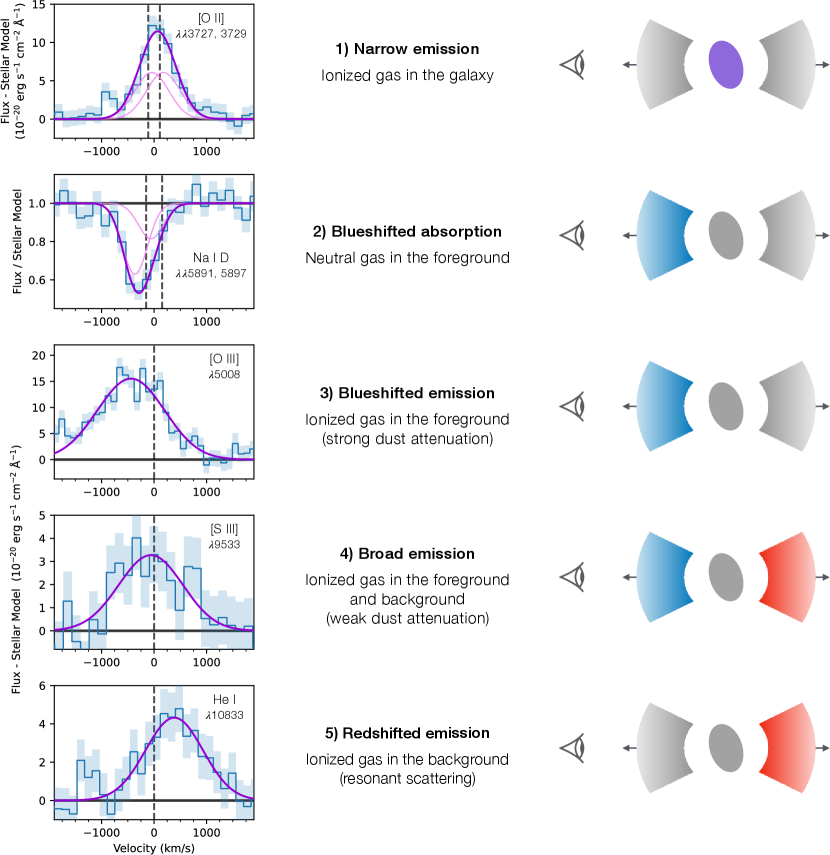
We use a simple model of a biconical outflow, shown in the right column of Figure 2, to qualitatively explain the kinematics of all the observed lines. The five rows of the figure illustrate five different types of lines, classified according to their kinematics, which we discuss here from top to bottom. 1) Low-ionization lines such as [O II] and [S II] have kinematics in agreement with those of the stellar population (i.e., km/s and km/s), suggesting that they originate in the galaxy and not in the outflow. 2) The neutral absorption lines Na I D and Ca II K are significantly blueshifted with km/s, and are therefore tracing the foreground gas that is in the approaching side of the outflow. 3) Emission lines with a relatively high ionization energy, such as [O III] and [Ne III], are also blueshifted ( to km/s), and are thus likely to originate in the approaching side of the outflow. 4) A special case is [S III], which is also a high-ionization emission line but is observed to be at roughly systemic velocity ( km/s) and with a line width that is too broad to be produced by the gas in the galaxy ( km/s); this emission is likely tracing both the approaching and the receding side of the outflow. The difference with the other high-ionization emission lines is due to the redder rest-frame wavelength of [S III], which makes it less prone to dust attenuation and allows us to see the full velocity distribution. The [O III] emission is thus blueshifted not because the outflow is asymmetric, but because its far, redshifted side is hidden by dust attenuation. 5) Finally, He I is the only emission line that is redshifted ( km/s) compared to the systemic velocity of the galaxy, implying that we are seeing the receding side of the outflow but not the approaching side. This behavior is often found in observations of the Ly line, which experiences resonant scattering, where the photons emitted in the outflow are re-absorbed by the neutral hydrogen unless they are substantially redshifted. Since the He I transition involves a meta-stable level of the helium atom, it can give rise to a similar resonant scattering (with the difference that the meta-stable level can only be populated via recombination, meaning that the He I line, unlike Ly, traces gas that is ionized). Its velocity offset and line width are consistent with the values measured for blueshifted emission lines, thus qualitatively confirming the outflow geometry shown in Figure 2. The overall picture emerging from the observations is that of an outflow that is present both on the foreground and on the background of the galaxy: this could be either a biconical or a spherical outflow.

Assuming that the observed line profile is mostly due to projection effects, the outflow velocity can be estimated as [14, 10]. We derive high outflow velocities for the ionized lines, up to km/s in the case of [O III], which strongly suggests the outflow is driven by an active galactic nucleus (AGN). The presence of an AGN is confirmed by the high [N II]/ and [O III]/ line ratios [15].
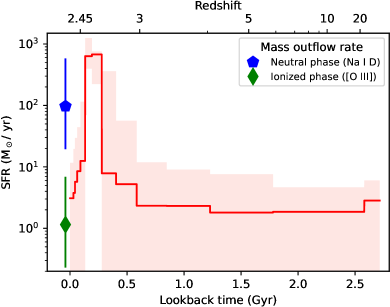
Following standard modeling for the ionized [16, 17] and neutral [14] phases we measure , the mass of gas in the outflow. The derived outflow masses are particularly sensitive to the assumptions made in the derivation, such as the electron number density (for the ionized phase) and the dust depletion together with the opening angle (for the neutral phase; see Methods for details). The uncertainties are therefore dominated by systematics, which we estimate to be about 0.7 dex for both the ionized and the neutral outflow mass. Dust depletion is particularly uncertain for calcium, and so we can use the Ca II K line only to derive a lower limit on the outflow mass. The resulting outflow velocities and masses are shown in the left panel of Figure 3. The ionized outflow masses derived from four different emission lines are in remarkable agreement, which validates some of the assumptions made in the modeling. Moreover, we find that the neutral outflow is slower but has a substantially larger mass, in qualitative agreement with observations of local galaxies [18].
Knowing the outflow mass and velocity allows us to calculate the mass outflow rate, , where is the size of the outflow. We estimate kpc from the NIRSpec data, in which we are able to spatially resolve the blueshifted [O III] emission. We then find /yr for the neutral outflow and /yr for the ionized outflow. The ratio between the two phases is large, but within the range measured in local outflows [18, 19, 20, 21, 22]. However, the mass outflow rate of COSMOS-11142 is an order of magnitude larger than the typical values measured in local star-forming galaxies [23, 24]; this is mostly a reflection of the much stronger Na I D absorption line observed in COSMOS-11142. At high redshift, measurements of neutral outflows from Na I D absorption have only been obtained for a few quasars [25, 26], but observations of UV or sub-millimeter lines tracing neutral gas reveal high mass outflow rates in star-forming galaxies and AGN systems [11].
To understand the role of the outflow in the evolution of COSMOS-11142, in the right panel of Figure 3 we show the star formation history of the galaxy, derived from our spectro-photometric fit. We confirm that the system is a post-starburst galaxy: it formed most of its stellar mass in a rapid and powerful starburst Myr before the observations, and then experienced a rapid quenching of the star formation rate by two orders of magnitude. These remarkably rapid formation and quenching timescales are not seen in the local universe, but are common among massive systems at [1, 2, 3], and represent the only way to form quiescent galaxies at even higher redshift [27] due to the younger age of the universe. According to the star formation history, the rate at which COSMOS-11142 is currently forming stars is between 1 and 10 /yr; we obtain consistent estimates from ionized emission lines and infrared emission. The system is therefore in the middle of quenching, about 1 dex below the main sequence of star formation [28], but still above the bulk of the quiescent population [29, 30]. By comparing the mass outflow rate to the current star formation rate, we conclude that the ionized outflow is weak, while the neutral outflow is very strong. This comparison shows that the ionized outflow is irrelevant in terms of gas budget, whereas the neutral outflow is able to substantially affect the star formation rate by ejecting cold gas before it can be transformed into stars. We thus conclude that the observed outflow likely plays a key role in the rapid quenching of COSMOS-11142; this conclusion is further strengthened when considering that the molecular phase (not probed by our observations) is expected to be equally effective as the neutral phase at ejecting gas [20]. Given the relatively low outflow velocity, km/s, it is possible that most of the cold gas is not able to escape the galaxy. In this case, heating of the halo gas by radio-mode AGN feedback is likely required to maintain this galaxy quiescent over a Hubble timescale. However, this does not change our main conclusion, since radio-mode AGN feedback alone is unable to explain the observed rapidity of quenching.
Despite the highly effective feedback in action, COSMOS-11142 is not detected in publicly available X-ray or radio observations. This suggests that AGN samples selected at those wavelengths do not necessarily probe the galaxy population in which feedback is being most effective. Such samples are usually biased towards powerful AGNs, which tend to live in gas-rich, star-forming galaxies [31, 32]. Strong neutral outflows similar to the one detected in COSMOS-11142 may in fact be present in the majority of massive galaxies, which often have emission line ratios consistent with AGN activity despite the lack of X-ray emission [33, 7]. Among massive galaxies, AGN-driven outflows may be particularly important for the post-starburst population, which is very likely to host emission lines with high [N II]/ ratio [30, 3]. Moreover, the detection of blueshifted neutral gas absorption in post-starburst galaxies at [34, 35] suggests that neutral outflows are frequent during this specific evolutionary phase. The rapid quenching of massive galaxies at may thus be fully explained by the AGN-driven ejection of cold gas.
Methods
JWST Spectroscopy
The Blue Jay survey is a Cycle-1 JWST program (GO 1810) that observed about 150 galaxies at in the COSMOS field with the NIRSpec Micro-Shutter Assembly (MSA). Each galaxy was observed with the three medium-resolution gratings, covering the 1 - 5 µm wavelength range at a spectral resolution of . The target sample was drawn from a catalog [36] based on Hubble Space Telescope (HST) data. The selection was designed in a way to obtain a roughly uniform coverage in redshift and mass, and the sample is unbiased above a redshift-dependent stellar mass of . COSMOS-11142 (the ID is from ref. [36]) was observed in December 2022 for a total of 13 hours in G140M, 3.2 hours in G235M, and 1.6 hours in G395M. A slitlet made of four MSA shutters (shown in Figure 4) was placed on the target and the observations employed a 2-point A-B nodding pattern along the slit. We reduced the NIRSpec data using a modified version of the JWST Science Calibration Pipeline v1.10.1, using version 1093 of the Calibration Reference Data System. Prior to combining the data we visually inspected and excluded any remaining artefacts in the individual exposures. The galaxy 1D spectrum was then optimally extracted. For more details on the Blue Jay survey and the data reduction, see Belli et al. (in preparation).

JWST Imaging
JWST imaging of COSMOS-11142 is available from the PRIMER survey (GO 1837, PI: J. Dunlop) in several bands: F090W, F115W, F150W, F200W, F277W, F356W, F410M, and F444W with NIRCam; and F770W and F1800W with MIRI. We performed aperture photometry on the MIRI data and applied a point-source correction derived from WebbPSF [37]. For the NIRCam data, which have a higher resolution and sensitivity, we fit the surface brightness profile of COSMOS-11142, independently in each band, using Forcepho (Johnson et al., in preparation). We model the galaxy using a single Sersic profile, convolved with the point spread function, and explore the posterior distribution via Markov Chain Monte Carlo (MCMC). This yields a multi-band set of photometric and structural measurements. Figure 4 shows the data and the model for F200W, which is the short-channel band with the highest signal-to-noise ratio (SNR=212), where we measure an effective (half-light) radius , corresponding to 0.6 kpc, a Sersic index , and an axis ratio . While the formal errors are small, and the measurements are likely dominated by systematic uncertainties, we can robustly conclude that the galaxy is compact (yet well resolved in the NIRCam data) and elongated. These results are qualitatively unchanged when considering the other NIRCam bands. The residuals are small, implying that a single Sersic profile is a good description of the galaxy morphology and ruling out the presence of a major merger, a close companion, or bright point-source emission from a Type-1 AGN.
Spectral Fitting
We characterize the stellar population and dust properties of COSMOS-11142 by fitting models to the observed spectroscopic and photometric data. We use the Bayesian code Prospector [38] and follow the approach explained in ref. [39, 3]. We adopt the synthetic stellar population library FSPS [40, 41], the MIST isochrones [42], the C3K spectral library [43], and the Chabrier initial mass function [44]. The galaxy stellar population is described by stellar mass, redshift, velocity dispersion, metallicity, and a non-parametric star formation history with 14 bins. The bins are logarithmically spaced except for the two youngest ones (0–30 Myr and 30–100 Myr), and the oldest, which is a narrow bin placed at the age of the universe, providing the possibility of a maximally old population. We adopt a continuity prior that disfavors abrupt changes in the star formation history (see [45] for details). The model also includes attenuation by dust, described by three parameters (, dust index, and extra attenuation towards young stars; [46, 47]), and dust emission, implemented with three free parameters describing the infrared emission spectrum [48]. We assume that the total amount of energy absorbed by dust is then re-emitted in the infrared. We do not include the contribution from gas or AGN.
| Line | Flux | EW | |||
|---|---|---|---|---|---|
| (Å) | (km/s) | (km/s) | ( erg s-1 cm-2) | (Å) | |
| Absorption | |||||
| Ca II K | 3935 | ||||
| Ca II H | 3970 | — | — | ||
| Na I D | 5892, 5898 | ||||
| Emission | |||||
| [O II] | 3727, 3730 | ||||
| [Ne III] | 3870 | ||||
| H | 4863 | ||||
| [O III] | 5008 | ||||
| H | 6565 | ||||
| [N II] | 6585 | ||||
| [S II] | 6718, 6733 | ||||
| [S III] | 9533 | ||||
| He I | 10833 | ||||
| \botrule |
In order to fit a single model to both the JWST spectroscopy and the multi-wavelength photometry, it is necessary to include important systematic effects, as described in [38]. We add one parameter describing the fraction of spectral pixels that are outliers, and one “jitter” parameter that can rescale the spectroscopic uncertainties when necessary to obtain a good fit. The best-fit value for the jitter parameter is 2.05, suggesting that the NIRSpec data reduction pipeline underestimates the spectral uncertainties. In our subsequent analysis of the emission and absorption lines, we apply this jitter term to the error spectrum, in order to obtain a more accurate estimate of the uncertainties on our results.
We also adopt a polynomial distortion of the spectrum to match the spectral shape of the template, to allow for imperfect flux calibration and slit loss corrections (particularly important in this case since the shutter covers only a fraction of the galaxy). In practice, this is equivalent to normalizing the continuum and only considering the small-scale spectral features such as breaks and absorption lines. In turn, this procedure yields an accurate flux calibration for the JWST spectrum, if we assume that the emission probed by the MSA shutter is just a rescaling of the emission probed by the photometry (i.e., we are neglecting strong color gradients). This yields a slit-loss correction of , with a small dependence on wavelength. The spectrum shown in Figure 1 has been calibrated in this way, and we adopt this calibration also in subsequent analysis of absorption and emission lines.
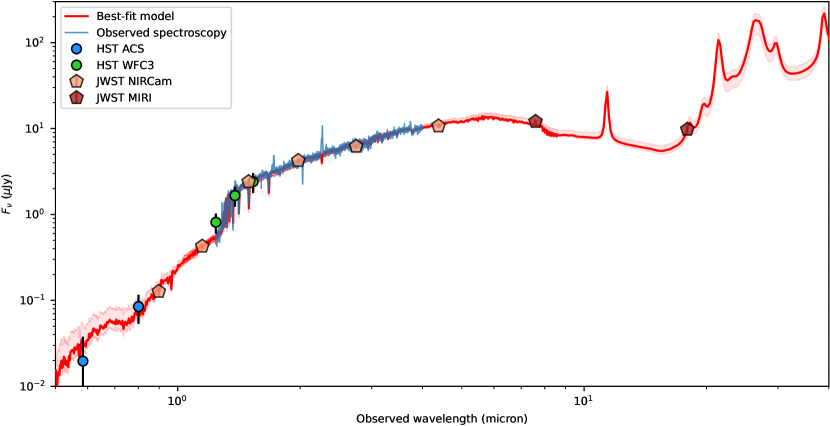
The model has a total of 25 free parameters, and to fully explore the posterior distribution we employ the nested sampling package dynesty [49]. We fit the model to the observed NIRSpec spectroscopy and to the broadband data (shown in Figure 5). In the spectrum we mask ionized gas emission lines, including and , and the resonant absorption lines Na I D, Ca II H, and Ca II K. For the photometry we make use of our measurements from MIRI and NIRCam data (excluding F356W and F410M because the data reduction pipeline flagged most of the galaxy pixels as outliers). We also adopt archival photometry from HST, measured from data taken with the ACS and WFC3 instruments [36]. These measurements are clearly offset from the JWST NIRCam photometry, likely because they have been measured using a different method (photometry within a fixed aperture). From comparing the HST F160W and the JWST F150W bands, which cover a very similar wavelength range, we estimate that the HST fluxes are overestimated by 26%. We correct all the HST points for this offset, and add in quadrature a 26% relative error to the HST uncertainties.
The best-fit model is shown in red in Figure 1 and Figure 5: the same model is able to simultaneously reproduce the spectroscopy and the photometry. The fit yields a stellar mass , a stellar velocity dispersion km/s, and a metallicity [Fe/H] = ; the resulting star formation history is shown in Figure 3. The galaxy is relatively dusty, with , which is higher than what found in quiescent systems and may be related to the rapid quenching phase in which it is observed. We find that the main results of our analysis do not change when excluding the HST photometry, using a smaller wavelength range for the spectroscopic data, or changing the order of the polynomial distortion.
Combining the stellar velocity dispersion with the major axis measured from NIRCam we estimate [50] a dynamical mass , which is slightly smaller than the stellar mass. This could imply issues with the stellar mass measurement, but could also be due to the presence of rotation in the galaxy (suggested by the elongated axis ratio) and/or to the limited sampling of stellar velocities by the small footprint of the MSA shutters. It is intriguing that a similar discrepancy has been found in the only other quiescent galaxy at high redshift for which precise kinematic and structural measurements based on JWST are available [27].
Absorption and Emission Lines
To analyze the gas emission and absorption lines, we first mask these features when running Prospector, and then fit the residuals using Gaussian profiles convolved with the instrumental resolution. The results of the Gaussian fits are listed in Table 1.
We show the resonant absorption lines Ca II H, K and Na I D in Figure 6. These lines are also present in the best-fit stellar model, but the observed absorption is both much stronger and clearly blueshifted, making it easier to study the neutral gas. We also note that the Ca II H line lies on top of the Balmer H absorption line, which however is not resonant and is therefore present only in the stellar spectrum.
Since the effect of neutral gas absorption is multiplicative, when fitting Gaussian profiles we consider the ratio of the observed spectrum to the stellar model. We model Ca II H and Ca II K with a Gaussian profile each, assuming the same width and velocity offset. The ratio of their equivalent widths is noisy due to the faintness of Ca II H, but is consistent with 2, which is the value expected for optically thin gas [51]. We independently fit the Na I D doublet, which is unresolved, using two Gaussians with the same width and velocity offset, and fixing their equivalent width ratio to 2, the value appropriate for optically thin gas. We verified that the results do not change in a substantial way when leaving the doublet ratio free.
The observed line profiles do not warrant the modeling of multiple kinematic components; however, we consider the possibility that the observed absorption consists of the sum of a blueshifted and a systemic component. For example, this could be the case if our model underestimates the stellar absorption. We use the Alf stellar population synthesis code [52, 53] to assess how the observed absorption lines vary when changing the abundance of individual elements in the stellar populations. We conclude that this effect is negligible: for a Na abundance that is twice the solar value, the extra absorption in Na I D would be only 8% of the equivalent width we observe in COSMOS-11142. A systemic component could also arise from neutral gas that is in the galaxy and not in the outflow. We find this unlikely because of the increased importance of the molecular phase, at the expense of the neutral phase, for the gas reservoir of galaxies at high redshift [54]; and also based on a study of Na I D absorption in the Blue Jay survey, where neutral gas is mostly associated with outflows and not with the gas reservoir, even in star-forming galaxies (Davies et al., in preparation). Nonetheless, we repeat the fit for Ca II K, which is well detected and not blended, adding a Gaussian component fixed at systemic velocity. In this case we find that the equivalent width of the blueshifted component would be reduced by %.
Similarly to what was done for the absorption lines, we fit Gaussian profiles to all the detected emission lines, which are shown in Figure 2 and Figure 7. Given the additive nature of the emission, here we consider the difference between the observed spectrum and the stellar model. We fit each isolated line independently, assuming a single Gaussian profile. For the unresolved [O II] doublet we assume two Gaussian profiles with same width and velocity offset and a fixed ratio of 1:1, which is in the middle of the allowed range. We use the same model also to fit the unresolved [S II] doublet, but due to the lower signal-to-noise ratio we also need to fix the velocity dispersion, adopting the value measured for [O II] (given the similar ionization energy). The [N II] doublet and line are also blended, and we need to model all three lines simultaneously. In this case we find that in order to correctly reproduce the observed profile, the line must be slightly blueshifted compared to the [N II] lines; a possible interpretation for this is that mostly comes from the outflow while [N II] originates in the galaxy. We thus fix the velocity offset and dispersion of to the values measured for , letting free the [N II] kinematics, and fixing the [N II] doublet ratio to the theoretical value of 3:1. The resulting line width for [N II] is relatively high, suggesting the presence of a broad component. We test a different model with a broad and a narrow component for each emission line, finding qualitatively similar results. We do not use the results of this more complex model for consistency with the other emission lines, most of which have a signal-to-noise ratio that is too low to perform a decomposition into broad and narrow components.
Star Formation Rate
The star formation rate of COSMOS-11142 is a key physical quantity, since it is used both to confirm the quiescent nature of the system and as a comparison to the mass outflow rate. We employ several methods to estimate the star formation rate, obtaining consistent results. The Prospector fit gives a star formation rate of /yr in the youngest bin (0-30 Myr), with an uncertainty of a factor of 3; considering the average star formation over the last 100 Myr we obtain an upper limit of /yr. An alternative, independent method relies on the hydrogen recombination emission lines; because of the contribution from the outflow to the observed flux, this method can only yield an upper limit on the star formation rate. We first correct the measured emission line fluxes for dust attenuation using the result of the Prospector fitting (including the extra attenuation towards young stars); we then use the standard conversion [55] applied to the measured flux, obtaining an upper limit of /yr. A similar upper limit is obtained using the observed flux. It is possible that this method misses heavily dust-obscured regions hosting a starburst, as it is sometimes found in local post-starburst galaxies [56]. We check for this possibility by using redder hydrogen emission lines, which can be used to probe deeper into the dust: while we do not detect any of the Paschen lines in emission, we can place a 3- upper limit to the Pa flux of erg s-1 cm-2, yielding an upper limit on the star formation of 28 /yr. The absence of substantial star formation in dust-obscured regions is also confirmed by the lack of strong mid-infrared emission. COSMOS-11142 is not detected in the Spitzer 24-µm observations from the S-COSMOS survey [57], yielding a 3- upper limit of 38 /yr, according to the measurements and assumptions detailed in [58]. However this estimate assumes that dust is heated exclusively by young stars – a bias known to lead to an overestimate of the star formation rate for quiescent galaxies, in which most of the heating is due to older stars [59]. The more sensitive JWST/MIRI observations detect the galaxy at 18 µm, and the measured flux is fully consistent with the best-fit Prospector model, as shown in Figure 5, thus confirming the lack of substantial star formation hidden by dust.
Ionized Outflow
We detect clear signs of ionized outflow as blueshifted emission in [O III], [Ne III], and , and as a broad emission in [S III]. We can independently estimate the outflow properties using each of these emission lines. For a generic element , the outflow mass can be written as a function of the observed line luminosity [16, 17]:
| (1) |
where is the proton mass, is the electron density, [X/H] is the logarithmic elemental abundance in the gas relative to the solar value (which we take from ref. [60]), and is the line emissivity. In this relation we neglect a factor , and we assume that all the atoms of the element are found in the ionization stage responsible for the observed line (this is consistent with the observation of strong [O III] emission in the outflow but nearly absent [O II]; the other outflow-tracing emission lines have comparable excitation energy). We calculate the emissivity for each line using pyNeb [61] with standard assumptions (density 500 cm-3 and temperature K). We further assume that the gas in the outflow has solar metallicity, given the high stellar mass of the galaxy and the result of the Prospector fit. The electron density cannot be reliably derived from the flux ratio of the poorly resolved [S II] and [O II] doublets. We make the standard assumption of cm-3 [17], however we note that this value is highly uncertain. Since local studies using different methods find a wide range of values, [62], we assign a systematic uncertainty of 0.7 dex (a factor of 5 in each direction) to the assumed value of . For the blueshifted lines we multiply the observed luminosity by two to account for the receding side hidden by dust. The resulting outflow masses are listed in Table 2 (see also Figure 3) and are in agreement with each other to better than 30%. This is remarkable given that the mass derived from does not depend on assumptions on the ionization stage and the gas metallicity. However, all four lines depend in the same way on . The uncertainty on the outflow mass measurement is therefore dominated by the assumed .
| ( km/s) | ( ) | (/yr) | |
| Neutral outflow | |||
| Na I D | 488 | 97 | |
| Ca II K | |||
| Ionized outflow | |||
| [Ne III] | 0.53 | 1.44 | 0.26 |
| H | 0.85 | 2.25 | 0.66 |
| [O III] | 1.70 | 1.98 | 1.15 |
| [S III] | 1.24 | 2.46 | 1.04 |
| \botrule |
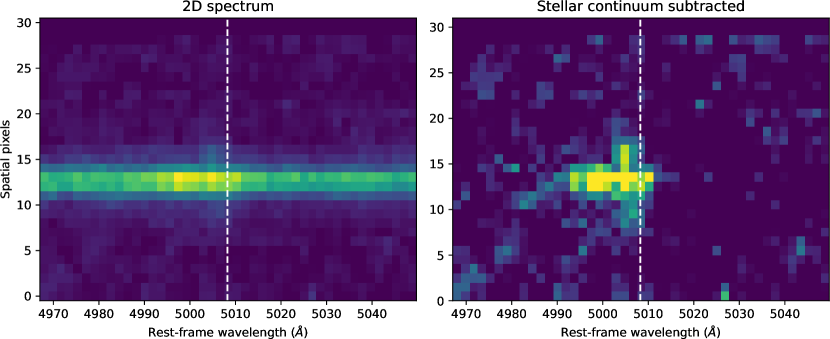
In order to calculate the mass outflow rate we assume that the ionized gas is distributed, on each side of the outflow, in a mass-conserving cone that is expanding with velocity , independent of radius [14]. In this case the mass outflow rate can be easily derived to be . We estimate the outflow velocity from the Gaussian fit as , and analyze the 2-D NIRSpec spectrum around the location of the [O III] line to constrain the outflow size. We first construct the spatial profile by taking the median flux along each spatial pixel row; then we subtract this profile, representing the stellar continuum, from the data, revealing a clearly resolved [O III] line (see Figure 8). The emission line morphology is complex, and includes two components extending several pixels in the spatial directions. Both components are blueshifted, and are therefore not associated with a large-scale rotating disk. We measure the extent of each of these components to be approximately 4 spatial pixels, i.e. , corresponding to kpc. This allows us to derive ionized outflow masses, which are in the range 0.3 – 1.2 /yr.
Neutral Outflow
We use the measured properties of the Na I D and Ca II K lines to constrain the properties of the neutral outflow. The first step is to derive the Na I and Ca II column density from the observed equivalent widths (listed in Table 1), which can be done easily in the optically thin case [51], yielding cm-2 and cm-2. These should be considered lower limits, as even small deviations from the optically thin case can substantially increase the column density corresponding to the observed equivalent width. If the outflow is clumpy, and its covering fraction is less than unity, then the true equivalent width would be larger than the observed one. In our case, the observed maximum depth of the absorption lines implies that the covering fraction must be larger than 50%. The column density may then be up to a factor of two larger than the value we derive. Unless one can constrain the Ca II or Na I doublet ratio [63], it is only possible to measure the product of the covering fraction and the column density. However, the mass outflow rate only depends on this product, thus making this decomposition unimportant for our analysis. For simplicity, here we assume a covering fraction of unity.
The next step consists in inferring the hydrogen column density. For Na I we can write [63, 19]:
| (2) |
where is the sodium ionization fraction, and represents the depletion of sodium onto dust. For consistency with local studies we make the standard assumption [63], meaning that only 10% of the sodium is in the neutral phase; it is likely that the true value is even lower [19], which would increase the derived column density and therefore the outflow mass. We also assume solar metallicity for the gas, and take the canonical values [64] for solar abundance, , and dust depletion, . We obtain a hydrogen column density cm-2. The systematic uncertainty on this result is dominated by the observed scatter in the dust depletion value, which is 0.5 dex [65].
The calcium column density is more difficult to interpret because calcium, unlike sodium, presents a highly variable depletion onto dust as a function of the environment [66, 67]. Observations of Milky Way clouds show very high dust depletion (up to 4 dex) for calcium at the high column density that we measure, which would imply a hydrogen column density that is higher than what measured from Na I D. This discrepancy is probably caused by the presence of shocks in the outflow, which can destroy dust grains and decrease the depletion of calcium. Thus, we can only derive a lower limit on the hydrogen column density by assuming that calcium is not depleted at all, and we obtain cm-2. We have neglected the ionization correction since most of the calcium in the neutral gas is expected to be in the form of Ca II [68].
In order to derive the outflow mass we assume that the neutral gas forms an expanding shell outside the ionized outflow. This is consistent with local observations [19] and with the idea that the neutral gas must be further out from the ionizing source. For a shell geometry, the outflow mass and mass rate are [14]:
| (3) |
| (4) |
where is the solid angle subtended by the outflow. Based on the results of local studies [14] and on the incidence of neutral outflows in the Blue Jay sample (Davies et al., in preparation), we assume an opening angle of 40% of the solid sphere, i.e. . We consider the systematic uncertainty on to be a factor of 2.5 in each direction, ranging from a narrow opening to a spherical and homogeneous outflow. Combined with the uncertainty on the calcium dust depletion, this gives a total uncertainty on the outflow mass of dex, similar to that on the ionized outflow mass (but due to a different set of assumptions).
The neutral mass outflow rate estimated from the Na I D line is 97 /yr, about two orders of magnitude larger than what measured for the ionized phase. In addition to the 0.7 dex uncertainty due to the opening angle and the dust depletion, there are two additional assumptions that could influence this result. First, we ignored a possible contribution to Na I D from a systemic component of neutral gas not associated with the outflow, which would decrease the measured column density by 41% (adopting the value derived for Ca II K). Second, we assumed that the radius of the neutral outflow coincides with that of the ionized outflow; in principle, the neutral outflow radius could be as small as the galaxy effective radius, which is 0.6 kpc (it cannot be smaller than this because the observed depth of the gas absorption reaches of the stellar continuum, meaning that the neutral gas must be in front of at least 50% of the stars in the galaxy). If we make the most conservative choice on the systemic component of Na I D and on the outflow radius we obtain a mass outflow rate for the neutral phase that is 8.5 times lower compared to our default assumptions, i.e., /yr. This is still one order of magnitude larger than the ionized mass outflow rate.
Physical Nature of the Outflow and Properties of the AGN
Due to the low star formation rate of COSMOS-11142, it is unlikely that the outflow is driven by star formation activity. We can also rule out a star-formation driven fossil outflow: the travel time to reach a distance of kpc at the observed velocity is less than 10 Myr, which is much smaller than the time elapsed since the starburst phase, according to the inferred star formation history. Moreover, the ionized gas velocity we measure is substantially higher than what observed in the most powerful star-formation driven outflows at [72]. Another possibility could be that the outflowing material actually consists of tidally ejected gas due to a major merger [73, 74]. However, the lack of tidal features or asymmetries in the near-infrared imaging, together with the high velocity of the ionized gas, rule out this scenario.
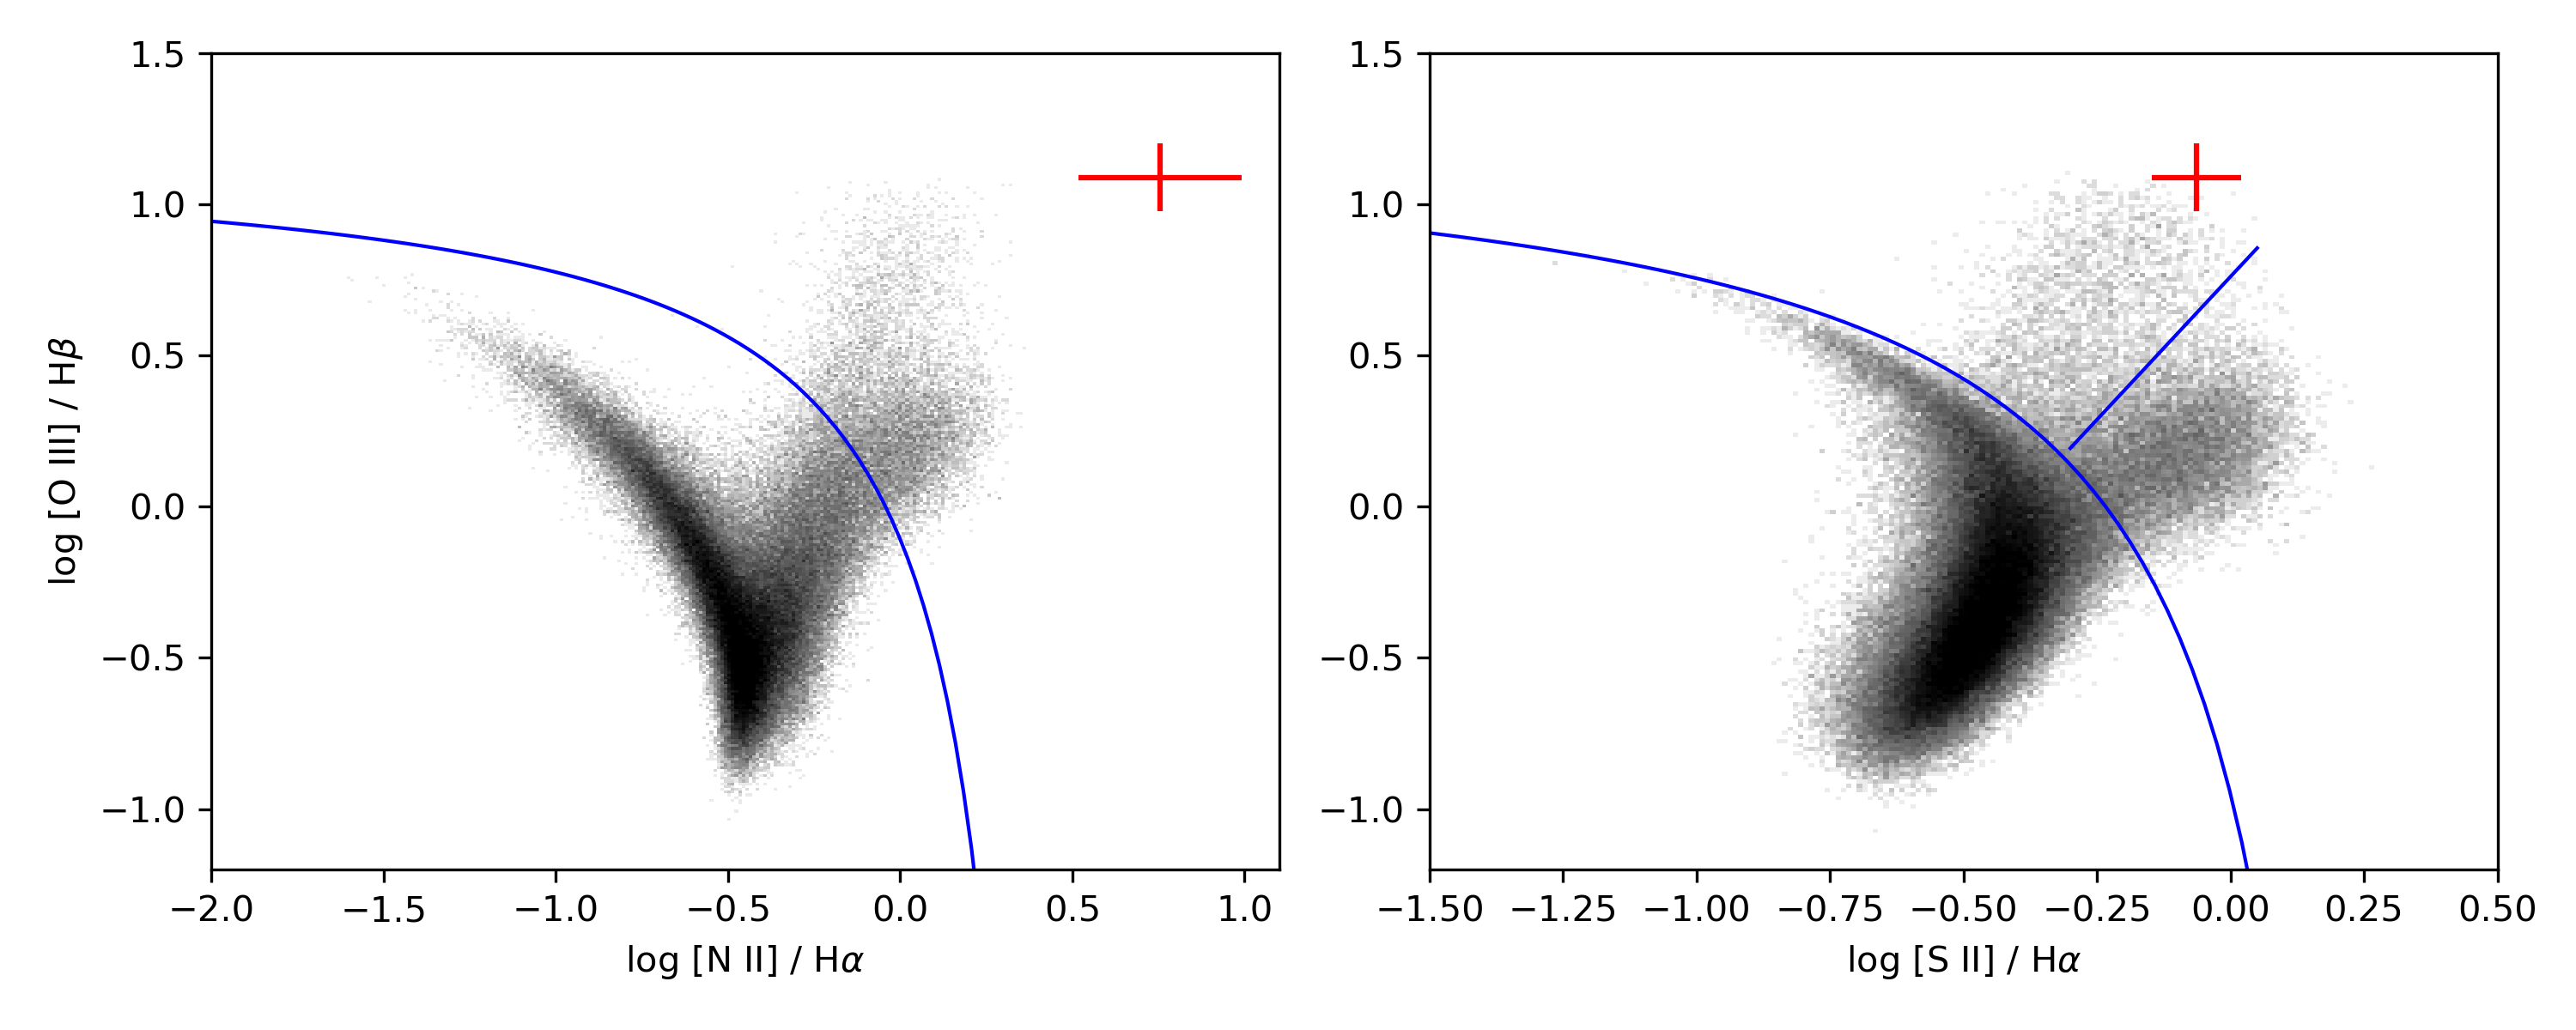
The only reasonable explanation is therefore that the observed outflow is driven by AGN feedback. This is confirmed by the emission line flux ratios, which we compare to those of the local galaxy population [69] in Figure 9. COSMOS-11142 occupies a region on these Baldwin-Phillips-Terlevich (BPT) diagrams [15] which is exclusively populated by AGN systems. We note that some of the measured emission lines (notably [O III] and ) trace the outflow rather than the galaxy, which may complicate the interpretation of the position on the BPT diagram. Nonetheless, the line ratios measured in COSMOS-11142 are fully consistent with those measured in the outflows of high-redshift quasars [25, 75].
Despite the rather extreme line ratios, the AGN activity in 11142 is relatively weak, leaving no trace other than the ionized gas emission lines. We do not detect AGN emission in the UV-to-IR broadband photometry (which is well fit by a model without AGN contribution), in the mid-infrared IRAC colors (using the criterion proposed by ref. [76]), in the rest-frame optical morphology (no evidence for a point source in the NIRCam imaging), in X-ray observations [77], or in radio observations [78]. We estimate the bolometric luminosity of the AGN from the [O III] luminosity [79], obtaining ; this is however an upper limit since part of the observed line luminosity may come from shock excitation. The actual bolometric luminosity may be an order of magnitude lower; in this case our measured mass outflow rates for the ionized and neutral phase would not be substantially off from the known AGN scaling relations [10], assuming that the neutral phase is comparable to the molecular phase. What sets COSMOS-11142 apart from known systems, however, is its gas-poor and quiescent nature.
Acknowledgments
We acknowledge discussions with Marcella Brusa, Karl Glazebrook, Shri Kulkarni, Luca Ciotti, and Andrea Ferrara. SB is supported by the the ERC Starting Grant “Red Cardinal”, GA 101076080. RD is supported by the Australian Research Council Centre of Excellence for All Sky Astrophysics in 3 Dimensions (ASTRO 3D), through project number CE170100013. RE acknowledges the support from grant numbers 21-atp21-0077, NSF AST-1816420, and HST-GO-16173.001-A as well as the Institute for Theory and Computation at the Center for Astrophysics. RW acknowledges funding of a Leibniz Junior Research Group (project number J131/2022)
This work is based on observations made with the NASA/ESA/CSA James Webb Space Telescope. The data were obtained from the Mikulski Archive for Space Telescopes at the Space Telescope Science Institute, which is operated by the Association of Universities for Research in Astronomy, Inc., under NASA contract NAS 5-03127 for JWST. These observations are associated with program GO 1810. This work also makes use of observations taken by the 3D-HST Treasury Program (GO 12177 and 12328) with the NASA/ESA HST, which is operated by the Association of Universities for Research in Astronomy, Inc., under NASA contract NAS5-26555.
References
- \bibcommenthead
- [1] Wild, V. et al. The evolution of post-starburst galaxies from z=2 to 0.5. MNRAS 463, 832–844 (2016).
- [2] Belli, S., Newman, A. B. & Ellis, R. S. MOSFIRE Spectroscopy of Quiescent Galaxies at 1.5 < z < 2.5. II. Star Formation Histories and Galaxy Quenching. ApJ 874, 17 (2019).
- [3] Park, M. et al. Rapid Quenching of Galaxies at Cosmic Noon. arXiv e-prints arXiv:2210.03747 (2022).
- [4] Di Matteo, T., Springel, V. & Hernquist, L. Energy input from quasars regulates the growth and activity of black holes and their host galaxies. Nature 433, 604–607 (2005).
- [5] Bower, R. G. et al. Breaking the hierarchy of galaxy formation. MNRAS 370, 645–655 (2006).
- [6] Croton, D. J. et al. The many lives of active galactic nuclei: cooling flows, black holes and the luminosities and colours of galaxies. MNRAS 365, 11–28 (2006).
- [7] Förster Schreiber, N. M. et al. The KMOS3D Survey: Demographics and Properties of Galactic Outflows at z = 0.6-2.7. ApJ 875, 21 (2019).
- [8] Lamperti, I. et al. SUPER. V. ALMA continuum observations of z 2 AGN and the elusive evidence of outflows influencing star formation. A&A 654, A90 (2021).
- [9] Concas, A. et al. Being KLEVER at cosmic noon: Ionized gas outflows are inconspicuous in low-mass star-forming galaxies but prominent in massive AGN hosts. MNRAS 513, 2535–2562 (2022).
- [10] Fiore, F. et al. AGN wind scaling relations and the co-evolution of black holes and galaxies. A&A 601, A143 (2017).
- [11] Veilleux, S., Maiolino, R., Bolatto, A. D. & Aalto, S. Cool outflows in galaxies and their implications. A&A Rev. 28, 2 (2020).
- [12] Vayner, A. et al. Multiphase Outflows in High-redshift Quasar Host Galaxies. ApJ 923, 59 (2021).
- [13] Williams, R. J., Quadri, R. F., Franx, M., van Dokkum, P. & Labbé, I. Detection of Quiescent Galaxies in a Bicolor Sequence from Z = 0-2. ApJ 691, 1879–1895 (2009).
- [14] Rupke, D. S., Veilleux, S. & Sanders, D. B. Outflows in Infrared-Luminous Starbursts at z < 0.5. II. Analysis and Discussion. ApJS 160, 115–148 (2005).
- [15] Baldwin, J. A., Phillips, M. M. & Terlevich, R. Classification parameters for the emission-line spectra of extragalactic objects. PASP 93, 5–19 (1981).
- [16] Soto, K. T., Martin, C. L., Prescott, M. K. M. & Armus, L. The Emission-line Spectra of Major Mergers: Evidence for Shocked Outflows. ApJ 757, 86 (2012).
- [17] Carniani, S. et al. Ionised outflows in z ~2.4 quasar host galaxies. A&A 580, A102 (2015).
- [18] Roberts-Borsani, G. W. Observational constraints on the multiphase nature of outflows using large spectroscopic surveys at z 0. MNRAS 494, 4266–4278 (2020).
- [19] Baron, D., Netzer, H., Davies, R. I. & Xavier Prochaska, J. Multiphase outflows in post-starburst E+A galaxies - II. A direct connection between the neutral and ionized outflow phases. MNRAS 494, 5396–5420 (2020).
- [20] Fluetsch, A. et al. Properties of the multiphase outflows in local (ultra)luminous infrared galaxies. MNRAS 505, 5753–5783 (2021).
- [21] Baron, D., Netzer, H., Lutz, D., Prochaska, J. X. & Davies, R. I. Multiphase outflows in post-starburst E+A galaxies - I. General sample properties and the prevalence of obscured starbursts. MNRAS 509, 4457–4479 (2022).
- [22] Avery, C. R. et al. Cool outflows in MaNGA: a systematic study and comparison to the warm phase. MNRAS 511, 4223–4237 (2022).
- [23] Concas, A., Popesso, P., Brusa, M., Mainieri, V. & Thomas, D. Two-face(s): ionized and neutral gas winds in the local Universe. A&A 622, A188 (2019).
- [24] Roberts-Borsani, G. W. & Saintonge, A. The prevalence and properties of cold gas inflows and outflows around galaxies in the local Universe. MNRAS 482, 4111–4145 (2019).
- [25] Perna, M. et al. Galaxy-wide outflows in z ~1.5 luminous obscured quasars revealed through near-IR slit-resolved spectroscopy. A&A 574, A82 (2015).
- [26] Cresci, G. et al. Bubbles and outflows: The novel JWST/NIRSpec view of the z = 1.59 obscured quasar XID2028. A&A 672, A128 (2023).
- [27] Carnall, A. C. et al. A massive quiescent galaxy at redshift 4.658. arXiv e-prints arXiv:2301.11413 (2023).
- [28] Popesso, P. et al. The main sequence of star-forming galaxies across cosmic times. MNRAS 519, 1526–1544 (2023).
- [29] Fumagalli, M. et al. How Dead are Dead Galaxies? Mid-infrared Fluxes of Quiescent Galaxies at Redshift 0.3 < z < 2.5: Implications for Star Formation Rates and Dust Heating. ApJ 796, 35 (2014).
- [30] Belli, S. et al. KMOS3D Reveals Low-level Star Formation Activity in Massive Quiescent Galaxies at 0.7 < z < 2.7. ApJ 841, L6 (2017).
- [31] Harrison, C. M. Impact of supermassive black hole growth on star formation. Nature Astronomy 1, 0165 (2017).
- [32] Ward, S. R., Harrison, C. M., Costa, T. & Mainieri, V. Cosmological simulations predict that AGN preferentially live in gas-rich, star-forming galaxies despite effective feedback. MNRAS 514, 2936–2957 (2022).
- [33] Genzel, R. et al. Evidence for Wide-spread Active Galactic Nucleus-driven Outflows in the Most Massive z ~1-2 Star-forming Galaxies. ApJ 796, 7 (2014).
- [34] Tremonti, C. A., Moustakas, J. & Diamond-Stanic, A. M. The Discovery of 1000 km s-1 Outflows in Massive Poststarburst Galaxies at z=0.6. ApJ 663, L77–L80 (2007).
- [35] Maltby, D. T. et al. High-velocity outflows in massive post-starburst galaxies at z > 1. MNRAS 489, 1139–1151 (2019).
- [36] Skelton, R. E. et al. 3D-HST WFC3-selected Photometric Catalogs in the Five CANDELS/3D-HST Fields: Photometry, Photometric Redshifts, and Stellar Masses. ApJS 214, 24 (2014).
- [37] Perrin, M. D. et al. Oschmann, J., Jacobus M., Clampin, M., Fazio, G. G. & MacEwen, H. A. (eds) Updated point spread function simulations for JWST with WebbPSF. (eds Oschmann, J., Jacobus M., Clampin, M., Fazio, G. G. & MacEwen, H. A.) Space Telescopes and Instrumentation 2014: Optical, Infrared, and Millimeter Wave, Vol. 9143 of Society of Photo-Optical Instrumentation Engineers (SPIE) Conference Series, 91433X (2014).
- [38] Johnson, B. D., Leja, J., Conroy, C. & Speagle, J. S. Stellar Population Inference with Prospector. ApJS 254, 22 (2021).
- [39] Tacchella, S. et al. Fast, Slow, Early, Late: Quenching Massive Galaxies at z 0.8. ApJ 926, 134 (2022).
- [40] Conroy, C., Gunn, J. E. & White, M. The Propagation of Uncertainties in Stellar Population Synthesis Modeling. I. The Relevance of Uncertain Aspects of Stellar Evolution and the Initial Mass Function to the Derived Physical Properties of Galaxies. ApJ 699, 486–506 (2009).
- [41] Conroy, C. & Gunn, J. E. The Propagation of Uncertainties in Stellar Population Synthesis Modeling. III. Model Calibration, Comparison, and Evaluation. ApJ 712, 833–857 (2010).
- [42] Choi, J. et al. Mesa Isochrones and Stellar Tracks (MIST). I. Solar-scaled Models. ApJ 823, 102 (2016).
- [43] Cargile, P. A. et al. MINESweeper: Spectrophotometric Modeling of Stars in the Gaia Era. ApJ 900, 28 (2020).
- [44] Chabrier, G. Galactic Stellar and Substellar Initial Mass Function. PASP 115, 763–795 (2003).
- [45] Leja, J., Carnall, A. C., Johnson, B. D., Conroy, C. & Speagle, J. S. How to Measure Galaxy Star Formation Histories. II. Nonparametric Models. ApJ 876, 3 (2019).
- [46] Charlot, S. & Fall, S. M. A Simple Model for the Absorption of Starlight by Dust in Galaxies. ApJ 539, 718–731 (2000).
- [47] Kriek, M. & Conroy, C. The Dust Attenuation Law in Distant Galaxies: Evidence for Variation with Spectral Type. ApJ 775, L16 (2013).
- [48] Draine, B. T. & Li, A. Infrared Emission from Interstellar Dust. IV. The Silicate-Graphite-PAH Model in the Post-Spitzer Era. ApJ 657, 810–837 (2007).
- [49] Speagle, J. S. DYNESTY: a dynamic nested sampling package for estimating Bayesian posteriors and evidences. MNRAS 493, 3132–3158 (2020).
- [50] Cappellari, M. et al. The SAURON project - IV. The mass-to-light ratio, the virial mass estimator and the Fundamental Plane of elliptical and lenticular galaxies. MNRAS 366, 1126–1150 (2006).
- [51] Draine, B. T. Physics of the Interstellar and Intergalactic Medium (2011).
- [52] Conroy, C. & van Dokkum, P. Counting Low-mass Stars in Integrated Light. ApJ 747, 69 (2012).
- [53] Conroy, C., Villaume, A., van Dokkum, P. G. & Lind, K. Metal-rich, Metal-poor: Updated Stellar Population Models for Old Stellar Systems. ApJ 854, 139 (2018).
- [54] Péroux, C. & Howk, J. C. The Cosmic Baryon and Metal Cycles. ARA&A 58, 363–406 (2020).
- [55] Kennicutt, J., Robert C. Star Formation in Galaxies Along the Hubble Sequence. ARA&A 36, 189–232 (1998).
- [56] Poggianti, B. M. & Wu, H. Optical Spectral Signatures of Dusty Starburst Galaxies. ApJ 529, 157–169 (2000).
- [57] Sanders, D. B. et al. S-COSMOS: The Spitzer Legacy Survey of the Hubble Space Telescope ACS 2 deg2 COSMOS Field I: Survey Strategy and First Analysis. ApJS 172, 86–98 (2007).
- [58] Whitaker, K. E. et al. Constraining the Low-mass Slope of the Star Formation Sequence at 0.5 < z < 2.5. ApJ 795, 104 (2014).
- [59] Leja, J. et al. An Older, More Quiescent Universe from Panchromatic SED Fitting of the 3D-HST Survey. ApJ 877, 140 (2019).
- [60] Asplund, M., Amarsi, A. M. & Grevesse, N. The chemical make-up of the Sun: A 2020 vision. A&A 653, A141 (2021).
- [61] Luridiana, V., Morisset, C. & Shaw, R. A. PyNeb: a new tool for analyzing emission lines. I. Code description and validation of results. A&A 573, A42 (2015).
- [62] Davies, R. et al. Ionized outflows in local luminous AGN: what are the real densities and outflow rates? MNRAS 498, 4150–4177 (2020).
- [63] Rupke, D. S., Veilleux, S. & Sanders, D. B. Outflows in Infrared-Luminous Starbursts at z < 0.5. I. Sample, Na I D Spectra, and Profile Fitting. ApJS 160, 87–114 (2005).
- [64] Savage, B. D. & Sembach, K. R. Interstellar Abundances from Absorption-Line Observations with the Hubble Space Telescope. ARA&A 34, 279–330 (1996).
- [65] Wakker, B. P. & Mathis, J. S. Dependence of Gas-Phase Abundances in the Interstellar Medium on Column Density. ApJ 544, L107–L110 (2000).
- [66] Hobbs, L. M. A comparison of interstellar Na I, Ca II, and K I absorption. ApJ 191, 381–393 (1974).
- [67] Phillips, A. P., Pettini, M. & Gondhalekar, P. M. Element depletions in interstellar gas - II. The density-dependence of calcium and sodium depletions. MNRAS 206, 337–350 (1984).
- [68] Field, G. B. Interstellar abundances: gas and dust. ApJ 187, 453–459 (1974).
- [69] Tremonti, C. A. et al. The Origin of the Mass-Metallicity Relation: Insights from 53,000 Star-forming Galaxies in the Sloan Digital Sky Survey. ApJ 613, 898–913 (2004).
- [70] Kewley, L. J., Dopita, M. A., Sutherland, R. S., Heisler, C. A. & Trevena, J. Theoretical Modeling of Starburst Galaxies. ApJ 556, 121–140 (2001).
- [71] Kewley, L. J., Groves, B., Kauffmann, G. & Heckman, T. The host galaxies and classification of active galactic nuclei. MNRAS 372, 961–976 (2006).
- [72] Davies, R. L. et al. Kiloparsec Scale Properties of Star Formation Driven Outflows at z 2.3 in the SINS/zC-SINF AO Survey. ApJ 873, 122 (2019).
- [73] Puglisi, A. et al. A titanic interstellar medium ejection from a massive starburst galaxy at redshift 1.4. Nature Astronomy 5, 319–330 (2021).
- [74] Spilker, J. S. et al. Star Formation Suppression by Tidal Removal of Cold Molecular Gas from an Intermediate-redshift Massive Post-starburst Galaxy. ApJ 936, L11 (2022).
- [75] Brusa, M. et al. A fast ionised wind in a star-forming quasar system at z ~1.5 resolved through adaptive optics assisted near-infrared data. A&A 588, A58 (2016).
- [76] Donley, J. L. et al. Identifying Luminous Active Galactic Nuclei in Deep Surveys: Revised IRAC Selection Criteria. ApJ 748, 142 (2012).
- [77] Elvis, M. et al. The Chandra COSMOS Survey. I. Overview and Point Source Catalog. ApJS 184, 158–171 (2009).
- [78] Schinnerer, E. et al. The VLA-COSMOS Survey. II. Source Catalog of the Large Project. ApJS 172, 46–69 (2007).
- [79] Heckman, T. M. et al. Present-Day Growth of Black Holes and Bulges: The Sloan Digital Sky Survey Perspective. ApJ 613, 109–118 (2004).