Unlocking the Diagnostic Potential of ECG through Knowledge Transfer from Cardiac MRI
Abstract
The electrocardiogram (ECG) is a widely available diagnostic tool that allows for a cost-effective and fast assessment of the cardiovascular health. However, more detailed examination with expensive cardiac magnetic resonance (CMR) imaging is often preferred for the diagnosis of cardiovascular diseases. While providing detailed visualization of the cardiac anatomy, CMR imaging is not widely available due to long scan times and high costs. To address this issue, we propose the first self-supervised contrastive approach that transfers domain-specific information from CMR images to ECG embeddings. Our approach combines multimodal contrastive learning with masked data modeling to enable holistic cardiac screening solely from ECG data. In extensive experiments using data from 40,044 UK Biobank subjects, we demonstrate the utility and generalizability of our method. We predict the subject-specific risk of various cardiovascular diseases and determine distinct cardiac phenotypes solely from ECG data. In a qualitative analysis, we demonstrate that our learned ECG embeddings incorporate information from CMR image regions of interest. We make our entire pipeline publicly available, including the source code and pre-trained model weights.
ECG, cardiac MRI, multimodal contrastive learning, masked data modeling, self-supervised learning.
1 Introduction
The standard -lead electrocardiogram (ECG) is a fast and widely available clinical tool due to its ease of use and cost-effectiveness. This non-invasive method is used by cardiologists to assess the heart’s electrical activity. The ECG serves as a valuable diagnostic aid, as it can reveal characteristic signatures associated with cardiac disorders, including atrial fibrillation and left ventricular systolic dysfunction [1].
Cardiac magnetic resonance (CMR) imaging, on the other hand, provides high-resolution, volumetric images for a precise assessment of the cardiac morphology. Using CMR imaging thus allows for accurate prediction of important cardiac phenotypes, such as left ventricular volumes and ejection fraction that can be used to assess heart failure [2]. As a result, CMR imaging serves as the gold-standard for evidence-based diagnosis of various cardiovascular diseases [3]. However, the application of this diagnostic modality is limited due to long scan times, high associated costs, and the necessity for trained personnel [4].
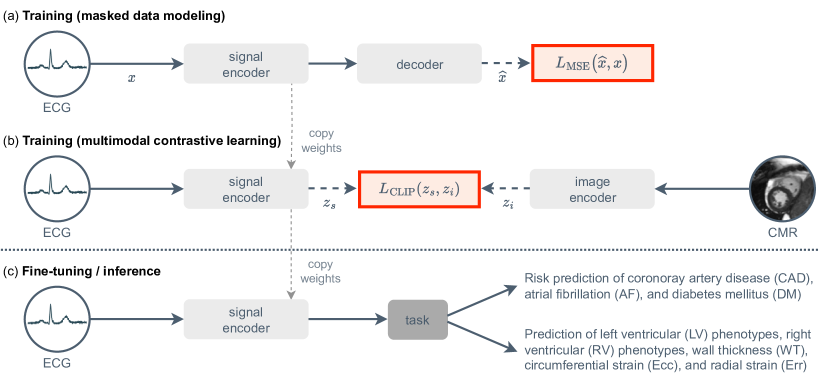
In this study, we introduce a new contrastive learning strategy that processes large amounts of unlabeled, multimodal biobank data in a self-supervised fashion. Initially, we pre-train unimodal encoders on paired ECG data and CMR images. Afterwards, the trained signal encoder is able to predict various cardiac conditions and phenotypes using ECG data only. A graphical representation of our approach can be found in Figure 1.
Through the knowledge transfer from CMR images to ECG embeddings, we are able to reduce the dependency on costly CMR imaging and unlock the diagnostic potential of ECG for affordable care for patients with cardiovascular conditions. To this end, our key contributions are as follows:
-
1.
We propose the first self-supervised contrastive approach that utilizes -lead ECG and CMR images. We combine multimodal contrastive learning with masked data modeling to transfer information from CMR images to ECG embeddings.
-
2.
In extensive benchmarking experiments using subjects from the UK Biobank [5], we show that our learned ECG embeddings generalize across various downstream tasks. After fine-tuning, they can be used to predict risks of various cardiovascular diseases and determine distinct cardiac phenotypes. Our method outperforms state-of-the-art self-supervised and supervised baselines, which use either ECG, CMR imaging, or tabular data for their predictions.
-
3.
We quantitatively demonstrate the outsized importance of masked data modeling in the knowledge transfer process with extensive ablation studies. Further, we qualitatively show the knowledge transfer from CMR images to ECG embeddings using latent vector similarity measures.
-
4.
We publish our entire pipeline as an open source tool, including the pre-trained model weights at https://github.com/oetu/MMCL-ECG-CMR.
2 Related Works
2.1 Deep-Learning-Based Processing of ECG
The application of deep learning to ECG is increasingly becoming popular in cardiovascular medicine [1]. However, most of the previous works investigate supervised approaches to improve classification performance [6, 7, 8], which rely on expensive annotation by medical experts. Beyond supervised learning, unsupervised methods [9, 10] have been proposed to eliminate this data dependency and generate ECG embeddings that can be used for downstream classification tasks. Implementations such as CLOCS [11] have been introduced to tailor contrastive learning to medical time series data, enabling self-supervised representation learning of standard -lead ECG. However, the combination of self-supervised ECG representation learning with guidance from CMR images has not been investigate yet, which we aim to explore in this work. Moreover, most previous works only study the utility of ECG embeddings for classification tasks, whereas we explore their generalizability to diverse tasks including the prediction of distinct cardiac phenotypes.
2.2 Masked Data Modeling
Masked data modeling techniques have proven effective for self-supervised representation learning. Given the objective to recover a random set of masked data points from the set of visible data points, these self-supervised approaches can be referred to as masked autoencoding [12, 13, 14] techniques. Initially introduced for self-supervised pre-training in natural language processing (NLP) [15], masked data modeling has been extended to other modalities such as imaging [16], video [17], and audio [18]. Unlike contrastive learning [19] and most other self-supervised pre-training strategies, masked data modeling approaches do not rely on heavy data augmentation, which is challenging to design for sequential data. Furthermore, they enable learning representations that generalize well to diverse downstream applications [20].
Recent works investigating masked data modeling, such as iGPT [12], ViT [21], BEiT [22], or most recently the masked autoencoder (MAE) [16], are relying on Transformers [23] as backbone architecture and thus follow the example of BERT [15] in NLP. Transformers have shown great success in modeling local and global dependencies, enabling the model to capture relationships even in long sequential data [24]. In the medical domain, Zhang et al. [10] have recently applied the MAE to detect arrhythmia from ECG. We also employ a MAE during the initial step of our framework and further introduce unstructured masking similar to [18] to learn temporally encoded local and global ECG features.
2.3 Multimodal Contrastive Learning
Contrastive learning frameworks such as SimCLR [19], BYOL [25], or BarlowTwins [26] are able to learn rich representations of imaging data. Leveraging a contrastive loss [27], these approaches align augmented views of a sample in the latent space. Motivated by the success in learning unimodal representations, contrastive learning has been recently extended to consider data from multiple modalities. Implementations such as CLIP [28] and ConVIRT [29] align embeddings of paired imaging and text. Other approaches apply contrastive techniques to learn general-purpose representations using two different imaging modalities [30], imaging and tabular data [31], video and text [32, 33], and video and audio [34, 35].
To the best of our knowledge, there is no existing multimodal contrastive learning framework that combines both medical time series and imaging data for general-purpose representation learning. Our work aims to address this by extending multimodal frameworks to incorporate -lead ECG and CMR imaging. In contrast to text, which consists of discrete tokens with high information density, we use time series data with low-level semantic information. In contrast to aligned video and audio, we use ECG and CMR images that are often acquired at different times during the subject’s visit.
3 Methods
In this work, we present a novel self-supervised contrastive approach that incorporates time series and imaging data to train unimodal encoders (see Figure 1). We use masked data modeling (MDM) to train a signal encoder unimodally on large amounts of unlabeled -lead ECG, allowing for learning rich ECG embeddings as described in Section 3.1. After pre-training solely on ECG data, we introduce multi-modal contrastive learning (MMCL) to further pre-train our unimodal signal encoder with information from CMR images as described in Section 3.2. We introduce an interpretability module in Section 3.3 to visually assess the information transfer from CMR images to ECG embeddings. After these pre-training steps, the unimodal signal encoder can be fine-tuned on a limited amount of labeled data to predict the subject-specific risk of cardiovascular diseases and to determine cardiac phenotypes during inference solely from ECG.
3.1 Masked Data Modeling
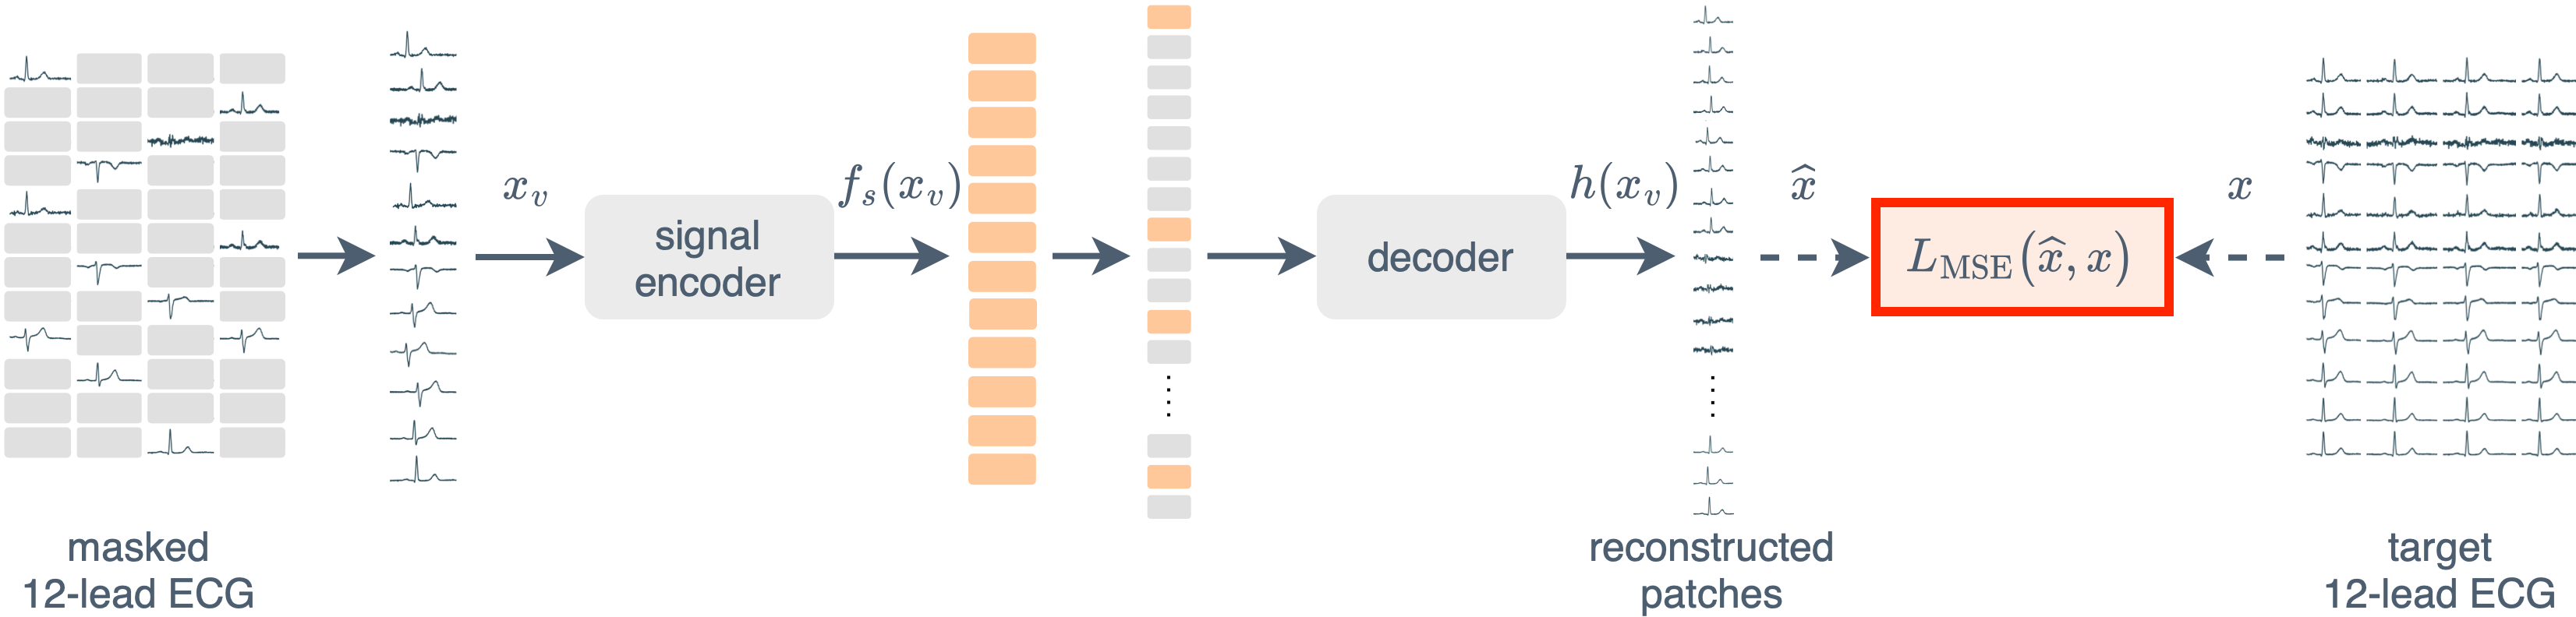
Given the redundancy inherent to standard -lead ECG, we first pre-train our signal encoder unimodally on large amounts of unlabeled ECG data to learn rich embeddings. To this end, we use masked data modeling (MDM) with a high masking ratio . This allows us to eliminate redundancy across signal channels and time without relying on heavy data augmentation, which is difficult to design for time series data. We choose the Transformer [23] as our backbone architecture to capture local and global dependencies in multi-channel ECG. We base our MDM implementation on the MAE [16]. A graphical representation of the method can be found in Figure 2.
We reshape a multi-channel time series , where and denote the number of signal channels and time points, respectively, into a flattened sequence of patches with size such that . Assume a randomly drawn binary mask ( drawn with probability ) that is applied to to obtain a visible view and a complementary masked view , where . Assume two randomly drawn views of , where . Let and be the signal encoder and decoder, respectively, such that the MAE can be represented as , where
| (1) |
We train the MAE by optimizing the mean squared error (MSE) loss, which can be lower bounded by a global alignment loss with respect to the embeddings and , under the assumption that is -bi-Lipschitz [36]:
| (2a) | ||||
| (2b) | ||||
Minimizing the MSE loss (Equation 2a) enforces the encoder to focus on learning local features from the visible view , which are crucial for effectively reconstructing the entire sample . The process of learning features from the visible view that can be generalized to the masked view eliminates redundancy and enables the encoder to generate embeddings with high information density. At the same time, the global alignment loss (Equation 2b) enforces to generate similar embeddings for two different views and of the same sample . Thus, also considers global features of , which can be learned from any visible view. Taken together, optimizing the MSE loss enables learning a signal encoder that considers both local and global features, which is crucial to generate rich embeddings.
3.2 Multimodal Contrastive Learning
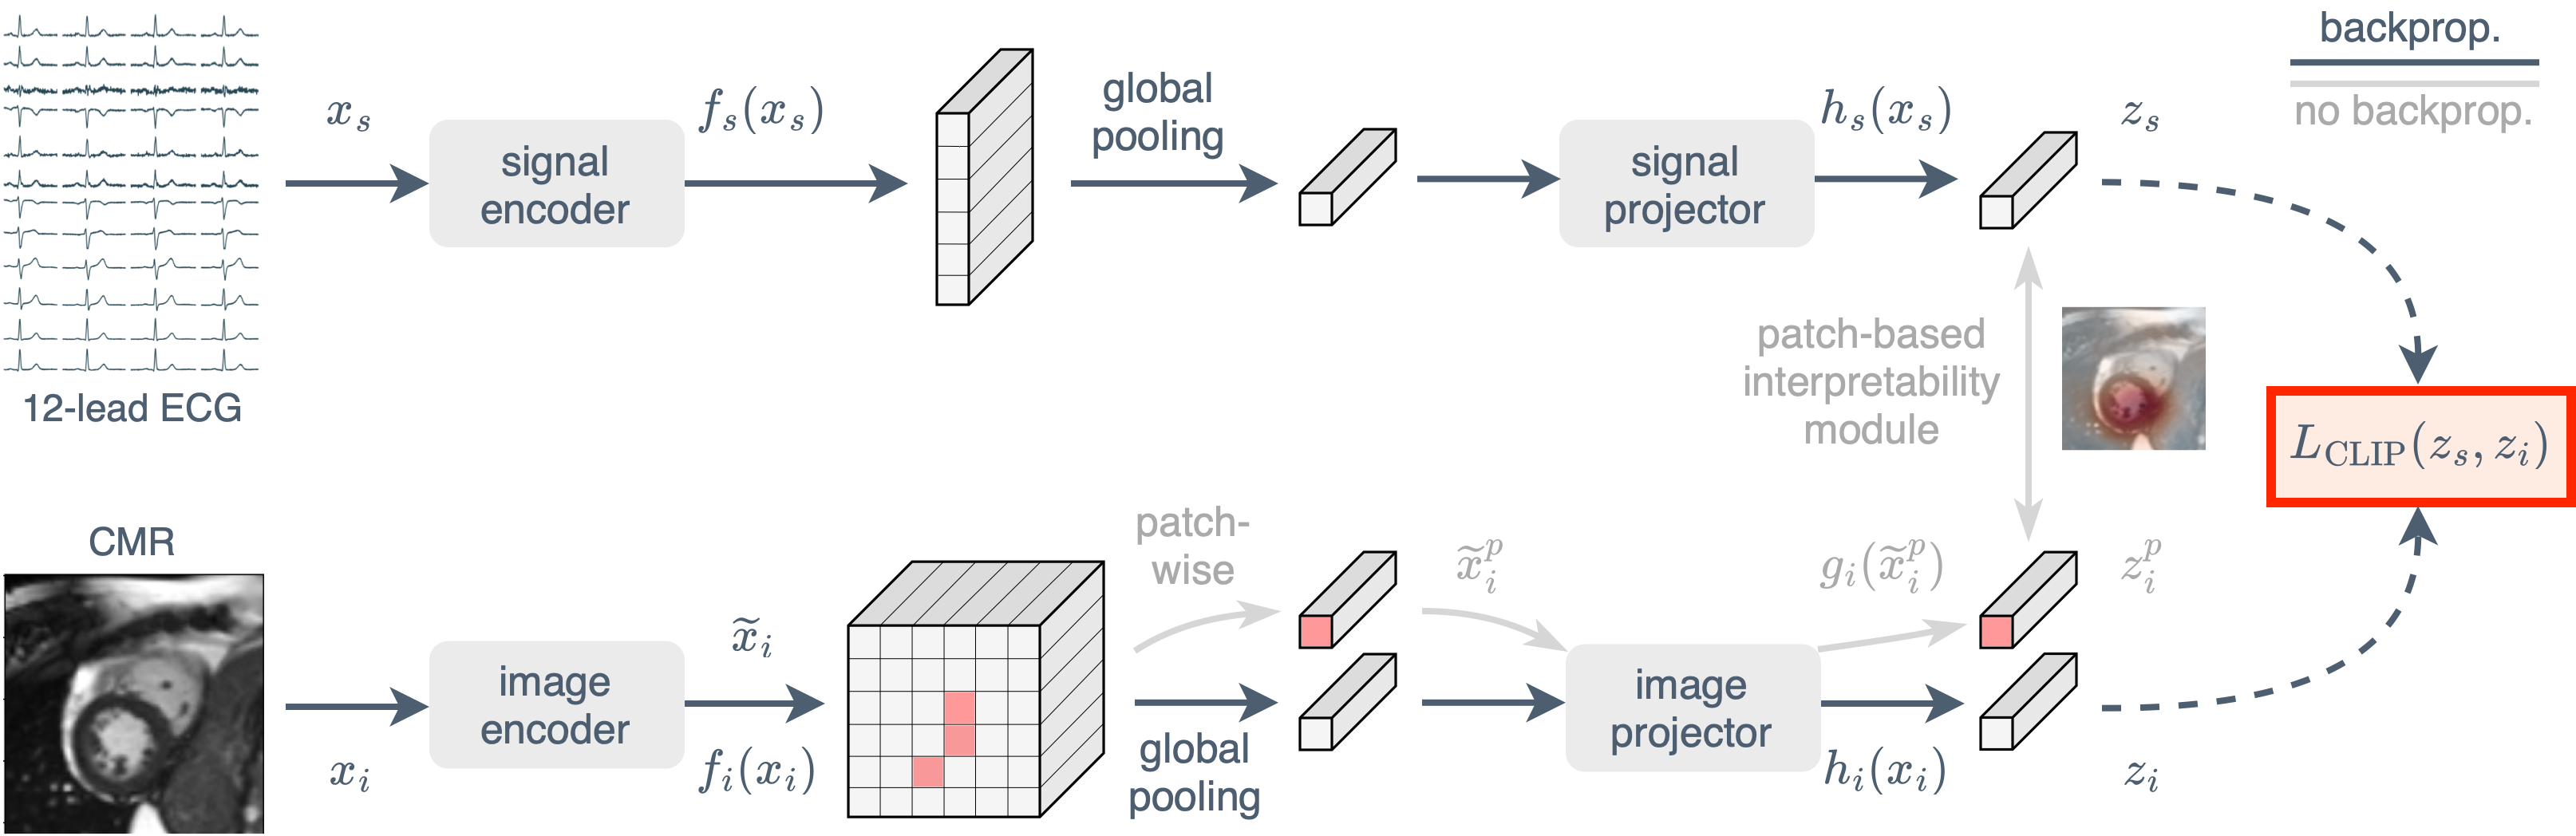
We introduce multimodal contrastive learning (MMCL) that incorporates both -lead ECG and CMR imaging, to enable self-supervised information transfer from CMR images to ECG embeddings. We base our multimodal solution on SimCLR [19]. A graphical representation of our approach is shown in Figure 3.
Assume pairs of time series data and imaging data that are augmented and processed by a signal encoder and an image encoder , respectively, to generate the embeddings and . The embeddings are passed through separate projectors and to generate the projections and , respectively, which are -normalized and mapped onto a shared latent space. and can be jointly represented as , such that
| (3) |
is defined analogously. In the shared latent space, we optimize the CLIP loss [28] to maximize the similarity of paired time series data and imaging data in a batch , while minimizing the similarity of unpaired data. Unlike the original InfoNCE loss [37], the CLIP loss [28] exclusively contrasts projections between different modalities and does not contrast data within one modality. The loss for the signal modality is defined as
| (4) |
where denotes a temperature parameter, and the loss for the imaging modality as
| (5) |
The total loss is thus
| (6) |
where denotes a parameter to balance the loss between signal and imaging modality.
3.3 Patch-Based Interpretability Module
To qualitatively evaluate the knowledge transfer during MMCL, we introduce a patch-based interpretability module similar to [38, 39]. This passive module computes the cosine similarity between the ECG embedding and embeddings of local CMR image regions, producing a similarity grid that is superimposed onto the CMR image as heatmap. Assume the embedded image , where are the height, width, and dimension of the embedding, respectively. We project each local image patch , where , separately to the latent space. In the shared latent space, we then determine the cosine similarity between each local image projection and the signal projection . The resulting similarity grid provides insight into which CMR image regions correlate with the ECG embedding.
4 Experiments
4.1 Dataset and Pre-processing
We train our multimodal method using pairs of -lead ECG and CMR imaging data from the UK Biobank population study [5]. The ECG and CMR imaging data were acquired within a few hours during the subject’s visit, thus capturing similar diagnostic information about the cardiovascular health. We use routine -s, -lead ECG data recorded at rest with a sampling frequency of Hz. The baseline drift was removed using the asymmetric least square smoothing technique [40]. We apply standard normalization separately to the Einthoven, Goldberger, and Wilson leads [41].
We use short-axis CMR images that provide the cross-sectional view of the heart’s left and right ventricle. Short-axis images were selected as they depict the left ventricle, in which early warning signs of cardiac dysfunction may become evident [42, 43]. The imaging data contains three-channel two-dimensional images, whose channels are the middle baso-apical slice at the end-systolic phase, the end-diastolic phase, and the mid-phase. The images were zero-padded to pixels and min-max-normalized between 0 and 1. We manually cropped the images around the visible heart and resized them back to the original size.
The final dataset contains unique subjects with pairs of ECG and CMR imaging data, which we split into training, validation, and testing pairs.
4.2 Prediction Targets
Our aim is to predict the subject-specific risk of various cardiovascular diseases defined by the International Classification of Diseases (ICD) code solely using ECG data. In this study, we investigate coronary artery disease (CAD) (ICD codes I-I), which is closely linked to its primary complication, myocardial infarction, ranking as the leading global cause of death [44]. Additionally, we analyze atrial fibrillation (AF) (ICD code I), a condition associated with heart failure [45], and diabetes mellitus (DM) (ICD codes E-E), which is associated with an increased risk for heart failure [46]. Because cardiovascular diseases can go undiagnosed for several years before they are recorded upon a severe cardiac event, we summarize both past and future diagnoses to address the challenge of accurately determining the disease onset. As all diseases are sparsely represented in the dataset ( for CAD, for AF, and for DM), the fine-tune training sets were balanced using all positive subjects and a static set of randomly chosen negative subjects. The validation and test sets were left untouched.
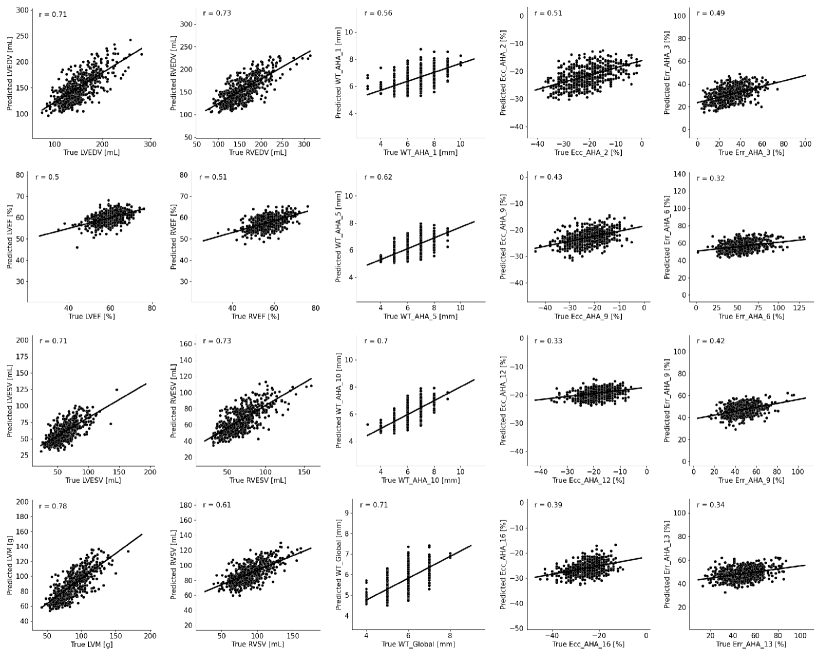
To evaluate the potential of our method towards more specialized tasks such as the prediction of distinct CMR imaging phenotypes, we used half of the dataset to extract the following phenotypes from short-axis CMR images as described by Bai et al. [47]. We extracted the left ventricular (LV) end-diastolic volume (LVEDV) [mL], LV end-systolic volume (LVESV) [mL], LV stroke volume (LVSV) [mL], LV ejection fraction (LVEF) [%], LV cardiac output (LVCO) [L/min], and LV mass (LVM) [g]. Furthermore, the right ventricular (RV) end-diastolic volume (RVEDV) [mL], RV end-systolic volume (RVESV) [mL], RV stroke volume (RVSV) [mL], and RV ejection fraction (RVEF) [%] were extracted. Lastly, we determined the wall thickness (WT) [mm], circumferential strain (Ecc) [mm], and radial strain (Err) [mm], respectively, of all myocardial segments described by the American Heart Association (AHA) [48].
4.3 Experimental Setup
4.3.1 Network Architectures
For the signal encoder , we adapt a Vision Transformer (ViT) [21] with layers and heads that creates embeddings of size . We reshape the -lead ECG into a flattened sequence of one-dimensional patches with size . For the image encoder, we use a ResNet50 [49] that generates embeddings of size . All image encoders are pre-trained on the UK Biobank data using SimCLR [19], which is most performant for self-supervised unimodal pre-training of CMR images as shown by Hager et al. [31]. Our signal and image projectors are two-layer perceptrons with one hidden layer of size , which separately project the embeddings to a shared latent space of dimensions.
4.3.2 Training Strategy
We first pre-train our unimodal signal encoder using the MAE [16]. We use AdamW [50] with a batch size of and a cosine annealing scheduler over epochs with a warmup. We set a base learning rate of , a weight decay of , and a masking ratio of . We introduce an unstructured masking strategy for time series data similar to [18].
After pre-training solely on ECG data, we leverage multimodal contrastive learning to pre-train our signal encoder with information from CMR imaging data. We use AdamW [50] with a batch size of and a cosine annealing scheduler over epochs with a warmup. We set to , to , and the weight decay to . To find the optimal base learning rate, we sweep over (, , , ).
Finally, we fine-tune our unimodal signal encoder on the balanced training sets as described in Section 4.2, to predict the subject-specific risk of diseases solely from ECG data. We use AdamW [50] and a cosine annealing scheduler over epochs with a warmup. We find optimal hyperparameters using a grid search, sweeping over the batch size (, , ), the layer decay (, ), the drop path rate (, , ), the label smoothing rate (, , ), the weight decay (, , ), and the learning rate (, , , ). We replace the global average pooling of used during pre-training with the attention pooling described in [28]. We leave all model weights trainable during fine-tuning, as this typically yields better results compared to linear probing and thus is most common in practice. Fine-tuning is stopped using an early stopping callback on the validation metrics, i.e., the ROC AUC and the r-value.
We augment the -lead ECG data using random cropping (scale= only during pre-training), Gaussian noise (sigma= during pre-training, during fine-tuning), amplitude rescaling (sigma= during pre-training and fine-tuning), and Fourier transform surrogates (phase_noise_magnitude= during pre-training, during fine-tuning). The CMR images are augmented using horizontal flips (probability=), rotations (probability=, degrees=), color jitter (brightness=, contrast=, saturation=), and random resized cropping (size=, scale=()). We optimize all network parameters on a single NVIDIA A40 GPU.
4.4 Evaluation
4.4.1 Baseline Methods
We compare our approach with several fully supervised baselines, using either ECG, CMR imaging, or tabular data. The CMR imaging baseline is a randomly initialized ResNet50 [49] that is trained fully supervised. For tabular data, we use demographic and physiological data including age, sex, weight, and height. We use a XGBoost [51] based tabular encoder and sweep over the number of boosting rounds (, , , , ), the maximum tree depth (, , , , , ), the learning rate (, , ), and the subsample ratio (, , ) to find the best hyperparameter setting. We optimize a cross-entropy and MSE loss for the classification and regression tasks, respectively.
Furthermore, to evaluate the effectiveness of the MAE [16] for learning rich ECG embeddings, we compare it to a fully supervised model and multiple unimodally pre-trained contrastive models. Therefore, we predict the subject-specific risk of cardiovascular diseases from ECG data using the fully supervised ViT [21] described in Section 4.3.1 as well as the following contrastive approaches. SimCLR [19] with set to , learning rate to , and the weight decay to . BYOL [25] with set to , learning rate to , and the weight decay to . CLOCS [11] with set to , learning rate to , and the weight decay to . BarlowTwins [26] with the learning rate set to and the weight decay to .
4.4.2 Metrics
We evaluate the methods’ classification performance by calculating the area under the receiver operating characteristic curve (ROC AUC) as the UK Biobank study is severely unbalanced with regards to the investigated cardiovascular diseases. The performance on the regression tasks is assessed using Pearson’s correlation coefficient (r-value). All experiments are reported as mean and standard deviation across five seeds set during fine-tuning.
5 Results and Discussion
5.1 Multimodal Pre-Training Allows for CMR-Level Disease Classification from ECG Only
| Modality | Cardiovascular disease | ||
|---|---|---|---|
| CAD | AF | DM | |
| ECG | 66.900.47 | 69.762.13 | 67.350.76 |
| Tabular | 71.970.14 | 72.220.00 | 72.530.15 |
| CMR | 71.880.64 | 73.110.64 | 74.240.50 |
| ECG (ours) | 73.000.30 | 74.110.53 | 75.560.16 |
To evaluate the utility of our multimodal solution in a clinical setting, we compare it to baseline methods that are based on different modalities available for patient care, including ECG, CMR imaging, and tabular data. Each baseline is trained fully-supervised on data of the respective modality and subsequently tested with data of the same modality. Table 1 presents the performance of all models in predicting the risk of CAD, AF, and DM. The performance of the tabular baseline indicates that diseases related to the cardiovascular system are highly correlated with demographic and physiological factors, including age, sex, height, and weight. The CMR imaging model noticeably outperforms both the tabular and ECG baselines across all diseases, except for CAD, where it is on par with the tabular baseline. Our proposed approach pre-trains multimodally and predicts the subject-specific risk of diseases unimodally from ECG alone, outperforming all baseline models across all diseases, including the CMR imaging model.
5.2 Multimodal Pre-Training With Masked Data Modeling Outperforms Other Pre-training Strategies
| Modality | Model | Cardiovascular disease | ||
| CAD | AF | DM | ||
| ECG | Supervised ViT | 66.900.47 | 69.762.13 | 67.350.76 |
| SimCLR | 66.030.99 | 67.950.59 | 68.730.47 | |
| CLOCS | 67.300.46 | 67.330.32 | 68.680.37 | |
| BYOL | 67.590.28 | 69.760.52 | 67.700.26 | |
| BarlowTwins | 68.110.54 | 67.420.72 | 69.580.02 | |
| MAE | 71.710.36 | 72.320.73 | 73.150.39 | |
| MMCL (ours) | 73.000.30 | 74.110.53 | 75.560.16 | |
A comparison of our multimodal approach against supervised and multiple state-of-the-art self-supervised pre-training strategies can be found in Table 2. When comparing unimodal pre-training strategies, masked data modeling (MDM) with the MAE [16] is most effective in learning ECG embeddings, outperforming all other unimodally pre-trained models across all diseases. With heavy masking ratios, we find the MAE able to eliminate redundancy present in the 12-lead ECG across signal channels and time. Leveraging MDM thus enables learning rich ECG embeddings that generalize well to the detection of various diseases. Using contrastive techniques for unimodal pre-training, the prediction performance is inferior to the MAE. We hypothesize that the augmentations described in Section 4.3.1 are not meeting the requirement of heavy data augmentation, which are needed for contrastive solutions. Even contrastive implementations using augmentations tailored to -lead ECG data, such as CLOCS [11], are outperformed by the MAE, highlighting our decision to integrate MDM into our proposed MMCL. We find that MMCL consistently outperforms all other methods.
| Modality | Model | Pre-training | Cardiovascular disease | |||
|---|---|---|---|---|---|---|
| MDM | MMCL | CAD | AF | DM | ||
| ECG | Supervised ViT | ✗ | ✗ | 66.900.47 | 69.762.13 | 67.350.76 |
| MDM | ✓ | ✗ | 71.710.36 | 72.320.73 | 73.150.39 | |
| MMCL w/o MDM | ✗ | ✓ | 70.360.51 | 72.410.52 | 73.400.48 | |
| MMCL (ours) | ✓ | ✓ | 73.000.30 | 74.110.53 | 75.560.16 | |
To evaluate the strength of our approach, MMCL, which integrates MDM as a key component, we perform an ablation study comparing different pre-training strategies for the risk prediction of diseases from ECG. The results are presented in Table 3. We compare our approach against a supervised ViT, MDM, and our approach without MDM, coined MMCL w/o MDM. We find that MMCL w/o MDM noticeably improves performance compared to the baselines, resulting in a boost in prediction scores across all diseases, except for CAD where it is inferior to MDM. Our proposed MMCL substantially outperforms all other pre-training strategies on all three tasks.
5.3 Multimodal Pre-Training Encodes Cardiac Phenotypes from ECG Data
| Modality | Model | Pre-training | CMR imaging phenotype | |||||
|---|---|---|---|---|---|---|---|---|
| MDM | MMCL | LV | RV | WT | Ecc | Err | ||
| ECG | Supervised ViT | ✗ | ✗ | 0.56 | 0.58 | 0.54 | 0.29 | 0.30 |
| MDM | ✓ | ✗ | 0.62 | 0.64 | 0.60 | 0.36 | 0.36 | |
| MMCL w/o MDM | ✗ | ✓ | 0.58 | 0.60 | 0.57 | 0.32 | 0.33 | |
| MMCL (ours) | ✓ | ✓ | 0.63 | 0.65 | 0.61 | 0.37 | 0.38 | |
| CMR | Supervised ResNet | ✗ | ✗ | 0.84 | 0.85 | 0.78 | 0.64 | 0.66 |
We further investigate the extent to which morphological cardiac features are encoded in ECG embeddings through multimodal contrastive learning. To this end, we predict distinct cardiac phenotypes that have previously been derived from short-axis CMR images. The results are summarized in Table 4. Our experiments show that MMCL w/o MDM allows for prediction of CMR imaging phenotypes to some extent, however, it is not as effective as MDM. These findings indicate that morphological features are already present in -lead ECG data and have to be unlocked by eliminating redundancy across signal channels and time, further stressing the importance of masking as a form of heavy time series augmentation. Further, MMCL noticeably is most effective for CMR imaging phenotype prediction, highlighting the importance of MDM for the process of encoding information from CMR images into ECG embeddings during multimodal pre-training. In Figure 4, we demonstrate the ability of our proposed MMCL model to predict CMR imaging phenotypes solely from ECG.
5.4 Multimodal Pre-Training Is Particularly Powerful in Low-Data Regimes
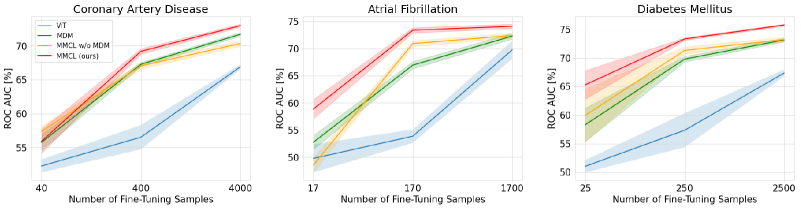
Investigating medical conditions characterized by low prevalence requires the model performance to be robust even when trained with few positive samples. Hence, to evaluate the effectiveness of our multimodal method under low-data conditions, we conduct experiments by subsampling the fine-tuning training set to and of its original size, while ensuring that each subset is fully contained within the corresponding superset. Consequently, the balanced training set sizes for CAD, AF, and DM were () and (), () and (), and () and (), respectively. The validation and test sets remain unchanged from the full data regime. Figure 5 illustrates the performance of our approach as well as the baselines under low-data conditions.
Our results indicate that under low-data conditions, our MMCL approach consistently outperforms the baselines across all diseases except for the detection of CAD with fine-tuning samples, where it is inferior to MMCL w/o MDM. This observation highlights the improved ECG embeddings generated by our approach, which require fewer fine-tuning samples to achieve comparable performance, especially when investigating rare diseases.
5.5 Patch-Based Interpretability Module Can Visualize Knowledge Transfer from CMR Imaging to ECG
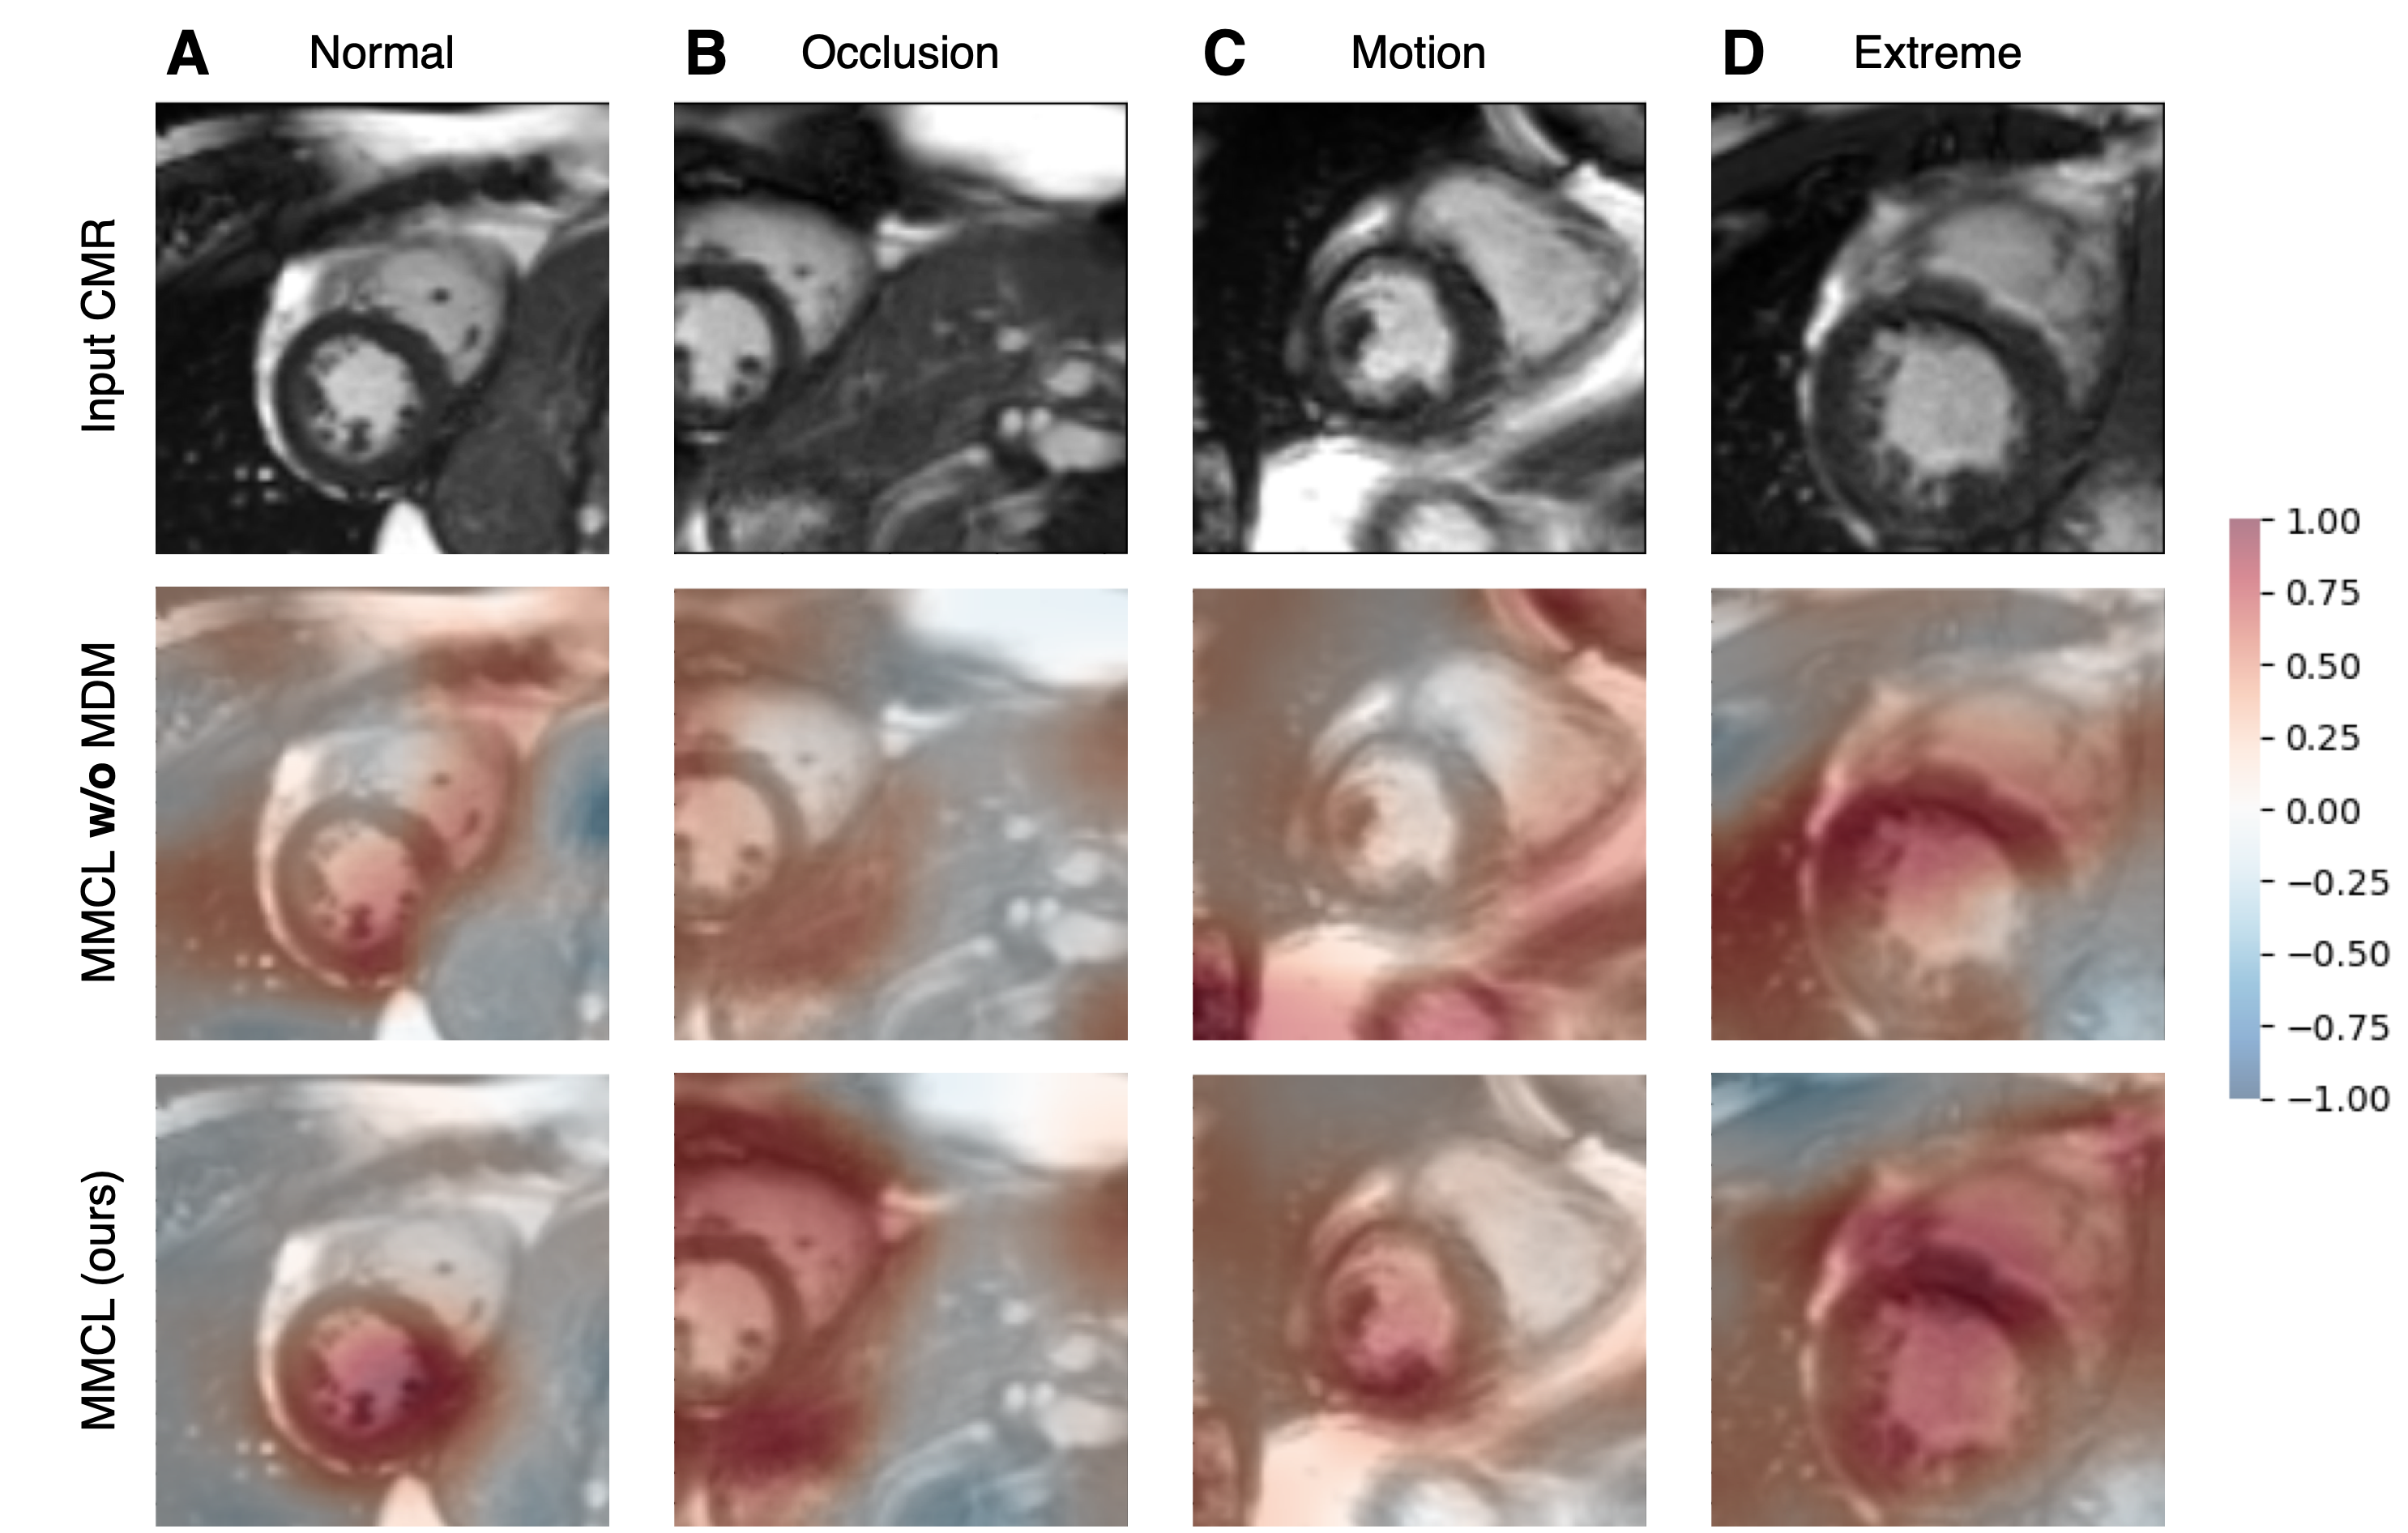
To explore why MDM improves transfer of information from CMR images to ECG embeddings during multimodal pre-training, we qualitatively analyze its contributions to the improved ECG embeddings using our patch-based interpretability module. MDM allows for a robust knowledge transfer even in the cases of occlusion, motion, and samples showing extreme morphological properties, as illustrated in Figure 6. We find that leveraging MDM elicits higher correlations between the ECG and CMR image regions of interest, e.g., the left ventricle. These findings align with existing medical literature, linking cardiovascular diseases to the left ventricle [52].
5.6 Multimodal Pre-Training Also Improves Analysis of CMR Images
| Modality | Model | Pre-training | Cardiovascular disease | |||
|---|---|---|---|---|---|---|
| MDM | MMCL | CAD | AF | DM | ||
| CMR | Supervised ResNet | ✗ | ✗ | 71.880.64 | 73.110.64 | 74.240.50 |
| MMCL w/o MDM | ✗ | ✓ | 74.690.23 | 77.360.62 | 77.370.42 | |
| MMCL (ours) | ✓ | ✓ | 74.370.69 | 77.130.42 | 77.820.26 | |
To evaluate whether information from ECG data is embedded into CMR image representations, we perform additional experiments to predict the risk of cardiovascular diseases from CMR images. In Table 5, we compare our proposed approach MMCL to MMCL w/o MDM and a fully supervised ResNet50 [49]. We find that our multimodal solutions substantially boost model performance, demonstrating also a transfer of information from ECG data to CMR image embeddings. Moreover, while MDM is a key component in the ECG representation learning process, it is not required for learning rich CMR image embeddings.
6 Conclusion
In this work, we present a novel contrastive learning approach that can pre-train multimodally using both -lead ECG data and CMR images. During inference, our solution requires only ECG data to unimodally assess the subject-specific risk of cardiovascular diseases and determine distinct cardiac phenotypes. Specifically, we combine multimodal contrastive learning with masked data modeling to allow information to be transferred from CMR images to ECG embeddings. We demonstrate both quantitatively and qualitatively that a transfer of knowledge from CMR images unlocks the full diagnostic potential of ECG, enabling affordable care for patients with cardiovascular conditions.
In the end, we also acknowledge limitations of our work. While our approach can predict unimodally solely from ECG data, it relies on paired ECG and CMR imaging data during pre-training, which are rare outside of large biobanks. A further shortcoming of this study is that mainly healthy subjects are included, since the investigated diseases are low frequency in the general population. The UK Biobank study also mainly considers white subjects, with other ethnicities making up only of the total cohort. The behaviour of such frameworks with more balanced data should be investigated in future work.
This study has demonstrated that multimodal contrastive learning in combination with mask data modeling generates general-purpose ECG embeddings that can be applied to a broad range of clinical downstream tasks. Thus, we present a simple but effective strategy that combines the accessibility of ECG with the informative value of CMR imaging, enabling holistic cardiac screening solely by ECG.
References
- [1] K. C. Siontis, P. A. Noseworthy, Z. I. Attia, and P. A. Friedman, “Artificial intelligence-enhanced electrocardiography in cardiovascular disease management,” Nature Reviews Cardiology, vol. 18, no. 7, pp. 465–478, 2021.
- [2] J. F. Pombo, B. L. Troy, and R. O. RUSSELL JR, “Left ventricular volumes and ejection fraction by echocardiography,” Circulation, vol. 43, no. 4, pp. 480–490, 1971.
- [3] D. C. Lee, M. Markl, E. Dall’Armellina, et al., “The growth and evolution of cardiovascular magnetic resonance: a 20-year history of the society for cardiovascular magnetic resonance (SCMR) annual scientific sessions,” Journal of Cardiovascular Magnetic Resonance, vol. 20, no. 1, pp. 1–11, 2018.
- [4] F. von Knobelsdorff-Brenkenhoff, G. Pilz, and J. Schulz-Menger, “Representation of cardiovascular magnetic resonance in the AHA/ACC guidelines,” Journal of Cardiovascular Magnetic Resonance, vol. 19, no. 1, pp. 1–21, 2017.
- [5] C. Sudlow, J. Gallacher, N. Allen, et al., “UK biobank: an open access resource for identifying the causes of a wide range of complex diseases of middle and old age,” PLoS Medicine, vol. 12, no. 3, p. e1001779, 2015.
- [6] Z. I. Attia, S. Kapa, F. Lopez-Jimenez, et al., “Screening for cardiac contractile dysfunction using an artificial intelligence–enabled electrocardiogram,” Nature Medicine, vol. 25, no. 1, pp. 70–74, 2019.
- [7] S. Raghunath, A. E. Ulloa Cerna, L. Jing, et al., “Prediction of mortality from 12-lead electrocardiogram voltage data using a deep neural network,” Nature Medicine, vol. 26, no. 6, pp. 886–891, 2020.
- [8] H. Zhu, C. Cheng, H. Yin, et al., “Automatic multilabel electrocardiogram diagnosis of heart rhythm or conduction abnormalities with deep learning: a cohort study,” The Lancet Digital Health, vol. 2, no. 7, pp. e348–e357, 2020.
- [9] P. Sarkar and A. Etemad, “Self-supervised ECG representation learning for emotion recognition,” IEEE Transactions on Affective Computing, vol. 13, no. 3, pp. 1541–1554, 2020.
- [10] H. Zhang, W. Liu, J. Shi, et al., “MaeFE: Masked autoencoders family of electrocardiogram for self-supervised pretraining and transfer learning,” IEEE Transactions on Instrumentation and Measurement, vol. 72, pp. 1–15, 2022.
- [11] D. Kiyasseh, T. Zhu, and D. A. Clifton, “Clocs: Contrastive learning of cardiac signals across space, time, and patients,” in International Conference on Machine Learning, pp. 5606–5615, PMLR, 2021.
- [12] M. Chen, A. Radford, R. Child, J. Wu, H. Jun, D. Luan, and I. Sutskever, “Generative pretraining from pixels,” in International conference on machine learning, pp. 1691–1703, PMLR, 2020.
- [13] D. Pathak, P. Krahenbuhl, J. Donahue, T. Darrell, and A. A. Efros, “Context encoders: Feature learning by inpainting,” in IEEE/CVF Conference on Computer Vision and Pattern Recognition, pp. 2536–2544, 2016.
- [14] P. Vincent, H. Larochelle, I. Lajoie, Y. Bengio, P.-A. Manzagol, and L. Bottou, “Stacked denoising autoencoders: Learning useful representations in a deep network with a local denoising criterion.,” Journal of machine learning research, vol. 11, no. 12, 2010.
- [15] J. Devlin, M.-W. Chang, K. Lee, and K. Toutanova, “Bert: Pre-training of deep bidirectional transformers for language understanding,” North American Chapter of the Association for Computational Linguistics: Human Language Technologies, pp. 4171–4186, 2019.
- [16] K. He, X. Chen, S. Xie, et al., “Masked autoencoders are scalable vision learners,” in IEEE/CVF Conference on Computer Vision and Pattern Recognition, pp. 16000–16009, 2022.
- [17] C. Feichtenhofer, H. Fan, Y. Li, and K. He, “Masked autoencoders as spatiotemporal learners,” in Advances in Neural Information Processing Systems, 2022.
- [18] P.-Y. Huang, H. Xu, J. Li, et al., “Masked autoencoders that listen,” in Advances in Neural Information Processing Systems, 2022.
- [19] T. Chen, S. Kornblith, M. Norouzi, and G. Hinton, “A simple framework for contrastive learning of visual representations,” in International Conference on Machine Learning, pp. 1597–1607, PMLR, 2020.
- [20] T. Brown, B. Mann, N. Ryder, et al., “Language models are few-shot learners,” Advances in neural information processing systems, vol. 33, pp. 1877–1901, 2020.
- [21] A. Dosovitskiy, L. Beyer, A. Kolesnikov, et al., “An image is worth 16x16 words: Transformers for image recognition at scale,” International Conference on Learning Representations, 2021.
- [22] H. Bao, L. Dong, S. Piao, and F. Wei, “Beit: BERT pre-training of image transformers,” in International Conference on Learning Representations, 2022.
- [23] A. Vaswani, N. Shazeer, N. Parmar, J. Uszkoreit, L. Jones, A. N. Gomez, Ł. Kaiser, and I. Polosukhin, “Attention is all you need,” Advances in neural information processing systems, vol. 30, 2017.
- [24] I. Beltagy, M. E. Peters, and A. Cohan, “Longformer: The long-document transformer,” arXiv:2004.05150, 2020.
- [25] J.-B. Grill, F. Strub, F. Altché, C. Tallec, P. Richemond, E. Buchatskaya, C. Doersch, B. Avila Pires, Z. Guo, M. Gheshlaghi Azar, et al., “Bootstrap your own latent-a new approach to self-supervised learning,” Advances in neural information processing systems, vol. 33, pp. 21271–21284, 2020.
- [26] J. Zbontar, L. Jing, I. Misra, Y. LeCun, and S. Deny, “Barlow twins: Self-supervised learning via redundancy reduction,” in International Conference on Machine Learning, pp. 12310–12320, PMLR, 2021.
- [27] R. Hadsell, S. Chopra, and Y. LeCun, “Dimensionality reduction by learning an invariant mapping,” in IEEE/CVF Conference on Computer Vision and Pattern Recognition, vol. 2, pp. 1735–1742, IEEE, 2006.
- [28] A. Radford, J. W. Kim, C. Hallacy, et al., “Learning transferable visual models from natural language supervision,” in International Conference on Machine Learning, pp. 8748–8763, PMLR, 2021.
- [29] Y. Zhang, H. Jiang, Y. Miura, et al., “Contrastive learning of medical visual representations from paired images and text,” in Machine Learning for Healthcare Conference, pp. 2–25, PMLR, 2022.
- [30] N. Pielawski, E. Wetzer, J. Öfverstedt, J. Lu, C. Wählby, J. Lindblad, and N. Sladoje, “Comir: Contrastive multimodal image representation for registration,” Advances in neural information processing systems, vol. 33, pp. 18433–18444, 2020.
- [31] P. Hager, M. J. Menten, and D. Rueckert, “Best of both worlds: Multimodal contrastive learning with tabular and imaging data,” in IEEE/CVF Conference on Computer Vision and Pattern Recognition, pp. 23924–23935, 2023.
- [32] H. Xu, G. Ghosh, P.-Y. Huang, D. Okhonko, A. Aghajanyan, F. Metze, L. Zettlemoyer, and C. Feichtenhofer, “Videoclip: Contrastive pre-training for zero-shot video-text understanding,” in Conference on Empirical Methods in Natural Language Processing (EMNLP), 2021.
- [33] M. Zolfaghari, Y. Zhu, P. Gehler, and T. Brox, “Crossclr: Cross-modal contrastive learning for multi-modal video representations,” in IEEE/CVF International Conference on Computer Vision, pp. 1450–1459, 2021.
- [34] L. Wang, P. Luc, A. Recasens, et al., “Multimodal self-supervised learning of general audio representations,” arXiv preprint arXiv:2104.12807, 2021.
- [35] S. Ma, Z. Zeng, D. McDuff, and Y. Song, “Active contrastive learning of audio-visual video representations,” in International Conference on Learning Representations, 2021.
- [36] Q. Zhang, Y. Wang, and Y. Wang, “How mask matters: Towards theoretical understandings of masked autoencoders,” Advances in Neural Information Processing Systems, 2022.
- [37] A. v. d. Oord, Y. Li, and O. Vinyals, “Representation learning with contrastive predictive coding,” arXiv preprint arXiv:1807.03748, 2018.
- [38] B. Boecking, N. Usuyama, S. Bannur, et al., “Making the most of text semantics to improve biomedical vision–language processing,” in Computer Vision–ECCV 2022, pp. 1–21, Springer, 2022.
- [39] S.-C. Huang, L. Shen, M. P. Lungren, and S. Yeung, “Gloria: A multimodal global-local representation learning framework for label-efficient medical image recognition,” in IEEE/CVF Conference on Computer Vision and Pattern Recognition, pp. 3942–3951, 2021.
- [40] Z.-M. Zhang, S. Chen, and Y.-Z. Liang, “Baseline correction using adaptive iteratively reweighted penalized least squares,” Analyst, vol. 135, no. 5, pp. 1138–1146, 2010.
- [41] M. G. Khan, Rapid ECG Interpretation. Springer, 2008.
- [42] Z. Raisi-Estabragh, N. C. Harvey, S. Neubauer, and S. E. Petersen, “Cardiovascular magnetic resonance imaging in the uk biobank: a major international health research resource,” European Heart Journal-Cardiovascular Imaging, vol. 22, no. 3, pp. 251–258, 2021.
- [43] C. W. Tsao, P. N. Gona, C. J. Salton, M. L. Chuang, D. Levy, W. J. Manning, and C. J. O’Donnell, “Left ventricular structure and risk of cardiovascular events: a framingham heart study cardiac magnetic resonance study,” Journal of the American Heart Association, vol. 4, no. 9, p. e002188, 2015.
- [44] WHO, “Who methods and data sources for country-level causes of death 2000-2019,” World Health Organization, 2020.
- [45] G. Y. Lip and H.-F. Tse, “Management of atrial fibrillation,” The Lancet, vol. 370, no. 9587, pp. 604–618, 2007.
- [46] M. A. Cavender, P. G. Steg, S. C. Smith Jr, et al., “Impact of diabetes mellitus on hospitalization for heart failure, cardiovascular events, and death: outcomes at 4 years from the reduction of atherothrombosis for continued health (reach) registry,” Circulation, vol. 132, no. 10, pp. 923–931, 2015.
- [47] W. Bai, H. Suzuki, J. Huang, C. Francis, S. Wang, G. Tarroni, F. Guitton, N. Aung, K. Fung, S. E. Petersen, et al., “A population-based phenome-wide association study of cardiac and aortic structure and function,” Nature medicine, vol. 26, no. 10, pp. 1654–1662, 2020.
- [48] M. D. Cerqueira, N. J. Weissman, V. Dilsizian, et al., “Standardized myocardial segmentation and nomenclature for tomographic imaging of the heart: a statement for healthcare professionals from the cardiac imaging committee of the council on clinical cardiology of the american heart association,” Circulation, vol. 105, no. 4, pp. 539–542, 2002.
- [49] K. He, X. Zhang, S. Ren, and J. Sun, “Deep residual learning for image recognition,” in IEEE/CVF Conference on Computer Vision and Pattern Recognition, pp. 770–778, 2016.
- [50] I. Loshchilov and F. Hutter, “Decoupled weight decay regularization,” International Conference on Learning Representations, 2019.
- [51] T. Chen and C. Guestrin, “Xgboost: A scalable tree boosting system,” in Proceedings of the 22nd ACM SIGKDD International Conference on Knowledge Discovery and Data Mining, pp. 785–794, 2016.
- [52] M. Davies, F. Hobbs, R. Davis, et al., “Prevalence of left-ventricular systolic dysfunction and heart failure in the echocardiographic heart of england screening study: a population based study,” The Lancet, vol. 358, no. 9280, pp. 439–444, 2001.