Collective Human Opinions in Semantic Textual Similarity
Abstract
Despite the subjective nature of semantic textual similarity (STS) and pervasive disagreements in STS annotation, existing benchmarks have used averaged human ratings as gold standard. Averaging masks the true distribution of human opinions on examples of low agreement, and prevents models from capturing the semantic vagueness that the individual ratings represent. In this work, we introduce USTS, the first Uncertainty-aware STS dataset with 15,000 Chinese sentence pairs and 150,000 labels, to study collective human opinions in STS. Analysis reveals that neither a scalar nor a single Gaussian fits a set of observed judgements adequately. We further show that current STS models cannot capture the variance caused by human disagreement on individual instances, but rather reflect the predictive confidence over the aggregate dataset.
1 Introduction
Semantic textual similarity (STS) is a fundamental natural language understanding (NLU) task, involving the prediction of the degree of semantic equivalence between two pieces of text (S1,S2). STS has been approached in various ways, ranging from early efforts using string- or knowledge-based measures and count-based co-occurrence models (Resnik, 1999; Barrón-Cedeño et al., 2010; Matveeva et al., 2005), to modern neural networks.
Broadly speaking, the goal of the STS task is to train models to make a similarity assessment that matches what a human would make. Gold-standard scores are typically assigned by asking multiple raters to label a pair of sentences and then taking the average (Agirre et al., 2012, 2013, 2014, 2015, 2016; Marelli et al., 2014; Soğancıoğlu et al., 2017; Wang et al., 2018). The underlying assumption here is that there is a single “true” similarity score between S1 and S2, and that this label can be approximated by averaging multiple — possibly noisy — human ratings. While this assumption might be reasonable in settings such as educational testing with well-defined knowledge or norms (Trask and Trask, 1999), it is not the case for more subjective NLU tasks.
Pavlick and Kwiatkowski (2019) show that in natural language inference (NLI), disagreements often persist even if more ratings are collected or when the amount of context provided to raters is increased. High disagreement has been observed in a number of existing NLI datasets Nie et al. (2020). In STS, concerns about inconsistent judgements have been raised, particularly for difficult boundary cases in complex domains, where even expert annotators can disagree about the “true” label (Wang et al., 2020; Olmin and Lindsten, 2022). Identifying and discarding “noisy” labels during training can reduce generalisation error (Wang et al., 2022a, b). We reexamine whether the disagreement observed among raters should be attributed to “noise” and resolved via dismissing, or should rather treated as an inherent quality of the STS labels. Specifically, our primary contributions are:
-
1.
We develop USTS, the first Uncertainty-aware STS dataset with a total of 15,000 Chinese sentence pairs and 150,000 labels. We study the human assessments and investigate how best to integrate them into a gold label across varying degrees of observed human disagreement.
-
2.
We show that state-of-the-art STS models cannot capture disagreement when trained using a single averaged rating, and argue that STS evaluation should incentivise models to predict distributions over human judgements, especially for cases of low agreement.
-
3.
We discuss the practicalities of transferring labels across languages in building a multilingual STS corpus, and present evidence to suggest that this may be problematic in the continuous labelling space.
2 Background
2.1 Semantic Textual Similarity Task
Data Collection and Annotation: As STS requires a sentence pair, to construct a dataset, ideally sentence pairs should be sampled to populate the spectrum of differing degrees of semantic equivalence, which is a huge challenge. If pairs of sentences are taken at random, the vast majority would be totally unrelated, and only a very small fraction would have some degree of semantic equivalence (Agirre et al., 2012). Accordingly, previous work has either resorted to string similarity metrics (e.g. edit distance or bag-of-word overlap) (Agirre et al., 2013, 2014, 2015, 2016; Soğancıoğlu et al., 2017; Wang et al., 2018), or reused existing datasets from tasks related to STS, such as paraphrasing based on news/video descriptions (Agirre et al., 2012) and NLI (Marelli et al., 2014).
In terms of annotation, for general text (e.g. news, glosses, or image descriptions), it has mostly been performed using crowdsourcing via platforms such as Amazon Mechanical Turk with five crowd workers (Cer et al., 2017). For knowledge-rich domains such as clinical and biomedical text, on the other hand, a smaller number of expert annotators has been used, such as two clinical experts for MedSTS (Wang et al., 2018). Raters are asked to assess similarity independently on the basis of semantic equivalence using a continuous value in range . Then a gold label is computed by averaging these human ratings.
| No. 1 | Low Human Disagreement |
| S1 | Kenya Supreme Court upholds election result. |
| S2 | Kenya SC upholds election result. |
| Old label | 5.0 |
| New label | |
| Annotations | [4.5, 4.7, 4.8, 5.0, 5.0, 5.0, 5.0, 5.0, 5.0, 5.0, 5.0, 5.0, 5.0, 5.0, 5.0] |
| Prediction | 3.5 |
| Reason | Lack of knowledge of the correspondence between Supreme Court and SC. |
| No. 2 | High Human Disagreement |
| S1 | A man is carrying a canoe with a dog. |
| S2 | A dog is carrying a man in a canoe. |
| Old label | 1.8 |
| New label | |
| Annotations | [0.0, 0.3, 0.5, 0.5, 1.2, 1.5, 1.5, 1.8, 2.0, 2.0, 2.0, 2.0, 2.5, 3.5, 3.5] |
| Prediction | 4.3 |
| Reason | Uncertainty about the impact of key differences in event participants on instances of high lexical overlap |
| No. 3 | High Human Disagreement |
| S1 | Someone is grating a carrot. |
| S2 | A woman is grating an orange food. |
| Old label | 2.5 |
| New label | |
| Annotations | [0.5, 1.0, 1.0, 1.8, 1.8, 1.8, 2.0, 2.2, 2.5, 3.0, 3.0, 3.2, 3.5, 3.6, 4.5] |
| Prediction | 0.6 |
| Reason | Failure to associate carrot with orange food. |
“
Is averaging appropriate? Averaging has been the standard approach to generating gold labels since Lee et al. (2005). However, this approach relies on the assumption that there is a well-defined gold-standard interpretation + score, and that any variance in independent ratings is arbitrary rather than due to systematic differences in interpretation. An example of this effect can be seen in case No. 1 in Table 2. In practice, however, high levels of disagreement can be observed among annotators in different domains.333 for 9% and 11% pairs in biomedical STS corpora: BIOSSES and EBMSASS; inter-annotator agreement Cohen’s =0.60/0.67 for two clinical datasets (Wang et al., 2020).
In such cases, a simple average fails to capture the latent distribution of human opinions/interpretations, and masks the uncertain nature of subjective assessments. With Nos. 2 and 3 in Table 2, e.g., the average scores of 1.7 and 2.4 do not convey the fact that the ratings vary substantially (). While the integrated score may reflect the average opinion, it neither captures the majority viewpoint nor exposes the inherent disagreements among raters. Put differently, not all average scores of a given value convey the same information. Consider three scenarios that all average to 3.0: (3,3,3,3,3)/5, (1,3.5,3.5,3.5,3.5)/5, and (2,4,2,4,3)/5. The inherent level of human agreement varies greatly in these three cases.
Looking to the system predictions, the model prediction of 3.5 for No. 1 in Table 2 is clearly incorrect, as it lies well outside the (tight) range of human annotations in the range . While the model prediction of 4.3 for No. 2 also lies outside the annotation range of , it is closer to an extremum, and there is much lower agreement here, suggesting that the prediction is better than that for No. 1. No. 3 seems to be better again, as the model prediction of 0.6 is both (just) within the annotation range of and closer to the average for a similarly low-agreement instance. Based on the standard evaluation methodology in STS research of calculating the Pearson correlation over the mean rating, however, No. 1 would likely be assessed as being a more accurate prediction than Nos. 2 or 3, based solely on how close the scalar prediction is to the annotator mean. A more nuanced evaluation should take into consideration the relative distribution of annotator scores, and assuming a model which outputs a score distribution rather than a simple scalar, the relative fit between the two. We return to explore this question in Section 5.
Based on these observations, we firstly study how to aggregate a collection of ratings into a representation which better reflects the ground truth, and further go on to consider evaluation metrics which measure the fit between the distribution of annotations and score distribution of a given model.
2.2 Human Disagreements in Annotations
Individual Annotation Uncertainty
Past discussions of disagreement on STS have mostly focused on uncertainty stemming from an individual annotator and the noisiness of the data collection process.
They tend to attribute an outlier label to “inattentive” raters.
This has led to the design of annotation processes to control the reliability of individual ratings and achieve high inter-annotator agreement (Wang et al., 2018).
However, disagreements persist.
Inherent Disagreements Among Humans
Studies in NLI have demonstrated that disagreements among annotations are reproducible signals (Pavlick and Kwiatkowski, 2019).
It has also been acknowledged that disagreement is an intrinsic property of subjective tasks (Nie et al., 2020; Wang et al., 2022c; Plank, 2022).
Despite this, most work in STS still has attributed high levels of disagreement to poor-quality data (Wang et al., 2022a), and has focused on reducing the uncertainty in STS modelling and providing reliable predictions (Wang et al., 2022b). Little attention has been paid to analysing the inherent underlying variation in STS annotations on a continuous rating scale, or how to fit the collective human opinions to a mathematical representation. Does a real value, Gaussian distribution, Gaussian mixture model, or a more complicated distribution most effectively approximate the latent truth?
The shortage of individual annotator labels in STS has been a critical obstacle to in-depth analysis of disagreements among human judgements, since only the averaged similarity scores are available to the public for almost all STS datasets, apart from two small-scale biomedical benchmarks with 0.1k and 1k examples, respectively. To this end, we first construct a large-scale STS corpus in this work with 4-19 annotators for each of almost 15k sentence pairs. We focus on analysing disagreements among annotators instead of the individual uncertainty, presuming that each individual rater is attentive under a quality-controlled annotation process.
2.3 Chinese STS Corpus
Most progress on STS, driven by large-scale investment in datasets and advances in pre-training, has centred around English.444English STS models have achieved , while for Chinese the best results are markedly lower at for STS-B test. Efforts to build comparable datasets for other languages have largely focused on (automatically) translating existing English STS datasets Huertas-García et al. (2021); Yang et al. (2019). However, this approach may come with biases (see Section 6). Our dataset is generated from Chinese rather than English sources, and we employ native Chinese speakers as annotators, producing the first large-scale Chinese STS dataset.555Apart from translated STS-B, there are only two Chinese corpora related to STS: BQ Chen et al. (2018) and LCQMC Liu et al. (2018) for paraphrase detection (binary).
3 Data Collection
We collected STS judgements from multiple annotators to estimate the distribution, for sentence pairs drawn from three multilingual sources. Sections 3.1 and 3.2 provide details of the collection, along with challenges in the annotation and how we ensure data quality. All data and annotations are available at https://github.com/yuxiaw/USTS.
3.1 Data Sources
The first step is to gather sentence pairs.
In response to rapid rises in STS performance and insights into the shortcomings of current models and limitations of existing datasets, we create a new corpus that not only incorporates inherent human disagreements in the gold label representation, but also includes more challenging examples, on which state-of-the-art STS models tend to make wrong predictions.
Common errors:
our analysis over general STS-B and clinical N2C2-STS exposes three major error types.
More than half of errors lie in subsets where human agreement is low.
High uncertainty in STS labelling leads to pervasive disagreement among human judgements.
Another is attributed to the lack of reasoning, as Nos. 1 and 3 in Table 2 reveal: (1) matching an abbreviation with its full name, e.g. Supreme Court to SC; and (2) building connections between descriptions that are lexically divergent but semantically related, e.g. carrot and orange food. The other is the failure to distinguish pairs with high lexical overlap but opposite meaning, due to word substitution or reordering.
However, these types of examples account for only a tiny proportion of existing test sets and have minimal impact on results. Thus, our goal is to gather more cases of high ambiguity, requiring reasoning abilities and more semantic attention in annotation.
As our data sources, we use sentences from TED talks, and sentence pairs from NLI and paraphrase corpora, as detailed below. The combined dataset contains 14,951 pairs, which we perform basic data cleaning over to remove repeated punctuation marks (e.g. multiple quotation marks, dashes, or blank spaces).
3.1.1 TED-X
Compared to written texts such as essays, spoken texts are more spontaneous and typically less formal Clark (2002). Without any contextual cues such as prosody or multi-modality to help interpret utterances, readers may have trouble understanding, especially for single sentences out of context Chafe (1994), resulting in high uncertainty in labelling. We therefore choose TED speech transcriptions to gather high-ambiguity examples.
Selecting Single Sentences
TED2020 contains a crawl of nearly 4000 TED and TED-X transcripts, translated into more than 100 languages. Sentences are aligned to create a parallel corpus Reimers and Gurevych (2020). We extracted 157,047 sentences for zh-cn with character length ranging between 20 and 100, and aligned it with the other 8 languages of en, de, es, fr, it, ja, ko, ru, and traditional zh.
Pairing by Retrieval
Sentence pairs generated by random sampling are prone to be semantically distant. To avoid pairs with similarity scores overwhelmingly distributed in the range , we use embedding-based retrieval. For each sentence, we search for the two most similar sentences based on faiss Johnson et al. (2017) using the SimCSE sentence embedding of sup-simcse-bert-base-uncased Gao et al. (2021), obtaining 155,659 pairs after deduplication.666Note that we base this on the English versions of each sentence, due to the higher availability of pre-trained language models and sentence encoders for English. That is, we use (approximate) cosine similarity based on contextualised sentence embeddings instead of the surface string-based measures of previous work to sample sentence pairs. This is expected to find pairs with a higher level of semantic overlap, rather than some minimal level of lexical match.
| Score | Description |
| 5 | The two sentences are completely equivalent, as they mean the same thing. |
| 4 | The two sentences are mostly equivalent, but some unimportant details differ. |
| 3 | The two sentences are roughly equivalent, but some important information differs/missing. |
| 2 | The two sentences are not equivalent, but share some details. |
| 1 | The two sentences are not equivalent, but are on the same topic. |
| 0 | The two sentences are completely dissimilar. |
Selecting Low-agreement Examples
To select what we expect to be examples with low agreement, we leverage the observation that high-variance examples tend to be associated with low human agreement (Nie et al., 2020). That is, we keep pairs with large predictive variance, and predictions that differ greatly between two agents.
We use a bert-base-uncased-based STS model fine-tuned on the STS-B training data for prediction. We obtain the mean and standard deviation for each example from sub-networks based on MC-Dropout, where is re-scaled to the same magnitude as the normalised using SimCSE embedding , and is the word-level length of the English sentence. We then select instances which satisfy the three criteria: (1) ; (2) ; and (3) .777We tuned these threshold values empirically, until the majority of sampled instances fell into the range — the score interval most associated with ambiguous instances. This results in 9,462 sentence pairs.
3.1.2 XNLI
Though sentence pairs from SICK-R and UNLI (Chen et al., 2020) are annotated with entailment and contradiction relations and also continuous labels, they don’t specifically address semantic equivalence: the scores in SICK-R reflect semantic relatedness rather than similarity, and in UNLI the annotators were asked to estimate how likely the situation described in the hypothesis sentence would be true given the premise.
We use sentence pairs from Cross-lingual NLI (XNLI: Conneau et al. (2018)) where there is label disagreement (which we hypothesise reflects ambiguity), noting that the dataset was annotated for textual entailment in en, and translated into 14 languages: fr, es, de, el, bg, ru, tr, ar, vi, th, zh, hi, sw and ur. From the development (2,490) and test sets (5,010), we select examples where there is not full annotation agreement among the five annotators, resulting in 3,259 sentence pairs (1,097 dev and 2,162 test).
3.1.3 PAWS-X
3.2 Annotation
We employ four professional human annotators (all Chinese native speakers) to assign labels to the 14,951 Chinese sentence pairs in the first round, and an additional 15 annotators to provide additional annotations for 6,051 examples of low human agreement (as detailed below).
Annotation Guideline
Table 2 shows the 6-point ordinal similarity scale we use, plus definitions.
Quality Control
It is difficult to ensure that any divergences in annotations are more likely due to task subjectivity or language ambiguity than inattentiveness. We attempt to achieve this by not using crowdsourced workers, but instead training up in-house professional annotators with expert-level knowledge in Linguistics, and significant experience in data labelling. They were first required to study the annotation guidelines and exemplars, and then asked to annotate up to 15 instances of high-agreement pre-selected from the STS-B training set. For each example, the annotation is regarded to be correct when the difference between the assigned and gold-standard label is 0.5. Failing this, the annotator is provided with the correct label and asked to annotated another instance.
This procedure was iterated for three rounds to familiarize the annotators with the task. On completion of the training, we only retain annotators who achieve a cumulative accuracy of 75%.
3.3 Analysis of First-round Annotations
Dataset breakdown
Table 3 shows the breakdown of instances across the three component sets, as well as the combined USTS dataset. In terms of average length (zh character level), XNLI is the shortest on average (esp. for S2, the hypothesis), followed by TED-X and PAWS-X.
Inter-annotator agreement
The average Pearson () and Spearman () correlation between the six pairings of annotators, and standard deviation () among the four annotators, are , , . These numbers reflect the fact that there is high disagreement for a substantial number of instances in USTS, in line with the sampling criteria used to construct the dataset. As such, aggregating ratings by averaging is not able to capture the true nature of much of the data. Two questions naturally arise: (1) at what level of variance does averaging noticeably bias the gold label? and (2) how should annotations be aggregated to fit the latent truth most closely?
| Source | TED-X | XNLI | PAWS-X | USTS |
| Amount | ||||
| raw | 9462 | 3259 | 2230 | 14951 |
| 3458 | 1597 | 996 | 6051 | |
| ratio | 36.5% | 49.0% | 44.7% | 40.5% |
| Length | ||||
| S1 | 39.0 | 34.0 | 43.5 | 38.6 |
| S2 | 39.2 | 16.9 | 43.3 | 34.9 |
| pair | 39.1 | 25.4 | 43.4 | 36.8 |
| Raters | ||||
| 0.48 | 0.61 | 0.49 | 0.74 | |
| 0.50 | 0.58 | 0.41 | 0.68 | |
| 0.44 | 0.52 | 0.49 | 0.47 | |
| STSb-zh | ||||
| 0.41 | 0.48 | 0.32 | 0.70 | |
| 0.43 | 0.50 | 0.18 | 0.63 | |
| 0.21 | 0.22 | 0.19 | 0.21 |
High vs. Low agreement
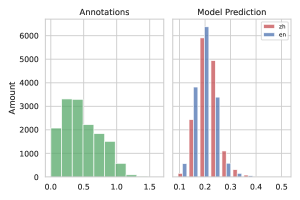
Figure 1 shows the first-round variance distribution, wherein ranges from 0.0 to 1.5, with 8,900 pairs being less than 0.5. It indicates that on 60% examples, the assessments of four annotators fluctuate around the average score in a smaller range (0.0–0.5 on average), while the judgements of the remaining 6,051 pairs are spread out over a wider range (0.5–1.5).
We sample 100 examples and find that, when 0.5, generally more than 10 out of 15 annotators highly agree with each other. This basically satisfies the assumption that makes averaging less biased: individual ratings do not vary significantly (Lee et al., 2005). While less than half annotators reach consensus when 0.7, and less than 5 when 1.0 (referring back to our earlier examples in Table 2). Thus, we heuristically regard =0.5 as a tipping point for distinguishing examples of low () and high agreement ().
Accordingly, we split the data into two subsets, reflecting the different levels of disagreement: cases where are uncontroversial (USTS-U); and cases where are contentious (USTS-C).
Does the model agree with the annotators?
We take bert-base-chinese and fine-tune it on the Chinese STS-B training data888Chinese STS-B has 5,231, 1,458 and 1,361 examples for training, validation and test, respectively; see https://github.com/pluto-junzeng/CNSD with a learning rate of 2e-5 for 3 epochs, obtaining / on the validation set, and / on the test set; we refer to this model as “STSb-zh”. We compute and between the model prediction and each of the four annotations, and present the average results in Table 3.
Both and across TED-X, XNLI, and PAWS-X are below 0.5, with PAWS-X being particularly bad with half of the pairs being predicted to be in the range . Predictions of USTS are primarily concentrated in the range , when majority annotations are in the range
This suggests it is non-trivial for current models to perform well without training on USTS, and models tend to over-assign high scores (Figure 1: predictive is vs. annotator ). However, it also leads us to consider whether the distribution estimated based on the four annotators is adequate to generate a gold standard. To this end, we investigate the question How does the collective distribution vary when increasing the number of annotators, on cases of uncontroversial USTS-U and contentious USTS-C?
3.4 Collective Distribution Analysis
We measure the distributional variation through (1) fluctuation of and ; and (2) distributional divergence between first-round and second-round annotators.
Study design: we sample 100 instances from USTS-U and 100 from USTS-C, with a ratio of 4:3:3 from TED-X, XNLI, and PAWS-X, resp. We then had another 15 qualified Chinese native annotators score the 200 Chinese sentence pairs.
Formally, the annotation matrix represents a data set with examples annotated by annotators. In our setting, and for both USTS-U and USTS-C. We capture the variation of and over 100 examples by averaging =mean(A[:,:i], axis=1) and =std(A[:,:i], axis=1), where ranges from 4 to 19, incorporating the new ratings incrementally.
The collective distribution for the first-round annotation A[:,:4] is denoted as , and for A[:,4:4+j] as we add new annotators. We observe the KL-Divergence as we increase .
Hypothesis: We hypothesise that the distribution will remain stable regardless of the number of annotators on the uncontroversial USTS-U, but change substantially on the contentious USTS-C.
Results: To plot the value of and in the same figure, we re-scale by subtracting in Figure 2. We find that with an increased number of annotators, of USTS-U remains stable with minor perturbations, while of USTS-C declines and steadily flattens out.
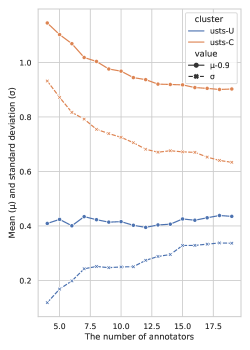
On USTS-U, ascends slowly and converges to 0.3. This matches our expectation that increasing annotators will result in more variance. Yet it still varies in the range due to the high certainty of the uncontroversial examples. In contrast, of USTS-C stays consistently high, indicating that there are still strong disagreements even with more annotators, because of the inherent ambiguity of contentious cases. It fluctuates in a larger range of , with a steeper drop. That is, combining more ratings results in large variations in and for USTS-C, but less for USTS-U.
Therefore, the distribution obtained from four annotators is adequate for uncontroversial examples, but insufficient for USTS-C: more annotators are needed to gain a representative distribution.
How many annotators should be employed?
In Figure 2, and of USTS-C vary substantially before , then stabilise. The trend of KL-Divergence in Table 4 demonstrates the same phenomenon: KL declines as the number of annotators increases, with a relatively small and stable divergence when . Combining these two, we employ 15 extra annotators to score the 6,051 cases for USTS-C in the second-round annotation.
| 4 | 6 | 8 | 10 | 14 | 15 | |
| USTS-U | 4.26 | 2.58 | 0.98 | 1.03 | 0.91 | 0.93 |
| USTS-C | 12.83 | 5.08 | 5.45 | 3.51 | 2.99 | 2.82 |
| # | Annotators | |||||
| STS-B | 8,085 | 5 | 0.0–5.0 | – | – | – |
| USTS-U | 8,900 | 4 | 0.0–5.0 | 0.27 | 0.91 | 0.73 |
| USTS-C | 6,051 | 19 | 0.2–4.4 | 0.56 | 0.72 | 0.63 |
First-round vs. second-round:
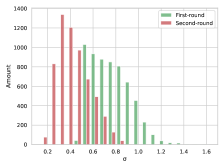
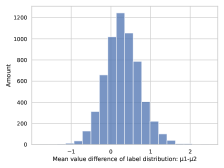
We compare and between the first-round (in green) and second-round (in red) annotations in Figure 3 (top). The shape of the distributions is very similar, but the green bars () move towards the right by 0.3 or so, with respect to the red bars (), leading to the average =0.42 =0.76. This indicates that the second-round distribution is more stable, with less overall variance. Nonetheless, 87% of pairs exceed the average deviation of 0.27 for USTS-U, reflecting the higher number of disagreements. Additionally, the distribution of in Figure 3 (bottom) is close to a normal distribution, within the range of . The majority are to the right of zero, indicating that annotators in the first round tend to assign higher scores than in the second, resulting in a larger .
3.5 The Resulting Corpus
USTS-U vs. USTS-C The number of examples in USTS-U and USTS-C is 8,900 and 6,051, respectively, with largely comparable range of and (see Table 5). USTS-U has a much smaller of 0.27 than USTS-C (), consistent with their inherent uncertainty level. Analogously, USTS-U has a higher correlation of among annotators, compared to for USTS-C.
4 Aggregation of Human Judgements
For the high-agreement cases of USTS-U, gold labels can be approximated by aggregating multiple annotations into either a scalar or a single Gaussian distribution. However, for low-agreement examples, how to aggregate the human ratings remains an open question.
Are all distributions unimodal Gaussian? Though most distributions of human assessments can be assumed to be sampled from an underlying (generative) distribution defined by a single Gaussian, we observed judgements that a unimodal Gaussian struggles to fit. The annotations of examples Nos. 2 and 3 in Figure 4 exhibit clear bi- or tri-modal distributions. How often, then, and to what extent do multimodal distributions fit better?
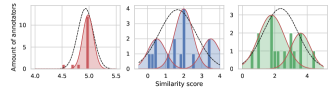
We answer this question by fitting human judgements using a Gaussian Mixture Model (GMM), where the number of components is selected during training. This means the model can still choose to fit the distribution with only one Gaussian component where appropriate. If additional components yield a better fit to the judgements, i.e. larger log likelihood is observed than using a unimodal distribution, we consider the human judgements to exhibit a multimodal distribution.
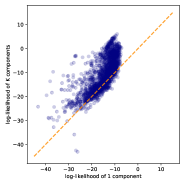
Experiments and Results We randomly split USTS-C into a training (4,051) and test set (2,000), and use the training data to fit a GMM with: (1) one component; or (2) the optimal number of components . We compute the log likelihood assigned to each example in the test set in Figure 5 (left), with the unimodal results as the -axis and multimodal Gaussian as the -axis. The majority of points fall on or above the diagonal line (), with a multimodal distribution outperforming a unimodal Gaussian distribution for 83% of instances. However, does this suggest that most examples exhibit multiple peaks?
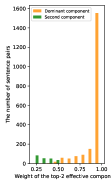
Effective components: We count the effective components for each sentence pair based on the weight assigned by the GMM in form of a probability for each component. We see that, for 11.3% of pairs, there is a nontrivial second component (weight), and a third component on 3 pairs. Rarely are there more than three components with significant weights (see Table 6). Moreover, we find that the weight of the dominant component mostly (87%) distributes over 0.8, and that the weight of the second effective component scatters across the range 0.25–0.5 (the right of Figure 5). This reveals that the GMM does not frequently use more than one effective component, with much lower weights on the second or third components. The majority of held-out human judgements fit a unimodal distribution well.
| Testing | Train | ||||||
| K | amount | prop(%) | amount | prop | |||
| 1 | 1772 | 88.6 | 0.55 | 3755 | 92.7 | 0.48 | |
| 2 | 225 | 11.3 | 0.63 | 294 | 7.3 | 0.50 | |
| 3 | 3 | 0.0 | 0.39 | 2 | 0.0 | 0.66 | |
Gold Labels: Given that a minority of instances in USTS-C are bimodally distributed, and that even for these instances, the weight on the second components is low, we conservatively use a single Gaussian to aggregate human judgements for all cases in this work.
5 Analysis of Model Predictions
Most STS models predict a pointwise similarity score rather than of a distribution over values. Wang et al. (2022b) estimated the uncertainty for continuous labels by MC-Dropout and Gaussian process regression (GPR). However, due to the lack of gold distributions, they only evaluate outputs using expected calibration error (ECE) and negative log-probability density (NLPD), assessing the predictive reliability. It’s unknown whether these uncertainty-aware models mimic human disagreements, i.e. the predicted deviation reflects the variance of human judgements.
To explore this, we experiment over USTS and incorporate distributional divergence (i.e. Kullback-Leibler Divergence; “KL”) into the evaluation, to observe the fit between the distribution of collective human judgements and the model predictive probability. We also examine the ability of different models to capture the averaged score for low-agreement cases, and whether a well-calibrated model fits the distribution of annotations better.
Evaluation Metrics:
For singular values, STS accuracy is generally evaluated with Pearson correlation () and Spearman rank correlation (), measuring the linear correlation between model outputs and the average annotation, the degree of monotonicity under ranking, respectively.
For uncertainty-aware outputs, ECE and NLPD can be used to assess model reliability in the absence of gold distributions. ECE measures whether the estimated predictive confidence is aligned with the empirical correctness likelihoods. A well-calibrated model should be less confident on erroneous predictions and more confident on correct ones. NLPD penalises over-confidence more strongly through logarithmic scaling, favouring under-confident models.
| STS-B | USTS-U | USTS-C | |||||||||||||||
| Model | ECE | NLPD | ECE | NLPD | KL | ECE | NLPD | KL | |||||||||
| SBERT-NLI | |||||||||||||||||
| (1) | SBERT-cosine | 0.714 | 0.718 | n/a | n/a | 0.597 | 0.383 | n/a | n/a | n/a | 0.572 | 0.442 | n/a | n/a | n/a | ||
| (2) | SBERT-GPR | 0.741 | 0.743 | 0.001 | 0.532 | 0.709 | 0.433 | 0.020 | 0.033 | 2.233 | 0.656 | 0.455 | 0.139 | 0.09 | 0.576 | ||
| Domain-specific | |||||||||||||||||
| (3) | BERT-lr | 0.808 | 0.804 | n/a | n/a | 0.855 | 0.700 | n/a | n/a | n/a | 0.806 | 0.707 | n/a | n/a | n/a | ||
| BERT-lr-MC | 0.811 | 0.805 | 0.167 | 4.709 | 0.856 | 0.703 | 0.054 | 1.079 | 4.587 | 0.809 | 0.708 | 0.046 | 0.442 | 6.073 | |||
| SBERT-cosine | 0.779 | 0.781 | n/a | n/a | 0.661 | 0.387 | n/a | n/a | n/a | 0.596 | 0.460 | n/a | n/a | n/a | |||
| SBERT-GPR | 0.780 | 0.782 | 0.053 | 0.917 | 0.683 | 0.388 | 0.137 | 0.651 | 3.050 | 0.606 | 0.444 | 0.415 | 0.717 | 0.950 | |||
| Domain-generalised | |||||||||||||||||
| (4) | BERT-lr | 0.815 | 0.813 | n/a | n/a | 0.860 | 0.692 | n/a | n/a | n/a | 0.835 | 0.768 | n/a | n/a | n/a | ||
| BERT-lr-MC | 0.814 | 0.811 | 0.179 | 5.865 | 0.861 | 0.697 | 0.060 | 0.898 | 4.434 | 0.838 | 0.774 | 0.278 | 0.702 | 5.401 | |||
| SBERT-cosine | 0.772 | 0.772 | n/a | n/a | 0.686 | 0.435 | n/a | n/a | n/a | 0.670 | 0.523 | n/a | n/a | n/a | |||
| SBERT-GPR | 0.772 | 0.775 | 0.017 | 0.645 | 0.707 | 0.433 | 0.098 | 0.268 | 2.578 | 0.674 | 0.497 | 0.157 | 0.04 | 0.955 | |||
| Cross-domain | |||||||||||||||||
| (5) | BERT-lr | 0.675 | 0.667 | n/a | n/a | 0.754 | 0.650 | n/a | n/a | n/a | 0.725 | 0.676 | n/a | n/a | n/a | ||
| BERT-lr-MC | 0.678 | 0.671 | 0.348 | 12.90 | 0.755 | 0.695 | 1.296 | 10.55 | 13.95 | 0.729 | 0.687 | 1.298 | 8.956 | 12.62 | |||
| SBERT-cosine | 0.695 | 0.692 | n/a | n/a | 0.647 | 0.449 | n/a | n/a | n/a | 0.606 | 0.481 | n/a | n/a | n/a | |||
| SBERT-GPR | 0.726 | 0.726 | 0.001 | 0.555 | 0.723 | 0.481 | 0.020 | 0.012 | 2.215 | 0.675 | 0.494 | 0.148 | 0.11 | 0.555 | |||
5.1 Models and Setup
BERT with Two-layer MLP:
The hidden state from the last-layer hidden state of BERT CLS token Devlin et al. (2019) is passed through a two-layer MLP with activation function. We refer to this model as BERT-lr when making deterministic predictions, and BERT-lr-MC when using MC-Dropout Gal and Ghahramani (2016) for uncertainty estimation.
SBERT with GPR:
In contrast with end-to-end training, sparse GPR is applied to estimate distributions, taking encoded sentences from Sentence-BERT (SBERT: Reimers and Gurevych (2019)) as input. We also calculate the cosine similarity between S1 and S2 using SBERT, as a non-Bayesian counterpart.
Setup:
bert-base-chinese is used with input format [CLS] S1 [SEP] S2 [SEP] for text pair , implemented based on the hugging-face Transformer framework. We fine-tune SBERT separately over each STS corpus based on bert-base-chinese-nli, using the same configuration as the original paper. We use the concatenation of the embeddings , along with their absolute difference and element-wise multiplication to represent a sentence pair, implemented in pyro.999https://pyro.ai/
We evaluate STS-B, USTS-U, and USTS-C under five training settings, as presented in Table 7:
-
1.
Zero-shot: SBERT with no tuning;
-
2.
GPR trained on sbert-nli;
-
3.
Domain-specific: fine-tuned on each dataset separately;
-
4.
Domain-generalised: fine-tuned using the three datasets combined;
-
5.
Cross-domain: train with STS-B training data for USTS-U and USTS-C, and with USTS for STS-B.
5.2 Results and Analysis
USTS is challenging. In setting (1) of Table 7, purely depending on pre-trained semantic representation and cosine similarity, correlations over USTS-U and USTS-C are much lower than STS-B. This suggests that USTS is a challenging dataset, but can be learned. USTS-U in particular achieves large improvements in performance after domain-specific training in experiments (3)–(4).
Critical differences exist between model outputs and human annotations. The models can capture average opinion, resulting in reasonable / between the predicted target value and the averaged annotations. However, they cannot capture the variance of human opinions. To quantify how well the predicted variance captures the variance of human judgements, we analyse the outputs of the top-2 settings: BERT-lr-MC from setting (4) and SBERT-GPR from setting (5), for USTS-U and USTS-C. We compute the correlation and between and in Table 8, and visualise the with increasing human disagreement in Figure 6.
| USTS-U (=0.26) | USTS-C (=0.56) | ||||||
| Model | |||||||
| (4) BERT-lr-MC | 0.13 | 0.12 | 0.19 | 0.24 | 0.23 | 0.20 | |
| (5) SBERT-GPR | 0.07 | 0.06 | 0.67 | 0.05 | 0.06 | 0.54 | |
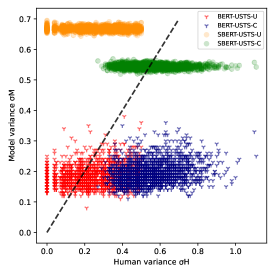
There is no apparent correlation between and . A given model displays similar deviation regardless of the relative amount of human disagreement. Different models concentrate on different parts of the spectrum, e.g. BERT-lr-MC is distributed in the range while SBERT-GPR is distributed in the range , and neither follows the line of . This suggests that the uncertainty captured by current models is not the uncertainty underlying human disagreements. Rather it may reflect the model’s predictive confidence on the data set as a whole. This finding is not surprising since none of the models are optimised to capture collective human opinions, but suggests an important direction for future improvement.
Being trustworthy is orthogonal to being accurate. We see that ECE and NLPD do not mirror the results for / and distributional divergence KL. This implies the ability required to improve model reliability differs from that required to perform accurately, regardless of whether a target value or a target distribution is predicted.
Low human-agreement USTS is detrimental to training sentence embeddings. Comparing the performance of experiment settings (2) and (5) in Table 7, tuning SBERT on USTS hurts results over STS-B across the board, while training on STS-B benefits both USTS-U and USTS-C. We speculate that the examples in USTS with larger annotator variance are more ambiguous than STS-B. Forcing networks to learn from high-ambiguity signals may inhibit generalisation, resulting in worse representations.
Discussion For instances of high disagreement, neither a scalar nor a single Gaussian fits a set of observed judgements adequately. As a direction for future work, we suggest exploring the direct estimation of individual ratings (e.g. by few-shot prompt-based prediction) and evaluating against the raw collective opinions. This could circumvent the ineffective training and evaluation caused by aggregation.
6 Multilingual USTS
Before extending USTS into a multilingual benchmark, we question the validity of previous approaches involving direct transfer of annotations collected for one language to other languages Liu et al. (2021); Yang et al. (2019). This strategy assumes that the nuanced semantics of the component sentences is not changed under translation, and hence the label will be identical. To test whether this assumption is reasonable, we analyse the impact of language on the annotations, and discuss whether such ratings are transferable across languages.
Specifically, we establish whether the label distribution varies based on language, and how annotator proficiency affects the distribution given the same text.
Collecting Labels
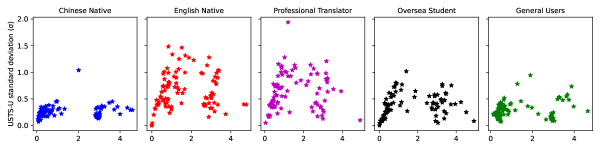
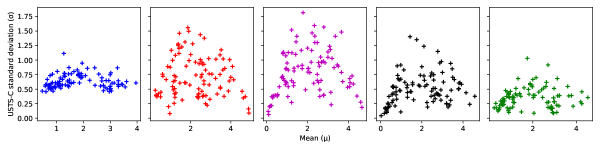
Taking English as a pivot language, we employ native English speakers (“NT”) and bilingual raters whose mother language is Mandarin Chinese, including 5 professional translators (“PT”), 5 overseas students (“OS”), and 5 general users (“GU”). Each annotator assigns labels to 100 examples sampled from each of USTS-U and USTS-C (the same data set used in Section 3.4), which have been manually post-edited by professional translators to ensure content alignment.
Results
We average the KL between collective distributions drawn from 19 raters given zh text, and 5 native English speakers (NT) given en text. Table 9 shows there is not a substantial distributional divergence. Differences decline further as annotations of the other three groups of bilingual raters are incorporated.
| en-rater | NT | +PT | +OS | +GU |
| USTS-U | 0.69 | 0.67 | 0.53 | 0.38 |
| USTS-C | 0.94 | 0.78 | 0.73 | 0.68 |
Detailed analysis of distributions across each of these groups (Figure 7) reveals that the language of the text affects the distribution of human opinions. On both USTS-U and USTS-C, the distribution differs substantially between native Chinese speakers and native English speakers when given zh and en sentence pairs, respectively. While the zh annotations cluster in the lower region, those for en are dispersed across a large span.
Figure 7 also shows that the distribution of professional translators mirrors that of English natives, while general users differ substantially from both these groups, but are similar to native-speaker Chinese annotators who are given zh text. We suspect that translators make judgements based on the meaning of en text directly, but general users may use translation tools to translate en text back to zh to support their understanding, meaning they are in fact rating a Chinese text pair. Intermediate-level overseas students may mix strategies and thus are somewhere in between these two extremes.
Discussion The differences we observe may be attributed to bias introduced during manual translation. Each sentence in a pair is translated separately, so while a source pair may have lexical overlap, this may not carry over under independent translation. We examine this effect by calculating the word overlap similarity as Eq (1) for zh/en pairs, where and are whitespace-tokenised words for English and based on the jieba segment tool for Chinese. We calculate string similarity as:
| (1) |
As detailed in Table 10, the lexical overlap similarity for en and zh is similar for USTS-U and USTS-C, suggesting that inconsistencies under translation are not a primary cause of the observed discrepancy.
| lan | USTS-U | USTS-C | USTS |
| zh | 0.42 | 0.45 | 0.44 |
| en | 0.40 | 0.43 | 0.41 |
In summary
The language of the text impacts the distribution of human judgements. In our analysis, English results in higher-uncertainty labelling than Chinese, for both uncontroversial and contentious cases. This suggests that the previous assumption that labels remain identical across languages as long as the meaning of the text is kept the same, is potentially problematic, even though pairwise lexical overlap remains similar.
7 Discussion
We focus on the STS task in this work. However, the methods we propose can be transferred to other subjective textual regression tasks, such as sentiment analysis (SA) rating and machine translation quality estimation in the format of direct assessment (DA). Similar findings stemming from task subjectivity may be relevant to other types of NLP tasks relying on human annotation. High disagreement among annotators may occur due to ambiguous labelling, where it is challenging to compile guidelines that are widely accepted and consistently interpreted by all individual annotators.
In practice, it may be difficult to estimate the distribution of human annotations in instances where multiple annotators are difficult to source, such as occurs in clinical and biomedical STS due to the need for highly specialised knowledge. Transfer learning, which relies on patterns learned from general-purpose USTS, provides a means to predict such a distribution, if noisily. We propose to explore the direct estimation of individual ratings by in-context learning based on large language models (LLMs), e.g. GPT-3 (Brown et al., 2020) and ChatGPT.101010https://openai.com/blog/chatgpt LLMs are able to perform in-context learn — perform a new task via inference alone, by conditioning on a few labelled pairs as part of the input Min et al. (2022).
ChatGPT appears to be highly effective at style transfer and tailoring of content to specific audiences such as five-year old children or domain experts, through learning about language style and tone from interactional data and individual preferences. This allows it to generate more personalised responses (Aljanabi et al., 2023). Deshpande et al. (2023) show that assigning ChatGPT a persona through the parameter system-role, such as a bad/horrible person, can increase the toxicity of generated outputs up to sixfold.
Additionally, Schick and Schütze (2021) show that generative LLMs can be used to automatically generate labelled STS datasets using targeted instructions. This data can be utilised to improve the quality of sentence embeddings. Together, these imply that LLMs may have utility in generating personalised semantic similarity assessments, based on annotator meta data (e.g. age, educational background, or domain expertise).
Simulating variation in judgements between individual annotators using synthetic personalised ratings could mitigate ineffective training and evaluation caused by aggregation, given that neither a scalar nor a single Gaussian fits the set of observed judgements adequately for instances of high disagreement.
8 Conclusion
We presented the first uncertainty-aware STS corpus, consisting of 15k Chinese examples with more than 150k annotations. The dataset is intended to promote the development of STS systems from the perspective of capturing inherent disagreements in STS labelling, and establish less biased and more nuanced gold labels when large variances exist among individual ratings.
We additionally examine the models’ ability to capture the averaged opinion and the distribution of collective human judgements. Results show that the uncertainty captured by current models is not explained by the semantic uncertainty that results in disagreements among humans. Rather, it tends to reflect the predictive confidence over the whole data set. We also found that the text language and language proficiency of annotators affect labelling consistency.
Acknowledgements
We thank the anonymous reviewers and editors for their helpful comments, Yanqing Zhao, Samuel Luke Winfield D’Arcy, Yimeng Chen, Minghan Wang in Huawei TSC and NLP Group colleagues in The University of Melbourne for various discussions. Yuxia Wang is supported by scholarships from The University of Melbourne and China Scholarship Council (CSC).
References
- Agirre et al. (2015) Eneko Agirre, Carmen Banea, Claire Cardie, Daniel M. Cer, Mona T. Diab, Aitor Gonzalez-Agirre, Weiwei Guo, Iñigo Lopez-Gazpio, Montse Maritxalar, Rada Mihalcea, German Rigau, Larraitz Uria, and Janyce Wiebe. 2015. Semeval-2015 task 2: Semantic textual similarity, english, spanish and pilot on interpretability. In Proceedings of the 9th International Workshop on Semantic Evaluation, SemEval@NAACL-HLT 2015, Denver, Colorado, USA, June 4-5, 2015, pages 252–263. The Association for Computer Linguistics.
- Agirre et al. (2014) Eneko Agirre, Carmen Banea, Claire Cardie, Daniel M. Cer, Mona T. Diab, Aitor Gonzalez-Agirre, Weiwei Guo, Rada Mihalcea, German Rigau, and Janyce Wiebe. 2014. Semeval-2014 task 10: Multilingual semantic textual similarity. In Proceedings of the 8th International Workshop on Semantic Evaluation, SemEval@COLING 2014, Dublin, Ireland, August 23-24, 2014, pages 81–91. The Association for Computer Linguistics.
- Agirre et al. (2016) Eneko Agirre, Carmen Banea, Daniel M. Cer, Mona T. Diab, Aitor Gonzalez-Agirre, Rada Mihalcea, German Rigau, and Janyce Wiebe. 2016. Semeval-2016 task 1: Semantic textual similarity, monolingual and cross-lingual evaluation. In Proceedings of the 10th International Workshop on Semantic Evaluation, SemEval@NAACL-HLT 2016, San Diego, CA, USA, June 16-17, 2016, pages 497–511. The Association for Computer Linguistics.
- Agirre et al. (2013) Eneko Agirre, Daniel M. Cer, Mona T. Diab, Aitor Gonzalez-Agirre, and Weiwei Guo. 2013. *SEM 2013 shared task: Semantic textual similarity. In Proceedings of the Second Joint Conference on Lexical and Computational Semantics, pages 32–43. Association for Computational Linguistics.
- Agirre et al. (2012) Eneko Agirre, Mona Diab, Daniel Cer, and Aitor Gonzalez-Agirre. 2012. Semeval-2012 task 6: A pilot on semantic textual similarity. In Proceedings of the First Joint Conference on Lexical and Computational Semantics-Volume 1: Proceedings of the main conference and the shared task, and Volume 2: Proceedings of the Sixth International Workshop on Semantic Evaluation, pages 385–393. Association for Computational Linguistics.
- Aljanabi et al. (2023) Mohammad Aljanabi et al. 2023. Chatgpt: Future directions and open possibilities. Mesopotamian Journal of CyberSecurity, 2023:16–17.
- Barrón-Cedeño et al. (2010) Alberto Barrón-Cedeño, Paolo Rosso, Eneko Agirre, and Gorka Labaka. 2010. Plagiarism detection across distant language pairs. In Proceedings of the 23rd International Conference on Computational Linguistics, pages 37–45. Tsinghua University Press.
- Brown et al. (2020) Tom B. Brown, Benjamin Mann, Nick Ryder, Melanie Subbiah, Jared Kaplan, Prafulla Dhariwal, Arvind Neelakantan, Pranav Shyam, Girish Sastry, Amanda Askell, Sandhini Agarwal, Ariel Herbert-Voss, Gretchen Krueger, Tom Henighan, Rewon Child, Aditya Ramesh, Daniel M. Ziegler, Jeffrey Wu, Clemens Winter, Christopher Hesse, Mark Chen, Eric Sigler, Mateusz Litwin, Scott Gray, Benjamin Chess, Jack Clark, Christopher Berner, Sam McCandlish, Alec Radford, Ilya Sutskever, and Dario Amodei. 2020. Language models are few-shot learners. In Advances in Neural Information Processing Systems 33: Annual Conference on Neural Information Processing Systems 2020, NeurIPS 2020, December 6-12, 2020, virtual.
- Cer et al. (2017) Daniel Cer, Mona Diab, Eneko Agirre, Iñigo Lopez-Gazpio, and Lucia Specia. 2017. SemEval-2017 task 1: Semantic textual similarity multilingual and crosslingual focused evaluation. In Proceedings of the 11th International Workshop on Semantic Evaluation (SemEval-2017), pages 1–14, Vancouver, Canada.
- Chafe (1994) Wallace Chafe. 1994. Discourse, consciousness, and time: The flow and displacement of conscious experience in speaking and writing. University of Chicago Press.
- Chen et al. (2018) Jing Chen, Qingcai Chen, Xin Liu, Haijun Yang, Daohe Lu, and Buzhou Tang. 2018. The BQ corpus: A large-scale domain-specific Chinese corpus for sentence semantic equivalence identification. In Proceedings of the 2018 Conference on Empirical Methods in Natural Language Processing, pages 4946–4951, Brussels, Belgium. Association for Computational Linguistics.
- Chen et al. (2020) Tongfei Chen, Zhengping Jiang, Adam Poliak, Keisuke Sakaguchi, and Benjamin Van Durme. 2020. Uncertain natural language inference. In Proceedings of the 58th Annual Meeting of the Association for Computational Linguistics, pages 8772–8779, Online. Association for Computational Linguistics.
- Clark (2002) Herbert H Clark. 2002. Speaking in time. Speech communication, 36(1-2):5–13.
- Conneau et al. (2018) Alexis Conneau, Ruty Rinott, Guillaume Lample, Adina Williams, Samuel R. Bowman, Holger Schwenk, and Veselin Stoyanov. 2018. Xnli: Evaluating cross-lingual sentence representations. In Proceedings of the 2018 Conference on Empirical Methods in Natural Language Processing. Association for Computational Linguistics.
- Deshpande et al. (2023) Ameet Deshpande, Vishvak Murahari, Tanmay Rajpurohit, Ashwin Kalyan, and Karthik Narasimhan. 2023. Toxicity in chatgpt: Analyzing persona-assigned language models. arXiv preprint arXiv:2304.05335.
- Devlin et al. (2019) Jacob Devlin, Ming-Wei Chang, Kenton Lee, and Kristina Toutanova. 2019. BERT: Pre-training of deep bidirectional transformers for language understanding. In Proceedings of the 2019 Conference of the North American Chapter of the Association for Computational Linguistics: Human Language Technologies, Volume 1 (Long and Short Papers), pages 4171–4186, Minneapolis, Minnesota.
- Gal and Ghahramani (2016) Yarin Gal and Zoubin Ghahramani. 2016. Dropout as a Bayesian approximation: Representing model uncertainty in deep learning. In International Conference on Machine Learning, pages 1050–1059.
- Gao et al. (2021) Tianyu Gao, Xingcheng Yao, and Danqi Chen. 2021. SimCSE: Simple contrastive learning of sentence embeddings. In Proceedings of the 2021 Conference on Empirical Methods in Natural Language Processing, pages 6894–6910, Online and Punta Cana, Dominican Republic. Association for Computational Linguistics.
- Huertas-García et al. (2021) Álvaro Huertas-García, Javier Huertas-Tato, Alejandro Martín, and David Camacho. 2021. Countering misinformation through semantic-aware multilingual models. In Intelligent Data Engineering and Automated Learning – IDEAL 2021, pages 312–323, Cham. Springer International Publishing.
- Johnson et al. (2017) Jeff Johnson, Matthijs Douze, and Hervé Jégou. 2017. Billion-scale similarity search with GPUs. arXiv preprint arXiv:1702.08734.
- Lee et al. (2005) Michael D Lee, Brandon Pincombe, and Matthew Welsh. 2005. An empirical evaluation of models of text document similarity. In Proceedings of the Annual Meeting of the Cognitive Science Society.
- Liu et al. (2021) Fangyu Liu, Ivan Vulić, Anna Korhonen, and Nigel Collier. 2021. Learning domain-specialised representations for cross-lingual biomedical entity linking. In Proceedings of the 59th Annual Meeting of the Association for Computational Linguistics and the 11th International Joint Conference on Natural Language Processing (Volume 2: Short Papers), pages 565–574, Online. Association for Computational Linguistics.
- Liu et al. (2018) Xin Liu, Qingcai Chen, Chong Deng, Huajun Zeng, Jing Chen, Dongfang Li, and Buzhou Tang. 2018. LCQMC:a large-scale Chinese question matching corpus. In Proceedings of the 27th International Conference on Computational Linguistics, pages 1952–1962, Santa Fe, New Mexico, USA. Association for Computational Linguistics.
- Marelli et al. (2014) Marco Marelli, Luisa Bentivogli, Marco Baroni, Raffaella Bernardi, Stefano Menini, and Roberto Zamparelli. 2014. SemEval-2014 task 1: Evaluation of compositional distributional semantic models on full sentences through semantic relatedness and textual entailment. In Proceedings of the 8th International Workshop on Semantic Evaluation (SemEval 2014), pages 1–8, Dublin, Ireland. Association for Computational Linguistics.
- Matveeva et al. (2005) Irina Matveeva, G Levow, Ayman Farahat, and Christian Royer. 2005. Generalized latent semantic analysis for term representation. In Proc. of RANLP, page 149.
- Min et al. (2022) Sewon Min, Xinxi Lyu, Ari Holtzman, Mikel Artetxe, Mike Lewis, Hannaneh Hajishirzi, and Luke Zettlemoyer. 2022. Rethinking the role of demonstrations: What makes in-context learning work? In Proceedings of the 2022 Conference on Empirical Methods in Natural Language Processing, pages 11048–11064, Abu Dhabi, United Arab Emirates. Association for Computational Linguistics.
- Nie et al. (2020) Yixin Nie, Xiang Zhou, and Mohit Bansal. 2020. What can we learn from collective human opinions on natural language inference data? In Proceedings of the 2020 Conference on Empirical Methods in Natural Language Processing (EMNLP), pages 9131–9143, Online. Association for Computational Linguistics.
- Olmin and Lindsten (2022) Amanda Olmin and Fredrik Lindsten. 2022. Robustness and reliability when training with noisy labels. In International Conference on Artificial Intelligence and Statistics, pages 922–942. PMLR.
- Pavlick and Kwiatkowski (2019) Ellie Pavlick and Tom Kwiatkowski. 2019. Inherent disagreements in human textual inferences. Transactions of the Association for Computational Linguistics, 7:677–694.
- Plank (2022) Barbara Plank. 2022. The “problem” of human label variation: On ground truth in data, modeling and evaluation. In Proceedings of the 2022 Conference on Empirical Methods in Natural Language Processing, pages 10671–10682, Abu Dhabi, United Arab Emirates. Association for Computational Linguistics.
- Reimers and Gurevych (2019) Nils Reimers and Iryna Gurevych. 2019. Sentence-BERT: Sentence embeddings using Siamese BERT-networks. In Proceedings of the 2019 Conference on Empirical Methods in Natural Language Processing and the 9th International Joint Conference on Natural Language Processing (EMNLP-IJCNLP), pages 3982–3992, Hong Kong, China. Association for Computational Linguistics.
- Reimers and Gurevych (2020) Nils Reimers and Iryna Gurevych. 2020. Making monolingual sentence embeddings multilingual using knowledge distillation. In Proceedings of the 2020 Conference on Empirical Methods in Natural Language Processing. Association for Computational Linguistics.
- Resnik (1999) Philip Resnik. 1999. Semantic similarity in a taxonomy: An information-based measure and its application to problems of ambiguity in natural language. Journal of Artificial Intelligence Research, 11:95–130.
- Schick and Schütze (2021) Timo Schick and Hinrich Schütze. 2021. Generating datasets with pretrained language models. In Proceedings of the 2021 Conference on Empirical Methods in Natural Language Processing, pages 6943–6951, Online and Punta Cana, Dominican Republic. Association for Computational Linguistics.
- Soğancıoğlu et al. (2017) Gizem Soğancıoğlu, Hakime Öztürk, and Arzucan Özgür. 2017. BIOSSES: a semantic sentence similarity estimation system for the biomedical domain. Bioinformatics, 33(14):i49–i58.
- Trask and Trask (1999) Robert Lawrence Trask and Robert Lawrence Trask. 1999. Key concepts in language and linguistics. Psychology Press.
- Wang et al. (2018) Yanshan Wang, Naveed Afzal, Sunyang Fu, Liwei Wang, Feichen Shen, Majid Rastegar-Mojarad, and Hongfang Liu. 2018. MedSTS: a resource for clinical semantic textual similarity. Language Resources and Evaluation, pages 1–16.
- Wang et al. (2020) Yanshan Wang, Sunyang Fu, Feichen Shen, Sam Henry, Ozlem Uzuner, and Hongfang Liu. 2020. The 2019 n2c2/ohnlp track on clinical semantic textual similarity: Overview. JMIR Med Inform, 8(11).
- Wang et al. (2022a) Yuxia Wang, Timothy Baldwin, and Karin Verspoor. 2022a. Noisy label regularisation for textual regression. In Proceedings of the 29th International Conference on Computational Linguistics, pages 4228–4240, Gyeongju, Republic of Korea. International Committee on Computational Linguistics.
- Wang et al. (2022b) Yuxia Wang, Daniel Beck, Timothy Baldwin, and Karin Verspoor. 2022b. Uncertainty estimation and reduction of pre-trained models for text regression. Transactions of the Association for Computational Linguistics, 10:1–17.
- Wang et al. (2022c) Yuxia Wang, Minghan Wang, Yimeng Chen, Shimin Tao, Jiaxin Guo, Chang Su, Min Zhang, and Hao Yang. 2022c. Capture human disagreement distributions by calibrated networks for natural language inference. In Findings of the Association for Computational Linguistics: ACL 2022, pages 1524–1535, Dublin, Ireland. Association for Computational Linguistics.
- Yang et al. (2019) Yinfei Yang, Yuan Zhang, Chris Tar, and Jason Baldridge. 2019. PAWS-X: A cross-lingual adversarial dataset for paraphrase identification. In Proceedings of the 2019 Conference on Empirical Methods in Natural Language Processing and the 9th International Joint Conference on Natural Language Processing (EMNLP-IJCNLP), pages 3687–3692, Hong Kong, China. Association for Computational Linguistics.
- Zhang et al. (2019) Yuan Zhang, Jason Baldridge, and Luheng He. 2019. PAWS: Paraphrase adversaries from word scrambling. In Proceedings of the 2019 Conference of the North American Chapter of the Association for Computational Linguistics: Human Language Technologies, Volume 1 (Long and Short Papers), pages 1298–1308, Minneapolis, Minnesota. Association for Computational Linguistics.