KDK collaboration
Precision measurement of 65Zn electron-capture decays with the KDK coincidence setup
Abstract
65Zn is a common calibration source, moreover used as a radioactive tracer in medical and biological studies. In many cases, -spectroscopy is a preferred method of 65Zn standardization, which relies directly on the branching ratio of via electron capture (EC∗). We measure the relative intensity of this branch to that proceeding directly to the ground state (EC0) using a novel coincidence technique, finding . Re-evaluating the decay scheme of 65Zn by adopting the commonly evaluated branching ratio of we obtain , and . The associated gamma intensity agrees with the previously reported NNDC value, and is now accessible with a factor of 2 increase in precision. Our re-evaluation removes reliance on the deduction of this gamma intensity from numerous measurements, some of which disagree and depend directly on total activity determination. The KDK experimental technique provides a new avenue for verification or updates to the decay scheme of 65Zn, and is applicable to other isotopes.
I Introduction
65Zn is a common -ray calibration source [1], and for nearly a century has been applied in the fields of medicine and biology as a radioactive tracer [2, 3, 4]. It has been applied in various studies [5, 6] including an investigation of potential orbital-modulation effects on decay constants [7].
In many applications, -ray spectroscopy is a convenient avenue for activity determination of 65Zn, which is an emitter of essentially monoenergetic rays () associated with some of its electron capture (EC) decays. This technique relies on knowledge of the absolute intensity (fraction of decays that emit s), available from existing decay scheme evaluations such as those by the Laboratoire National Henri Becquerel (LNHB) [8] or National Nuclear Data Center (NNDC) [9]. Though both evaluations report with relative errors of , values (Table 1) deviate by between the two sources. These evaluations combine dedicated measurements from the Euromet-721 exercise [10, 11] with other reported values (e.g. from Refs. [12, 13]). All such determinations of absolute intensity are directly reliant on activity measurements, which may require various corrections; though the commonly used technique is influenced by low-energy X and Auger radiation when used with EC-decaying nuclides [14], such corrections have only been applied in some 65Zn studies [11].
| (%) | |
|---|---|
| LNHB (2006) [8] | |
| NNDC (2010) [9] |
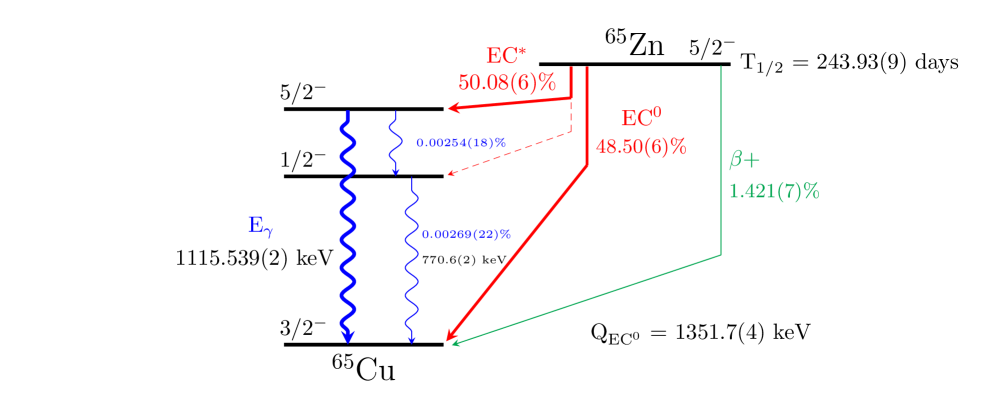
In this work, we present a novel measurement and resulting alternate, precise determination of through re-evaluation of the decay scheme of 65Zn. Using data from the KDK experiment [15, 16], -producing electron capture decays (EC∗) of 65Zn are distinguished from those proceeding directly to the ground state (EC0) of its Cu daughter. The KDK collaboration has recently employed this technique to obtain the first measurement of the exceedingly rare EC0 decay of 40K [17, 18]. The measurement of this work obtains a ratio of 65Zn intensities, . The decay scheme of 65Zn, evaluated with our measurement, is displayed in Fig. 1.
II Methods
The KDK apparatus was designed for the discrimination between electron capture branches proceeding through an excited daughter state to those transitioning directly to the ground state. Below, we briefly outline the experimental setup, which has been fully characterized elsewhere [16], with focus on features visible in the 65Zn data and subsequently all physical processes relevant for obtaining a measurement of / .
II.1 Apparatus and Visible Features
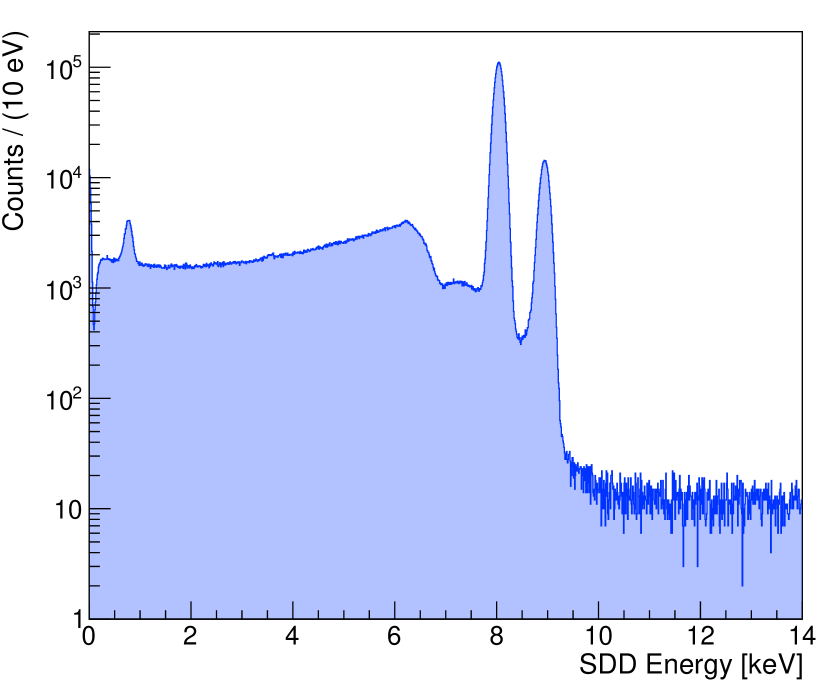
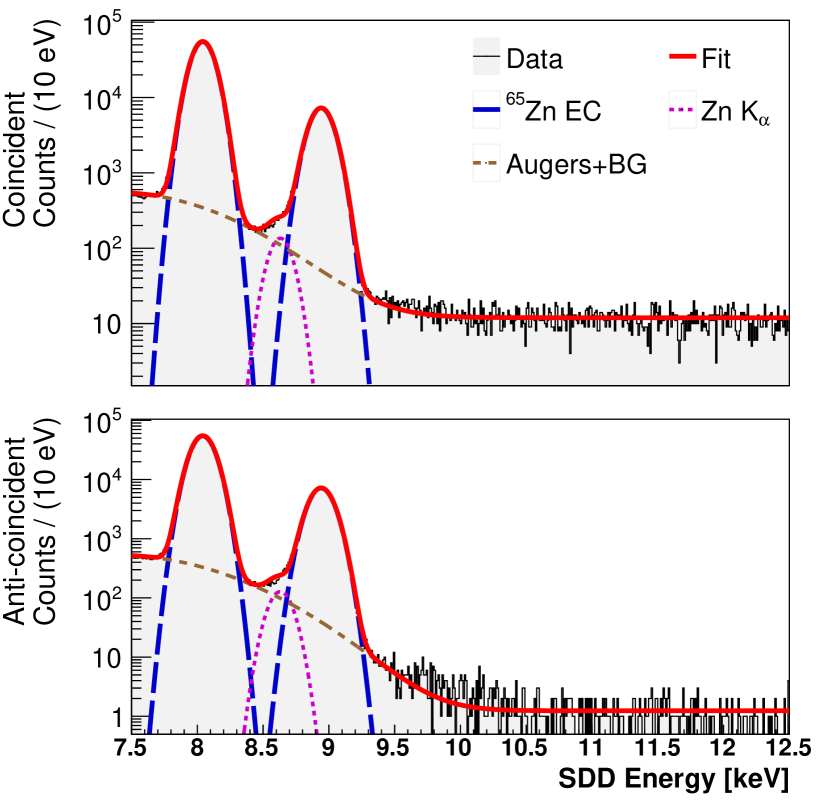
An inner Silicon Drift Detector (SDD) tags X-rays accompanying the source EC decays of interest, as shown in Fig. 2. Due to its excellent resolution (FWHM of at ), the Cu Kα () and Kβ () X-rays of interest are easily distinguishable. In the same region, the majority of remaining counts are attributed to K Augers from the same electron captures, and a flat background originating primarily from the source branch. Below the signal (Cu) peaks, a small contribution from Zn Kα X-ray fluorescence () is included when fitting SDD spectra, as shown further. Moreover, due to the low noise threshold of the detector, L-shell X-rays (Cu, or fluoresced Zn) are visible near .
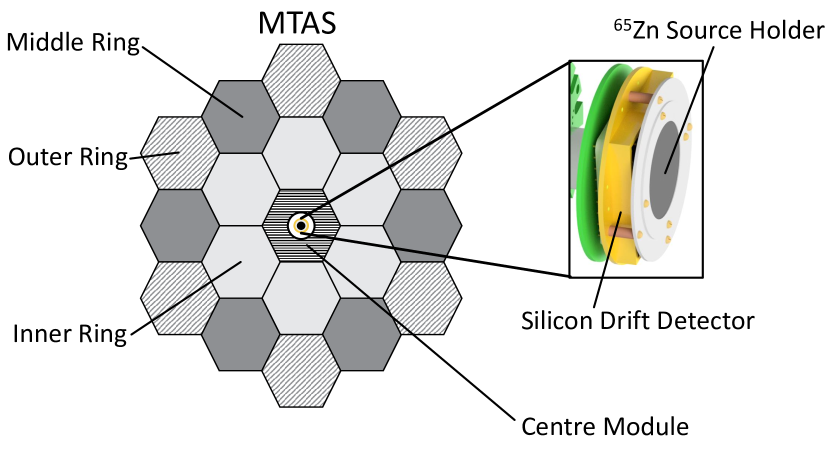
The 65Zn source and SDD are centered inside a large, outer Modular Total Absorption Spectrometer (MTAS) as depicted in Fig. 3. MTAS is an extremely efficient NaI(Tl) -tagger, originally designed to study -strength distributions of fission products [21, 22]. For the 65Zn of interest (), MTAS boasts a tagging efficiency [16].
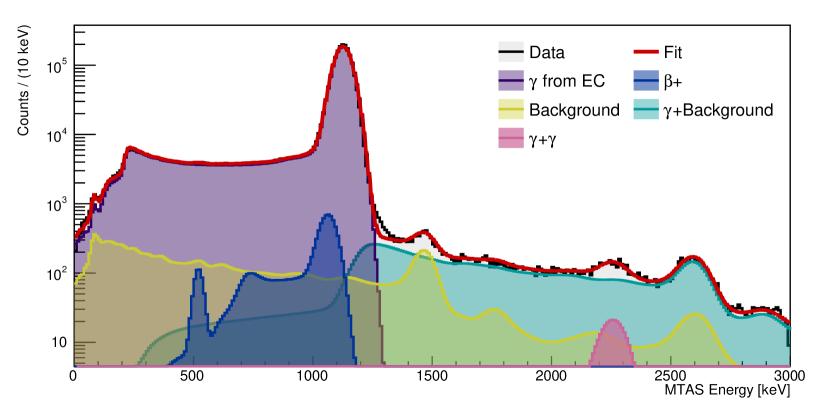
Several processes are visible in 65Zn MTAS spectra, such as those in Fig. 4. Fully collected s from 65Zn EC∗ decays form the most-prominent peak, though others originating from the natural MTAS background along with source+background and source+source sum-peaks are visible. The data is fit with calibrated, simulated spectra of 65Zn s and in MTAS, along with a measured MTAS background and convolutions. The shape of each spectrum is fixed, while the integral is allowed to vary. Such spectral analysis verifies simulation methods used to obtain MTAS efficiencies, and has been used to explore the source-SDD geometry (Ref. [16] and App. B.2).
SDD data, including the K X-ray electron-capture signal of interest, are categorized by coincidence with MTAS, generally using a nominal coincidence window (CW). Details of coincidence characterization are available in our previous work [16]. The sorted SDD data is used to inform the parameter of interest, , as described in the following section.
II.2 Physical Processes and Likelihood
The main result is obtained through a simultaneous minimization of the Baker-Cousins likelihood [23] on coincident and anti-coincident SDD spectra,
| (1) |
which compares the total observed events () in a bin () to the corresponding model-predicted events (). The parameters include that of interest, , along with various fixed and free terms pertaining to the spectra.
Such a simultaneous fit to data sorted using a CW is shown in Fig. 5. The main features are the Gaussian Cu Kα and Kβ peaks of fixed means near 8 and . An additional X-ray peak near corresponds to fluoresced source Zn Kαs. Lastly, an ad hoc component consists of a wide Gaussian term of free mean and width describing Cu K Augers, and a flat term attributed primarily to source . The shape of all components is shared across coincident and anti-coincident spectra, whereas the integral of each can vary.
To obtain , all processes affecting SDD signal detection and coincident categorization must be considered. To assess the former, we consider expected true, detected signal counts from the EC∗ branch () along with those from the EC0 branch (),
| (2) |
Both expressions above require the production of a Cu K X-ray and its successful detection in the SDD. To first order, the total source decays throughout data collection (), fluorescence probability (), and SDD tagging efficiency of Cu K X-rays () do not need to be known to inform ,
| (3) |
However, K-shell capture probabilities () differ between the two electron capture branches, and in the case of EC∗- originating signal, we require that the associated de-excitation gamma is not also seen in the SDD (). K-capture probabilities are obtained from BetaShape V2.2 [24], and is obtained combining a measured geometric efficiency with simulations (App. B.2). Above, internal conversion, internal pair formation, and internal Bremsstrahlung have been neglected as these sub-dominant processes are negligible at our precision.
The expected true signal counts are related to the observed, sorted signal counts (those in the Cu K X-ray peaks of Fig. 5) by accounting for any process affecting coincidence sorting. One such effect stems from the imperfect MTAS -tagging efficiency , which primarily affects sorting of EC∗-originating signal. This efficiency has been characterized for multiple coincidence windows by scaling measured 54Mn efficiencies in energy through simulations, and correcting for deadtime [16], yielding a value of at the CW.
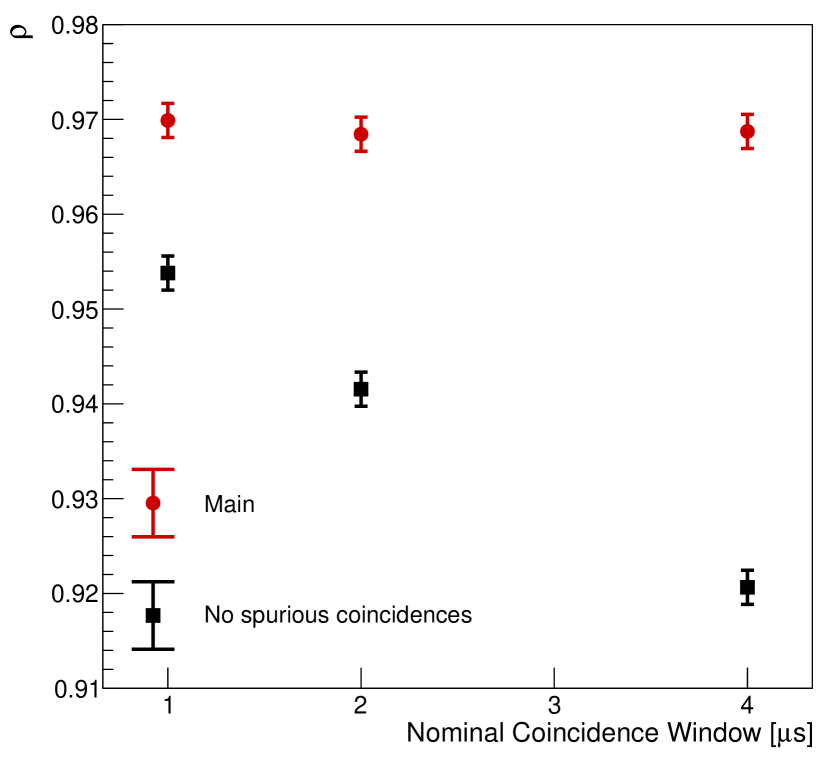
Moreover, any process detectable in MTAS can occur in spurious coincidence with the Cu SDD signal. The natural MTAS background rate is accounted for by considering a Poisson probability of no natural MTAS background events within the effective coincidence window , along with an analagous probability of no MTAS-detected source s (). Expected MTAS background coincidence rates have been obtained elsewhere [16], and is obtained in App. B. An additional source of coincidences with source has been explored and deemed negligible. All spurious coincidences are proportional to the CW, and, most significantly, place some EC0-originating signal in the coincident spectrum. Neglecting these terms thus tends to underestimate , with increasingly dramatic effects at larger CWs.
With the above MTAS gamma efficiency and spurious coincidence considerations, expected coincident () and anti-coincident () signal counts are obtained,
| (4) |
with more detail available in App. B. Above, are total signal events and is introduced for simplicity ( via Eq. (3)). These expressions for expected signal counts are inserted directly into the model of Eq. (1) as the integrals of Gaussian Cu K X-rays, such that is obtained directly from the fit along with its statistical error.
III Results
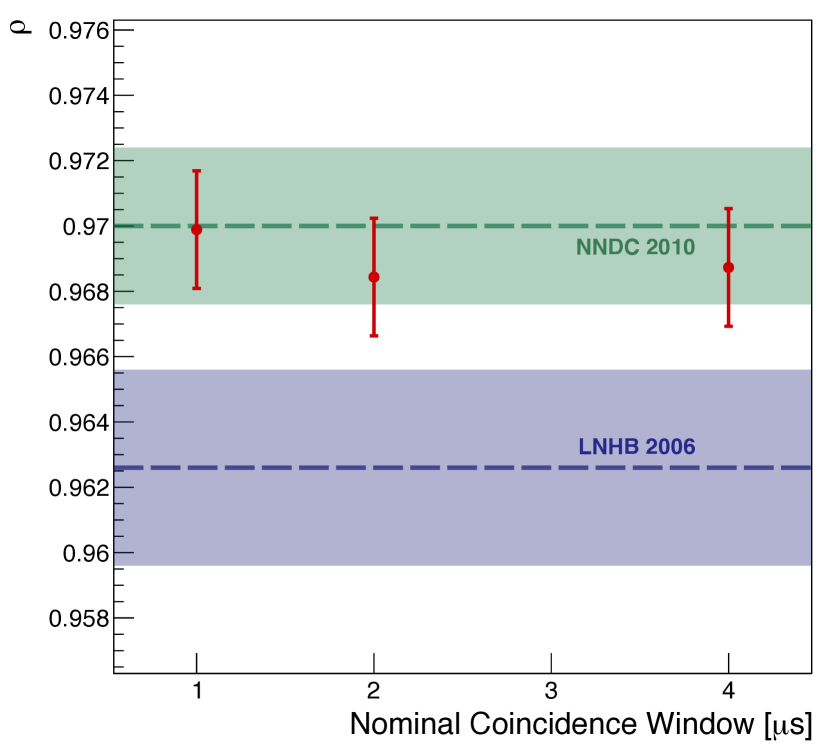
With the likelihood method described above, we obtain
| (5) |
using the dataset. This result, and those obtained using 1 and CWs are shown in Fig. 6. Our values of / agree across coincidence windows, and we note that these measurement uncertainties are correlated. We also report values derived from branching ratios in existing NNDC [9] and LNHB [8] evaluations.
The systematic errors considered in this analysis generally fall into two categories: (1) physical limitations (finitely known quantities such as tagging efficiency; App. B.2) and (2) spectral characteristics (e.g. fit range). The former (1) are accounted for analytically using equations of Sec. II.2. All physical parameters are varied simultaneously to account for covariances, and are assumed to follow Gaussian distributions. The latter (2) are gauged by performing numerous fits, such as that in Fig. 5, while randomly varying the binning and fit range. The final systematic error of sums those of category (1) and (2) in quadrature, and within rounding happens to be equivalent to the statistical error. We find that the physical systematics completely dominate any spectral effects, with the leading contribution stemming from the error on MTAS -tagging efficiency. Details of these considerations are provided in App. C, and contributions of individual sources of systematic error are summarized in Table 6.
We re-evaluate the decay scheme of 65Zn (Fig. 1) by combining our result of / with the commonly evaluated branching ratio [9, 8], and assuming these three branches complete the decay scheme. Our result is not sensitive to internal conversion and pair formation, internal Bremsstrahlung, de-excitation through, or EC to the intermediate Cu level. The evaluated is thus equivalent to the absolute intensity.
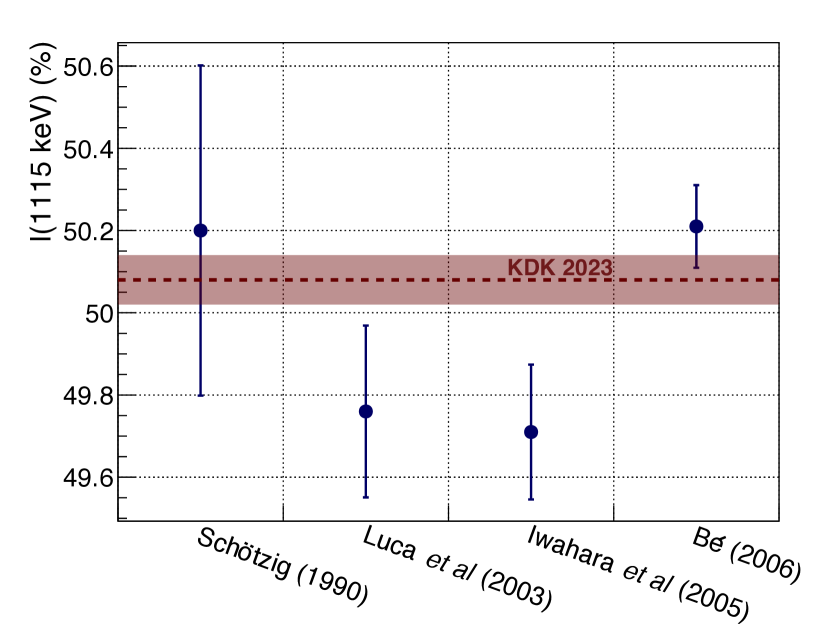
With our re-evaluation, we find an improvement in sensitivity to the branching ratio of almost a factor of 2 relative to that obtained by the Euromet exercise [10, 11]. We compare this result of to various most-recent measurements in Fig. 7, with values listed in Table 3. An alternate re-evaluation combining the result of this work with a theoretical ratio from Betashape V2.2 [24] yields highly consistent results (Table 2).
IV Conclusions
We have re-determined the absolute emission intensity of s originating from 65Zn electron-capture decays, improving the available precision by a factor of 2, with a result that agrees with the existing National Nuclear Data Center evaluation. This improvement stems from precise determination of a ratio of electron-capture decay intensities, which does not require precise knowledge of source activity. As in other experiments, the efficiency of our -tagger is a limiting systematic, though this precisely known quantity yields a systematic error roughly equivalent to our statistical uncertainty. Additionally, our determination is the first involving the total EC0 branching ratio of 65Zn. Our successful measurement is analogous to an existing result for 40K, and may be applied to other nuclides which decay through multiple modes of electron capture. The unique detector configuration of the KDK experiment provides a precise result available for use in the decay scheme evaluation of the familiar and vastly used 65Zn.
Acknowledgements.
We thank Xavier Mougeot and Sylvain Leblond of LNHB for input on 65Zn. Work was performed at Oak Ridge National Laboratory, managed by UT-Battelle, LLC, for the U.S. Department of Energy under Contract DE- AC05-00OR22725. The United States Government retains and the publisher, by accepting the article for publication, acknowledges that the United States Government retains a non-exclusive, paid-up, irrevocable, world-wide license to publish or reproduce the published form of this manuscript, or allow others to do so, for United States Government purposes. The Department of Energy will provide public access to these results of federally sponsored research in accordance with the DOE Public Access Plan (http://energy.gov/downloads/doe- public-access-plan). US support has also been supplied by the Joint Institute for Nuclear Physics and Applications, and by NSF grant EAR-2102788. Funding in Canada has been provided by NSERC through a SAPIN grant, as well as by the Faculty of Arts and Science of Queen’s University, and by the McDonald Institute.References
- Hoppes and Schima [1984] D. D. Hoppes and F. J. Schima, Nuclear data for the efficiency calibration of Germanium spectrometer systems: measurements from the laboratories of the International Committee for Radionuclide Metrology and Spectrometry Group, Tech. Rep. NBS Special Publication 626 (National Bureau of Standards, Washington, DC, USA, 1984).
- Banks et al. [1954] T. E. Banks, R. Tupper, R. W. E. Watts, and A. Wormall, Estimation of zinc in biological specimens: Determination of Zinc-65, Nature 173, 348 (1954).
- Hunt et al. [2002] J. R. Hunt, L. K. Johnson, and B. O. Juliano, Bioavailability of zinc from cooked Philippine milled, undermilled, and brown rice, as assessed in rats by using growth, bone zinc, and zinc-65 retention, Journal of Agricultural and Food Chemistry 50, 5229 (2002).
- Sugita et al. [2014] R. Sugita, N. I. Kobayashi, A. Hirose, K. Tanoi, and T. M. Nakanishi, Evaluation of in vivo detection properties of 22Na, 65Zn, 86Rb, 109Cd and 137Cs in plant tissues using real-time radioisotope imaging system, Physics in Medicine & Biology 59, 837 (2014).
- Lucconi et al. [2013] G. Lucconi, G. Cicoria, D. Pancaldi, F. Lodi, C. Malizia, S. Fanti, S. Boschi, and M. Marengo, Use of 65Zn as a tracer for the assessment of purification in the 68Ga-DOTANOC synthesis, Applied Radiation and Isotopes 80, 27 (2013).
- Korinko and Tosten [2013] P. S. Korinko and M. H. Tosten, Analysis of zinc 65 contamination after vacuum thermal process, Journal of Failure Analysis and Prevention 13, 389 (2013).
- Pommé et al. [2016] S. Pommé, H. Stroh, J. Paepen, R. Van Ammel, M. Marouli, T. Altzitzoglou, M. Hult, K. Kossert, O. Nähle, H. Schrader, et al., On decay constants and orbital distance to the Sun – part III: beta plus and electron capture decay, Metrologia 54, 36 (2016).
- Bé et al. [2006] M.-M. Bé, V. Chisté, C. Dulieu, E. Browne, C. Baglin, V. Chechev, N. Kuzmenko, R. Helmer, F. Kondev, D. MacMahon, and K. Lee, Table of Radionuclides, Monographie BIPM-5, Vol. 3 (Bureau International des Poids et Mesures, Pavillon de Breteuil, F-92310 Sèvres, France, 2006).
- Browne and Tuli [2010] E. Browne and J. Tuli, Nuclear data sheets for A = 65, Nuclear Data Sheets 111, 2425 (2010).
- Bé et al. [2005] M.-M. Bé, M. N. Amiot, C. Bobin, M. C. Lepy, J. Plagnard, J. M. Lee, K. B. Lee, T. S. Park, A. Luca, M. Sahagia, A. M. Razdolescu, L. Grigorescu, Y. Sato, Y. Hino, K. Kossert, R. Klein, M. H. K. Schneider, H. Schrader, P. Dryak, J. Sochorova, P. Kovar, P. Auerbach, M. Havelka, T. Altzitzoglou, A. Iwahara, M. A. L. Da Silva, J. U. Delgado, C. J. Da Silva, L. Johansson, S. Collins, and A. Stroak, Activity measurements and gamma emission intensities determination in the decay of Zn65, Tech. Rep. CEA-R-6081 (CEA Saclay, Dept. des Technologies du Capteur et du Signal, Gif-sur-Yvette, France, 2005).
- Bé [2006] M.-M. Bé, Activity measurements and determination of gamma-ray emission intensities in the decay of 65Zn, Applied Radiation and Isotopes 64, 1396 (2006).
- Iwahara et al. [2005] A. Iwahara, M. A. L. da Silva, A. E. Carvalho Filho, E. M. de Oliveira Bernardes, and J. U. Delgado, Determination of disintegration rates and -ray emission probabilities of 65Zn and 241Am, Applied Radiation and Isotopes 63, 107 (2005).
- Luca et al. [2003] A. Luca, M.-N. Amiot, and J. Morel, Determination of half-life and photon emission probabilities of 65Zn, Applied Radiation and Isotopes 58, 607 (2003).
- Funck and Larsen [1983] E. Funck and A. N. Larsen, The influence from low energy x-rays and auger electrons on 4- coincidence measurements of electron-capture-decaying nuclides, The International Journal of Applied Radiation and Isotopes 34, 565 (1983).
- Di Stefano et al. [2020] P. C. F. Di Stefano, N. Brewer, A. Fijalkowska, Z. Gai, K. C. Goetz, R. Grzywacz, D. Hamm, P. Lechner, Y. Liu, and E. Lukosi, The KDK (potassium decay) experiment, in Journal of Physics: Conference Series, Vol. 1342 (IOP Publishing, 2020) p. 012062, xV International Conference on Topics in Underground and Astroparticle Physics, June 24-28, 2017 (Sudbury, ON, Canada).
- Stukel et al. [2021] M. Stukel, B. Rasco, N. Brewer, P. Di Stefano, K. Rykaczewski, H. Davis, E. Lukosi, L. Hariasz, M. Constable, P. Davis, K. Dering, A. Fijałkowska, Z. Gai, K. Goetz, R. Grzywacz, J. Kostensalo, J. Ninkovic, P. Lechner, Y. Liu, M. Mancuso, C. Melcher, F. Petricca, C. Rouleau, P. Squillari, L. Stand, D. Stracener, J. Suhonen, M. Wolińska-Cichocka, and I. Yavin, A novel experimental system for the KDK measurement of the 40K decay scheme relevant for rare event searches, NIM A 1012, 165593 (2021).
- Stukel et al. [2023] M. Stukel, L. Hariasz, P. C. F. Di Stefano, B. C. Rasco, K. P. Rykaczewski, N. T. Brewer, D. W. Stracener, Y. Liu, Z. Gai, C. Rouleau, J. Carter, J. Kostensalo, J. Suhonen, H. Davis, E. D. Lukosi, K. C. Goetz, R. K. Grzywacz, M. Mancuso, F. Petricca, A. Fijałkowska, M. Wolińska-Cichocka, J. Ninkovic, P. Lechner, R. B. Ickert, L. E. Morgan, P. R. Renne, and I. Yavin, Rare 40K decay with implications for fundamental physics and geochronology, Physical Review Letters 131, 052503 (2023).
- Hariasz et al. [2023] L. Hariasz, M. Stukel, P. C. F. Di Stefano, B. C. Rasco, K. P. Rykaczewski, N. T. Brewer, D. W. Stracener, Y. Liu, Z. Gai, C. Rouleau, J. Carter, J. Kostensalo, J. Suhonen, H. Davis, E. D. Lukosi, K. C. Goetz, R. K. Grzywacz, M. Mancuso, F. Petricca, A. Fijałkowska, M. Wolińska-Cichocka, J. Ninkovic, P. Lechner, R. B. Ickert, L. E. Morgan, P. R. Renne, and I. Yavin, First observation of the ground-state electron-capture of 40K, Physical Review C 108, 014327 (2023).
- Helmer and van der Leun [2000] R. Helmer and C. van der Leun, Recommended standards for -ray energy calibration (1999), NIM A 450, 35 (2000).
- Wang et al. [2021] M. Wang, W. Huang, F. Kondev, G. Audi, and S. Naimi, The AME 2020 atomic mass evaluation (II). Tables, graphs and references*, Chinese Physics C 45, 030003 (2021).
- Rasco et al. [2015] B. C. Rasco, A. Fijałkowska, M. Karny, K. P. Rykaczewski, M. Wolińska-Cichocka, K. C. Goetz, R. K. Grzywacz, C. J. Gross, K. Miernik, and S. V. Paulauskas, Multiple emission of the 137Xe keV levels studied with the modular total absorption spectrometer (MTAS), in Proceedings of the Conference on Advances in Radioactive Isotope Science (ARIS2014) (JPS Journals, 2015) p. 030018.
- Karny et al. [2016] M. Karny, K. P. Rykaczewski, A. Fijałkowska, B. C. Rasco, M. Wolińska-Cichocka, R. K. Grzywacz, K. C. Goetz, D. Miller, and E. F. Zganjar, Modular total absorption spectrometer, NIM A 836, 83 (2016).
- Baker and Cousins [1984] S. Baker and R. D. Cousins, Clarification of the use of chi-square and likelihood functions in fits to histograms, NIM Physics Research 221, 437 (1984).
- Mougeot [2017] X. Mougeot, BetaShape: A new code for improved analytical calculations of beta spectra, European Physical Journal Web of Conferences, European Physical Journal Web of Conferences European Physical Journal Web of Conferences, 146, 12015 (2017), nD2016: International Conference on Nuclear Data for Science and Technology, September 11-15, 2016 (Bruges, Belgium).
- Schötzig [1990] U. Schötzig, Photon emission probabilities of 44Ti, 65Zn, 88Y, 89Sr, 147Pm, 204Ti and 210Pb, NIM A 286, 523 (1990).
- Kibédi et al. [2008] T. Kibédi, T. W. Burrows, M. B. Trzhaskovskaya, P. M. Davidson, and C. W. Nestor, Evaluation of theoretical conversion coefficients using BrIcc, NIM A 589, 202 (2008).
- Bambynek et al. [1977] W. Bambynek, H. Behrens, M. H. Chen, B. Crasemann, M. L. Fitzpatrick, K. W. D. Ledingham, H. Genz, M. Mutterer, and R. L. Intemann, Orbital electron capture by the nucleus, Reviews of Modern Physics 49, 77 (1977).
- Colgate and Gilbert [1953] S. A. Colgate and F. C. Gilbert, Electron-positron annihilation in flight, Physical Review 89, 790 (1953).
- Schönfeld and Janßen [1996] E. Schönfeld and H. Janßen, Evaluation of atomic shell data, NIM A 369, 527 (1996).
Appendix A Components of the 65Zn Decay Scheme and Re-evaluated Branching Ratios
The decay scheme of 65Zn (Fig. 1) can be constructed either wholly empirically, or with a combination of measurements and theoretical values. Prior to this work, the purely empirical evaluation relied on intensity measurements of and s associated with 65Zn.
The intensity is equivalent to the branching ratio to the Cu state () assuming a simplified scheme where (1) the intermediate 344, 770 keV emissions are negligible, and (2) internal conversion is negligible. The order of precision for from both previous evaluations [8, 9] is , and the intensities of intermediate s [10] along with the internal conversion process (BrIcc program [26]) can be neglected. Radiative electron capture (REC) may accompany both the EC0 and EC∗ 65Zn decays, resulting in internal Bremsstrahlung emission. However, for these allowed transitions, the frequency of REC relative to non-REC decays is of the order of [27] and can be neglected in the determination of .
The branching ratio through disintegration () is informed from measured intensities obtained taking annihilation-in-flight [28] into account. The decay scheme is then built with
| (6) |
which yields the final required branching ratio (). To re-evaluate the scheme with the result of this work, the above assumption of unitarity is maintained and the measured parameter is inserted,
| (7) |
Above, [8, 9] can be fixed to obtain and subsequently . We assume this value is effectively uncorrelated with the EC branching ratios. Alternatively, may be combined with a theoretical value of from Betashape V2.2 [24],
| (8) |
which yields consistent branching ratios. These re-evaluations are compared to existing ones in Table 2. Both the main and alternate methods above reduce the uncertainty on 65Zn EC branching ratios by a factor of 2 compared to existing evaluations [8, 9]. The re-evaluated intensity of the (=) is compared to other measurements in Table 3 and Fig. 7. Calculations with our measurement remain insensitive to internal conversion and intermediate gamma emissions. Radiative electron capture does not affect our measurement of precision. Internal Bremsstrahlung photons are detectable in both the SDD and MTAS, and can create false positives and negatives. All such effects are suppressed by relative to each radiative electron capture branch. In the next generation of precision measurements, internal Bremsstrahlung and other low-order effects will contribute.
| LNHB (2006) | NNDC (2010) | This work (main) | This work (alt.) | |
|---|---|---|---|---|
| (%) | ||||
| (%) | ||||
| (%) |
| Source | (%) | Rel. error (%) |
|---|---|---|
| Schötzig (1990) [25] | ||
| Luca et al. (2003) [13] | ||
| Iwahara et al. (2005) [12] | ||
| Bé (2006) [11, 10] | ||
| This work |
Appendix B Likelihood details
The likelihood fit performed in Fig. 5 consists of 4 distinct spectral components in both the coincident and anti-coincident spectra. Counts in the Gaussian Cu Kα and Kβ peaks corresponding to 65Zn electron captures are used to inform as discussed in the main text, with some details available below. Symbol definitions are retained from the main text, where applicable.
B.1 Coincidence sorting
Expected coincident signal counts consist of the terms,
| (9) |
which contain EC∗-originating events whose gamma-ray was successfully tagged by MTAS, those where the gamma was missed occurring in coincidence with another event in MTAS, and lastly EC0-originating events which occurred with an event in MTAS. With the substitution , this expression yields Eq. (4) in the main text. The expression for expected anti-coincident signal counts is the complement to the above such that all events are accounted for: .
The primary source of spurious coincidences is the natural MTAS background of rate , corrected for via
| (10) |
which is the probability of no occurrences within an average coincidence window . Additionally, there is a rate of EC∗ events which are not detected in the SDD, though the associated -ray is detected in MTAS in coincidence with SDD signal. Such events have an expected rate
| (11) |
where is the source activity and a lack of SDD X-ray detection is ensured via
| (12) |
At the order of this correction, the probability of interaction with the SDD (App. B.2) is negligible. This additional source of spurious coincidences has a 0-event probability within of . Altogether, the probability of any (1+) event(s) from or within the timescale is .
Expected MTAS background counts have been measured directly [16], and are far larger than those from , as shown in Table 4. To obtain , known values for K-capture [24] and fluorescence [29] probabilities are used, along with an assumed partial EC∗ activity from calculated source activity [16] and with an assigned error of 10%. MTAS and SDD X-ray tagging-efficiencies have been measured elsewhere [16], wherein average coincidence windows are obtained from reported quantities .
| CW () | () | ) |
|---|---|---|
| 1 | ||
| 2 | ||
| 4 |
The effect of neglecting spurious coincidences is depicted in Fig. 8. Without this correction, results for are directly anti-correlated with coincidence window. Applying the corrections for such coincidences resolves the unphysical behaviour.
B.2 Physical quantities
Beyond coincidence sorting, any processes affecting relative production or SDD detection of EC0 and EC∗ events must be accounted for. As per Eq. (3), is directly dependent on relative K-shell capture probabilities , and SDD efficiency of tagging gammas .
K-capture probabilities from Betashape V2.2 [24] yield . Due to the high precision of the measurement, this seemingly small variation in relative probabilities is the second-most-dominant source of systematic error, as discussed further. It is notable that previously reported [8] values from a 1996 evaluation [29] yield a consistent ratio of .
The SDD -tagging efficiency is obtained from a mixture of measurement and simulations. The SDD K X-ray tagging efficiency obtained elsewhere [16] is assumed to be equivalent to the geometric efficiency of the SDD; 8-9 keV Cu X-rays penetrate the dead layers of the SDD without escaping the detector, and all are likely to escape the source, as same-energy Auger electrons are readily visible in the SDD (Fig. 5). Two terms are considered,
| (13) |
where is the geometric SDD efficiency [16], and is the probability that the interacts with (does not escape) the SDD volume.
Simulations are not relied upon for total SDD tagging efficiencies due to the uncertainty in sub-mm, geometric source-SDD modelling. As such, only the probability of interaction with the volume it passes through is obtained through a simulation of 10 million events, yielding . The SDD -tagging efficiency is then .
Appendix C Systematic errors
Systematic errors are accounted for in two separate groups: physical sources (1) discussed in App. B.2, and spectral characteristics (2) chosen prior to the likelihood fit.
Every physical source of error is included in expressions for expected coincident and anti-coincident signal counts of Eq. (4). Combined with Eq. (3), and spurious coincidence expressions (Eqs. (10)–(12)), is related to all physical parameters. Values of all such parameters are listed in Table 5.
| Parameter | Value | Source |
|---|---|---|
| (%) | Betashape V2.2 [24] | |
| (%) | Betashape V2.2 [24] | |
| (%) | Ref. [29] | |
| (%) | Ref. [16] | |
| (%) | Ref. [16]† | |
| Ref. [16]† | ||
| (kHz) | Ref. [16]† | |
| (kBq) | App. B.2 | |
| (%) | App. B.2 |
All physical parameters, such as the MTAS -tagging efficiency, are assumed to follow Gaussian distributions with a width corresponding to their 68% CL error. The effect of this efficiency on is gauged by sampling 1,000 values from the efficiency distribution, and obtaining the resulting difference in obtained values. The width of the latter distribution corresponds to the systematic error due to MTAS -tagging efficiency, which is found to be .
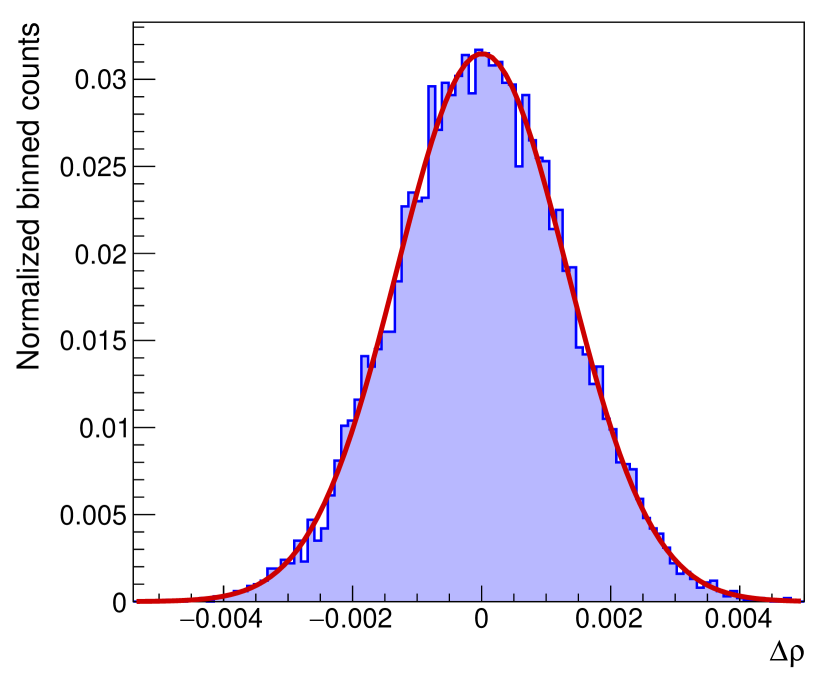
To account for covariances, all physical parameters are varied simultaneously over 10,000 iterations, resulting in a distribution of variation as shown in Fig. 9. The spread of this distribution, , is equivalent to the total systematic error of category (1).
Remaining sources of systematics are of category (2), and contain the choice of binning and fit range. Bin widths were considered between eV, ensuring X-ray peaks remain easily distinguishable. The low end of the fit range is constrained by the validity of the ad hoc model, as the wide Gaussian describing primarily Auger counts (of three different energy ranges) is not sufficient to describe data at much lower energies than pictured in Fig. 5 (data at lower energies is shown in Fig. 2). Both the low and high energy cuts must encompass the ad hoc background in a region not dominated by X-rays. The sets of low and high cuts considered are .
The effect of the binning is gauged by performing fits while randomly varying the bin width from a uniform distribution bounded as described above. The resulting distribution of values has a width of . The effect of varying the fit range is similarly small. The overall systematic error of category (2) is equivalent to the width of the distribution obtained varying all parameters of this category simultaneously. This width is , which is negligible relative to the systematic error of category (1). The total systematic error is obtained summing those of both categories in quadrature to obtain .
A summary of systematic errors from individual sources (of both categories) is displayed in Table 6. The dominant source of error is the MTAS -tagging efficiency, which defines the order of the systematic error. Though varying spectral characteristics can affect the ad hoc model in the fit, any effects on are minimal as the signal Cu peaks of interest dominate in counts. The statistical error of is of the same order as the overall systematic error. Added in quadrature, these two quantities yield the overall error on of .
| Source | Systematic error |
|---|---|
| MTAS -tagging efficiency () | |
| K-capture probabilities () | |
| Partial activity () | |
| Natural MTAS backgrounds () | |
| SDD-source geometric efficiency () | |
| Expected interaction with SDD () | |
| K fluorescence probability () | |
| Fit range | |
| Binning |