Elasticity-Controlled Jamming Criticality in Soft Composite Solids
Abstract
Soft composite solids are made of inclusions dispersed within soft matrices. They are ubiquitous in nature and form the basis of many biological tissues. In the field of materials science, synthetic soft composites are promising candidates for building various engineering devices due to their highly programmable features. However, when the volume fraction of the inclusions increases, predicting the mechanical properties of these materials poses a significant challenge for the classical theories of composite mechanics. The difficulty arises from the inherently disordered, multi-scale interactions between the inclusions and the matrix. To address this challenge, we systematically investigated the mechanics of densely filled soft elastomers containing stiff microspheres. We experimentally demonstrated how the strain-stiffening response of the soft composites is governed by the critical scalings in the vicinity of a shear-jamming transition of the included particles. The proposed criticality framework quantitatively connects the overall mechanics of a soft composite with the elasticity of the matrix and the particles, and captures the diverse mechanical responses observed across a wide range of material parameters. The findings uncover a novel design paradigm of composite mechanics that relies on engineering the jamming properties of the embedded inclusions.
Dispersing nano-to-micron-sized particles within a soft polymeric gel forms soft composite solids that are widely used in various engineering materials, including synthetic tissue Gosselin et al. (2018), wearable biomedical devices Koydemir and Ozcan (2018); Ray et al. (2019), and soft robots Miriyev et al. (2017). In addition to reinforcing the polymer matrix Bergström and Boyce (1999), the dispersed particles can enable diverse functional features such as anisotropic elasticity Wang et al. (2023), shape-memory effects Testa et al. (2019); Xia et al. (2021), and stimuli-responsive behaviors Huang et al. (2016); Xie et al. (2021). Due to the great compliance of soft polymeric gels, the embedded particles can undergo moderate displacement within the matrix without causing internal fractures Huang et al. (2016). This particle rearrangement may alter both the strain couplings among neighboring inclusions Puljiz and Menzel (2017) and the stress fields over a large length scale Huang et al. (2016); Fang et al. (2020). Compared with classical stiff composite materials Hull and Clyne (1996), the current understanding of the multi-scale interactions within soft composites remains very limited.
The complexity of composite mechanics increases exponentially with the volume fraction of the inclusions. In a dilute composite, the mechanics is solely determined by the interactions between an isolated inclusion and the surrounding matrix, which allows the effective shear modulus to be described by the classical Eshelby theory Eshelby and Peierls (1957). Further, modified effective medium theories have been extended to systems with finite-density inclusions, where neighboring particles interact via their induced strain fields Mori and Tanaka (1973); Puljiz and Menzel (2017). However, this assumption of matrix-mediated, short-range interactions breaks down in the dense limit, where the overall stress response may involve networks of direct contacts Shivers et al. (2020); Phan-Thien (Phan Thiên Nhân) or long-range rearrangements of dispersed particles Fang et al. (2020). Due to the inherently disordered and heterogeneous microstructures of dense soft composites, predicting their mechanics is challenging for the classical composite theories.
To address these issues, we systematically investigated the strain stiffening of soft elastomers containing a high volume fraction of stiff microspheres. Inspired by the concepts of both granular jamming Olsson and Teitel (2007); Liu and Nagel (2010); Zaccone and Scossa-Romano (2011); Behringer and Chakraborty (2018) and rigidity transitions in disordered systems Lacasse et al. (1996); Broedersz et al. (2011); Bi et al. (2015), we demonstrate that the mechanical responses of soft composites are governed by elasticity-controlled scalings near a continuous phase transition. In the absence of matrix elasticity, the transition coincides with shear-jamming of the included particles. This novel criticality framework captures the stiffening responses for a variety of material parameters where the classical theories break down. The results provide a new approach to understand the nonlinear mechanical responses of various multi-phase soft materials.
Strain-stiffening responses of soft composite solids
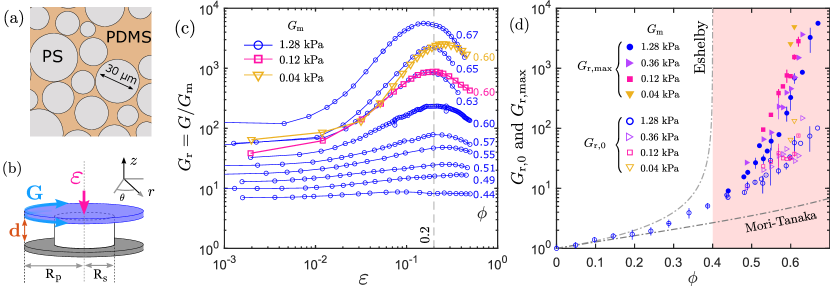
We prepared compliant polydimethylsiloxane (PDMS) elastomers filled with stiff polystyrene (PS) microspheres having an average diameter of 30 m (Fig. 1(a) and Fig. S6). While the shear modulus of the PS spheres is GPa (Fig. S1), the shear modulus of the PDMS matrix was systematically varied from kPa to kPa by tuning the crosslinking density (Ref. Zhao et al. (2022) and Fig. S5). The mechanical properties of the soft composites were characterized using a rheometer equipped with a parallel-plate shear cell (Fig. 1(b)). The top plate controls the gap size () and applies axial compressive strains () (Fig. S7). The volume of the sample remains unchanged under an axial compression (Fig. S9), which gives rise to a pure shear. At each given , the shear modulus of the composites was measured using an oscillatory shear with a small amplitude () and a low angular frequency ( rad/s). The resulting represents the linear elastic response of the soft composites in differently sheared states (Fig. S8).
The dense soft composites exhibited characteristic strain-stiffening responses under the axial compressions (Fig. 1(c)). The stiffening degree was determined by both the particle volume fraction and the shear modulus of the elastomer matrix . First, at a fixed kPa, the relative shear modulus, , grows more rapidly with as increases from to . Second, at a fixed , the strain stiffening becomes more pronounced while decreases from 1.28 kPa to 0.04 kPa.
We define as the relative shear modulus at the maximally stiffened states and as the relative shear modulus at . Within experimental uncertainty, appears at approximately regardless of and . Therefore, we estimated for all the samples using the values of at . For , decreases with , and the composites were unable to fully recover their original shapes after the compressions were removed. This plasticity was likely caused by internal fractures between the elastomer and the particles Francqueville et al. (2020). In contrast, the plots of appear to be highly reproducible when the compressions are released at . Hence, we focus exclusively on the stiffening regime between and .
Figure 1(d) shows both (solid points) and (hollow points) as a function of as varies between 0.04 kPa and 1.28 kPa. For , only was reported since no strain-stiffening was found. For comparison with the classical theories of composite mechanics, we plotted the predictions from the Eshelby theory Eshelby and Peierls (1957) and the Mori–Tanaka approximation scheme Mori and Tanaka (1973), which align well with the measured in the dilute limit (). However, for dense composites (), the classical theories significantly deviate from the measured and , and also fail to describe the strain-dependent shear modulus . These mismatches suggest that potential mechanisms, such as direct contact between inclusions Phan-Thien (Phan Thiên Nhân); Shivers et al. (2020), were overlooked in the classical models of the mechanics of dense soft composites.
Signatures of jamming-controlled elasticity
We re-examined the super-exponential rise of in Fig. 1(d). As decreases, the growth of becomes increasingly more divergent near . Since a soft composite solid will asymptotically become a granular suspension as the matrix elasticity approaches zero, we hypothesize an underlying connection between the shear-jamming of dense suspensions and the strain-stiffening of soft composites in the limit of .
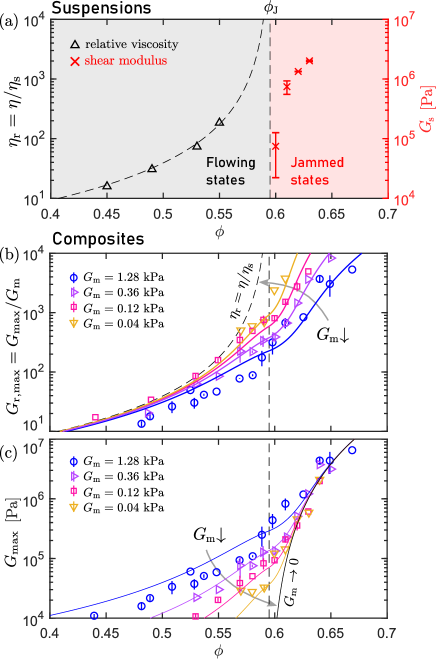
To validate this assumption, we first characterized the shear rheology of a concentrated PS suspension in the PDMS base solution without any crosslinkers (Fig. S2). We define the relative viscosity () as the ratio of the viscosity of the suspension () to that of the PDMS base ( Pas): . The left panel in Fig. 2(a) shows measured under steady shear flow in the frictional regime. The results are well described by the Krieger–Dougherty relation Guazzelli and Pouliquen (2018)
| (1) |
with a fixed exponent and a fitted jamming volume fraction . For , we did not observe homogeneous steady shear flow at any shear rate. In this regime, as shown in the right panel of Fig. 2(a), nonzero shear moduli of the PS-PDMS suspensions () were measured at . Since no significant change in was found when was further increased, represents the shear-jamming volume fraction of the PS-PDMS suspensions in the large strain limit.
In Fig. 2(b), we plot from Eq. 1 together with of the composites for a comparison. The traces of gradually converge to as decreases, suggesting that for as approaches zero, and the actual shear modulus scales linearly with in this limit. In contrast, for , becomes independent of (Fig. 2(c)) and is close to the value of measured independently from the jammed suspensions (Fig. 2(a)), suggesting a particle-dominated response. Considering the contrasting mechanical behaviors exhibited for the ranges and , it is likely that the shear-jamming point of the suspensions controls a crossover of the mechanical properties of the composites.
Elasticity-controlled criticality near jamming

Since the plots of in Fig. 2(c) resemble the critical behaviors near a continuous phase transition Cardy (1996); Broedersz et al. (2011); Bi et al. (2015); Sharma et al. (2016), we next investigated the scalings of the composite shear modulus () near . Motivated by the observation that approaches as (Fig. 2(b)) and the classical analogy between the effective shear modulus and the shear viscosity in multi-phase systems Smallwood (1944); Ju and Chen (1994); TORQUATO (2002), we conjectured the scaling law
| (2) |
with and . To demonstrate the validity of this scaling assumption, we plot against in Fig. 3(a) with different values, where the results show the best agreement with Eq. 2 for the softest matrix. We further considered how varies with at . In Figure 3(b), is plotted at against , which can be fitted to the power-law scaling
| (3) |
with a fitted exponent .
Considering the scalings in Eqs. 2 and 3, we compared the soft composites near with a ferromagnetic system near the Curie temperature (). The material parameters of the soft composites are directly analogous to in the Ising model. By assuming a scale-invariant free energy at the critical point (), we propose a universal scaling form
| (4) |
where and , and the crossover scaling functions and apply to the regimes of and , respectively. The derivations of Eq. 4 and the relationships between the exponents are described in Methods. A similar scaling was previously applied to study fiborous networks near central force rigidity transitions, where the bending rigidity plays a similar role as in soft composites Broedersz et al. (2011); Sharma et al. (2016).
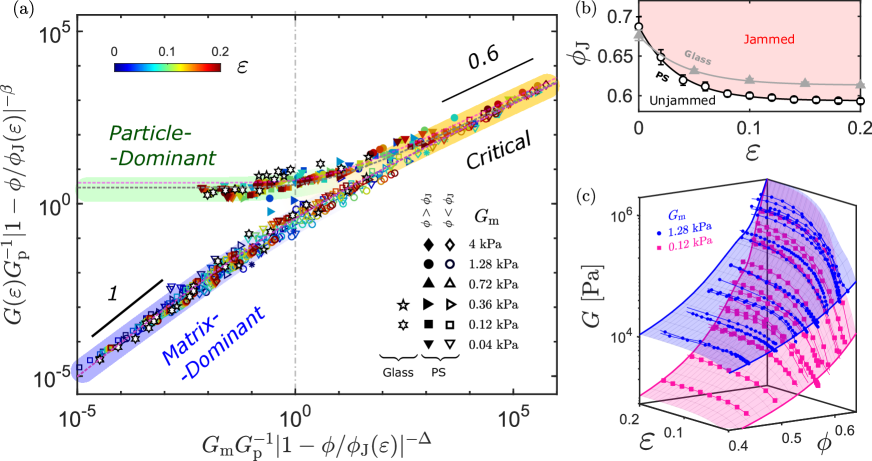
To test our scaling ansatz (Eq. 4), the mechanical responses () measured for different and are plotted in Fig. 3(c) using the rescaled variables and . The range of spans two orders of magnitude, from 0.04 kPa to 4.0 kPa, while increases from 0.45 to 0.67 around . Consistent with Eq. 4, the data points for and are nicely collapsed onto two distinct branches. The branch exhibits a slope close to , indicating that . The branch reaches a plateau independent of , suggesting that is dominated by the particle phase. In the limit of , a critical regime emerges where the two branches become indistinguishable and both follow the same scaling, .
To model analytically, we derived an explicit form of the equations of state
| (5) |
where are the inverse functions of . The reduced variables and were used to simplify the notation. The derivation is detailed in Methods. By fitting the data in Fig. 3(c) to Eq. 5, we obtained the material constants and for the PS-PDMS composites. With all the essential parameters (, , , , and ), we can calculate for a given and . For instance, the colored solid lines in Figs. 2(b) and (c) represent the theoretical predictions from Eqs. 4 and 5.
Criticality near a strain-dependent jamming transition
To describe the entire strain-stiffening regime, it is necessary to expand the scaling analysis to include the axial strains ranging from to . Since the shear-jamming point of granular materials depends on strain Bi et al. (2011); Vinutha and Sastry (2016); Kumar and Luding (2016); Baity-Jesi et al. (2017); Han et al. (2019); Zhao et al. (2019); Jin and Yoshino (2021); Pan et al. (2023), we next explore an extension to our model by incorporating a strain-dependent jamming volume fraction for .
Assuming that the critical exponents ( and ) and the material parameters ( and ) remain constant for different , Eq. 5 is rewritten as
| (6) |
where and . For each , we search for an optimal that allows the composite shear modulus measured with different and to be collapsed onto Eq. 6 (the dashed gray line in Fig. 4(a)). As a consequence, we are able to overlay measured within the range of by plotting versus . The resulting in Fig. 4(b) can be fitted to a form that describes the shear-jamming phase boundary of granular materials Kumar and Luding (2016); Han et al. (2018); Zhao et al. (2019)
| (7) |
with , , and a characteristic strain scale . While agrees with measured under the steady-state rheology of the PS-PDMS suspensions shown in Fig. 2(a), is consistent with the simulated random close packing of spheres having the same size distribution as our samples (Fig. S4). Although Eq. 7 was obtained from the scaling behaviors of soft composites, it effectively predicts the line of rigidity transitions for the PS-PDMS suspensions in our experiments (Fig. S3).
To test the universality of the scaling model, we further examined a different composite system made by dispersing glass beads in PDMS matrices. The size of these glass beads is similar to that of the PS particles but their shear modulus is ten times higher; that is, GPa. The results of the glass-PDMS composites are collapsed onto the same plot in Fig. 4(a) with the same critical exponents and but different material constants and . The difference in and is likely due to the high bonding energy between glass and PDMS. The resulting was also fitted to Eq. 7 with , , and . We again found that is consistent with the shear-jamming point of the glass-PDMS suspensions and that is consistent with the predicted random close packing.
With the given parameters , and , we can calculate the shear modulus of soft composites as
| (8) |
where is given by Eq. 7, and the functions can be evaluated by numerically solving the inverse functions in Eq. 6. In Fig. 4(c), we compared the measured shear moduli of two sets of PS-PDMS samples with kPa and 1.28 kPa, respectively, to the theoretical predictions from Eq. 8.
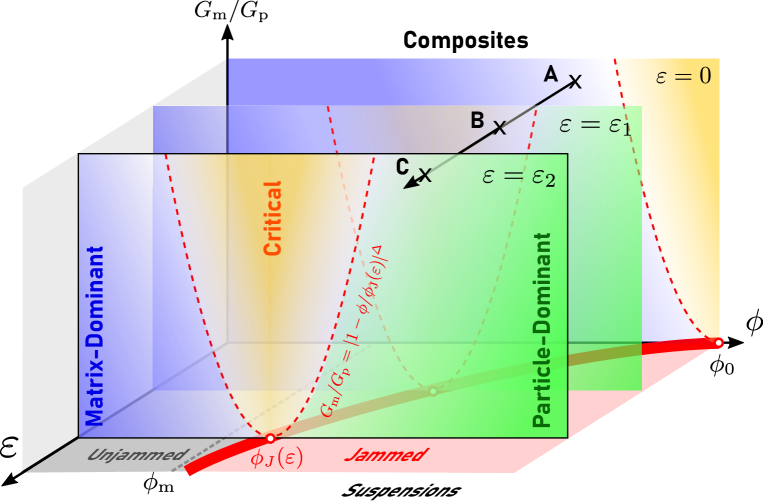
The phase diagram in Fig. 5 summarizes the fundamental aspects of our criticality framework. The plane represents the granular suspensions consisting of particles in uncrosslinked polymers. The solid red curve within the plane, , denotes the boundary of the shear-jamming transition Bi et al. (2011); Behringer and Chakraborty (2018). Soft composites exist in the 3D space characterized by , and the vertical planes in Fig. 5 represent the cross sections of this space at different strains. While there is no rigidity transition in this space with , the mechanics is determined by the critical scalings near . When , a soft composite resides either in a matrix-dominated regime if or in a particle-dominant regime if . As approaches zero, for , or for , where is a prefactor depending on the material parameters and . When , a soft composite is anticipated to be in the critical regime, where .
Discussion and conclusions
The study revealed the essential role of shear-jamming in the mechanics of soft composites in the dense limit, a regime where the system becomes highly responsive and promises wide-ranging applications, yet remains challenging to model using conventional tools from continuous mechanics. We show that the strain-stiffening of soft composites can be interpreted as a manifestation of the criticality near a strain-dependent jamming point of dense suspensions (Fig. 5). The efficacy of our scaling model reveals the unique mechanical features of soft composites. As decreases to the order of Pa, the PDMS matrix consists of both a weakly crosslinked network and a substantial amount of uncrosslinked free chains. The characteristic pore size of the network can be estimated as nm Xu et al. (2020). Therefore, the particles included in the PDMS matrix can potentially move to create direct contacts without causing fractures in the network. Consequently, the contact network within soft composites may resemble that in shear-jammed granular systems as approaches zero.
From the perspective of materials science, the study will benefit materials design in tissue engineering. Strain-stiffening has been widely observed in both biological van Oosten et al. (2019) and synthetic tissues Shivers et al. (2020); Xie et al. (2021), with the prevailing interpretations attributing them to the nonlinear mechanics of the fibrous networks in the matrix. The significance of direct contacts between inclusions and the associated jamming transition in soft matrices began attracting attention only recently Shivers et al. (2020); Song et al. (2023). A key difference between our experiments and previous studies van Oosten et al. (2019); Xie et al. (2021); Song et al. (2023) is that the strain stiffening in our study occurs without increasing the volume fraction and thus cannot be explained by the model in Ref. Shivers et al. (2020). The connection between strain-stiffening in incompressible soft composites and shear-jamming in dense suspensions offers a new scheme in designing the tissue-like mechanics of soft composites.
References
- Gosselin et al. (2018) Emily A. Gosselin, Haleigh B. Eppler, Jonathan S. Bromberg, and Christopher M. Jewell, “Designing natural and synthetic immune tissues,” Nature Materials 17, 484–498 (2018).
- Koydemir and Ozcan (2018) Hatice Ceylan Koydemir and Aydogan Ozcan, “Wearable and implantable sensors for biomedical applications,” Annual Review of Analytical Chemistry 11, 127–146 (2018).
- Ray et al. (2019) Tyler R. Ray, Jungil Choi, Amay J. Bandodkar, Siddharth Krishnan, Philipp Gutruf, Limei Tian, Roozbeh Ghaffari, and John A. Rogers, “Bio-integrated wearable systems: A comprehensive review,” Chemical Reviews 119, 5461–5533 (2019).
- Miriyev et al. (2017) Aslan Miriyev, Kenneth Stack, and Hod Lipson, “Soft material for soft actuators,” Nature Communications 8, 596 (2017).
- Bergström and Boyce (1999) Jörgen S. Bergström and Mary C. Boyce, “Mechanical Behavior of Particle Filled Elastomers,” Rubber Chemistry and Technology 72, 633–656 (1999).
- Wang et al. (2023) Xiang Wang, Zhihao Li, Shuxu Wang, Koki Sano, Zhifang Sun, Zhenhua Shao, Asuka Takeishi, Seishiro Matsubara, Dai Okumura, Nobuyuki Sakai, Takayoshi Sasaki, Takuzo Aida, and Yasuhiro Ishida, “Mechanical nonreciprocity in a uniform composite material,” Science 380, 192–198 (2023).
- Testa et al. (2019) Paolo Testa, Robert W. Style, Jizhai Cui, Claire Donnelly, Elena Borisova, Peter M. Derlet, Eric R. Dufresne, and Laura J. Heyderman, “Magnetically addressable shape-memory and stiffening in a composite elastomer,” Advanced Materials 31, 1900561 (2019).
- Xia et al. (2021) Yuliang Xia, Yang He, Fenghua Zhang, Yanju Liu, and Jinsong Leng, “A review of shape memory polymers and composites: Mechanisms, materials, and applications,” Advanced Materials 33, 2000713 (2021).
- Huang et al. (2016) Shilin Huang, Giorgio Pessot, Peet Cremer, Rudolf Weeber, Christian Holm, Johannes Nowak, Stefan Odenbach, Andreas M. Menzel, and Günter K. Auernhammer, “Buckling of paramagnetic chains in soft gels,” Soft Matter 12, 228–237 (2016).
- Xie et al. (2021) Qingqiao Xie, Yuandi Zhuang, Gaojun Ye, Tiankuo Wang, Yi Cao, and Lingxiang Jiang, “Astral hydrogels mimic tissue mechanics by aster-aster interpenetration,” Nature Communications 12, 4277 (2021).
- Puljiz and Menzel (2017) Mate Puljiz and Andreas M. Menzel, “Forces and torques on rigid inclusions in an elastic environment: Resulting matrix-mediated interactions, displacements, and rotations,” Phys. Rev. E 95, 053002 (2017).
- Fang et al. (2020) Yin Fang, Endao Han, Xin-Xing Zhang, Yuanwen Jiang, Yiliang Lin, Jiuyun Shi, Jiangbo Wu, Lingyuan Meng, Xiang Gao, Philip J. Griffin, Xianghui Xiao, Hsiu-Ming Tsai, Hua Zhou, Xiaobing Zuo, Qing Zhang, Miaoqi Chu, Qingteng Zhang, Ya Gao, Leah K. Roth, Reiner Bleher, Zhiyuan Ma, Zhang Jiang, Jiping Yue, Chien-Min Kao, Chin-Tu Chen, Andrei Tokmakoff, Jin Wang, Heinrich M. Jaeger, and Bozhi Tian, “Dynamic and Programmable Cellular-Scale Granules Enable Tissue-like Materials,” Matter 2, 948–964 (2020).
- Hull and Clyne (1996) D. Hull and T. W. Clyne, An Introduction to Composite Materials, 2nd ed., Cambridge Solid State Science Series (Cambridge University Press, 1996).
- Eshelby and Peierls (1957) John Douglas Eshelby and Rudolf Ernst Peierls, “The determination of the elastic field of an ellipsoidal inclusion, and related problems,” Proceedings of the Royal Society of London. Series A. Mathematical and Physical Sciences 241, 376–396 (1957).
- Mori and Tanaka (1973) T Mori and K Tanaka, “Average stress in matrix and average elastic energy of materials with misfitting inclusions,” Acta Metallurgica 21, 571–574 (1973).
- Shivers et al. (2020) Jordan L. Shivers, Jingchen Feng, Anne S. G. van Oosten, Herbert Levine, Paul A. Janmey, and Fred C. MacKintosh, “Compression stiffening of fibrous networks with stiff inclusions,” Proceedings of the National Academy of Sciences 117, 21037–21044 (2020).
- Phan-Thien (Phan Thiên Nhân) N. Phan-Thien (Phan Thiên Nhân), S. Kim, and S. Wang, “Finite deformation of a random array of rigid spheres in an elastic matrix at high concentration,” Physics of Fluids 33, 113314 (2021).
- Olsson and Teitel (2007) Peter Olsson and S. Teitel, “Critical scaling of shear viscosity at the jamming transition,” Phys. Rev. Lett. 99, 178001 (2007).
- Liu and Nagel (2010) Andrea J. Liu and Sidney R. Nagel, “The jamming transition and the marginally jammed solid,” Annual Review of Condensed Matter Physics 1, 347–369 (2010).
- Zaccone and Scossa-Romano (2011) Alessio Zaccone and Enzo Scossa-Romano, “Approximate analytical description of the nonaffine response of amorphous solids,” Phys. Rev. B 83, 184205 (2011).
- Behringer and Chakraborty (2018) Robert P Behringer and Bulbul Chakraborty, “The physics of jamming for granular materials: a review,” Reports on Progress in Physics 82, 012601 (2018).
- Lacasse et al. (1996) Martin-D. Lacasse, Gary S. Grest, Dov Levine, T. G. Mason, and D. A. Weitz, “Model for the elasticity of compressed emulsions,” Phys. Rev. Lett. 76, 3448–3451 (1996).
- Broedersz et al. (2011) Chase P. Broedersz, Xiaoming Mao, Tom C. Lubensky, and Frederick C. MacKintosh, “Criticality and isostaticity in fibre networks,” Nature Physics 7, 983–988 (2011).
- Bi et al. (2015) Dapeng Bi, J. H. Lopez, J. M. Schwarz, and M. Lisa Manning, “A density-independent rigidity transition in biological tissues,” Nature Physics 11, 1074–1079 (2015).
- Zhao et al. (2022) Weiwei Zhao, Jianhui Zhou, Haitao Hu, Chang Xu, and Qin Xu, “The role of crosslinking density in surface stress and surface energy of soft solids,” Soft Matter 18, 507–513 (2022).
- Francqueville et al. (2020) Foucault de Francqueville, Pierre Gilormini, Julie Diani, and Aude Vandenbroucke, “Relationship between local damage and macroscopic response of soft materials highly reinforced by monodispersed particles,” Mechanics of Materials 146, 103408 (2020).
- Guazzelli and Pouliquen (2018) Elisabeth Guazzelli and Olivier Pouliquen, “Rheology of dense granular suspensions,” Journal of Fluid Mechanics 852, 1 (2018).
- Cardy (1996) John Cardy, Scaling and renormalization in statistical physics, Vol. 5 (Cambridge university press, 1996).
- Sharma et al. (2016) A. Sharma, A. J. Licup, K. A. Jansen, R. Rens, M. Sheinman, G. H. Koenderink, and F. C. MacKintosh, “Strain-controlled criticality governs the nonlinear mechanics of fibre networks,” Nature Physics 12, 584–587 (2016).
- Smallwood (1944) Hugh M. Smallwood, “Limiting Law of the Reinforcement of Rubber,” Journal of Applied Physics 15, 758–766 (1944).
- Ju and Chen (1994) J. W. Ju and T. M. Chen, “Effective elastic moduli of two-phase composites containing randomly dispersed spherical inhomogeneities,” Acta Mechanica 103, 123–144 (1994).
- TORQUATO (2002) Salvatore TORQUATO, Random heterogeneous materials: Microstructure and macroscopic properties (Springer, 2002).
- Bi et al. (2011) Dapeng Bi, Jie Zhang, Bulbul Chakraborty, and R. P. Behringer, “Jamming by shear,” Nature 480, 355–358 (2011).
- Vinutha and Sastry (2016) H. A. Vinutha and Srikanth Sastry, “Disentangling the role of structure and friction in shear jamming,” Nature Physics 12, 578–583 (2016).
- Kumar and Luding (2016) N. Kumar and S. Luding, “Memory of jamming–multiscale models for soft and granular matter,” Granular Matter 18, 58 (2016).
- Baity-Jesi et al. (2017) M. Baity-Jesi, C. P. Goodrich, A. J. Liu, S. R. Nagel, and J. P. Sethna, “Emergent so(3) symmetry of the frictionless shear jamming transition,” Journal of Statistical Physics 167, 735–748 (2017).
- Han et al. (2019) Endao Han, Nicole M. James, and Heinrich M. Jaeger, “Stress controlled rheology of dense suspensions using transient flows,” Phys. Rev. Lett. 123, 248002 (2019).
- Zhao et al. (2019) Yiqiu Zhao, Jonathan Barés, Hu Zheng, Joshua E. S. Socolar, and Robert P. Behringer, “Shear-jammed, fragile, and steady states in homogeneously strained granular materials,” Phys. Rev. Lett. 123, 158001 (2019).
- Jin and Yoshino (2021) Yuliang Jin and Hajime Yoshino, “A jamming plane of sphere packings,” Proceedings of the National Academy of Sciences 118 (2021).
- Pan et al. (2023) Deng Pan, Yinqiao Wang, Hajime Yoshino, Jie Zhang, and Yuliang Jin, “A review on shear jamming,” arXiv preprint arXiv:2306.13416 (2023).
- Han et al. (2018) Endao Han, Matthieu Wyart, Ivo R. Peters, and Heinrich M. Jaeger, “Shear fronts in shear-thickening suspensions,” Phys. Rev. Fluids 3, 073301 (2018).
- Xu et al. (2020) Qin Xu, Lawrence A. Wilen, Katharine E. Jensen, Robert W. Style, and Eric R. Dufresne, “Viscoelastic and poroelastic relaxations of soft solid surfaces,” Phys. Rev. Lett. 125, 238002 (2020).
- van Oosten et al. (2019) Anne S. G. van Oosten, Xingyu Chen, LiKang Chin, Katrina Cruz, Alison E. Patteson, Katarzyna Pogoda, Vivek B. Shenoy, and Paul A. Janmey, “Emergence of tissue-like mechanics from fibrous networks confined by close-packed cells,” Nature 573, 96–101 (2019).
- Song et al. (2023) Jake Song, Elad Deiss-Yehiely, Serra Yesilata, and Gareth H McKinley, “Strain stiffening universality in composite hydrogels and tissues,” arXiv preprint arXiv:2307.11687 (2023).
METHODS
Material preparation
Particle inclusions — Both the PS and glass particles are micron-sized spheres with size distributions that can be described by the log-normal function . For the PS particles, m and . For the glass particles, m and . The shear modulus of the particles, , was measured by compressing individual beads between two flat substrates using a nanoindenter (Bruker, Hysitron TI-980). The resulting force–displacement curves were fitted to the Hertzian contact model (see Fig. S1(b) in the Supplementary Materials). The results showed that GPa and 15.8 GPa for the PS and the glass particles, respectively.
Soft matrix — The PDMS matrix was made by mixing a silicone base vinyl-terminated polydimethylsiloxane (DMS-V31, Gelest Inc) with copolymer crosslinkers (HMS-301, Gelest Inc) and a catalyst complex in xylene (SIP6831.2, Gelest Inc). We prepared two mixture solutions, Gelest Part A and Gelest Part B, before curing. In particular, Part A consisted of a silicone base with 0.005 wt% catalyst, and Part B consisted of a silicone base with 10 wt% crosslinkers. By changing the weight ratio of A to B from 14.5:1 to 8:1, we varied from 0.04 kPa to 4 kPa.
Fabrication of the soft composites— We prepared disk-shaped composite samples with 10 mm radius and 10 mm height an acrylic mold covered with a para-film. To fully relax the internal structures, we used a vortex mixer (BV1000, Benchmark Scientific Inc.) to vibrate the samples immediately after mixing all the components. For , we compressed the samples using a glass plate to flatten the top surface. Each sample was then left to cure at room temperature for at least 48 hr.
Criticality analysis
Scaling form of the equations of states — We first show how the scaling form of the equations of state shown in main text Eq. 4 can be obtained by minimizing a scale-invariant phenomenological free energy. Denote the singular part of the free energy of a dense granular suspension () under a given axial strain as , where is the dimensionless shear modulus, and is the reduced volume fraction. For a given length scale , we assume that the free energy is self-similar near the critical point ,
| (M1) |
where is the space dimension, and and are the scaling dimensions of and , respectively. Considering , Eq. M1 can be expressed as
| (M2) |
where and are different forms of the free energy in the regimes of and , respectively.
For a composite with , the parameters are analogous to in the Ising model. We define as the dimensionless shear modulus of the elastomer matrix. To transform the variable by substituting with , we minimize the following Legendre transformation function
| (M3) |
In soft composites, and are in direct analogy to the Helmholtz free energy and Gibbs free energy in thermodynamic systems. The explicit evaluation of Eq. M3 leads to
| (M4) |
where , and . By defining as the inverse functions of , we obtain the scaling form of the equations of state shown in Eq. 5 of the main text:
| (M5) |
For , we have
| (M6) |
Compared with Eq. 2 in the main text, we have .
In addition, Eq. M5 suggests that at the critical point to prevent the divergence of free energy. Therefore, we have
| (M7) |
Compared with Eq. 3 in the main text, we obtain .
Explicit form of the equations of states — We next derive the explicit form of the equation of states in Eq. 5 in the main text. Based on the scale-invariant expression of Eq. M1, the expansion of should comprise terms with . Therefore, can be expressed as
| (M8) |
where , and are the expansion coefficients for and . By evaluating the variation in Eq. M3, we obtain
| (M9) |
The above equation can be further simplified by including only three terms to describe the key experimental observations. First, when to ensure that the free energy is minimum at while . Second, when to ensure that at . Finally, because in the matrix-dominated regime, we have when . As a consequence, can be simplified as
| (M10) |
Due to the intrinsic nature of a continuous phase transition at , we have with for both and 2. By defining the reduced variables and , Eq. M10 can be rewritten as
| (M11) |
where , , and . In the regime of , we experimentally observed as , suggesting that . Therefore, we finally obtain
| (M12) |
which is Eq. 5 in the main text.
The role of the material constants and — In the particle-dominated regime, when and , the nonzero solution of from Eq. M12 gives the prefactor in the scaling of the shear modulus . The value of can be obtained by solving
| (M13) |
and is thus determined by both and .
In the critical regime, as and both and , Eq. M12 reduces to , which gives .
Acknowledgments
We thank Bulbul Chakraborty, Yilong Han, Hisao Hayakawa, Ryohei Seto, and Xiang Cheng for the insightful discussions. The work was supported by the Early Career Scheme (No. 26309620), the General Research Fund (No. 16307422), and the Collaborative Research Fund (No. C6004-22Y and No. C6008-20E) from the Hong Kong Research Grants Council (RGC). We also appreciate the support of the Partnership Seed Fund from Asian Science and Technology Pioneering Institutes of Research and Education League (No. ASPIRE20211). Yiqiu Zhao acknowledges the support from the RGC postdoctoral fellowship (PDFS2324-6S02). Hanqing Liu is supported by the U.S. Department of Energy, Office of Science, Nuclear Physics program and by the Quantum Science Center.
Author Contributions
Y. Z., Y. W. and Q. X. designed the project. Y. Z., H. H., C. Y., and C. X. conducted the experimental measurements. Y. Z. and Q. X. analyzed the experimental data. H. L., Y. Z., and Q. X. built the scaling model. Y. H. and R. Z. performed the simulations on the isotropic jammed states. Y. Z., H. L., and Q. X. wrote the manuscript.
Competing interests
The authors declare that they have no conflict of interest.
Data and materials availability
The data that support the findings of this study are available from the authors on request.