A lanthanide-rich kilonova in the aftermath of a long gamma-ray burst
Abstract
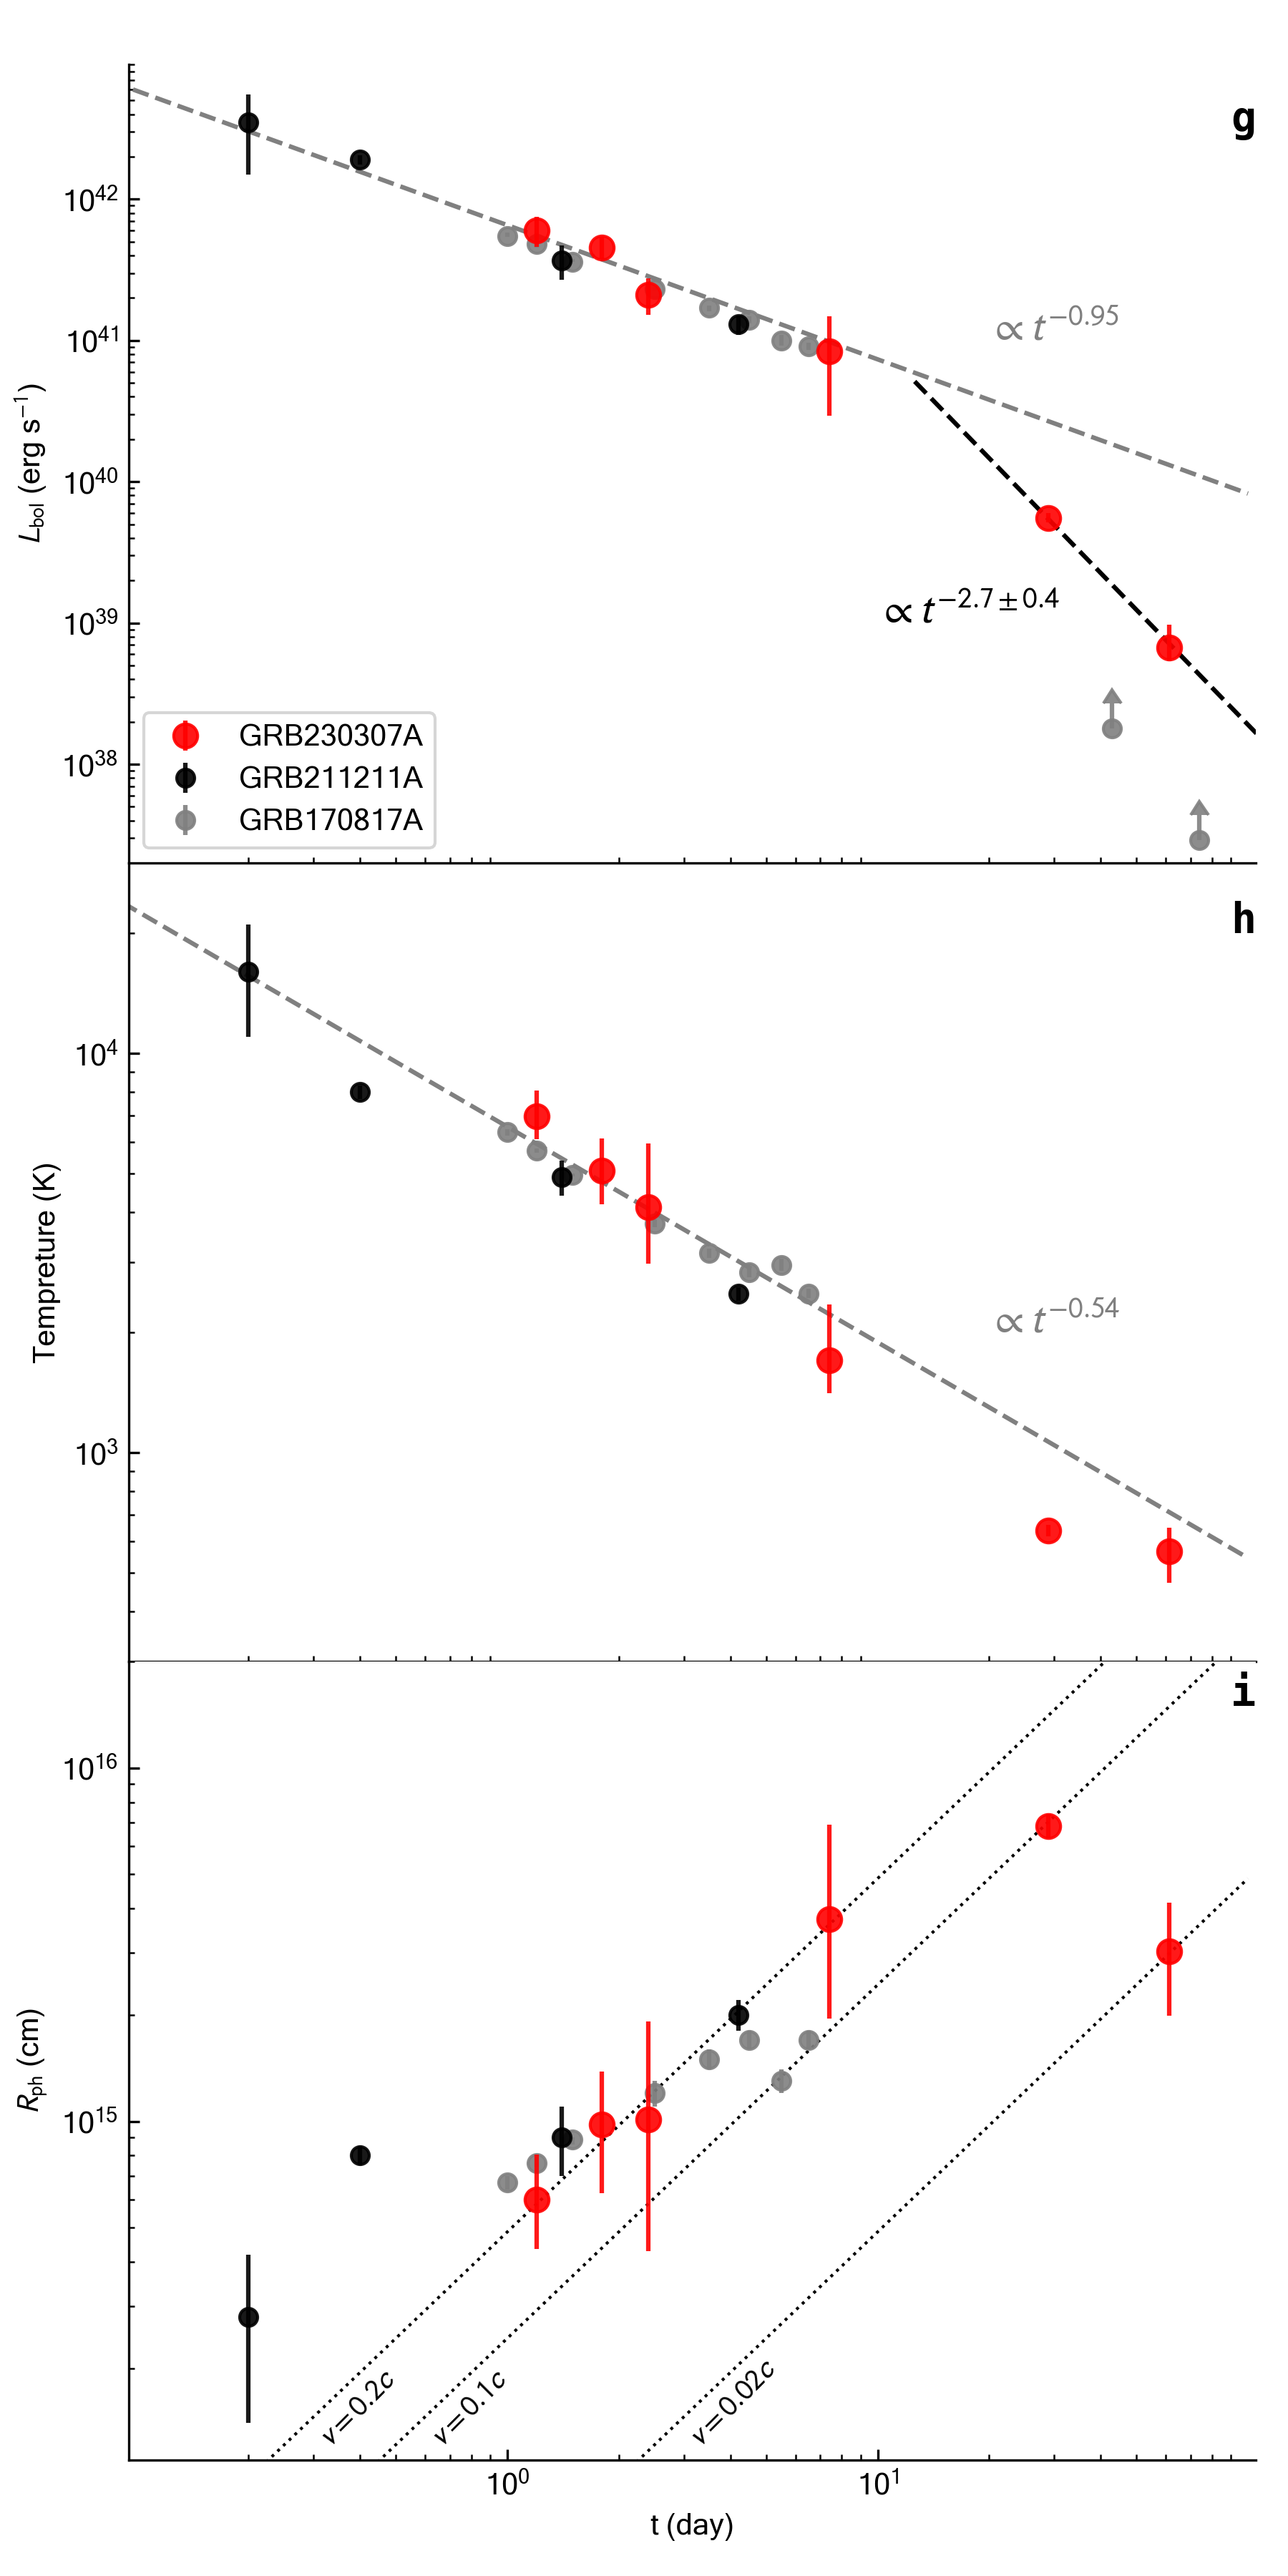
Kilonovae are a rare class of astrophysical transients powered by the radioactive decay of nuclei heavier than iron, synthesized in the merger of two compact objects [1, 2, 3, 4]. Over the first few days, the kilonova evolution is dominated by a large number of radioactive isotopes contributing to the heating rate[2, 5]. On timescales of weeks to months, its behavior is predicted to differ depending on the ejecta composition and merger remnant[6, 7, 8, 9]. However, late-time observations of known kilonovae are either missing or limited[10, 11]. Here we report observations of a luminous red transient with a quasi-thermal spectrum, following an unusual gamma-ray burst of long duration. We classify this thermal emission as a kilonova and track its evolution up to two months after the burst. At these late times, the recession of the photospheric radius and the rapidly-decaying bolometric luminosity () support the recombination of lanthanide-rich ejecta as they cool.
Department of Physics, University of Rome “Tor Vergata”, via della Ricerca Scientifica 1, I-00133 Rome, Italy
INAF - Istituto Nazionale di Astrofisica, 00133 Rome, Italy
Department of Physics, The George Washington University, 725 21st Street NW, Washington, DC 20052, USA
Department of Astronomy, University of Maryland, College Park, MD 20742-4111, USA
Astrophysics Science Division, NASA Goddard Space Flight Center, 8800 Greenbelt Rd, Greenbelt, MD 20771, USA
Computer, Computational, and Statistical Sciences Division, Los Alamos National Laboratory, Los Alamos, NM87545, USA
Center for Theoretical Astrophysics, Los Alamos National Laboratory, Los Alamos, NM87545, USA
The University of Arizona, Tucson, AZ85721, USA
Department of Physics and Astronomy, The University of New Mexico, Albuquerque, NM87131, USA
The George Washington University, Washington, DC20052, USA
SNU Astronomy Research Center, Astronomy Program, Dept. of Physics & Astronomy, Seoul National University, Seoul 08826, Republic of Korea
Istituto Nazionale di Ricerca Metrologica, I-10135 Torino, Italy
INAF - Istituto di Radioastronomia, via Gobetti 101, I-40129 Bologna, Italy
Centro Brasileiro de Pesquisas Físicas, Rua Dr. Xavier Sigaud 150, CEP 22290-180, Rio de Janeiro, RJ, Brazil
Centro Federal de Educação Tecnológica Celso Suckow da Fonseca, Rodovia Mário Covas, lote J2, quadra J, CEP 23810-000, Itaguaí, RJ, Brazil
Instituto de Astrofísica de Andalucía (IAA-CSIC), Glorieta de la Astronomía s/n, 18080 Granada, Spain
Unidad Asociada al CSIC Departamento de Ingeniería de Sistemas y Automática, Escuela de Ingenierías Industriales, Arquitecto Francisco Peñalosa, 6, 29071 Málaga.
Institute for Frontier in Astronomy and Astrophysics, Beijing Normal University, Beijing 102206, China
Department of Astronomy, Beijing Normal University, Beijing 100875, China
Department of Astronomy and Astrophysics, The Pennsylvania State University, 525 Davey Lab, University Park, PA 16802, USA
Perimeter Institute for Theoretical Physics, 31 Caroline St. N., Waterloo, ON, N2L 2Y5, Canada
Physics Department, University of Bath, Claverton Down, Bath BA2 7AY, United Kingdom
Department of Astronomy, School of Physical Sciences, University of Science and Technology of China, Hefei 230026, China
Kavli Institute for Astrophysics and Space Research, Massachusetts Institute of Technology, Cambridge, MA, USA
Center for Interdisciplinary Exploration and Research in Astrophysics (CIERA) and Department of Physics and Astronomy, Northwestern University. Evanston, IL 60208, USA
Korea Astronomy and Space Science Institute, 776 Daedeok-daero, Yuseong-gu, Daejeon 34055, Republic of Korea
International Center for Advanced Studies & Instituto de Ciencias Físicas, ECyT-UNSAM & CONICET, 1650, Buenos Aires, Argentina
SOAR Telescope/NSF’s NOIRLab, Avda Juan Cisternas 1500, 1700000, La Serena, Chile
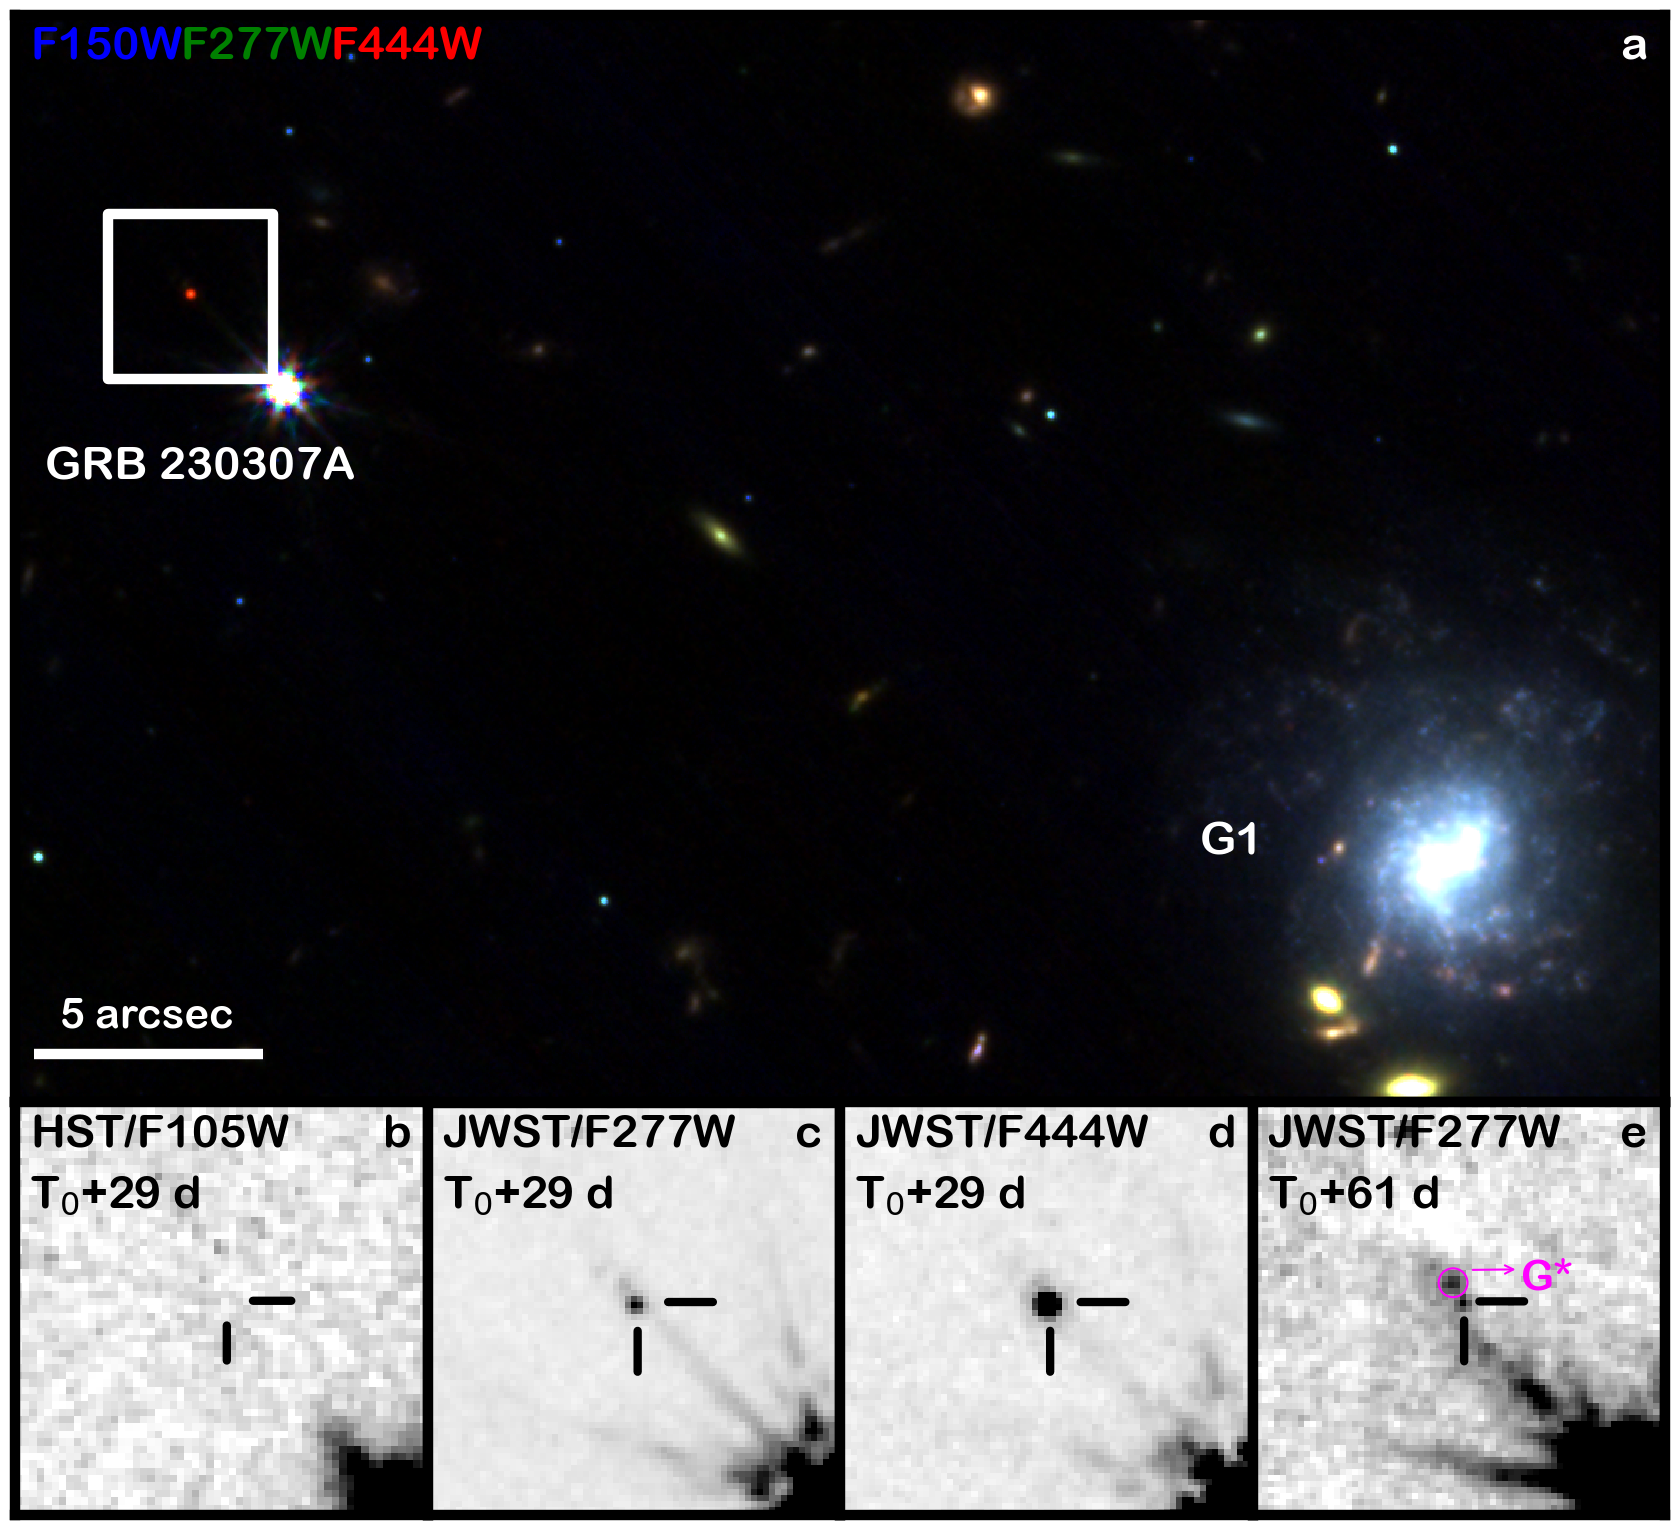
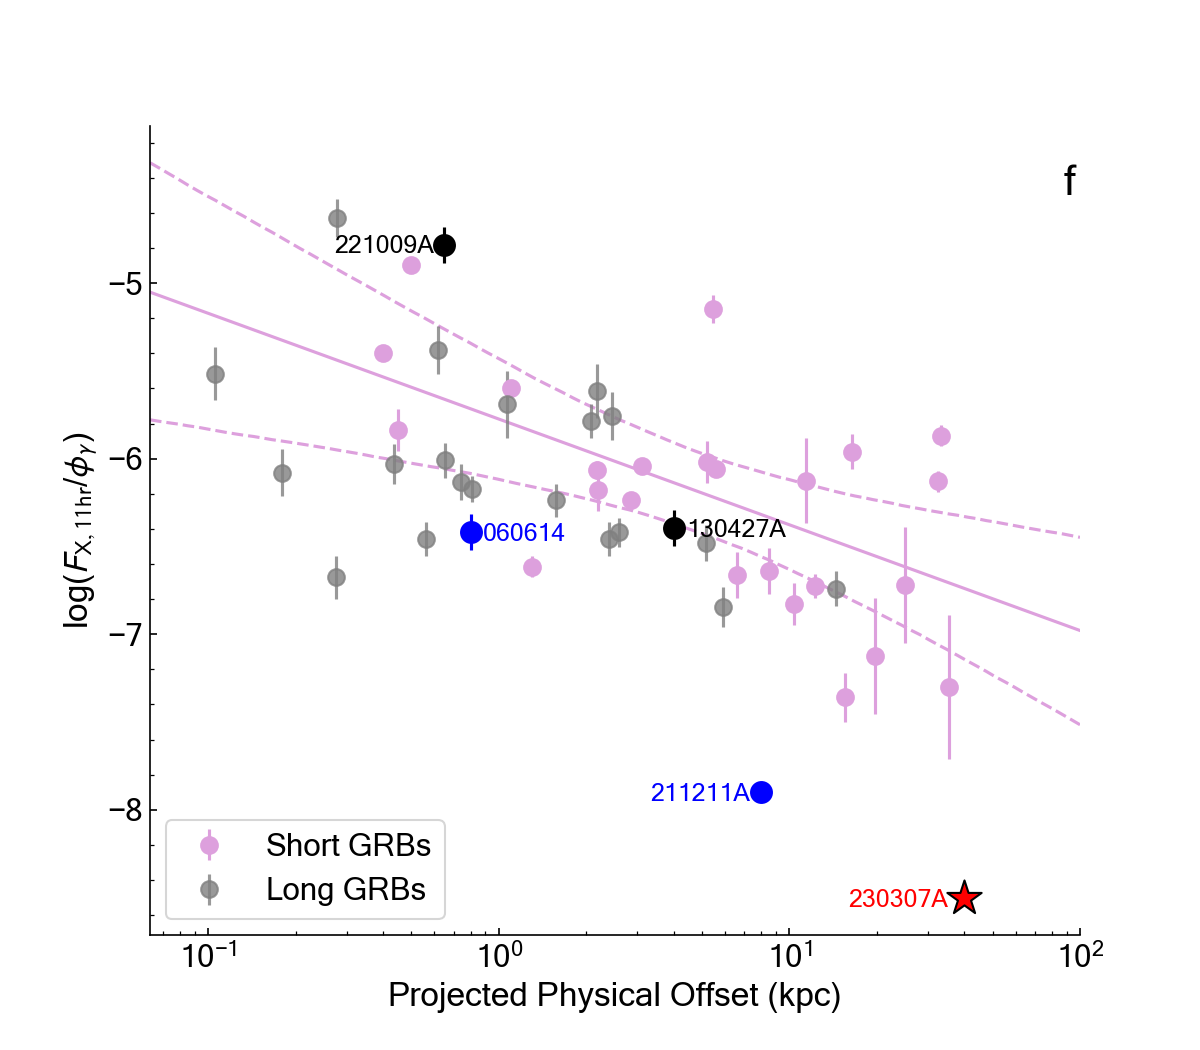
An extremely bright gamma-ray burst (GRB) of long duration (40 s) triggered the Gamma-ray Burst Monitor aboard Fermi[12] at 15:44:06.67 on March 7th, 2023 (hereafter ). The same event, dubbed GRB 230307A, was detected by a variety of high-energy satellites[13], which refined its sky localization to an area of 8 arcmin2 (Ref. [13]), and thus enabled follow-up observations at X-ray, optical and near-infrared (nIR) wavelengths. Based on its duration and spectral properties, this event appeared consistent, at least initially, with the majority of GRBs produced by the core collapse of rapidly rotating massive stars (see Methods). Its gamma-ray fluence of erg cm-2 ( keV)[14] is the second highest value ever recorded in over 50 years of GRB observations[15]. Its X-ray counterpart, discovered by NASA’s Neil Gehrels Swift Observatory[16], is instead underwhelming. In fact, when compared to the population of GRBs, the ratio of X-ray flux at +11 hr to gamma-ray fluence, , appears exceedingly faint (Figure 1f). Observations at optical and nIR wavelengths also identified a weak counterpart, whose flux density ( AB mag at +1.2 d ) matches the extrapolation of the X-ray spectrum. The spectral energy distribution (SED) of the GRB counterpart thus disfavors absorption by gas and dust as a possible explanation for its faintness (Methods), and indicates that this is an intrinsic property of the explosion.
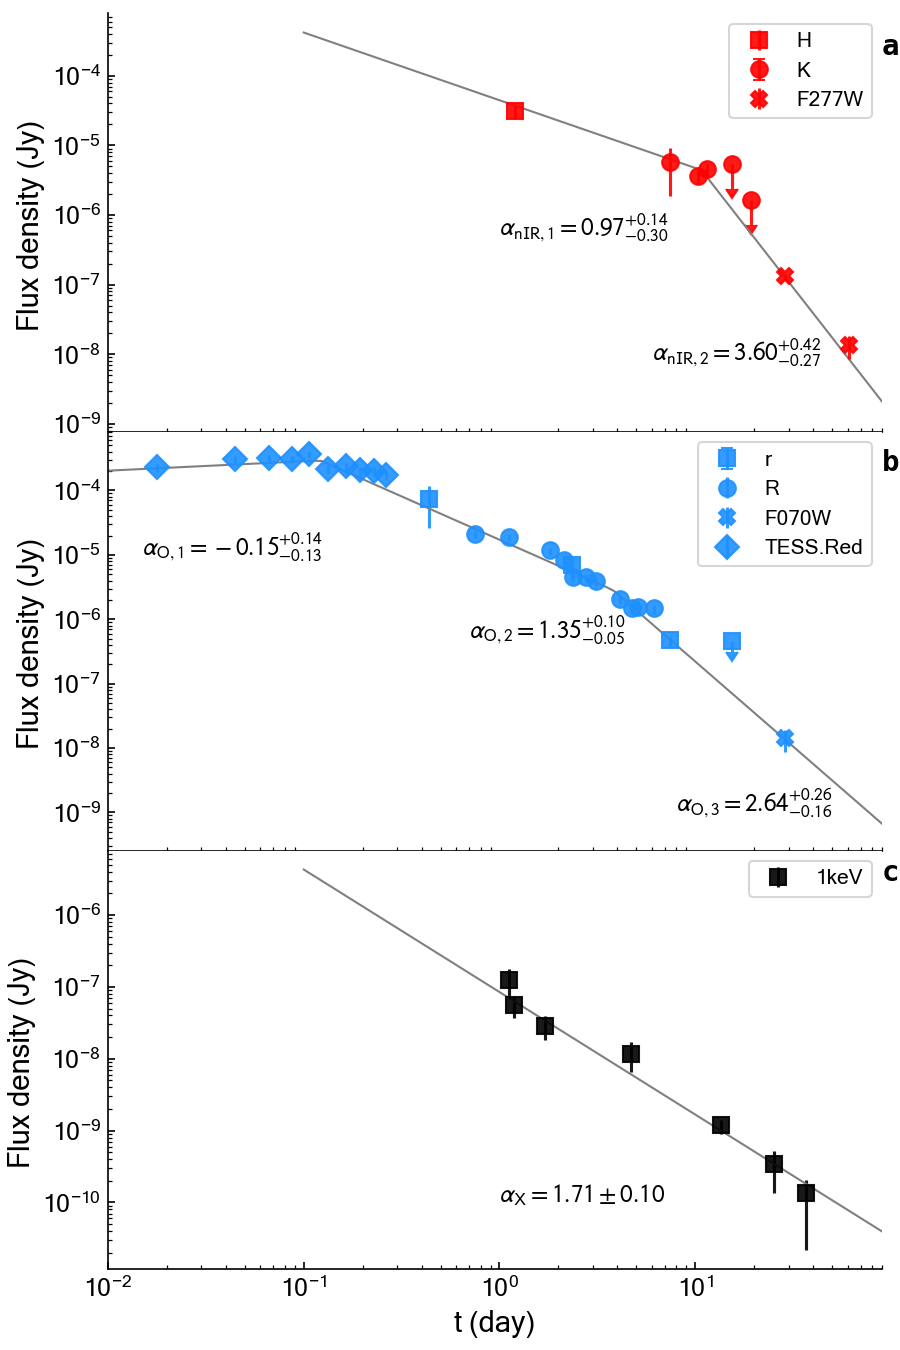
Continued monitoring of the GRB counterpart tracked its evolution for the next two months, revealing an unexpected and strong color evolution (Figure 2): after +4 d the X-ray and optical emission decayed quickly, with temporal power-law indices and , respectively. Instead, the nIR emission persisted (22 AB mag at +7 d) for several days after the explosion, and then rapidly declined. Late-time (+29 d) observations with the Hubble Space Telescope (HST) and the James Webb Space Telescope (JWST) show that the peak of the nIR emission shifted from 22,000 Å at +7 d to 44,000 Å at +29 d. At this time (+29 d), the continuum is adequately described by the superposition of a power-law spectrum with spectral index and a blackbody spectrum with temperature K (observer frame; Methods).
Observationally, GRB 230307A stands out from the general population of long GRBs for these three properties: a record-setting gamma-ray fluence, a weak X-ray counterpart, and a strong blue-to-red color evolution. The key ingredient to interpret these observations is the GRB distance scale. Unfortunately, in the case of GRB 230307A, no direct redshift measurement is available and only mild constraints (3.1) are placed by optical spectroscopy of its counterpart at +2.4 d[17]. Our analysis of the photometric dataset, and in particular the detected signal in the blue filters ( and ), provides independent evidence for a redshift 3.3 (at the 95% confidence level, c.l.; see Methods). This leaves a range of possible distance scales that is too broad for constraining the properties of GRB 230307A.
An alternative route to estimate the GRB’s distance is to identify its host galaxy using probabilistic arguments[18]. In the case of GRB 230307A, this methodology leads to several possible host galaxies: 1) a distant (3.9) star-forming galaxy, located just 0.3 arcsec away from the GRB position (G∗ in Figure 1e); 2) a local origin in either the Large or the Small Magellanic Cloud, located 10∘ away from the GRB; 3) a nearby (0.0647, corresponding to 291 Mpc[19]) face-on spiral galaxy located at an offset of 30 arcsec (G1 in Figure 1a). Each of these three possibilities leads to extreme properties for GRB 230307A.
The high-redshift solution fits well within the classification of GRB 230307A as a long burst from a young stellar population. However, a high redshift of is in tension with the limits from optical measurements (3.3). Moreover, it would imply an unprecedented gamma-ray energy release ( erg) followed by the onset of an extremely luminous and blue ( at 2 d) transient, which has never been observed before. These considerations lead us to disfavor the association between the GRB and the distant galaxy G∗.
The next most likely associations, in terms of posterior probability, are the Magellanic Clouds at a distance of only 50 kpc from Earth. This distance scale would drive GRB 230307A to the opposite extreme of a low-luminosity high-energy transient, consistent with the population of giant flares (GFs) from soft gamma-ray repeaters, rather than GRBs. However, these GFs are characterized by a quasi-thermal spectrum[20], which is not observed in GRB 230307A[21]. Unlike GRB 200425A, a candidate extra-galactic GF[22], the low-energy photon index of GRB 230307A is [23], consistent with the non-thermal shape of GRBs. Based on the properties of its high-energy emission, a local origin for GRB 230307A is likewise disfavored.
The low redshift (0.0647) solution presents similarities (e.g. the red color and the lack of a typical Type Ic supernova) with the case of GRB 211211A[24, 25, 26], a long duration burst followed by a kilonova and, thus, associated with the merger of two compact objects. At only 291 Mpc from Earth, the projected physical distance between the GRB localization and the spiral galaxy, G1, would be 40 kpc, among the largest values measured for GRBs[27]. This seems consistent with the low X-ray flux to gamma-ray fluence ratio, also observed for GRB 211211A[24], and interpreted as an indication of a burst in a low-density environment[28, 29]. However, even this interpretation is not free from uncertainties. In the case of GRB 230307A, the complex morphology of the gamma-ray lightcurve hardly resembles any of the previous examples of short GRBs with extended emission[30, 31, 23]. Additionally, the probability of chance alignment between the GRB and the nearby galaxy G1 is 13%, a value generally considered too high for a reliable physical association[32, 33].
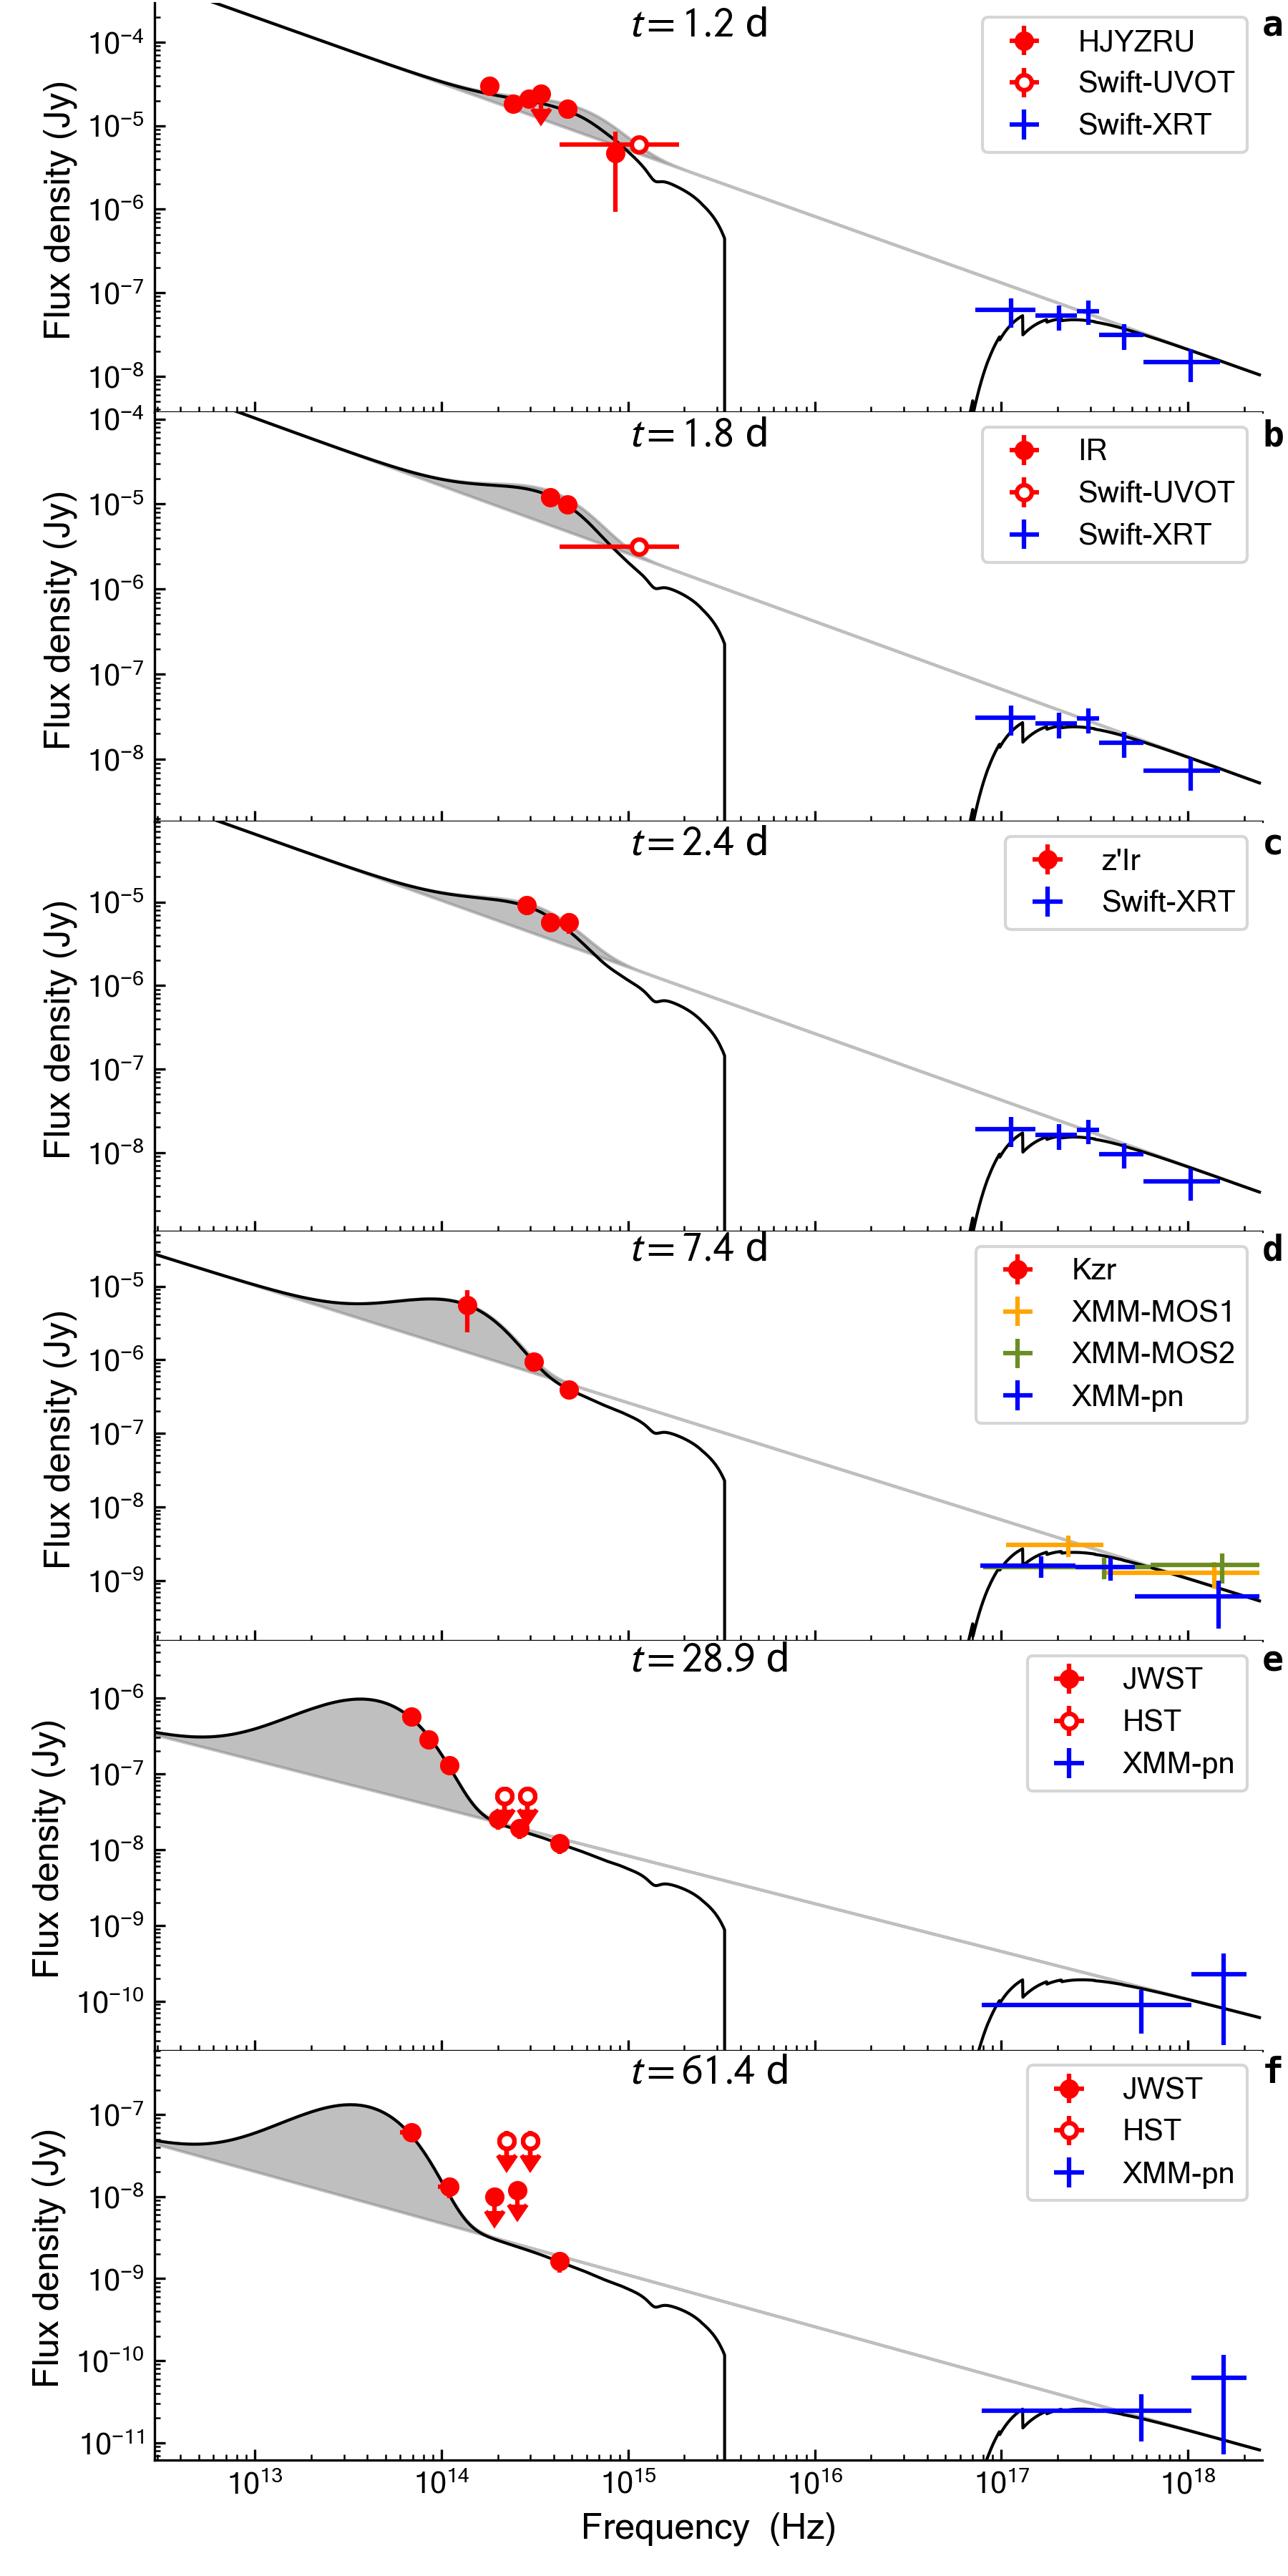
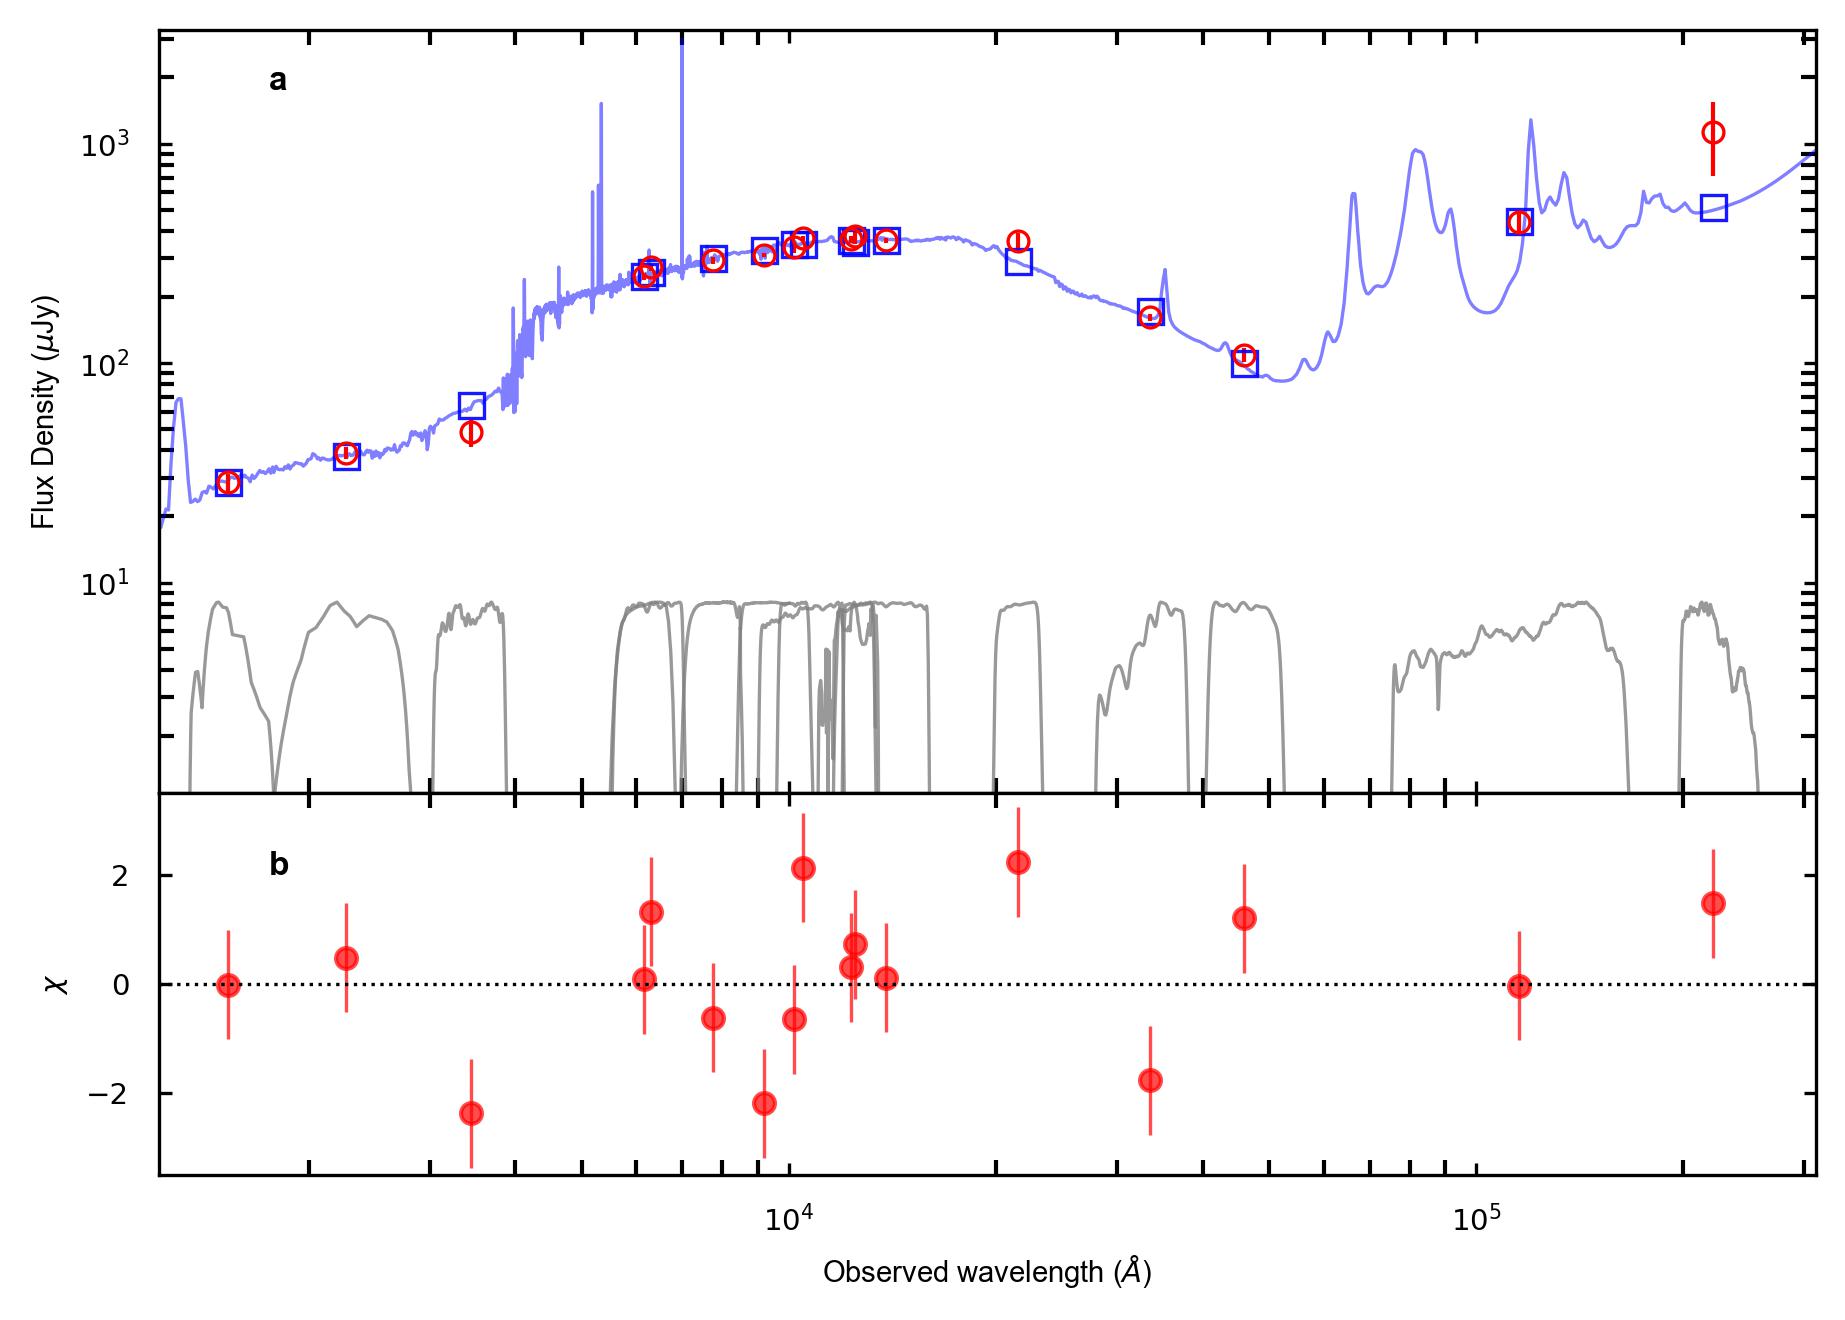
Further insights can be gleaned from the SED of the GRB counterpart. We modeled the SED with a power-law plus a blackbody component (see Methods). The results show that a thermal component exists in all spectra acquired +1 d (Figure 3a-f). A thermal dust echo, emitted by the circumburst medium heated by the bright GRB flash, could produce a similar observational signature in the infrared[34, 35]. However, several lines of evidence do not support this interpretation: the GRB location, the low-density environment suggested by the afterglow data (Figure 1), and the limits to the rest-frame absorption (0.03 and cm-2, 3 c.l.) do not provide evidence for a GRB jet interacting with a dense medium. The most natural explanation is that the infrared emission arises from the radioactive ejecta responsible for the bluer thermal component identified at early times.
Furthermore, until +10 d, it exhibits a trend of decreasing temperature and increasing radius, which is consistent with an expanding fireball. By assuming homologous expansion and imposing that the expansion velocity cannot exceed the speed of light, we obtain 0.43 and rule out a high-redshift origin for GRB 230307A. Additionally, at the putative distance of 291 Mpc, the temperature and radius of the thermal component match the evolution of the kilonova counterparts of GRBs 170817A[10] and 211211A[24] (Figure 3). This evidence provides additional support to the association between GRB 230307A and G1, and points to a new case of a kilonova following a long-duration GRB.
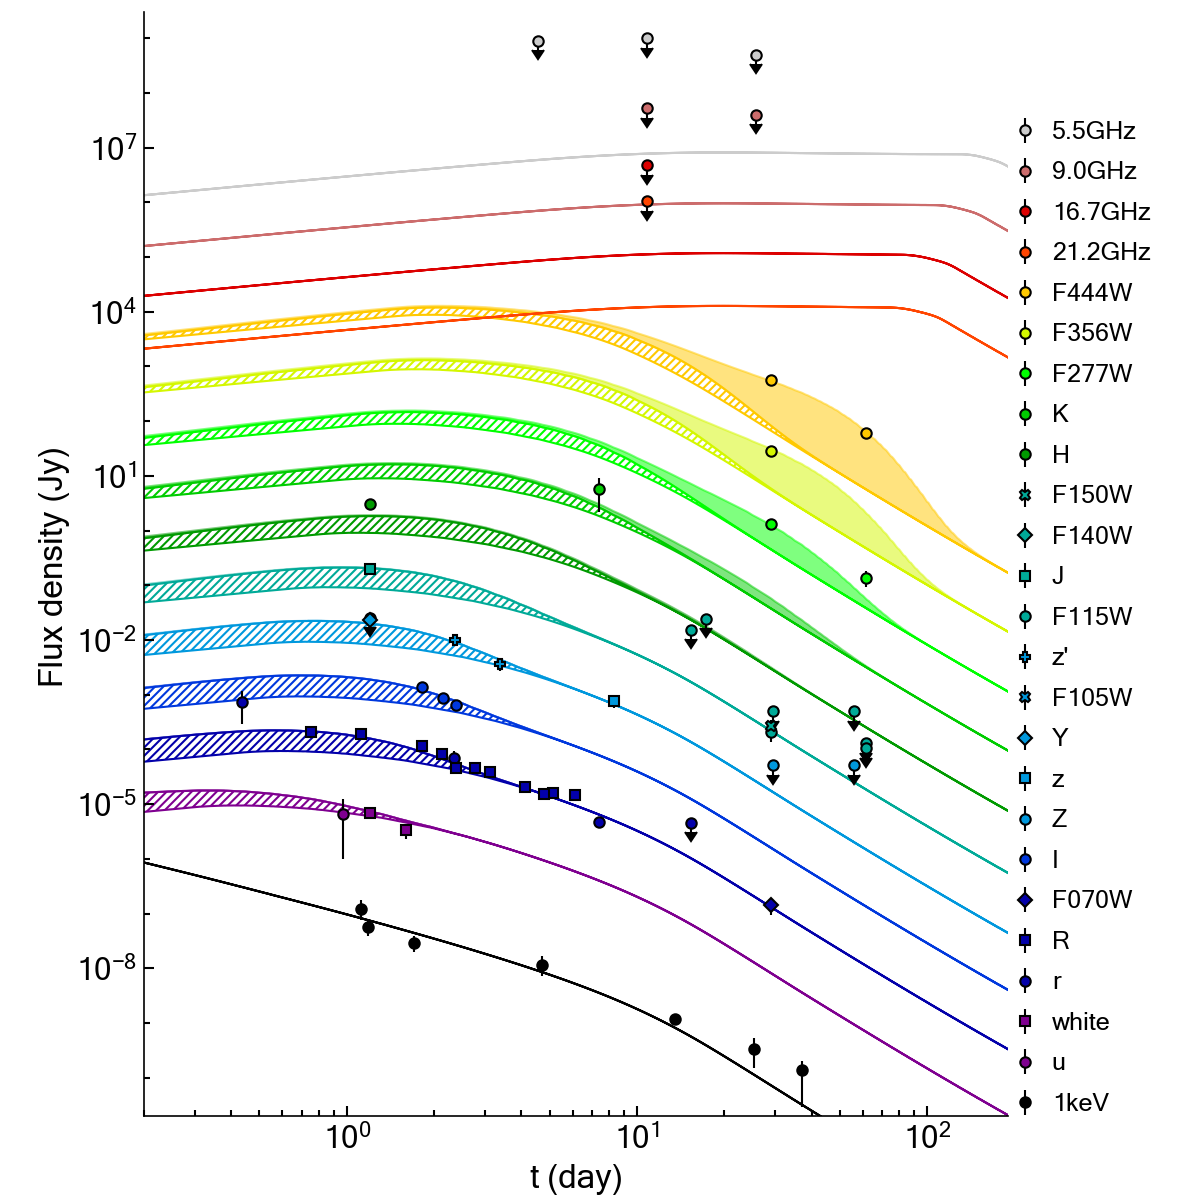
Based on this classification, we adopt an afterglow plus kilonova model to describe the multi-wavelength counterpart. The afterglow component describes the non-thermal emission arising from the relativistic ejecta and their interaction with the ambient medium[36]. The kilonova component instead accounts for the thermal emission arising from the sub-relativistic radioactive ejecta[2]. Multiple afterglow solutions are possible depending, among other factors, on the strength of the reverse shock and the collimation of the relativistic outflow (Methods). However, regardless of the details of the explosion, the inclusion of a kilonova component represents a significant improvement in all cases ().
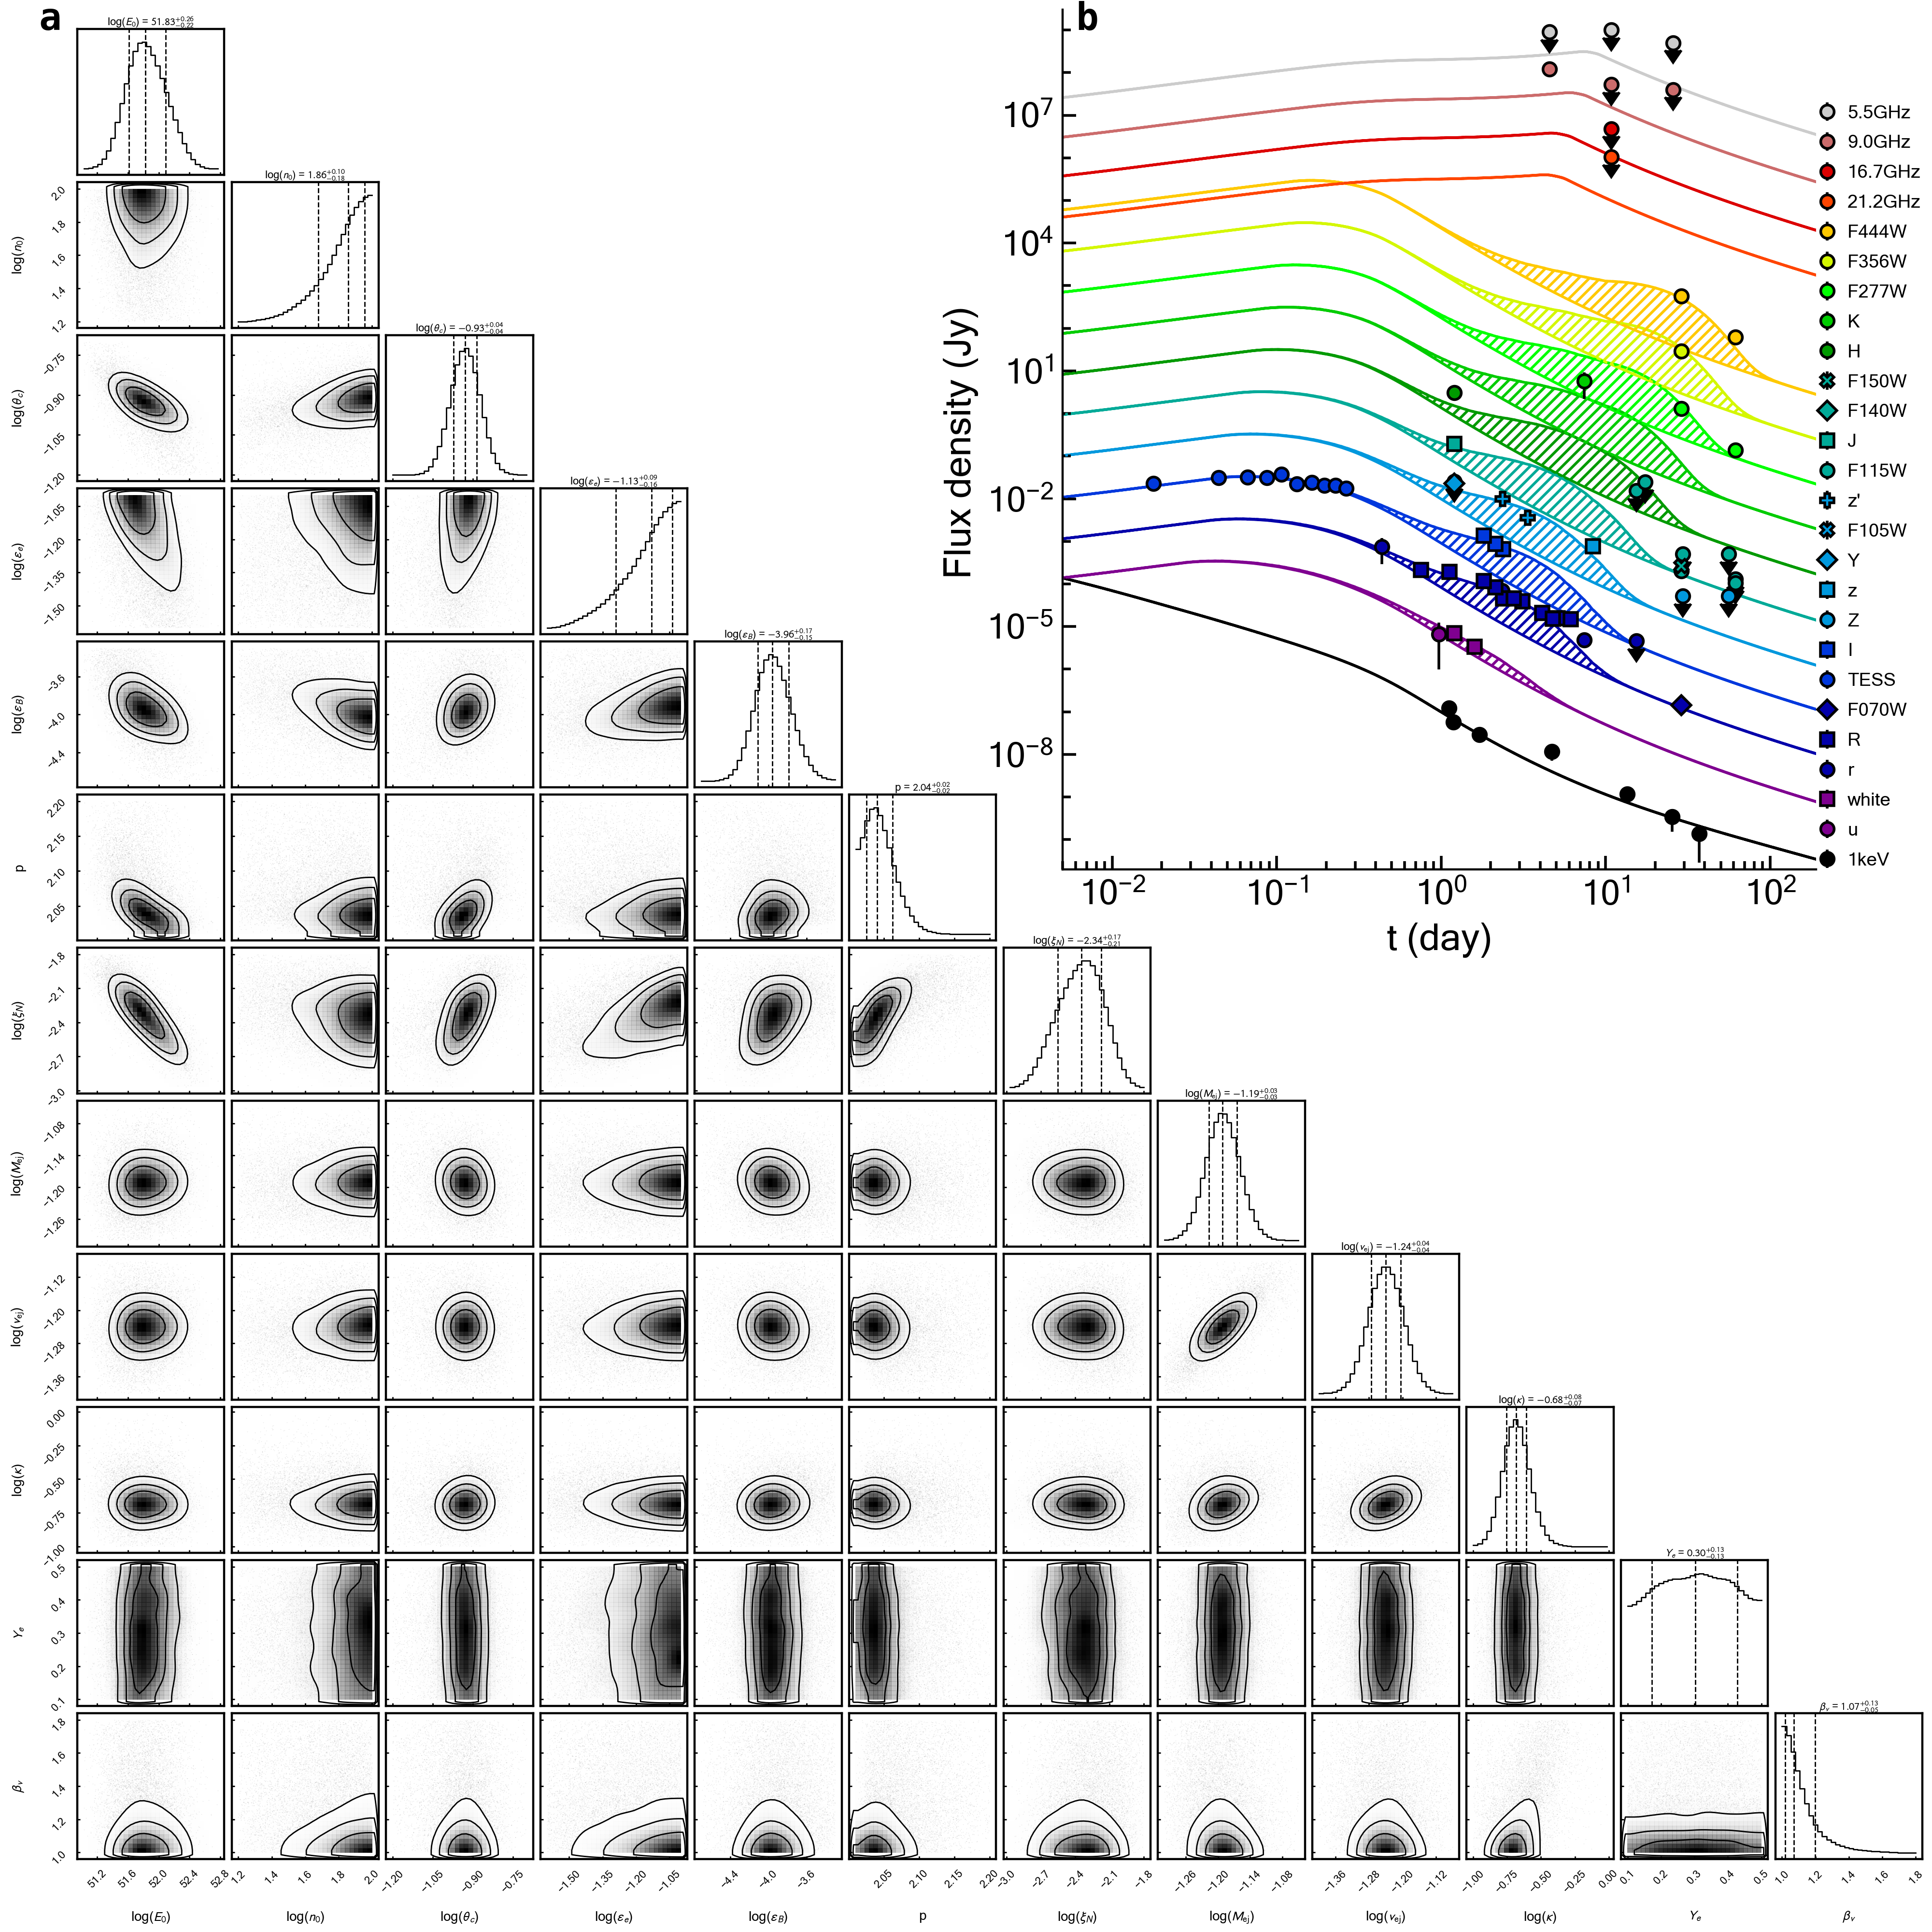
For our fiducial afterglow model (Figure 2), we find strong evidence in favor of two kilonova components over the single kilonova component (). The former component is produced by fast moving ejecta () with mass and opacity (3 c.l.). This component mostly contributes to the optical and near-infrared emission over the first few days, then quickly fades away. The latter component is produced by slightly more massive (), slower () ejecta with a significantly higher opacity (, 3 c.l.). This component becomes visible after +10 d and dominates the late-time emission. Its inclusion is mostly driven by the mid-infrared detections and their steep spectral profile (), and relies on the assumption that the contribution of emission lines remains subdominant[17].
To derive the kilonova properties, we need to estimate the underlying non-thermal emission. To this aim, we adopt two possible models for the non-thermal component: an empirical description based on the observed decay of the X-ray afterglow with temporal slope (Extended Data Figure 6c), and an afterglow model which favors a narrowly-collimated outflow with a steep temporal slope (Figure 2). Additionally, a bolometric correction is calculated based on the best-fit blackbody model. As shown in Figure 3h, at approximately +7 d, the effective temperature of the thermal component drops below 2,000 K, and the photospheric layer exhibits a tendency to recede into the inner regions. The velocity distribution as a function of mass can affect the evolution of the photosphere, but would produce a more gradual transition. A similar trend is instead observed in some Type II supernovae (SNe) during their hydrogen recombination phase[37]. In the case of a kilonova, the drop in effective temperature changes the ionization states of lanthanides and actinides, transitioning from singly ionized to neutral states, at the critical temperature of around 2,500 K[38]. With a lower number of free electrons, the number of infrared bound-bound lines decreases considerably[39, 40, 41]. This causes a drop in the optical depth (Extended Data Figure 10), accelerating the recession of the photosphere. The outer layers instead enter into an optically thin phase.
The kilonova luminosity is seen to rapidly decrease as (Figure 3g), ranging from erg s-1 at 29 d to erg s-1 at 61 d. A rapid decay of the luminosity was identified in the late-time observations of the kilonova AT2017gfo[10, 42], and interpreted as the possible signature of short-lived heavy isotopes dominating the heating rate and thus the observed emission. However, in the case of AT2017gfo, the weak signal and limited coverage of the Spitzer data were not sufficient to characterize the spectral shape, and only placed lower limits to the true bolometric luminosity. In the case of GRB 230307A, the sensitivity and multi-color coverage of JWST and HST observations allow for better sampling. The data show that the ejecta is only partially optically thin and its late-time near-infrared luminosity is still dominated by photospheric emission of the inner layers. The evolution of the photosphere is consistent with adiabatic expansion and does not require a drop in the heating rate to explain the change in luminosity. Although this implies that no specific element can be identified based on temporal evolution, the fast decay of the luminosity can still inform us on the properties of this kilonova.
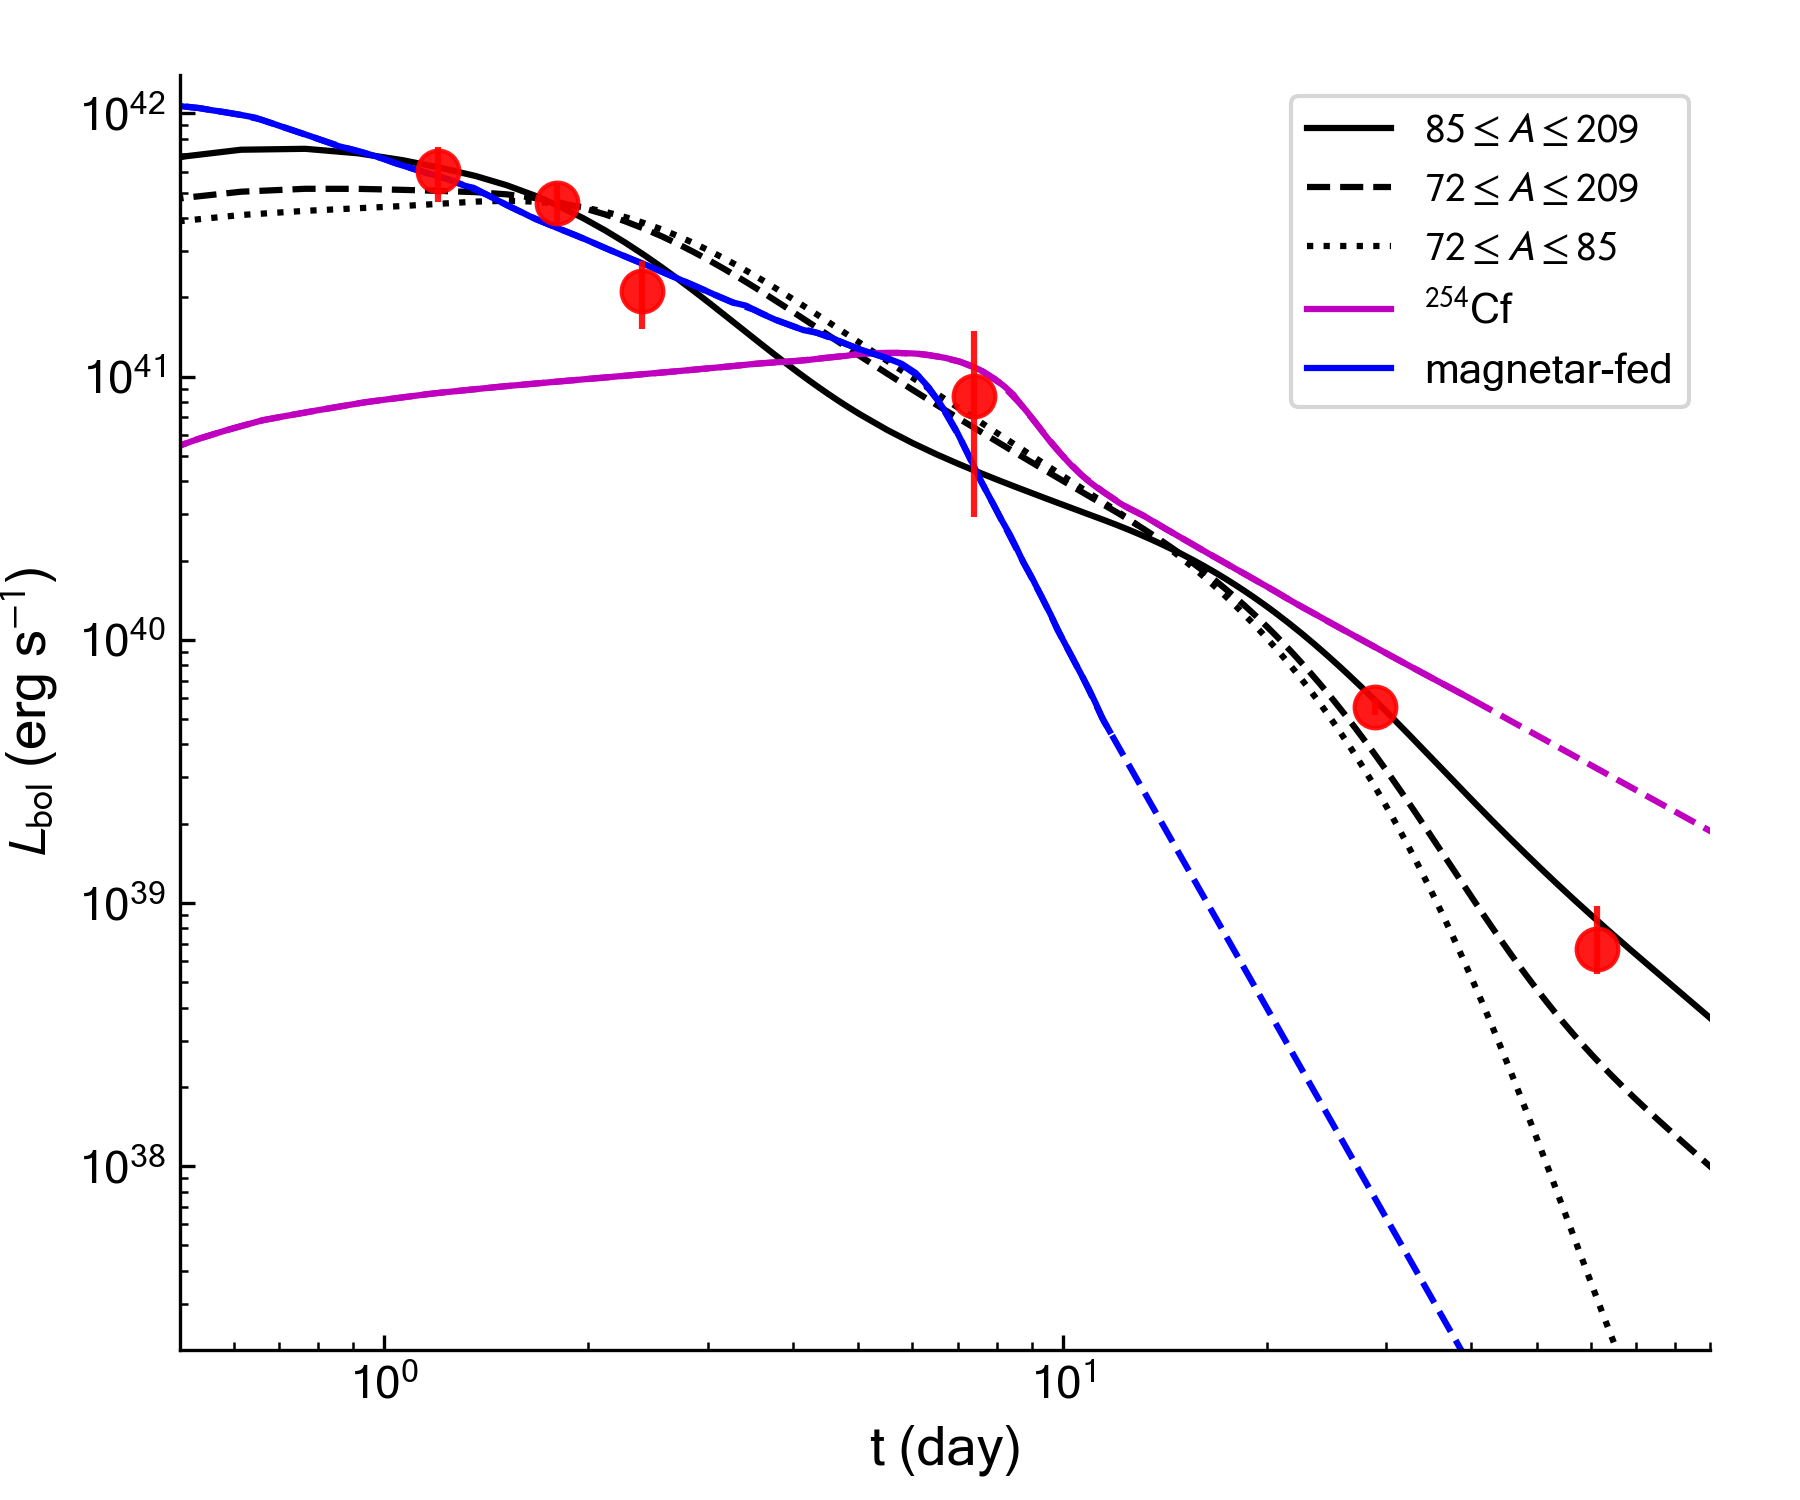
Predictions of the late-time behavior of a kilonova span a wide range of behaviors, depending on nuclear inputs and ejecta properties (e.g. total mass, total energy, velocity distribution, ejecta composition). A common expectation is that, if translead nuclei such as 254Cf are produced in the explosion, their decay products would deposit energy into the ejecta and power a rise in the emission at late times, e.g. beyond 30 d[43, 44]. This would cause the kilonova luminosity to flatten over time, at odds with observations. The rapid decay of the IR light thus suggests that energy from actinide fission was not efficiently deposited into the ejecta.
A hot central engine powering the lightcurve can also alter the late-time emission (e.g. magnetar, pulsar or fall-back accretion). The long duration of GRB 230307A, as well as its soft X-ray plateau, can be interpreted as the spin-down emission from a magnetar remnant[14]. In this case, we would expect the kilonova to become bluer when the photons from this long-lived engine reach the photosphere. Although it might take a few days before observing the effects of the inner engine[9], the fact that the kilonova progressively becomes redder up to +61 d, and that we do not see a blue component from the uncovering of a long-lived central engine argues against energy deposition from a remnant magnetar.
By comparing the bolometric lightcurve with different models (Figure 4), a radioactive-powered kilonova containing r-process elements beyond the first peak () display a better agreement with the data. This is because lighter elements have shorter lifetimes and cannot provide sufficient radioactive power at these late epochs, resulting in a dimmer and cooler kilonova. The efficient energy deposition of a long-lasting magnetar or fission fragments is not anticipated. The bolometric lightcurve, coupled with the observed evolution of the photospheric radius and the inferred high opacity, points to lanthanide production in the merger ejecta, and confirms kilonovae are a cosmic site of heavy r-process elements.
Methods
0.1 Spectral Energy Distribution
We used XSPEC[48] to jointly fit the near-infrared, optical and X-ray SEDs at 1.2, 1.8, 2.4, 7.4, 28.9 and 61.4 d (Figure 3). The observed optical data were converted to spectral files using the ftflx2xsp and uvot2pha tools within HEASOFT v6.31. The Galactic contribution was modeled using the model (phabs for X-ray photoelectric absorption with a fixed parameter cm-2 (Ref. [49]), and the model redden for optical dust reddening[50] with fixed parameters mag. Each SED was fit using a power-law (PL) model and a blackbody (BB) plus PL model.
To constrain the presence of absorption systems at the GRB site, we include two additional components (zphabs and zdust), and varied the GRB distance scale up to a redshift . The fit with a PL function yields tight constraints ( cm-2 and mag at 1.2 d, 3 c.l.), which disfavor models of GRB afterglows interacting with a dusty ambient medium[34]. However, the results show positive evidence for the inclusion of a BB component, starting as early as +1.2 d. The best-fit parameters are listed in Extended Data Table 1. The addition of a thermal component loosens the constraints on the rest-frame reddening ( mag), but its rapid onset remains inconsistent with the typical timescales of a thermal dust echo.
0.2 Constraints to the GRB Distance Scale
The GRB distance scale can leave a detectable imprint on its afterglow SED[51], therefore we include in our spectral fits three components that are sensitive to the GRB redshift: zphabs and zdust to model the absorption within the GRB host galaxy, and zigm to describe the effects of the intervening intergalactic medium. By selecting 100 redshift values uniformly distributed between 0 and 10, we mapped the variation of the test statistics () as a function of redshift. Analyzing this sample statistic allowed us to derive an upper limit of at the 95% c.l. ( at the 99.9% c.l.). This result is mostly driven by the afterglow detection in the Swift/UVOT filters and , which disfavor a high-redshift origin for GRB 230307A.
An even more stringent constraint can be placed using the properties of the BB component. From the fit, we derive its effective temperature and total observed flux, which can then be used to derive the bolometric luminosity and, assuming isotropy[52], the radius of the emitting surface for a certain redshift. By imposing that the expansion velocity cannot exceed the speed of light, we obtain and from the SED at 1.2 d and 28.9 d, respectively.
0.3 Host Galaxy
Here we explore the environment surrounding the explosion site of GRB 230307A using deep, multi-epoch, multi-color images obtained with HST and JWST. In the deep JWST/NIRCam images, there is a clear extended galaxy located directly adjacent to the GRB’s explosion site. The position of this galaxy is covered by the JWST/NIRSpec spectrum, and displays a single bright emission line which provides a redshift of based on its identification as a Hydrogen emission feature[53]. For this galaxy, referred to as G* (Figure 1e), we derive magnitudes mag, mag, mag, mag, and mag. The offset of this galaxy from the GRB localization is which, at this redshift, corresponds to a projected distance of 2 kpc, which is large but not unique among the sample of long GRBs[54]. Using the galaxy number counts from the JWST Prime Extragalactic Areas for Reionization and Lensing Science (PEARLS) project[55], we estimate a probability of chance coincidence[18] using the limit, and a using the brightness.
A comparable value of chance alignment is derived for the Large Magellanic Cloud (LMC), which lies 8 degrees away from the GRB. By cross-correlating the catalog of Swift bursts with the 10 brightest galaxies of the Local Group, we derive from the number of GRBs located within a 8 degrees radius of any of those galaxies.
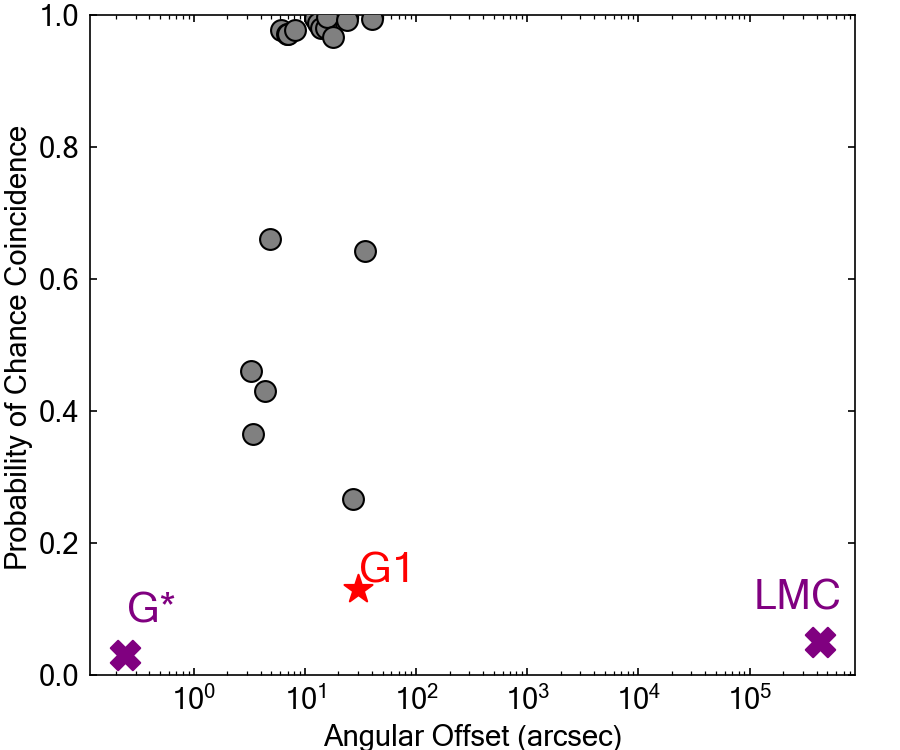
We perform a further exploration of the field surrounding GRB 230307A using our deep HST imaging in order to determine whether there is any other probable host. We computed the offset and HST/ photometry for all extended sources in the field. In Extended Data Figure 1, we display the probability of chance coincidence for a sample of nearby galaxies versus their distance from the GRB’s localization. While there exist a handful of additional galaxies within 10′′ of the GRB position, there are no galaxies with similarly low probabilities. Due to their faintness, each of these nearby galaxies has making them unlikely hosts. However, we identify a bright galaxy, hereafter G1 (Figure 1a) at an offset of from the GRB localization. This galaxy has an infrared brightness of AB mag, which yields a .
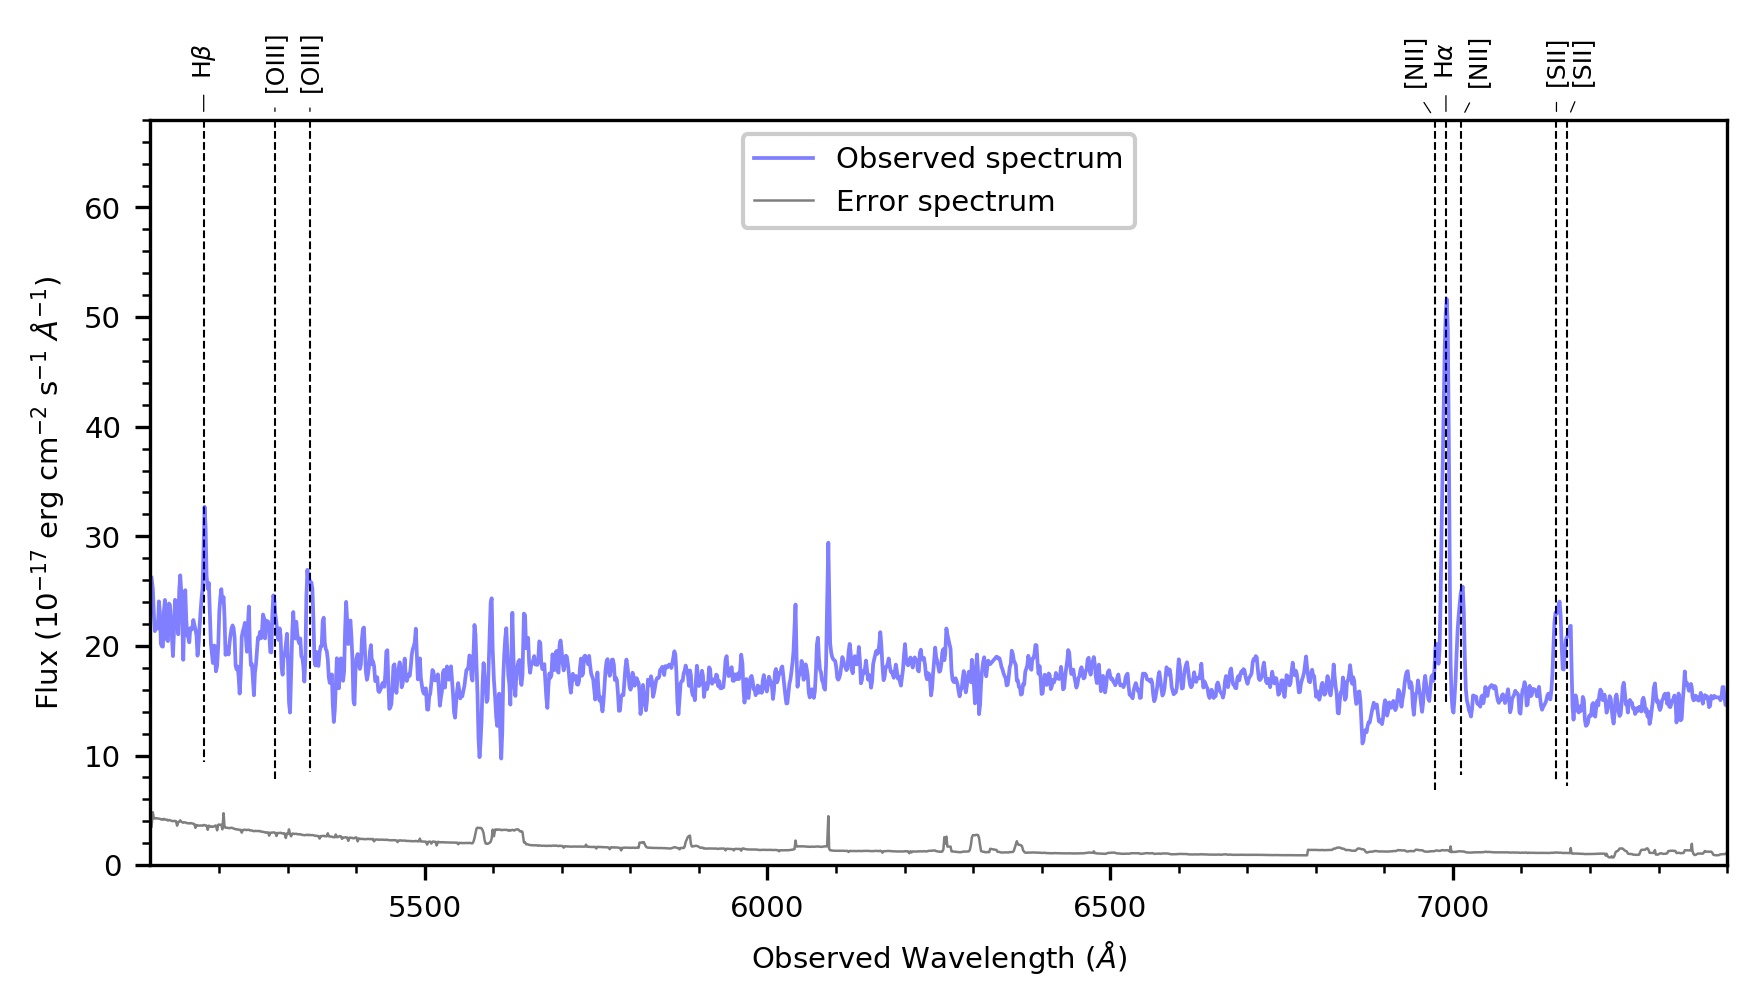
In what follows, we consider G1 the most likely host for GRB 230307A, as, despite the higher when compared to G, the study of the afterglow SED points towards a low redshift origin. From the spectrum of G1 (Extended Data Figure 2), we derive a redshift of for this galaxy based on H, H, [OIII], [NII], and [SII] emission lines. Therefore, we derive a nearby distance of 291 Mpc for G1, assuming a CDM cosmology with a Hubble constant of km Mpc-1 s-1, and [19, 56]. The emission line properties of G1, namely L erg s-1 and H, provide estimates of the star formation rate (SFR) and metallicity of the galaxy, leading to SFR yr-1 [57, 58] and 12 + O/H 8.6[59].
We modeled the SED of G1 (Extended Data Table 2) using prospector[60] with the same setup as previously outlined in Ref. [61, 27, 45]. The data were first corrected for Galactic extinction along the line of sight[62]. Our best fit model is displayed in Extended Data Figure 3. We derive a stellar mass of , a star formation rate of yr-1, an intrinsic dust component with extinction of mag, a metallicity , and a mass-weighted stellar age of Gyr. The specific star formation rate sSFR 0.3 Gyr-1 is low for a long GRB host galaxy[63]. In fact, the host galaxy properties as a whole (a low-mass galaxy, a low star formation rate, and an old stellar population) point towards a host galaxy that is entering quiescence[64]. This is quite similar to the host galaxy of GRB 211211A[45]. These similarities in the inferred host properties highlight a growing population of long-duration GRBs produced by the merger of two compact objects that may occur in similar galaxy types.
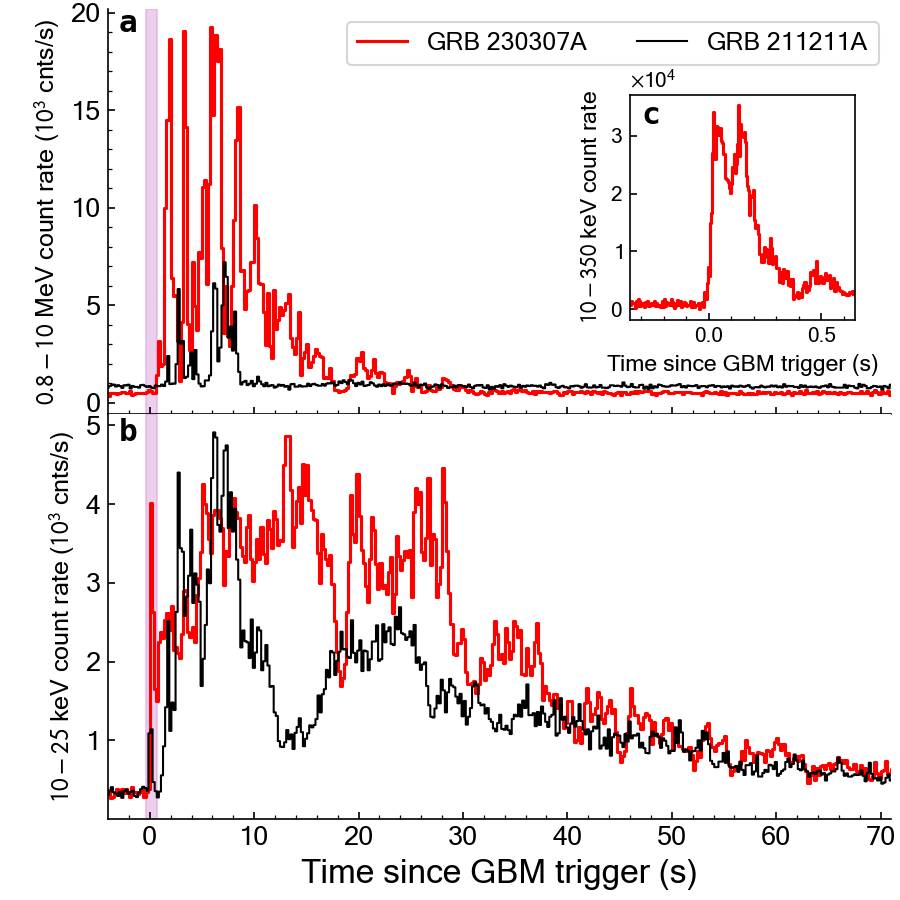
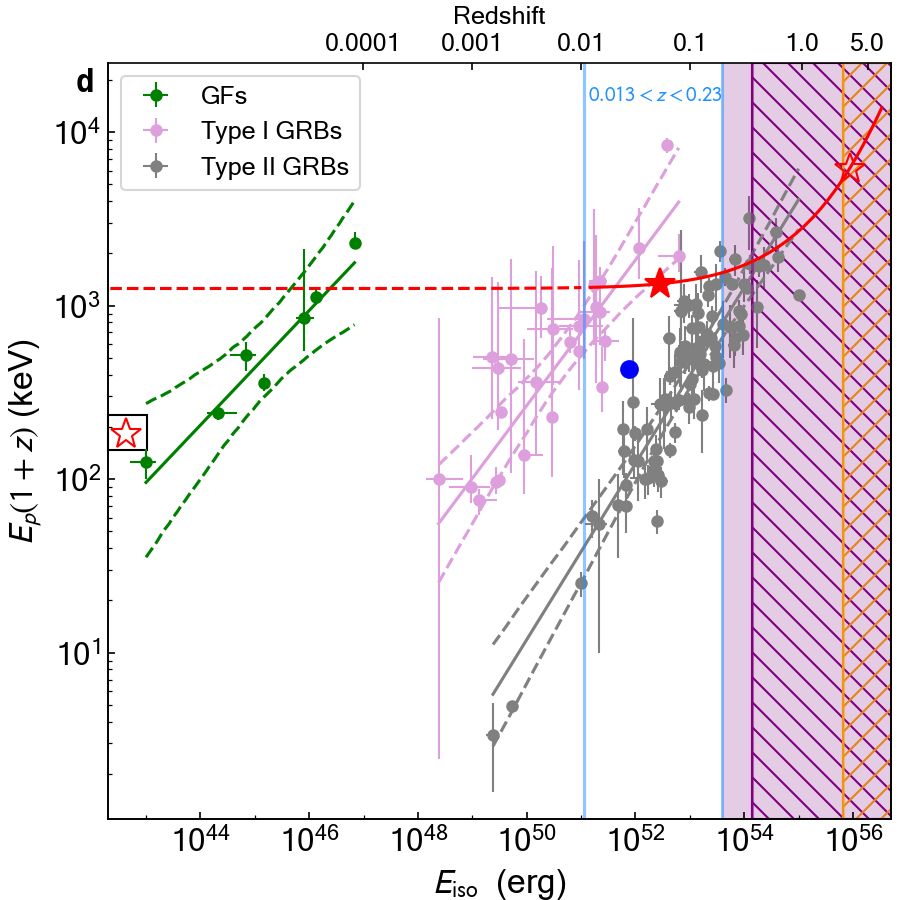
0.4 Prompt Emission
Additional constraints on the GRB nature and its distance scale can be placed by a study of its prompt gamma-ray emission, shown in Extended Data Figure 4. By converting the total fluence erg cm-2 s-1 (10–1,000 keV)[14] to an isotropic energy () and peak energy keV into rest-frame , the red dashed/solid line in Extended Data Figure 4d illustrates GRB 230307A at different redshifts on the Amati-relation diagram[65]. For a wide range of typical GRB redshifts () GRB 230307A fits within the c.l. region of the standard distribution for long GRBs. For redshifts , it falls within the distribution of short GRBs (95% c.l.), whereas for even lower distances its isotropic energy approaches the SGR region, orders of magnitude lower than the weakest GRB[22]. Extended Data Figure 4d shows that, if associated with the most likely host galaxy G∗ at 3.9, GRB 230307A would not only be the most energetic explosion ever observed, with an energy release an order of magnitude higher than that of GRB 221009A[66], but would also deviate significantly from the general population of long GRBs. This provides us with additional evidence against a high-redshift origin. More plausible values ( erg) are found assuming the distance of G1 at . However, the GRB lies at the intersection between the two populations of bursts and the Amati diagram does not reduce the uncertainty in its classification.
0.5 Possible Progenitors for GRB 230307A
The traditional classification of GRBs divides them into either long or short GRBs, based on a threshold of 2 seconds[67], which are generally associated with the collapse of massive stars and compact binary mergers (including NS-BH, NS-NS), respectively. The merger of a white dwarf (WD) with a NS was also proposed to explain long GRBs without an associated SN[25, 68].
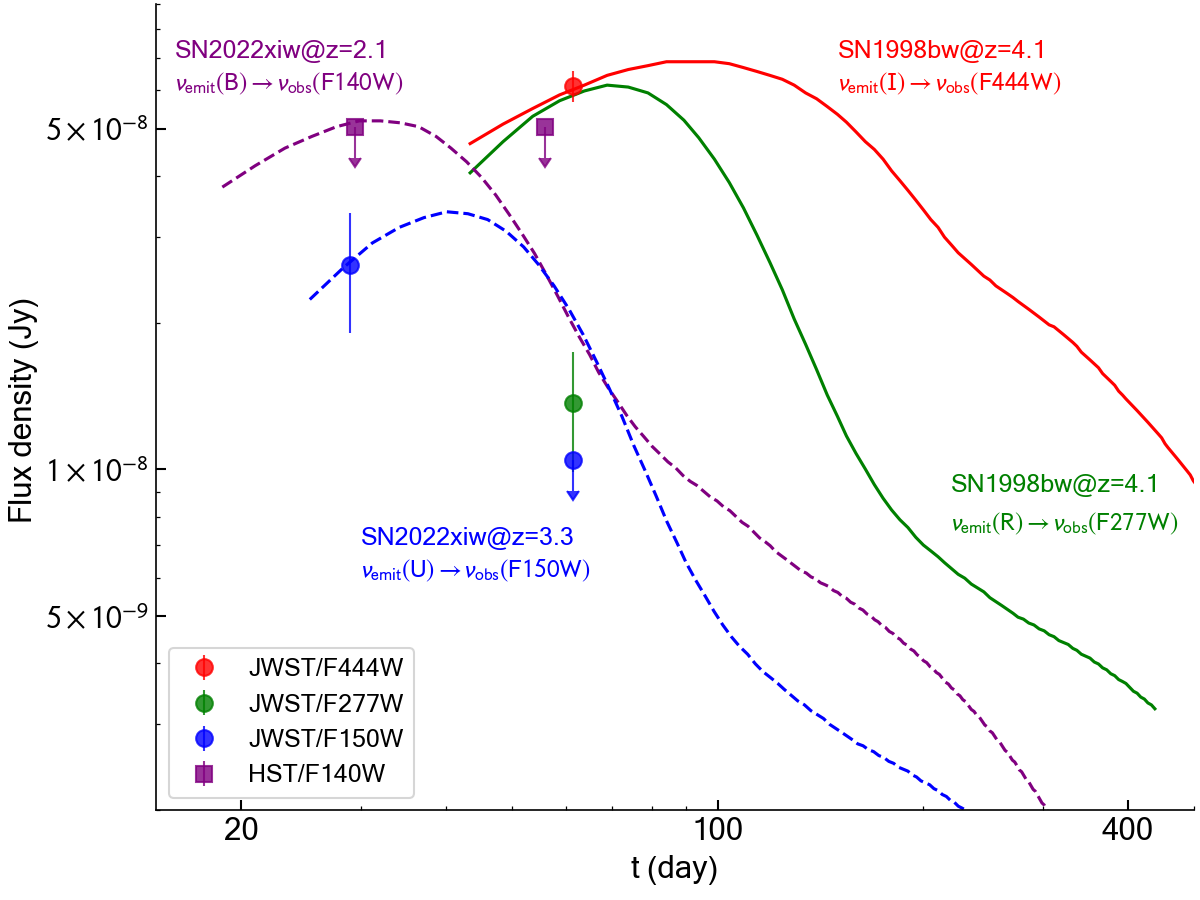
Massive star collapse: GRB 230307A is a burst of long duration, commonly associated with the collapse of a massive star. For a broad range of redshifts (), the prompt emission of GRB 230307A fits within the Amati relation for long GRBs (Extended Data Figure 4d), typically followed by a SN. Using the prototypical SN1998bw[69] and the faint SN2022xiw[70], associated to the extremely bright GRB 221009A[71], as templates and comparing them to the deep HST and JWST observations (Extended Data Figure 5), we rule out the possibility of a SN out to and , respectively. Moreover, given the constraint based on the evolution of the BB component, we find no plausible range of redshift and extinction values that could accommodate a massive star progenitor.
White Dwarf/Neutron star merger: The merger of a WD–NS binary system can give rise to a GRB, provided the WD is sufficiently massive (e.g. GRB 211211A[25, 72]). In such scenarios, the timescale of the GRB may extend beyond 2 s[73, 74]. The presence of neutron-rich matter[25] or materials undergoing radioactive decay[72] in the ejecta can contribute to additional optical excess[75], alongside the standard GRB afterglow.
A NS-WD merger is a plausible origin for GRB 230307A, and can explain many of its unusual properties, from the long duration to its environment. However, existing models for the associated optical transient [74, 75] do not predict the rapid reddening observed in GRB 211211A and GRB 230307A, and match more closely the evolution of faint Type Iax SNe rather than kilonovae. Based on this fact, we tend to favor a compact binary merger as progenitor for GRB 230307A.
Compact binary merger (NS-NS/BH): The merger of two compact objects, comprising at least one NS, is known to produce a GRB and a short-lived red thermal transient, a kilonova. Although it is challenging to conceive that the duration of GRBs originating from these mergers can extend to tens of seconds, this progenitor system best explains the properties of the GRB counterpart, such as its very red color and rapid evolution, and its environment.
0.6 Empirical Modelling
We describe the temporal evolution of the GRB counterpart using a series of PL segments, (Extended Data Figure 6). The optical band (including filters , , and TESS/) is best fit () by three PL segments with indices , , , and temporal breaks d, and d. The nIR lightcurves (including filters H, K[76] and F277W) is best described by two PL segments with , and a break time . The X-ray lightcurve is instead satisfactorily described by a single PL function with index .
Additionally, we use the measured X-ray flux at hr ( erg cm-2 s-1, 0.3-10 keV band), and gamma-ray fluence ( erg cm-2, 15–150 keV band, estimated according to Ref. [14]) to compare GRB 230307A to the broader GRB population. As shown in Figure 1f, we compared the ratio of the X-ray flux at 11 hr to the gamma-ray fluence and the offset from the center of the host galaxy with those of other short GRBs[27] and a sample of long GRBs[54]. Similarly to GRB 211211A [45], GRB 230307A exhibits a large deviation from the typical location of GRBs on the diagram, and its log is even lower than GRB 211211A (, which potentially indicates a commonality in the nature of these hybrid GRBs. Therefore, the ratio of these two parameters provides a useful diagnostic tool for identifying outliers in the long GRB population, which may be candidate hybrid GRBs.
0.7 Multi-wavelength Afterglow Modelling
The non-thermal afterglow radiation that follows GRBs is best described as synchrotron emission from a population of shock-accelerated electrons. Multiple mechanisms contribute to shaping its evolution, the dominant being an external forward shock (FS) driven by the interaction of the GRB jet with the ambient medium. A reverse shock (RS) traveling backward into the ejecta or long-lasting activity of the central engine may also contribute to the afterglow emission at early times[77].
Due to the delayed localization of GRB 230307A, the available dataset does not allow us to unambiguously identify the origin of its early non-thermal emission. Therefore, we consider two possible options in our modeling: a) FS radiation is the only dominant component at all times, and b) a RS and/or central engine activity contributes at early times, with the FS dominating later on ( d). In the former case, we include all observational data (Dataset 1) in our fit, in the latter case we consider the TESS and ATCA detection as upper limits (Dataset 2) to the FS radiation.
Motivated by the results of the SED analysis, we fit these datasets with three models: i) a simple FS model, ii) a FS plus a kilonova (KN) component, and iii) a FS plus a two-component KN. In order to model the FS emission, we utilized the Python package afterglowpy[36]. The free parameters are the isotropic-equivalent kinetic energy , the circumburst density , the fraction of burst kinetic energy in magnetic fields and in electrons , the power-law slope of the electron energy distribution, the opening angle of the jet’s core , and the electron participation fraction . We applied a Gaussian structure for the GRB jet for , where is the truncation angle. Due to the extreme brightness of GRB 230307A’s prompt emission, we consider only an on-axis viewing angle rad.
Regarding the kilonova component, we employed the isotropic model from Ref. [78] in the Python package gwemlightcurves. The model assumes a gray opacity and describes the spectrum with a simple blackbody function. The free parameters in this model are the ejecta mass , its minimum velocity , velocity index , opacity , and electron fraction .
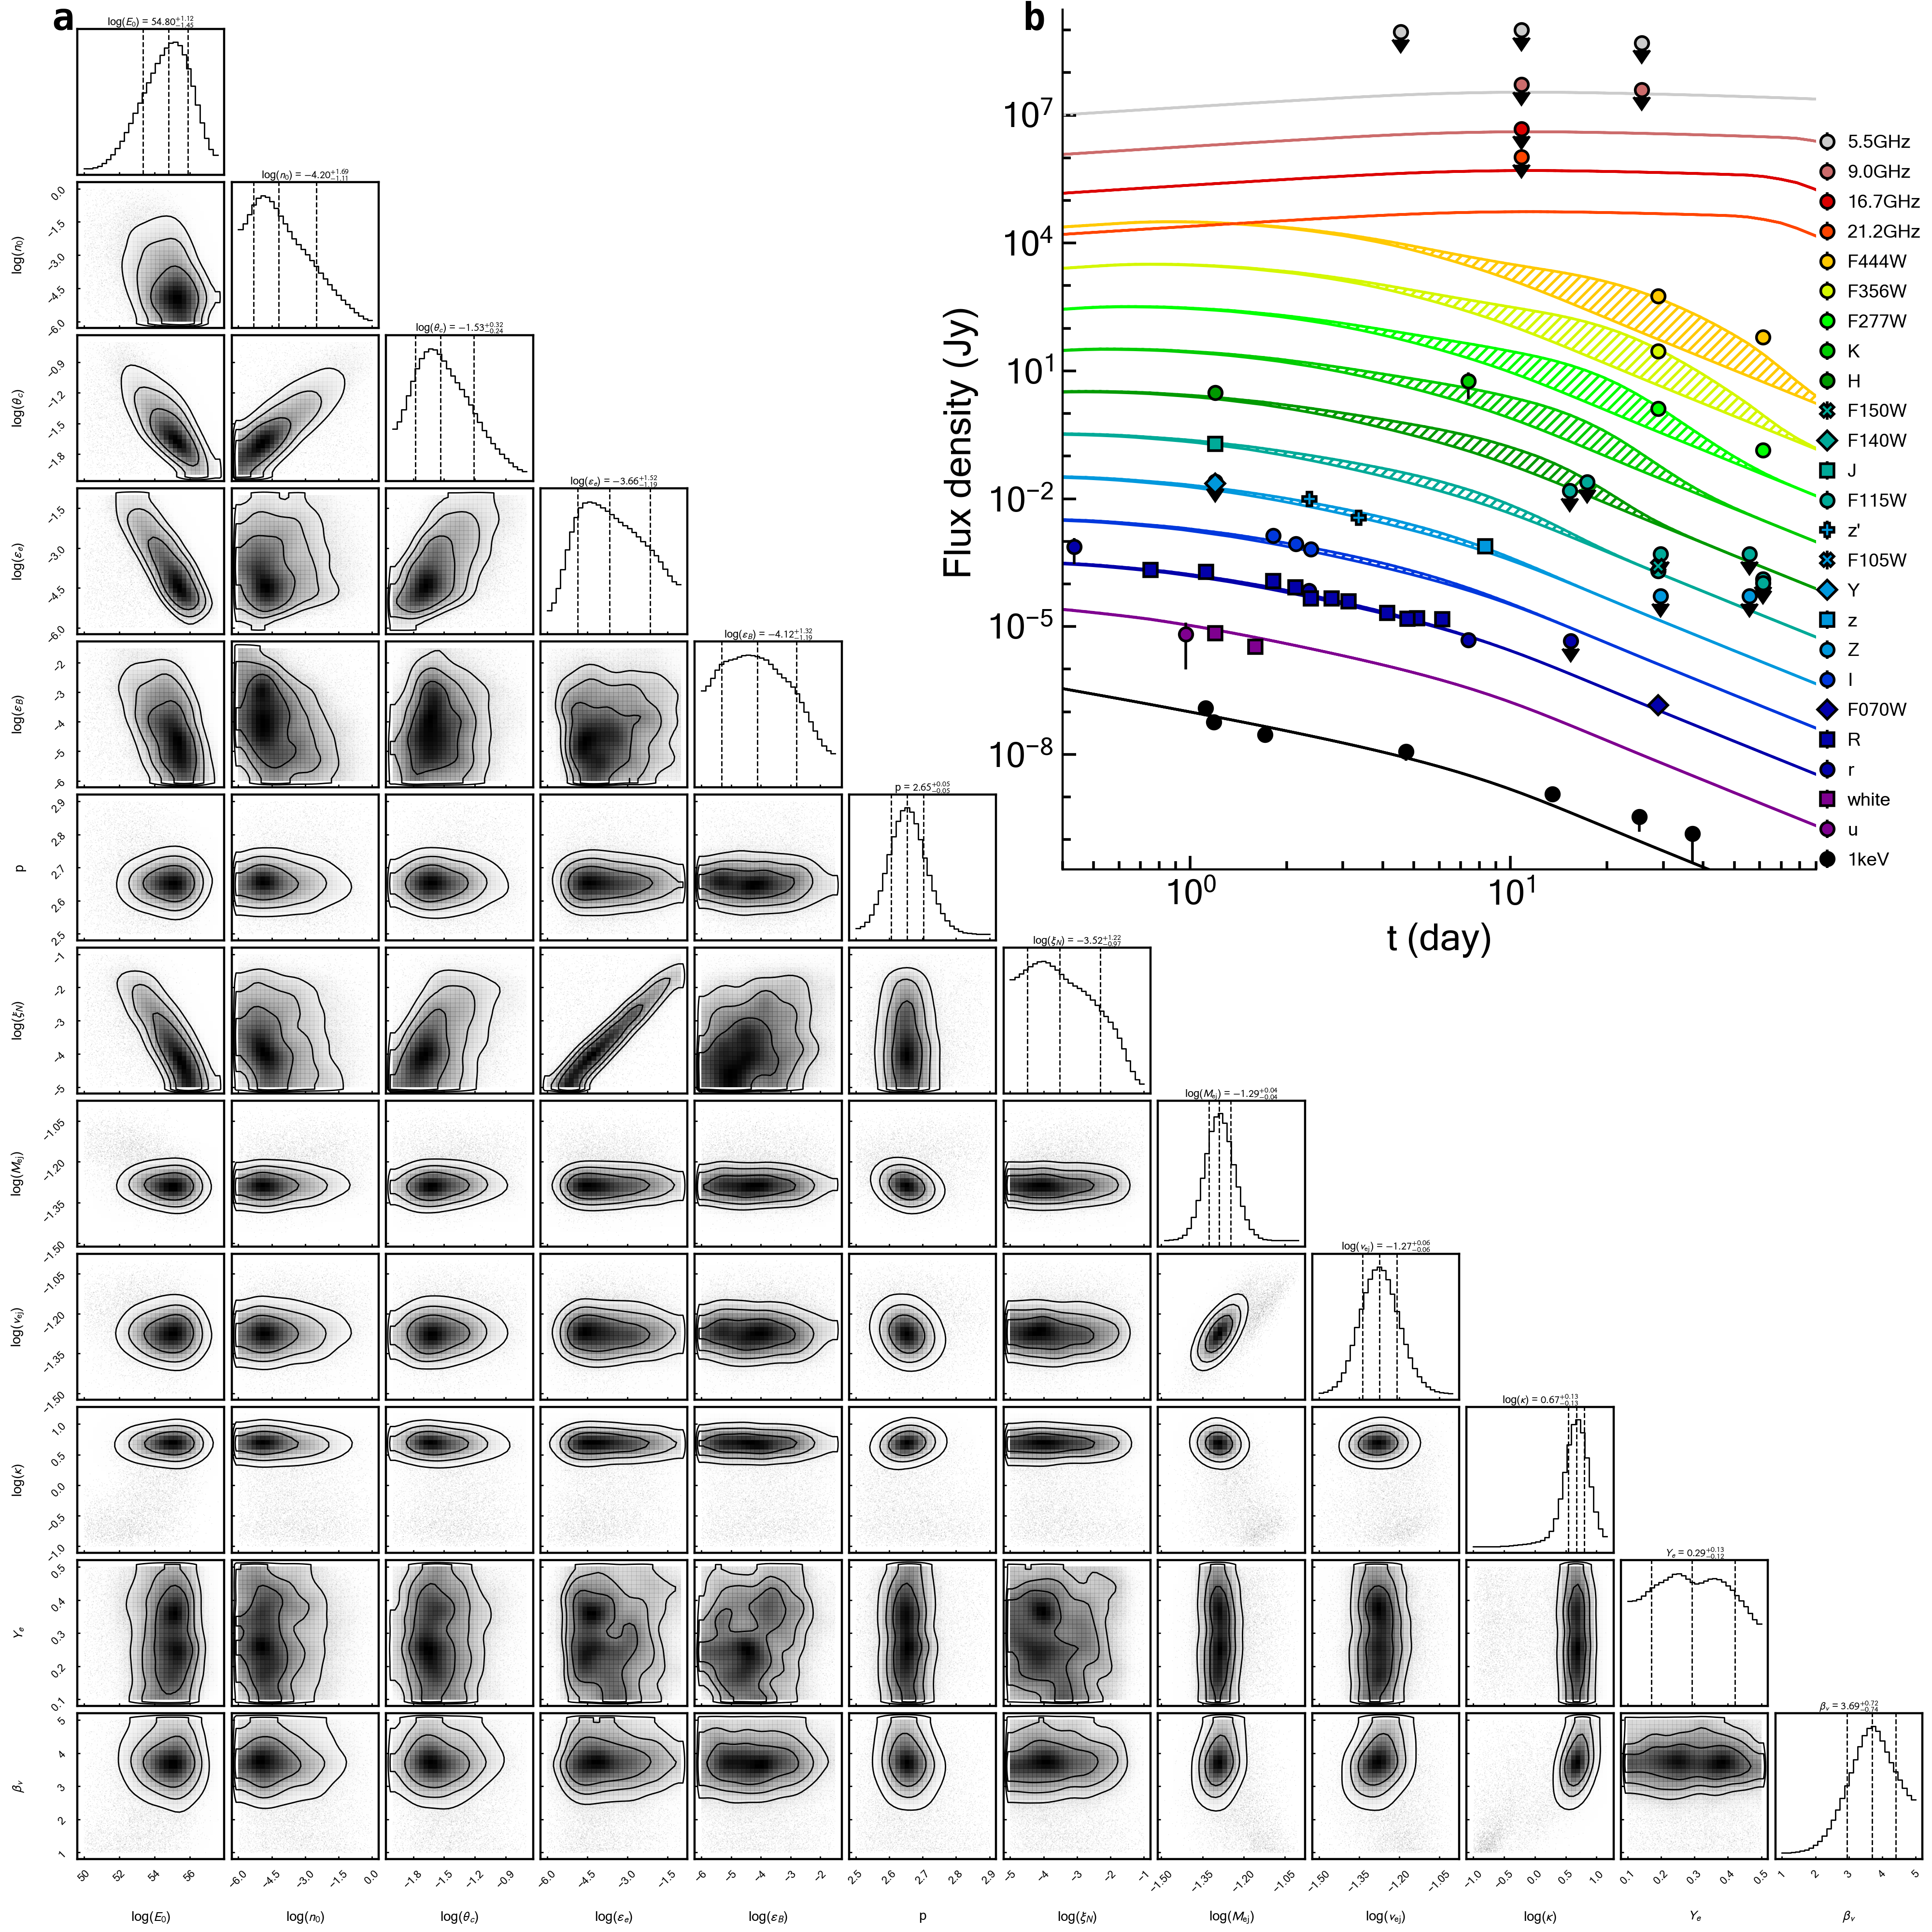
We fit the multi-wavelength observations through the Markov Chain Monte Carlo (MCMC) method based on the nested sampling algorithm implemented in the Python package pymultinest[79]. Considering that our data come from a variety of different telescopes, we included an additional 5% systematic uncertainty for all observations. The best-fit parameters, resulting and Bayesian information criterion (BIC) for each model and dataset are shown in Extended Data Tables 3, LABEL:tab:fskn_fit and LABEL:tab:fs2kn_fit. The FS model resulted in all cases in a poor description of the data (/dof4), and the addition of a KN component substantially improves the fit (/dof2), see Extended Data Table LABEL:tab:fskn_fit.
The fit to Dataset 1 is tightly constrained by the early optical lightcurve, which determines the peak flux and frequency of the FS component. It requires a very early jet-break ( d) to accommodate the rapid decay of the broadband emission, thus stretching the physical parameters to unusual values. Specifically, it yields a high-density environment ( cm-3), and a low-energy explosion ( erg), which implies a gamma-ray efficiency 1. For these reasons, our fiducial model is based on the fit to Dataset 2. This points to a high-energy explosion ( erg) in a tenuous environment ( cm-3 3 c.l.), overall consistent with a reasonable gamma-ray efficiency (0.1) and the observed angular offset. The jet opening angle is very narrow ( deg) to accommodate the late-time rapid decay.
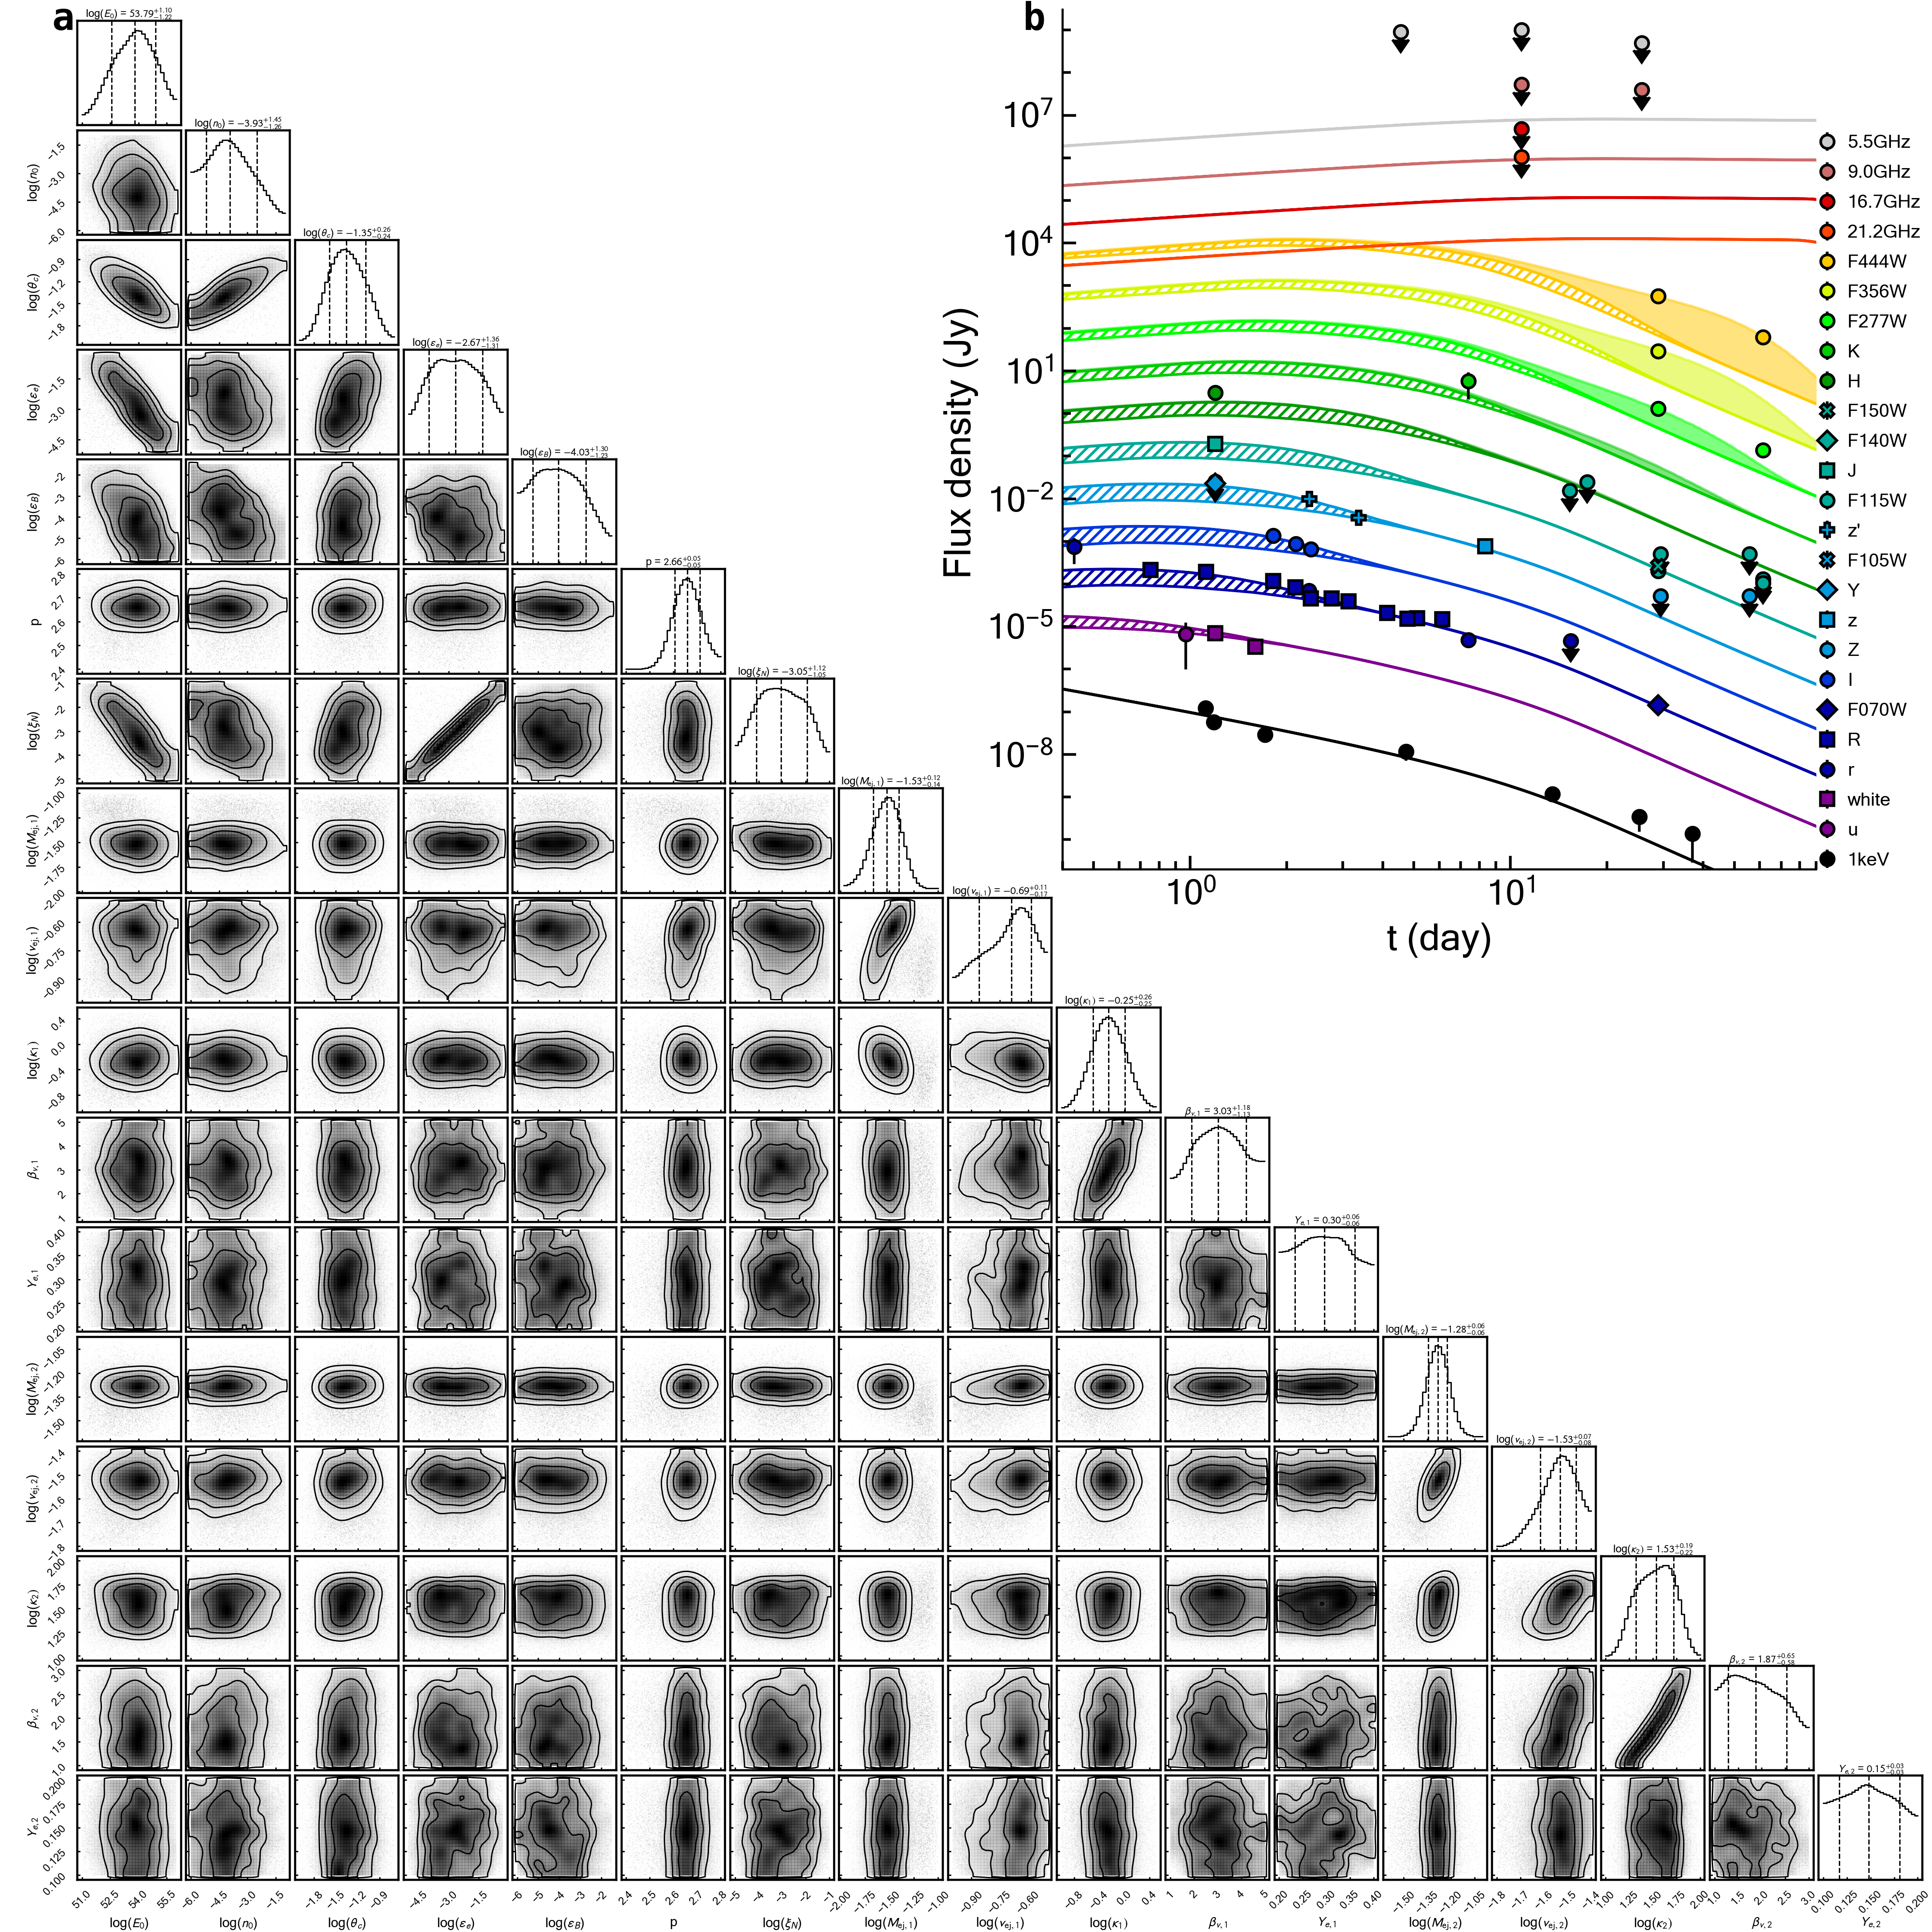
The inclusion of a second KN component provides a better description (/dof1.45) of Dataset 2 (Figure 2). The best-fit parameters are shown in Extended Data Figure 9 and Extended Data Table LABEL:tab:fs2kn_fit. In this case, we derive a reasonable value of , consistent with the observed spectral index (). The fiducial parameters are also reasonable: , , cm-3, deg, erg, and . We infer a beaming corrected kinetic energy of erg.
A two-component kilonova provides a good description of the optical and infrared excess, capturing the full blue-to-red evolution of the transient, and the bright mid-infrared emission at late times. Our fiducial model (Extended Data Figure 9) favors a short lived ( week) component with ejecta mass , velocity , opacity cm2 g-1, and electron fraction , followed by a longer-lived ( d) component with , , cm2 g-1, and . This second, higher opacity component captures the steep () spectral shape of the JWST data at +29 d, whereas the initial component produces the thermal excess observed at +1 d.
0.8 Opacity Evolution
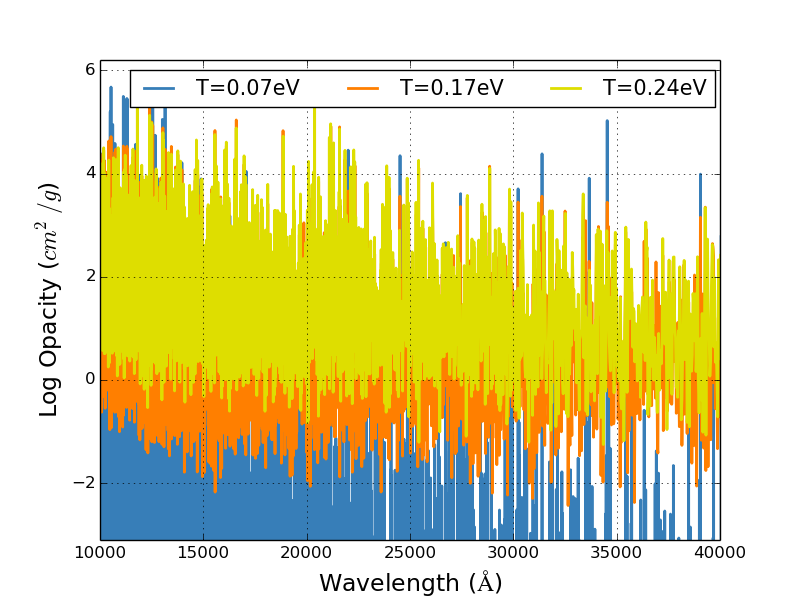
In transient explosions, the photosphere moves inward in mass coordinates. But because the ejecta is moving rapidly outwards, the radius of the photosphere likewise increases. In Type II supernovae, the opacity in the ejected hydrogen envelope is dominated by electron scattering. When these electrons recombine, the drop in opacity accelerates the recession of the photosphere in mass coordinates. The subsequent deceleration of the radial expansion is a key feature in understanding the plateau phase of Type IIP supernovae[37]. In kilonovae, the opacity is dominated by bound-bound line transitions in lanthanides. Assuming local thermodynamic equilibrium, Extended Data Figure 10 shows the different opacities for neodymium (Nd) as it evolves from singly-ionized Nd, to neutral Nd. The number of lines in the 1-5 m range drops considerably as it recombines, and the overall opacity will also decrease by roughly an order of magnitude. This sudden decrease in opacity will accelerate the inward motion of the photosphere in mass coordinates, causing the radius of the photosphere to stop increasing, or even to recede. Nonthermal effects can alter these opacities in Extended Data Figure 10, but the basic trends with decreasing temperature are likely to hold.
Data Availability
Processed data are presented in the tables and figures in the paper. Swift XRT products are available from the online GRB repository https://www.swift.ac.uk/xrt_products. Other data are available upon reasonable requests to the corresponding authors.
Code Availability
Results can be reproduced using standard free analysis packages. Methods are fully described. Code used to produce figures can be made available upon request.
| t | Stat | ||||
| (day) | (K) | (erg s-1) | (cm) | ||
| PL+BB | |||||
| 38.2 | |||||
| \hdashline | 609.3 | ||||
| AF+BB | |||||
-
•
Errors represent the uncertainties. The bolometric luminosity and photosphere radius are calculated based on the assumed luminosity distance Mpc. The fit statistics between the power-law (PL) model and PL plus blackbody (BB) model, , represents the improvement in spectral fit by an additional BB component.
| Date | Telescope | Filter | Magnitude |
|---|---|---|---|
| Archival | GALEX | ||
| Archival | GALEX | ||
| 1.0 | UVOT | ||
| 7.4 | Gemini | ||
| 8.3 | Gemini | ||
| 17.3 | Gemini | ||
| 2.1 | SAAO | ||
| 2.1 | SAAO | ||
| Archival | VISTA | ||
| Archival | VISTA | ||
| Archival | VISTA | ||
| 29.4 | HST | ||
| 29.4 | HST | ||
| Archival | WISE | ||
| Archival | WISE | ||
| Archival | WISE | ||
| Archival | WISE |
| Model | Dataset 1a | Dataset 2b | ||
|---|---|---|---|---|
| /dof | BIC | /dof | BIC | |
| FS | 447.3/63 | 507.0 | 286.2/63 | 315.9 |
| FS+KN | 184.0/58 | 235.0 | 119.2/58 | 170.2 |
| FS+2KN | 167.8/53 | 240.0 | 77.1/53 | 149.3 |
-
a
All available observational data are included in Dataset 1.
-
b
Compared to Dataset 1, the TESS and ATAC detections are treated as upper limits in Dataset 2.
| Parameter | Prior | Posterior | |
| Dataset 1 | Dataset 2 | ||
| FS | |||
| KN | |||
The fit data are 1) Dataset 1, including all available observation data, and 2) Dataset 2, considering the TESS detections and the first radio detection as upper limits. The results outside and inside parentheses correspond to Dataset 1 and Dataset 2, respectively.
There are two modes converging to the upper and lower prior bounds, respectively.
| Parameter | Prior | Posterior |
| FS | ||
| 2KN | ||
Supplementary Material
0.9 X-ray Observations
GRB 230307A was observed with the Neil Gehrels Swift Observatory X-ray Telescope (XRT), XMM-Newton (PIs: E. Troja and B. O’Connor) and Chandra (PI: Fong). We downloaded the XRT spectra from the Swift XRT GRB repository. XMM-Newton data was reduced by the Science Analysis System (SAS) v21.0. Chandra data was reduced by CIAO v4.15. Details for XMM-Newton and Chandra observations are listed in Supplementary Table 1. This GRB was detected in Chandra observation, the first XMM-Newton observation (by all detectors), and the second XMM-Newton observation (only by detector pn). We modeled the spectra with an absorbed power-law model with fixed Galactic hydrogen column density cm-2 [49]. Assuming the X-ray photon index is constant, we conducted a joint analysis of the XRT and XMM-Newton (the detected detectors) spectra using XSPEC v12.13. We derived the photon index of . We retrieved the XRT lightcurve from the Swift/XRT GRB Lightcurve Repository. The XRT lightcurve was further rebinned to a minimum of 8 counts per bin. The unabsorbed flux (0.3–10 keV) and flux density (1 keV) are shown in Supplementary Table 2.
0.10 Optical and Infrared Observations
GRB 230307A was observed with Transiting Exoplanet Survey Satellite (TESS), the PRime-focus Infrared Microlensing Experiment (PRIME) telescope, the Swift UltraViolet and Optical Telescope (UVOT), the Korea Microlensing Telescope Network (KMTNet), the 8.1m Gemini South Telescope (PIs: B. O’Connor and S. Dichiara; GS-2023A-DD-104, GS-2023A-DD-106), the Very Large Telescope (VLT) X-shooter instrument, the Hubble Space Telescope (HST; PI: E. Troja; ObsID: 17298) and James Webb Space Telescope (JWST; PI: A. Levan; PIDs: 4434 and 4445). The results are presented in Supplementary Table LABEL:tab:photometry_-_UVOIR, and details of the observations and data processing are reported below.
TESS: TESS observed GRB 230307A during the prompt emission phase and the afterglow phase immediately after the burst[80]. The data are presented in Ref. [80]. We rebinned its early afterglow lightcurve with a minimum of 20,000 counts.
KMTNet and RASA36: We observed GRB 230327A with three 1.6m telescopes of KMTNet (SAAO, SSO, and CTIO)[81] and the RASA36 telescope in Chile[82] of the Gravitational-wave EM Counterpart Korean Observatory[83] up to days after the GRB event in the and filters. These observations were stacked and background-subtracted using HOTPANTS[84], and photometry estimates were obtained via aperture photometry using photutils[85].
Gemini: Imaging observations were carried out in the filters at 7.4, 8.3, 15.3, and 17.3 d. Imaging observations were analyzed using DRAGONS[86, 87], and photometry was performed using SExtractor[88] and calibrated to nearby reference stars from the SkyMapper catalog[89, 90] and the Two Micron All Sky Survey (2MASS) catalog [91].
X-shooter: X-shooter obtained a spectrum of GRB 230307A through Target of Opportunity (ToO) observations (ToO 110.24CF.001; PI: N. Tanvir) on 15 March 2023, at 00:18:41 UTC ( d after the GRB trigger). The observations had a total integration time of 4800 s, and spectra were recorded in all three spectrographs (the UVB, VIS and NIR arms). We reduced this observation using standard recipes with the European Southern Observatory (ESO) Reflex pipeline[92]. We did not detect the transient in either of the UVB or VIS arms, but recorded a weak trace in the NIR arm (-band). We derive an estimate of the -band magnitude at this time by folding the spectrum with the filter response. Our estimate is confirmed by the detection of nIR emission in Gemini images at 10 d post-merger, which, unfortunately, was never publicly released in time to allow for activation of approved programs on kilonovae.
SOAR: We obtained - and -band imaging with the Goodman High Throughput Spectrograph on the SOAR telescope on 9, 10, 17, and 24 March 2023. Following standard procedures in photpipe[93], we reduced these data using the same methods described in Ref. [94], including corrections for bias and flat-fielding, astrometric calibration, image stacking using SWarp[95], point-spread function photometry using DoPhot[96], and photometric calibration against the SkyMapper catalog. Finally, we used the stacked -band image from 17 March 2023 as a template to obtain deep limits on transient emission at the site of GRB 230307A from 9 and 10 March 2023. After using HOTPANTS to subtract the template image from the science frames on both dates, we performed forced PSF photometry with DoPhot at the afterglow coordinates to estimate limits on the brightness of the counterpart.
PRIME: The 1.8m PRIME[97] telescope observed GRB 230307A beginning on March 8, 2023 at 18:31:50 UT until 22:45:13 UT using the near-infrared prime focus camera. Observations were conducted in the filters. The sample up-the-ramp data was reduced into single exposures using a memory-efficient up-the-ramp cosmic ray rejecting algorithm[98]. The ramp-fit exposures were reduced using standard photodiode array processing techniques of flat-fielding and background subtraction, aligned using Astrometry.net[99], and stacked using SWarp[95]. Aperture photometry was calibrated to 2MASS ( and filters), VISTA ( filter) and SkyMapper ( filter).
Swift/UVOT: The Swift/UVOT observed the field of GRB 230307A beginning on 14:57:20.33 and 19:22:25.15 on 8 March 2033 using u and white filters, respectively. Magnitudes were calculated using the Swift tool uvotdetect by selecting a circular source region with a 3" radius and nearby source-free background region.
HST: We imaged the field with the HST using the WFC3/IR camera with the and filters. Two epochs of observations were performed on April 6 and May 2, 2023, corresponding to 29.4 and 55.8 d after the GRB trigger. We reduced and analyzed the data using standard DrizzlePac procedures. Photometry was performed using SExtractor with the zeropoints derived from the image headers.
JWST: We analyzed publicly available JWST observations obtained on April 5, 2023 and May 8, 2023. Imaging observations were performed with NIRCam, using the , , , , and filters in the first epoch and , , , and in the second epoch. We retrieved the pipeline processed Level-3 mosaics from the MAST Archive. In the first epoch, a clear source is visible in the NIRCam observations at the position of GRB 230307A (Figure 1). In the second epoch, the source has faded significantly and is only clearly detected in the redder filters ( and ). We further retrieved the calibrated Level-2 data products and performed point-spread-function (PSF) photometry using WebbPSF[100] and photutils[85]. We applied the zeropoints derived from the keywords in the image headers. We further verified that simple aperture photometry obtained similar results.
0.11 Radio Observations
The Australia Telescope Compact Array (ATCA) observed GRB 230307A as part of project CX529 on 12 March[101], 18 March and 2 April 2023. The array operated in continuum mode with the Compact Array Broadband Backend using 2048 channels over 2-GHz bandwidth per IF. The radio sources used as bandpass/primary and phase calibrator were 1934-638 and 0454-810. The phase calibrator was also used for reference pointing checks every hour. Standard procedures in the data reduction software package MIRIAD[102] were used to flag, calibrate the complex gains and image the phase calibrator and target. A robustness parameter value of two was used, and a 6-km baseline antenna was deselected during imaging. The resulting flux densities and 3 upper limits are presented in Supplementary Table 4. The errors are derived from summing in quadrature the statistical and systematic uncertainty (map rms and 5% of the total flux as residual of gain calibration, respectively).
| Telescope | ObsID | Datea | Detector | Exposure time | Counts | |
|---|---|---|---|---|---|---|
| (ks) | ||||||
| XMM-Newton | 0915391601 | 2023-03-20 | pn | 36.4b | 73.2c (41.0d) | 12′′ |
| MOS1 | 36.4 | 32.4 (14.3) | ||||
| MOS2 | 38.7 | 36.5 (14.0) | ||||
| 0915391701 | 2023-04-13 | pn | 85.0 | 132.6 (108.7) | 12′′ | |
| MOS1 | 105.8 | 43.8 (42.8) | ||||
| MOS2 | 114.2 | 37.7 (38.9) | ||||
| Chandra | 27777 | 2023-03-31 | ACIS-S | 19.8 | 1 (0.04) | 1′′ |
| 27778 | 2023-04-01 | ACIS-S | 16.9 | 4 (0.04) | ||
| 27779 | 2023-04-02 | ACIS-S | 13.6 | 0 (0.05) |
-
a
Start date of the observation.
-
b
The exposure times in good time intervals (GTI), i.e. excluding high-rate flaring particle background.
-
c
Total counts in the circle source region with the radius .
-
d
Background counts in the source region.
| Time | Telescope | Fluxa | Flux densityb |
|---|---|---|---|
| (d) | (erg cm-2 s-1) | (Jy) | |
| Swift/XRT | |||
| Swift/XRT | |||
| Swift/XRT | |||
| Swift/XRT | |||
| XMM-Newton | |||
| Chandra | |||
| XMM-Newton |
-
a
Flux in the energy band 0.3–10 keV.
-
b
Flux density at 1 keV.
| (day) | Telescope | Filter | Magnitude |
| 0.02 | TESS | Red | |
| 0.04 | TESS | Red | |
| 0.07 | TESS | Red | |
| 0.09 | TESS | Red | |
| 0.11 | TESS | Red | |
| 0.13 | TESS | Red | |
| 0.16 | TESS | Red | |
| 0.19 | TESS | Red | |
| 0.23 | TESS | Red | |
| 0.26 | TESS | Red | |
| 0.43 | RASA36 | r | |
| 0.75 | KMTNet/SSO | R | |
| 0.97 | UVOT | u | |
| 1.12 | KMTNet/SAAO | R | |
| 1.20 | PRIME | H | |
| 1.20 | PRIME | J | |
| 1.20 | PRIME | Y | |
| 1.20 | PRIME | Z | |
| 1.20 | UVOT | white | |
| 1.60 | UVOT | white | |
| 1.82 | KMTNet/SSO | I | |
| 1.82 | KMTNet/SSO | R | |
| 2.13 | KMTNet/SAAO | R | |
| 2.14 | KMTNet/SAAO | I | |
| 2.35 | Gemini | r | |
| 2.36 | SOAR | z’ | |
| 2.38 | KMTNet/CTIO | R | |
| 2.39 | KMTNet/CTIO | I | |
| 2.77 | KMTNet/SSO | R | |
| 3.12 | KMTNet/SAAO | R | |
| 3.36 | SOAR | z’ | |
| 4.12 | KMTNet/SAAO | R | |
| 4.76 | KMTNet/SSO | R | |
| 5.12 | KMTNet/SAAO | R | |
| 6.13 | KMTNet/SAAO | R | |
| 7.40 | Gemini | r | |
| 7.40 | XSH | K | |
| 8.34 | Gemini | z | |
| 15.33 | Gemini | J | |
| 15.41 | Gemini | r | |
| 17.33 | Gemini | J | |
| 28.90 | JWST | F444W | |
| 28.90 | JWST | F356W | |
| 28.90 | JWST | F277W | |
| 28.90 | JWST | F150W | |
| 28.90 | JWST | F115W | |
| 28.90 | JWST | F070W | |
| 29.40 | HST | F140W | |
| 29.40 | HST | F105W | |
| 55.80 | HST | F140W | |
| 55.80 | HST | F105W | |
| 61.40 | JWST | F444W | |
| 61.40 | JWST | F277W | |
| 61.40 | JWST | F150W | |
| 61.40 | JWST | F115W |
| Frequency | Flux density | |
|---|---|---|
| (day) | (GHz) | (Jy) |
| 4.5 | 9.0 | |
| 4.5 | 5.5 | |
| 10.8 | 5.5 | |
| 10.8 | 9.0 | |
| 10.8 | 16.7 | |
| 10.8 | 21.2 | |
| 25.7 | 5.5 | |
| 25.7 | 9.0 |
References
References
- [1] Eichler, D., Livio, M., Piran, T. & Schramm, D. N. Nucleosynthesis, neutrino bursts and -rays from coalescing neutron stars. Nature 340, 126–128 (1989).
- [2] Li, L.-X. & Paczyński, B. Transient Events from Neutron Star Mergers. ApJ 507, L59–L62 (1998).
- [3] Freiburghaus, C., Rosswog, S. & Thielemann, F. K. R-Process in Neutron Star Mergers. ApJ 525, L121–L124 (1999).
- [4] Korobkin, O., Rosswog, S., Arcones, A. & Winteler, C. On the astrophysical robustness of the neutron star merger r-process. MNRAS 426, 1940–1949 (2012).
- [5] Barnes, J., Kasen, D., Wu, M.-R. & Martínez-Pinedo, G. Radioactivity and Thermalization in the Ejecta of Compact Object Mergers and Their Impact on Kilonova Light Curves. ApJ 829, 110 (2016).
- [6] Kasen, D. & Barnes, J. Radioactive Heating and Late Time Kilonova Light Curves. ApJ 876, 128 (2019).
- [7] Hotokezaka, K. & Nakar, E. Radioactive Heating Rate of r-process Elements and Macronova Light Curve. ApJ 891, 152 (2020).
- [8] Zhu, J.-P. et al. Long-duration Gamma-Ray Burst and Associated Kilonova Emission from Fast-spinning Black Hole-Neutron Star Mergers. ApJ 936, L10 (2022).
- [9] Wollaeger, R. T. et al. Impact of Pulsar and Fallback Sources on Multifrequency Kilonova Models. ApJ 880, 22 (2019).
- [10] Kasliwal, M. M. et al. Spitzer mid-infrared detections of neutron star merger GW170817 suggests synthesis of the heaviest elements. MNRAS 510, L7–L12 (2022).
- [11] Troja, E. Eighteen Years of Kilonova Discoveries with Swift. Universe 9, 245 (2023).
- [12] Dalessi, S. & Fermi GBM Team. GRB 230307A: Fermi GBM detection of a very bright GRB. GRB Coordinates Network 33407, 1 (2023).
- [13] Kozyrev, A. S. et al. Further improved IPN localization for GRB 230307A. GRB Coordinates Network 33461, 1 (2023).
- [14] Sun, H. et al. Magnetar emergence in a peculiar gamma-ray burst from a compact star merger. arXiv e-prints arXiv:2307.05689 (2023).
- [15] Burns, E. et al. GRB 221009A: The Boat. ApJ 946, L31 (2023).
- [16] Burrows, D. N. et al. GRB 230307A: Swift-XRT afterglow detection. GRB Coordinates Network 33465, 1 (2023).
- [17] Gillanders, J. H. et al. Heavy element nucleosynthesis associated with a gamma-ray burst. Submitted (2023).
- [18] Bloom, J. S., Kulkarni, S. R. & Djorgovski, S. G. The Observed Offset Distribution of Gamma-Ray Bursts from Their Host Galaxies: A Robust Clue to the Nature of the Progenitors. AJ 123, 1111–1148 (2002).
- [19] Freedman, W. L. et al. The Carnegie-Chicago Hubble Program. VIII. An Independent Determination of the Hubble Constant Based on the Tip of the Red Giant Branch. ApJ 882, 34 (2019).
- [20] Chang, H.-Y. & Kim, H.-I. On Spatial Distribution of Short Gamma-Ray Bursts from Extragalactic Magnetar Flares. Journal of Astronomy and Space Sciences 19, 1–6 (2002).
- [21] Dichiara, S. et al. A luminous precursor in the extremely bright GRB 230307A. arXiv e-prints arXiv:2307.02996 (2023).
- [22] Yang, J. et al. GRB 200415A: A Short Gamma-Ray Burst from a Magnetar Giant Flare? ApJ 899, 106 (2020).
- [23] Dichiara, S. et al. A luminous precursor in the extremely bright GRB 230307A. arXiv e-prints arXiv:2307.02996 (2023).
- [24] Troja, E. et al. A nearby long gamma-ray burst from a merger of compact objects. Nature 612, 228–231 (2022).
- [25] Yang, J. et al. A long-duration gamma-ray burst with a peculiar origin. Nature 612, 232–235 (2022).
- [26] Rastinejad, J. C. et al. A kilonova following a long-duration gamma-ray burst at 350 Mpc. Nature 612, 223–227 (2022).
- [27] O’Connor, B. et al. A deep survey of short GRB host galaxies over z 0-2: implications for offsets, redshifts, and environments. MNRAS 515, 4890–4928 (2022).
- [28] Nysewander, M., Fruchter, A. S. & Pe’er, A. A Comparison of the Afterglows of Short- and Long-duration Gamma-ray Bursts. ApJ 701, 824–836 (2009).
- [29] O’Connor, B., Beniamini, P. & Kouveliotou, C. Constraints on the circumburst environments of short gamma-ray bursts. MNRAS 495, 4782–4799 (2020).
- [30] Norris, J. P. & Bonnell, J. T. Short Gamma-Ray Bursts with Extended Emission. ApJ 643, 266–275 (2006).
- [31] Dichiara, S. et al. Evidence of Extended Emission in GRB 181123B and Other High-redshift Short GRBs. ApJ 911, L28 (2021).
- [32] Fong, W. & Berger, E. The Locations of Short Gamma-Ray Bursts as Evidence for Compact Object Binary Progenitors. ApJ 776, 18 (2013).
- [33] Tunnicliffe, R. L. et al. On the nature of the ‘hostless’ short GRBs. MNRAS 437, 1495–1510 (2014).
- [34] Waxman, E., Ofek, E. O. & Kushnir, D. Strong NIR emission following the long duration GRB 211211A: Dust heating as an alternative to a kilonova. arXiv e-prints arXiv:2206.10710 (2022).
- [35] Lu, W., McKee, C. F. & Mooley, K. P. Infrared dust echoes from neutron star mergers. MNRAS 507, 3672–3689 (2021).
- [36] Ryan, G., van Eerten, H., Piro, L. & Troja, E. Gamma-Ray Burst Afterglows in the Multimessenger Era: Numerical Models and Closure Relations. ApJ 896, 166 (2020).
- [37] Valenti, S. et al. The diversity of Type II supernova versus the similarity in their progenitors. MNRAS 459, 3939–3962 (2016).
- [38] Barnes, J. et al. Kilonovae Across the Nuclear Physics Landscape: The Impact of Nuclear Physics Uncertainties on r-process-powered Emission. ApJ 918, 44 (2021).
- [39] Frey, L. H. et al. The Los Alamos Supernova Light-curve Project: Computational Methods. ApJS 204, 16 (2013).
- [40] Fontes, C. J., Fryer, C. L., Hungerford, A. L., Wollaeger, R. T. & Korobkin, O. A line-binned treatment of opacities for the spectra and light curves from neutron star mergers. MNRAS 493, 4143–4171 (2020).
- [41] Fontes, C. J., Fryer, C. L., Wollaeger, R. T., Mumpower, M. R. & Sprouse, T. M. Actinide opacities for modelling the spectra and light curves of kilonovae. MNRAS 519, 2862–2878 (2023).
- [42] Waxman, E., Ofek, E. O. & Kushnir, D. Late-time Kilonova Light Curves and Implications to GW170817. ApJ 878, 93 (2019).
- [43] Zhu, Y. et al. Californium-254 and Kilonova Light Curves. ApJ 863, L23 (2018).
- [44] Holmbeck, E. M. et al. Superheavy Elements in Kilonovae. ApJ 951, L13 (2023).
- [45] Troja, E. et al. A nearby long gamma-ray burst from a merger of compact objects. Nature 612, 228–231 (2022).
- [46] Waxman, E., Ofek, E. O., Kushnir, D. & Gal-Yam, A. Constraints on the ejecta of the GW170817 neutron star merger from its electromagnetic emission. MNRAS 481, 3423–3441 (2018).
- [47] Zhu, Y. L. et al. Modeling Kilonova Light Curves: Dependence on Nuclear Inputs. ApJ 906, 94 (2021).
- [48] Astronomical Data Analysis Software and Systems V, vol. 101 of Astronomical Society of the Pacific Conference Series.
- [49] Willingale, R., Starling, R. L. C., Beardmore, A. P., Tanvir, N. R. & O’Brien, P. T. Calibration of X-ray absorption in our Galaxy. MNRAS 431, 394–404 (2013).
- [50] Schlafly, E. F. & Finkbeiner, D. P. Measuring Reddening with Sloan Digital Sky Survey Stellar Spectra and Recalibrating SFD. ApJ 737, 103 (2011).
- [51] Krühler, T. et al. The SEDs and host galaxies of the dustiest GRB afterglows. A&A 534, A108 (2011).
- [52] Sneppen, A. et al. Spherical symmetry in the kilonova AT2017gfo/GW170817. Nature 614, 436–439 (2023).
- [53] Levan, A. J. et al. GRB 230307A: JWST NIRSpec observations, possible higher redshift. GRB Coordinates Network 33580, 1 (2023).
- [54] Blanchard, P. K., Berger, E. & Fong, W.-f. The Offset and Host Light Distributions of Long Gamma-Ray Bursts: A New View From HST Observations of Swift Bursts. ApJ 817, 144 (2016).
- [55] Windhorst, R. A. et al. JWST PEARLS. Prime Extragalactic Areas for Reionization and Lensing Science: Project Overview and First Results. AJ 165, 13 (2023).
- [56] Planck Collaboration et al. Planck 2018 results. VI. Cosmological parameters. A&A 641, A6 (2020).
- [57] Kennicutt, J., Robert C. Star Formation in Galaxies Along the Hubble Sequence. ARA&A 36, 189–232 (1998).
- [58] Chabrier, G. Galactic Stellar and Substellar Initial Mass Function. PASP 115, 763–795 (2003).
- [59] Kobulnicky, H. A. & Kewley, L. J. Metallicities of 0.3<z<1.0 Galaxies in the GOODS-North Field. ApJ 617, 240–261 (2004).
- [60] Johnson, B. D., Leja, J., Conroy, C. & Speagle, J. S. Stellar Population Inference with Prospector. ApJS 254, 22 (2021).
- [61] O’Connor, B. et al. A tale of two mergers: constraints on kilonova detection in two short GRBs at z 0.5. MNRAS 502, 1279–1298 (2021).
- [62] Schlafly, E. F. & Finkbeiner, D. P. Measuring Reddening with Sloan Digital Sky Survey Stellar Spectra and Recalibrating SFD. ApJ 737, 103 (2011).
- [63] Palmerio, J. T. et al. Are long gamma-ray bursts biased tracers of star formation? Clues from the host galaxies of the Swift/BAT6 complete sample of bright LGRBs. III. Stellar masses, star formation rates, and metallicities at z > 1. A&A 623, A26 (2019).
- [64] Whitaker, K. E., van Dokkum, P. G., Brammer, G. & Franx, M. The Star Formation Mass Sequence Out to z = 2.5. ApJ 754, L29 (2012).
- [65] Amati, L. et al. Intrinsic spectra and energetics of BeppoSAX Gamma-Ray Bursts with known redshifts. A&A 390, 81–89 (2002).
- [66] O’Connor, B. et al. A structured jet explains the extreme grb 221009a. Science Advances 9, eadi1405 (2023).
- [67] Kouveliotou, C. et al. Identification of Two Classes of Gamma-Ray Bursts. ApJ 413, L101 (1993).
- [68] Becerra, R. L. et al. Deciphering the unusual stellar progenitor of GRB 210704A. MNRAS 522, 5204–5216 (2023).
- [69] Clocchiatti, A., Suntzeff, N. B., Covarrubias, R. & Candia, P. The Ultimate Light Curve of SN 1998bw/GRB 980425. AJ 141, 163 (2011).
- [70] de Ugarte Postigo, A. et al. Transient Classification Report for 2022-10-19. Transient Name Server Classification Report 2022-3047, 1 (2022).
- [71] Srinivasaragavan, G. P. et al. A Sensitive Search for Supernova Emission Associated with the Extremely Energetic and Nearby GRB 221009A. ApJ 949, L39 (2023).
- [72] Zhong, S.-Q., Li, L. & Dai, Z.-G. GRB 211211A: A Neutron Star-White Dwarf Merger? ApJ 947, L21 (2023).
- [73] Fryer, C. L., Woosley, S. E., Herant, M. & Davies, M. B. Merging White Dwarf/Black Hole Binaries and Gamma-Ray Bursts. ApJ 520, 650–660 (1999).
- [74] Kaltenborn, M. A. et al. Abundances and Transients from Neutron Star-White Dwarf Mergers. arXiv e-prints arXiv:2209.13061 (2022).
- [75] Bobrick, A., Zenati, Y., Perets, H. B., Davies, M. B. & Church, R. Transients from ONe white dwarf - neutron star/black hole mergers. MNRAS 510, 3758–3777 (2022).
- [76] Levan, A. et al. JWST detection of heavy neutron capture elements in a compact object merger. arXiv e-prints arXiv:2307.02098 (2023).
- [77] Gao, H., Lei, W.-H., Zou, Y.-C., Wu, X.-F. & Zhang, B. A complete reference of the analytical synchrotron external shock models of gamma-ray bursts. New Astron. Rev. 57, 141–190 (2013).
- [78] Metzger, B. D. Kilonovae. Living Reviews in Relativity 23, 1 (2019).
- [79] Buchner, J. et al. X-ray spectral modelling of the AGN obscuring region in the CDFS: Bayesian model selection and catalogue. A&A 564, A125 (2014).
- [80] Fausnaugh, M. M. et al. Observations of GRB 230307A by TESS. Research Notes of the American Astronomical Society 7, 56 (2023).
- [81] Kim, S.-L. et al. KMTNET: A Network of 1.6 m Wide-Field Optical Telescopes Installed at Three Southern Observatories. Journal of Korean Astronomical Society 49, 37–44 (2016).
- [82] Im, M. et al. SomangNet: Small Telescope Network of Korea. Journal of Korean Astronomical Society 54, 89–102 (2021).
- [83] Im, M., Paek, G. S. H., Kim, J., Lim, G. & Gecko Team. Gravitational-wave EM Counterpart Korean Observatory (GECKO). IAU Symposium 363, 207–210 (2023).
- [84] Becker, A. HOTPANTS: High Order Transform of PSF ANd Template Subtraction. Astrophysics Source Code Library, record ascl:1504.004 (2015). 1504.004.
- [85] Bradley, L. et al. astropy/photutils: 1.6.0 (2022). URL https://doi.org/10.5281/zenodo.7419741.
- [86] Labrie, K., Anderson, K., Cárdenes, R., Simpson, C. & Turner, J. E. H. DRAGONS - Data Reduction for Astronomy from Gemini Observatory North and South. In Teuben, P. J., Pound, M. W., Thomas, B. A. & Warner, E. M. (eds.) Astronomical Data Analysis Software and Systems XXVII, vol. 523 of Astronomical Society of the Pacific Conference Series, 321 (2019).
- [87] Labrie, K. et al. Dragons (2022). URL https://doi.org/10.5281/zenodo.7308726.
- [88] Bertin, E. & Arnouts, S. SExtractor: Software for source extraction. A&AS 117, 393–404 (1996).
- [89] Keller, S. C. et al. The SkyMapper Telescope and The Southern Sky Survey. PASA 24, 1–12 (2007).
- [90] Onken, C. A. et al. SkyMapper Southern Survey: Second data release (DR2). PASA 36, e033 (2019).
- [91] Skrutskie, M. F. et al. The Two Micron All Sky Survey (2MASS). AJ 131, 1163–1183 (2006).
- [92] Freudling, W. et al. Automated data reduction workflows for astronomy. The ESO Reflex environment. A&A 559, A96 (2013).
- [93] Rest, A. et al. Testing LMC Microlensing Scenarios: The Discrimination Power of the SuperMACHO Microlensing Survey. ApJ 634, 1103–1115 (2005).
- [94] Gordon, A. C. et al. The Demographics, Stellar Populations, and Star Formation Histories of Fast Radio Burst Host Galaxies: Implications for the Progenitors. arXiv e-prints arXiv:2302.05465 (2023).
- [95] Bertin, E. et al. The TERAPIX Pipeline. In Bohlender, D. A., Durand, D. & Handley, T. H. (eds.) Astronomical Data Analysis Software and Systems XI, vol. 281 of Astronomical Society of the Pacific Conference Series, 228 (2002).
- [96] Schechter, P. L., Mateo, M. & Saha, A. DoPHOT, A CCD Photometry Program: Description and Tests. PASP 105, 1342 (1993).
- [97] Yama, H. et al. Optical Alignment Method for the PRIME Telescope. Journal of Astronomical Instrumentation 12, 2350004 (2023).
- [98] Offenberg, J. D., Fixsen, D. J. & Mather, J. C. Memory-Efficient Up-the-Ramp Processing with Cosmic-Ray Rejection. PASP 117, 94–103 (2005).
- [99] Lang, D., Hogg, D. W., Mierle, K., Blanton, M. & Roweis, S. Astrometry.net: Blind Astrometric Calibration of Arbitrary Astronomical Images. AJ 139, 1782–1800 (2010).
- [100] Perrin, M. D. et al. Updated point spread function simulations for JWST with WebbPSF. In Oschmann, J., Jacobus M., Clampin, M., Fazio, G. G. & MacEwen, H. A. (eds.) Space Telescopes and Instrumentation 2014: Optical, Infrared, and Millimeter Wave, vol. 9143 of Society of Photo-Optical Instrumentation Engineers (SPIE) Conference Series, 91433X (2014).
- [101] Anderson, G. E. et al. GRB 230307A: ATCA radio detection. GRB Coordinates Network 33475, 1 (2023).
- [102] Sault, R. J., Teuben, P. J. & Wright, M. C. H. A Retrospective View of MIRIAD. In Shaw, R. A., Payne, H. E. & Hayes, J. J. E. (eds.) Astronomical Data Analysis Software and Systems IV, vol. 77 of Astronomical Society of the Pacific Conference Series, 433 (1995). astro-ph/0612759.
This work was supported by the European Research Council through the Consolidator grant BHianca (grant agreement ID 101002761) and, in part, by the National Science Foundation (under award number 2108950). This work was in part carried out at the Aspen Center for Physics, which is supported by National Science Foundation grant PHY-2210452. The development of afterglow models used in this work was partially supported by the European Union Horizon 2020 Programme under the AHEAD2020 project (grant agreement number 871158). BO acknowledges useful discussions with Justin Pierel and Ori Fox regarding JWST analysis. MI, GSHP, SWC, HC, and MJ acknowledge support from the National Research Foundation of Korea (NRF) grants, No. 2020R1A2C3011091, and No. 2021M3F7A1084525, funded by the Korea government (MSIT). The national facility capability for SkyMapper has been funded through ARC LIEF grant LE130100104 from the Australian Research Council, awarded to the University of Sydney, the Australian National University, Swinburne University of Technology, the University of Queensland, the University of Western Australia, the University of Melbourne, Curtin University of Technology, Monash University and the Australian Astronomical Observatory. SkyMapper is owned and operated by The Australian National University’s Research School of Astronomy and Astrophysics. The survey data were processed and provided by the SkyMapper Team at ANU. The SkyMapper node of the All-Sky Virtual Observatory (ASVO) is hosted at the National Computational Infrastructure (NCI). Development and support of the SkyMapper node of the ASVO has been funded in part by Astronomy Australia Limited (AAL) and the Australian Government through the Commonwealth’s Education Investment Fund (EIF) and National Collaborative Research Infrastructure Strategy (NCRIS), particularly the National eResearch Collaboration Tools and Resources (NeCTAR) and the Australian National Data Service Projects (ANDS).
Y.-H.Y led the analysis of the prompt emission, SEDs, and multi-wavelength lightcurves. E. T. initiated the project, coordinated the observations and their interpretation. B.O. led the study of the host galaxy. C.R.D.B., A.J.C.-T., Y.H., C.D.K., M.M., F.N., I.P.-G., and J.H.G acquired and reduced the data of the SOAR telescope. R.R. led the analysis of the radio data. B.O. reduced the JWST data. E.T. and B.O. acquired and reduced the HST data. E.T., B.O. and Y.-H.Y acquired and reduced the XMM-Newton data. E.T. and Y.-H.Y reduced the Swift data. Y.-H.Y reduced the TESS data. M.I, G.S.-H.P., M.J. S.-W.C., H.C. and C.-U.L. acquired and reduced the data of the KMTNet and RASA36 telescopes. J.D., S.B.C. and A.K. acquired and reduced the data of the PRIME telescope. J.H.G., B.O. and S.D. acquired and reduced the data of the Gemini telescope. J.H.G. and E.T. reduced the data of the X-shooter telescope. Y.-H.Y, G.R., H.v.E., Z.-G.D. contributed to afterglow modelling and their physical interpretation. Z.-K.P. contributed to possible progenitors. C.L.F. contributed to the interpretation of the data. Y.-H.Y, E.T., B.O. and J.H.G wrote the manuscript, with contributions from all authors.
The authors declare that they have no competing financial interests. Supplementary Information is available for this paper.
Correspondence and requests for materials should be addressed to Y.-H. Yang
(yuhan.yang@roma2.infn.it) and E. Troja (eleonora.troja@uniroma2.it).