1]Department of Physics, University of Rome “Tor Vergata”, via della Ricerca Scientifica 1, I-00133 Rome, Italy 2]Computer, Computational, and Statistical Sciences Division, Los Alamos National Laboratory, Los Alamos, NM 87545, USA 3]Center for Theoretical Astrophysics, Los Alamos National Laboratory, Los Alamos, NM 87545, USA 4]The University of Arizona, Tucson, AZ 85721, USA 5]Department of Physics and Astronomy, The University of New Mexico, Albuquerque, NM 87131, USA 6]The George Washington University, Washington, DC 20052, USA 7]Center for Computational Relativity and Gravitation, Rochester Institute of Technology, Rochester, New York 14623, USA 8]Department of Physics, The George Washington University, 725 21st Street NW, Washington, DC 20052, USA 9]Department of Astronomy, University of Maryland, College Park, MD 20742-4111, USA 10]Astrophysics Science Division, NASA Goddard Space Flight Center, 8800 Greenbelt Rd, Greenbelt, MD 20771, USA 11]Computational Physics Division, Los Alamos National Laboratory, Los Alamos, NM, 87545, USA 12]Astronomical Institute, Tohoku University, Aoba, Sendai 980-8578, Japan 13]Division for the Establishment of Frontier Sciences, Organization for Advanced Studies, Tohoku University, Sendai 980-8577, Japan 14]Space Telescope Science Institute, 3700 San Martin Drive, Baltimore, MD 21218, USA 15]Department of Astronomy and Astrophysics, The Pennsylvania State University, 525 Davey Lab, University Park, PA 16802, USA
Heavy element nucleosynthesis associated with a gamma-ray burst
Abstract
Kilonovae are a novel class of astrophysical transients, and the only observationally-confirmed site of rapid neutron capture nucleosynthesis (the -process) in the Universe [1, 2]. To date, only a handful of kilonovae have been detected [3], with just a single spectroscopically-observed event (AT 2017gfo; [4]). Spectra of AT 2017gfo [5, 6] provided evidence for the formation of elements heavier than iron [7]; however, these spectra were collected during the first days, when emission from light -process elements dominates the observations. Heavier elements, if synthesised, are expected to shape the late-time evolution of the kilonova [8, 9], beyond the phases for which we have spectral observations. Here we present spectroscopic observations of a rapidly-reddening thermal transient, following the gamma-ray burst, GRB 230307A. Early (2.4 day) optical spectroscopy identifies the presence of a hot ( K) thermal continuum. By 29 days, this component has expanded and cooled significantly ( K), yet it remains optically thick, indicating the presence of high-opacity ejecta. We show that these properties can only be explained by the merger of compact objects, and further, leads us to infer the production of the heavy lanthanide elements. We identify several spectral features (in both absorption and emission), whose cause can be explained by newly-synthesised heavy elements. This event marks only the second recorded spectroscopic evidence for the synthesis of -process elements, and the first to be observed at such late times.
Main text
The gamma-ray burst (GRB) 230307A was discovered on 7 March 2023 at 15:44:07 UTC (hereafter ) by NASA’s Fermi satellite [10, 11, 12], and later accurately localised by NASA’s Neil Gehrels Swift Observatory [13, 14]. Early observations across the entire electromagnetic (EM) spectrum detected a bright non-thermal transient that followed the GRB and rapidly faded. This emission, typically referred to as afterglow [15], arises from the interaction of the relativistic outflow with its surrounding medium [16, 17]. Multi-colour imaging of the source led to the identification of an additional component, in excess of the standard afterglow, at phases day [18]. This component, modelled as a thermal transient, is seen to rapidly shift toward infrared (IR) wavelengths.
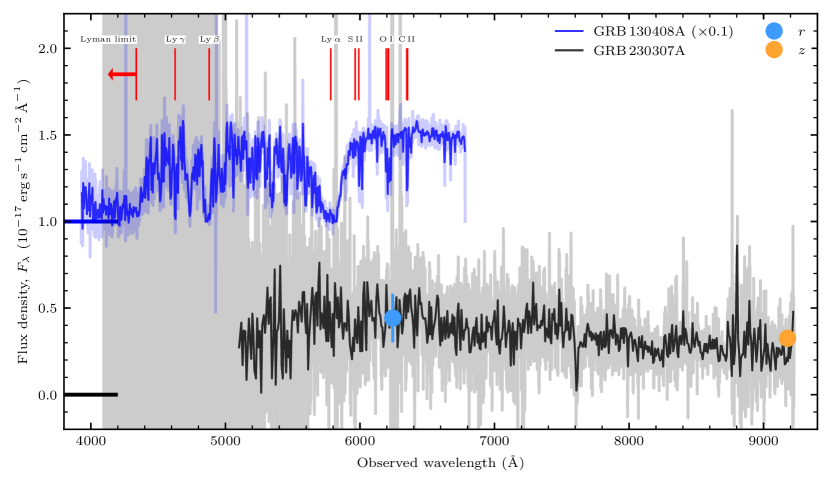
In addition to the comprehensive photometric dataset [18], several spectra of the GRB counterpart were acquired. We utilised the available spectroscopic dataset to constrain the GRB’s distance scale, and identify the origin of its rapidly-evolving thermal emission. First, we obtained an optical spectrum of the GRB counterpart with the 8.1 m Gemini South telescope at a phase of days (Figure 1). There is no clear evidence in this spectrum for any commonly-observed absorption or emission features. Specifically, the spectrum contains no evidence for the Lyman limit, responsible for suppressing emission blueward of Å. The high-significance detection of continuum emission redward of Å (observer frame) places an upper limit to the GRB redshift, . Additional constraints can be derived from the lack of any other prominent spectral features, such as Lyman- absorption. This absorption feature is prominent in GRB afterglow spectra [19] (Extended Data Figure 1). The lack of this feature in the optical spectrum of GRB 230307A strongly indicates that Lyman- lies blueward of the observed continuum emission ( Å), implying a more stringent constraint to the redshift, (Methods).
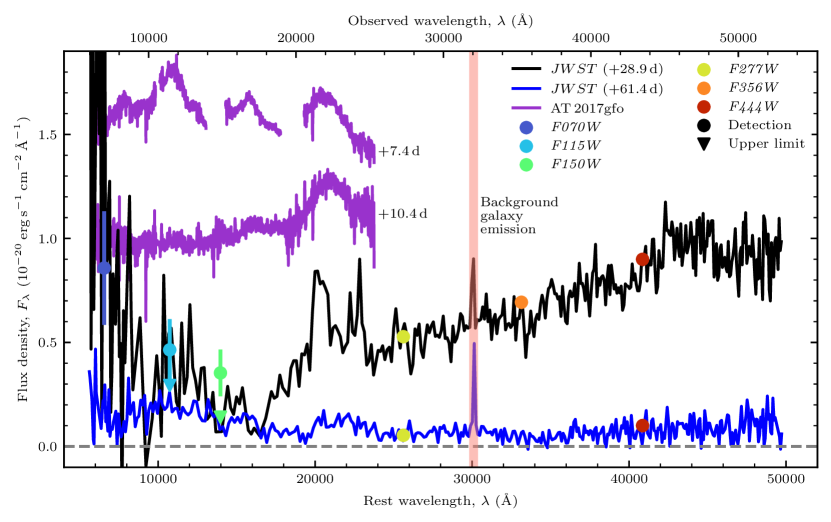
Additional spectra were obtained by the James Webb Space Telescope (JWST), at epochs of and days (Extended Data Figure 2; [20]). These spectra sample near- to mid-infrared (NIR–MIR) wavelengths, with coverage spanning m. Both JWST spectra display a prominent narrow emission line at Å. This emission line arises from a faint galaxy, offset from GRB 230307A by arcsec [20, 18]. If produced by H, this emission line corresponds to a redshift, . As H is the reddest of the most commonly-observed emission lines, this value sets a robust lower limit to the galaxy’s distance scale. Not only are there tensions between this high redshift and the observed high-energy properties of this burst [18, 21] but, as discussed above, our Gemini spectrum possesses no evidence in support of a high-redshift origin. We therefore conclude that the angular proximity of GRB 230307A to this high- galaxy is a chance alignment. Following the detailed analysis of [18], we place GRB 230307A at redshift, , by assuming the explosion occurred at the same distance of its most probable host galaxy. This corresponds to a luminosity distance, Mpc (assuming CDM cosmology with a Hubble constant, , and ; [22, 23]), thus making GRB 230307A one of the closest GRBs ever detected.
Having established the distance to GRB 230307A, we now turn to a physical interpretation of its unusual thermal emission. We find evidence for emission in excess of the expected afterglow contribution at days (Extended Data Figure 3, Methods). Initially, we modelled the spectrum with a single power-law function to represent the expected spectral energy distribution (SED) of the non-thermal afterglow emission. While a single power-law with exponent can reproduce the optical spectrum, this derived slope significantly overestimates the X-ray flux at this phase. We interpret this as evidence of a thermal component contributing to the optical band. This interpretation is further corroborated by the spectral shape at later times. Both JWST spectra are inconsistent with the expected afterglow contribution (Extended Data Figure 3). The first JWST spectrum ( days) exhibits a very red colour with a steep continuum () consistent with the blue end of a blackbody component. The second JWST spectrum ( days) exhibits marked evolution compared to the first, confirming the transient nature of the thermal component.
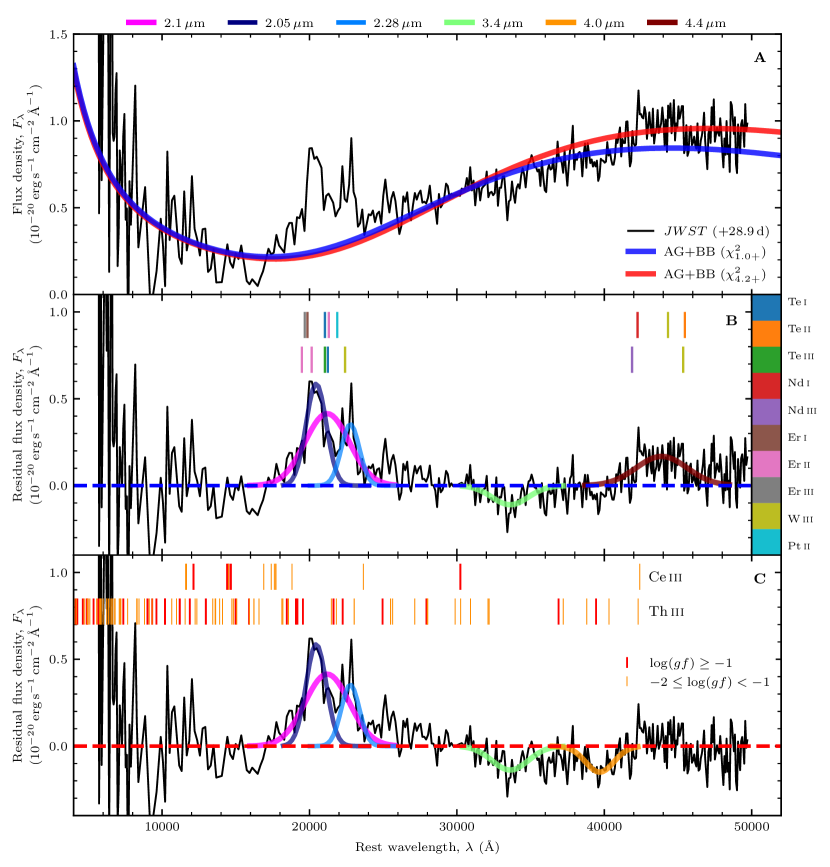
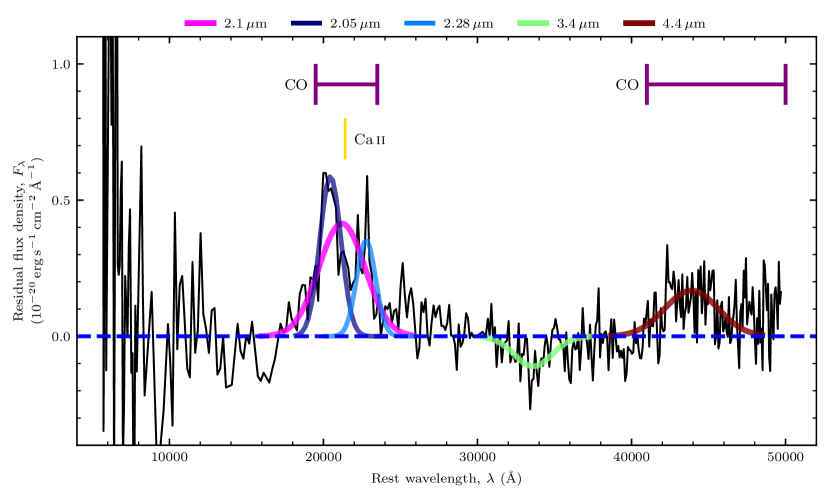
To investigate the properties of this component, we modelled the spectra with the combination of a power-law continuum and a blackbody profile (Methods). This allows us to isolate the afterglow contribution and estimate the photospheric temperature () and radius () of the thermal component. Assuming homologous expansion then leads to an estimate for the photospheric velocity (). The best-fitting models are presented in Extended Data Figure 3, with associated model parameters presented in Extended Data Table 1. Based on this analysis, we identify several spectral features at days (Methods). These can be interpreted as emission-like features rising above the observed continuum, with peak wavelengths of and 4.4 m, as well as an absorption-like feature suppressed below the continuum, centred at m (Figure 2). We find the m emission feature can be readily explained by either a single component, or a blend of two components. The location of this feature is comparable to a prominent emission feature visible in the late-time spectra of AT 2017gfo [24] (Extended Data Figure 2).
An alternative continuum fit recovers the same emission feature at m and absorption feature at m, but indicates the presence of another absorption-like feature, centred at m (Figure 2). We note that this prominent m emission feature is also present in the later JWST spectrum, although it has faded by a factor of , and shifted redward by Å (Extended Data Table 2). From this empirical analysis, we conclude the following: (i) the ejecta exhibits a high expansion velocity, , and rapid cooling, from K at days to K at days; (ii) there is evidence for optically thick material at least up to days; (iii) spectral features are present at and days (in emission and absorption). We use these observational constraints to probe the ejecta properties and identify the nature of the explosion.
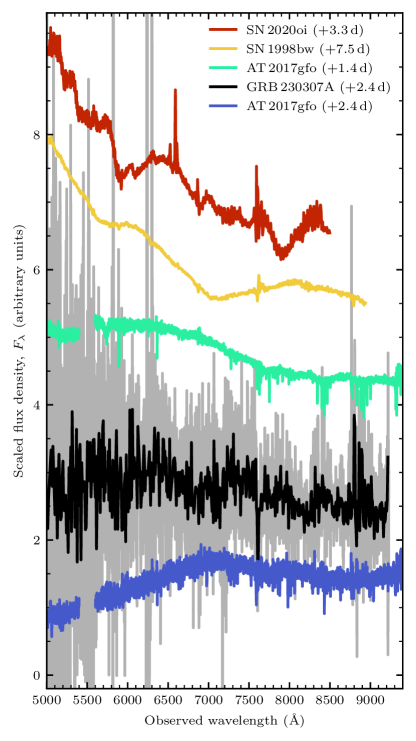
The inferred high expansion velocities match previous observations of GRB supernovae (GRB-SNe; e.g., [25]) and kilonovae (KNe; e.g., [26, 5, 6]), both of which are transient phenomena previously associated with GRBs. In Figure 1, we compare the optical spectrum of GRB 230307A with early spectra obtained for the GRB-SN 1998bw [27], the type Ic SN 2020oi [28], and the KN, AT 2017gfo [5, 6].111Spectra for SNe 1998bw and 2020oi were obtained from the WISeREP repository (https://wiserep.weizmann.ac.il; [29]). We utilise the flux-calibrated spectra of AT 2017gfo, publicly available on the ENGRAVE webpages (https://www.engrave-eso.org/AT2017gfo-Data-Release). Both SN spectra display a blue color and prominent absorption features, neither of which match the Gemini spectrum of GRB 230307A. The overall spectral shape of GRB 230307A best matches the AT 2017gfo spectrum obtained at +1.4 days. The evolution across all three epochs of spectral observations of GRB 230307A is too rapid to match the evolutionary timescales of high-mass ejecta ( a few solar masses) from typical GRB-SNe, but does match expectations for the low-mass ejecta ( a tenth of a solar mass) from KNe and other compact object mergers. We therefore consider the possibility that the thermal emission associated with GRB 230307A is produced by a compact object merger, involving a white dwarf (WD) or neutron star (NS), merging with a NS or stellar mass black hole (BH). These mergers (WD–NS/BH, NS–NS/BH) produce rapidly-evolving transients (e.g., [26, 30, 31]), as observed in the case of GRB 230307A.
We begin by examining the case of a KN from a NS–NS/BH merger. KNe are powered by the radioactive decay of many rapidly-synthesised heavy isotopes [32, 1, 33] produced via the rapid neutron capture process (-process; [2]). A KN naturally accounts for the luminosity, red colour and rapid evolution of the transient; however, the late-time properties are unprecedented for a KN, and not readily explained by current quantitative models. There have been several previous identifications of KN events associated with GRBs [3], but only one of these has been observed spectroscopically – AT 2017gfo [5, 6]. AT 2017gfo exhibited rapid evolution, transitioning from a blue to a red kilonova after just days [26], and exhibiting deviations from a photospheric spectrum after 1 week [34]. Given the low ejecta mass and rapid expansion velocity inferred for AT 2017gfo ( M⊙ and ; [35]), the ejecta transitions away from an optically thick regime (i.e., ) for opacities, .
In contrast to these expectations, the first JWST spectrum of GRB 230307A appears to be dominated by a red thermal continuum. Sophisticated two-component KN models, which include radiative transfer and detailed opacity information [36, 33, 37], predict a spectrum rich in emission features that does not match the observed spectral shape for any plausible range of ejecta mass and velocity (Methods). This mismatch occurs due to the model opacity m being too low to reproduce the red continuum.
Given this limitation, we adopt a simplified semi-analytic model, which allows us to empirically constrain the basic properties of the ejecta (e.g., mass, velocity, and opacity) without complete and detailed atomic line information [1]. This model contains no radiative transfer, and assumes a one-zone, single component ejecta, with total mass (split into shells with mass , distributed as a function of velocity ), minimum velocity , wavelength-independent (i.e., grey) opacity , and a power-law parameter which describes the mass-distribution of the ejecta (Methods). After subtracting the contribution of the non-thermal afterglow, our best-fitting model can reproduce the JWST spectrum at days by invoking M⊙, and (Extended Data Figures 5 and 6). This analysis confirms that an optically thick spectrum at such late times requires high opacities – a statement that applies to both WD–NS/BH and NS–NS/BH mergers.
We now explore two possible scenarios that may explain the inferred high opacities at these wavelengths and at this phase – heavy elements in the case of a NS–NS/BH merger, and molecules in the case of a WD–NS/BH merger. In KN models, atomic processes (i.e., bound–bound transitions) dominate the opacity. Under the inferred conditions at days ( K), it is already difficult to produce the required continuum opacities above m. This issue is exacerbated further if one also attributes the MIR emission at days to a thermal continuum (Extended Data Figure 3). Assuming local thermodynamic equilibrium (LTE), iron-peak elements and first -process peak elements possess some line features m, but nothing that will produce strong lines m. Only heavy elements, such as the lanthanides (e.g., cerium, neodymium), have strong lines m (Figure 3). With sufficient Doppler broadening and the inclusion of more detailed opacity, these lines can potentially provide the ‘continuum-like’ opacities required to produce a photosphere.
At these low temperatures, non-thermal effects are expected to be significant, and, as we shall discuss below, may be required to explain the observed emission features. However, we note that lines from non-thermal effects (e.g., forbidden transitions) are not able to produce the dense forest of lines needed to generate the high continuum opacities. We conclude that for KN models, lanthanides (or other heavy -process elements; e.g., actinides) must be present in the ejecta to explain the existence of a photosphere (Methods).
We further investigate which -process species are able to explain the spectral features present in emission. Following Ref. [24] (see also Supplementary Material), we shortlist a number of forbidden transitions that are coincident with the two emission features (Extended Data Table 4). Of particular interest is tellurium (Te). We recover the same [Te iii] transition proposed by [20] for the feature at m, in addition to finding agreement with a prominent [Te ii] transition and the m feature. Tellurium lies at the top of the second -process abundance peak, and, therefore, it is expected to be abundant in KN ejecta across many different -process scenarios [38, 24]. We also shortlist multiple ions of the lanthanides neodymium and erbium (Nd and Er, respectively), which are capable of matching the observed emission. These are expected to be among the most abundant lanthanide elements synthesised [39, 40, 41, 42, 38], and their presence is supported by the high opacity of the inner ejecta, and by the rapid evolution of the photosphere [18]. Therefore, invoking them as the cause of these spectral features seems plausible. Singly-ionised platinum (Pt ii), a third -process peak element, may also contribute to the emission feature at m [38].
The possible source of the two absorption features, centered at and m (Figure 2), is less certain. We identify a number of strong candidate transitions for doubly-ionised cerium and thorium (Ce iii and Th iii) which tend to produce strong absorption lines at NIR and MIR wavelengths [43]. However, they both present some inconsistencies with the observed data (Supplementary Material). Regardless of the specific identification, the spectral features of GRB 230307A can only be explained by KN models if robust -process nucleosynthesis took place, in agreement with the conclusions derived from the opacity calculations.
If instead the transient associated with GRB 230307A was produced by a carbon–oxygen WD–NS merger, the slowest-moving ejecta is expected to be predominantly carbon (C) and oxygen (O) [44]. Although the atomic opacities of these elements would be low, the inferred photospheric temperature supports contribution from both molecular and dust opacities. Both CO molecular and dust features have been observed in a number of SNe d after explosion [45]. CO molecular features are expected to arise at temperatures K. Because the WD–NS merger models tend to have ejecta velocities that are higher than normal SNe, adiabatic expansion (where temperature is inversely proportional to both velocity and time) predicts that this ejecta will achieve similar conditions earlier than normal SNe. As expected, our inferred ejecta temperatures at and 60 days are similar to those of SNe at 300 d (e.g., [45]). The combined molecular and dust opacities may explain the continuum opacity required to produce the photosphere (Methods) and, in addition, provide a match to the observed line features.
The line identifications for the features presented in Figure 2 are very different in the WD–NS/BH merger scenario. WD–NS/BH mergers eject large amounts of C, O and calcium (Ca). Assuming LTE opacities, Ref. [44] predict strong Ca i lines m, which could contribute to the m emission feature of GRB 230307A. Additionally, non-thermal effects could produce prominent Ca ii features at 2.1395 and 2.1435 m. At these temperatures, the CO molecular line features should also be present, with first overtone features spanning m, and second overtone features spanning m (assuming a bulk blueshift of ), potentially explaining both the emission features (see Extended Data Figure 7). We note the relative strengths of these features matches expectations for the strengths of the first and second overtones, with the m feature being more luminous than the m feature.
Based on the analysis of the late-time JWST spectra, we cannot break the degeneracy between the two progenitor models, as they both provide a plausible interpretation of the observational features. However, whereas a KN from a NS–NS/BH merger matches the featureless Gemini spectrum at days, the transient from a WD–NS/BH merger is expected to be rich in absorption features [30, 44], seemingly at odds with the early spectral observations. The identification of GRB 230307A as a NS–NS/BH merger is also supported by its rapid reddening, with its spectrum peaking in the -band at days [18]. Based on our current understanding of WD–NS/BH mergers and their electromagnetic counterparts, we consider these systems a less likely progenitor for GRB 230307A. NS–NS/BH mergers provide a more consistent explanation of the full dataset, and are backed by observational evidence from past KNe. The rate of events is also consistent with the range inferred from Swift observations ( Gpc-3 yr-1 sky-1; [46]).
The proposed classification as a NS–NS/BH merger means that GRB 230307A doubles the sample of spectroscopically-observed KNe, while also providing the first spectral observations of a KN at late times ( days post-explosion) and at MIR wavelengths ( m). Whereas the identification of individual -process species remains uncertain, the presence of a thermal continuum is a strong indicator of high-opacity lanthanide element nucleosynthesis.
Methods
1 Distance constraints
Our Gemini/GMOS spectrum offers the most direct constraint to the distance scale of GRB 230307A, which is a key parameter for its physical interpretation. The lack of absorption and emission features prevents an accurate redshift measurement, and also inform us that the GRB is not located in a highly star-forming region. The most stringent limit that we can place is derived from the absence of Lyman- absorption, which is a prominent feature in GRB afterglow spectra. The legacy sample of X-shooter GRB afterglows [19] reports the identification of Lyman- in all 42 GRBs located at , where the feature is visible by the spectrograph.
Gemini/GMOS has a narrower wavelength coverage, but is still sensitive to the Lyman- feature for . As an example, we show the Gemini South spectroscopy of GRB 130408A [48] at (Extended Data Figure 1). The spectrum was reduced using standard recipes in DRAGONS [49, 50], and calibrated using observations of a standard star. Around the time of the observations, GRB 130408A was AB mag [51], 8 times brighter than GRB 230307A ( AB mag; [18]). However, the reduced spectrum shown in Extended Data Figure 1 consists of a 600 s exposure, times shorter than the total integration time for GRB 230307A. Therefore, the sensitivity of the reduced spectra should be somewhat comparable.
As shown in Extended Data Figure 1, there are prominent absorption features in the spectrum of GRB 130408A, arising from Lyman-, Lyman- and the Lyman limit, in addition to various lines belonging to C ii, O i and S ii. Clearly, none of these features are present in the spectrum of GRB 230307A. An equivalently-prominent Lyman- absorption feature should be observable at Å, if GRB 230307A is located at , ruling out a physical association with the high- background galaxy visible in the JWST observations. Moreover, since we do not see this feature at any position Å in our observed spectrum, we can estimate a more constraining upper limit for GRB 230307A to be .
2 Identification of an additional emission component
GRBs are followed by a long-lived non-thermal afterglow that, over a narrow energy band, is typically well described by a simple power-law spectrum: , where is the flux density (in -space) and is the spectral index. Note that since we present all spectra in this manuscript in terms of , we opt to present the afterglow modelling in space too. Our afterglow model parameters are easily converted into space, with the exponents for both related by: .
The Gemini spectrum is reasonably reproduced by a single power-law, where erg s-1 cm-2 Å-1. However, this fit significantly over-predicts the flux at high energies [18], and is not consistent with the spectral index derived from X-ray spectroscopy and broadband SED modelling (; [18]). With this additional constraint, we quantitatively estimate the afterglow’s flux contribution to the optical spectrum. Comparing our estimated value to the observed data shows evidence for an emission component in addition to the standard afterglow (Extended Data Figure 3).
The initial JWST ( day) spectrum has a steep, red continuum, and clearly demonstrates an excess compared to the expected afterglow contribution. We again use the X-ray data [18] as a tracer of the non-thermal emission, and estimate its contribution to longer wavelengths, adopting [18]. We find that the afterglow dominates the observed spectrum m, but cannot produce the flux redward of this wavelength (see Extended Data Figure 3). The later JWST spectrum ( days) is significantly fainter (see Extended Data Figure 2). However, there is still a detectable signal, allowing us to further explore any excess to the afterglow at this phase. Using the same methodology and spectral index, we again find evidence for a flux excess (see Extended Data Figure 3).
3 Empirical modelling
We model the emission in excess of the standard afterglow with a Planck function, characterised by two free parameters – the effective temperature and radius of the emitting surface ( and , respectively). This choice is motivated by the steep rising continuum observed by JWST, consistent with a blackbody profile, and by the analysis of the broadband SED [18]. The best-fit model is obtained by minimising the residual values between the model and the observed data. From the best-fit parameters, we derive the expansion velocity of the ejecta (assuming homologous expansion, i.e., , where is the time since explosion) and the luminosity of the transient, , where is the Stefan-Boltzmann constant.
The properties of the best-fit thermal component for each spectral epoch are listed in Extended Data Table 1. For the JWST spectrum at days, we report two possible models. The former, dubbed ‘’, is obtained by fitting the observed spectrum for wavelengths, m (with the prominent emission feature at m and the background galaxy line masked). Above 4.2 m, we identify emission that lies systematically above the model continuum (Figure 2). We therefore present an alternative description of the thermal component, by interpreting the flux redward of m as the true continuum level, as opposed to an excess from an additional source. This model, dubbed ‘’, is obtained by fitting the observed spectrum for m. This fit leads to minor variations in the inferred properties of the thermal continuum but, as described below, it affects the identification of the spectral features.
4 Spectral features
From our empirical fit () of the first JWST spectrum, we identify three broad deviations from our model continuum. These appear to be two emission-like features rising above the observed continuum, with peak wavelengths of and 4.4 m, and an absorption-like feature at m (see Figure 2). Alternatively, based on the model, we identify two absorption-like features, centred at and 4.0 m, in addition to the prominent m emission-like feature. The m feature is also visible in the late-time JWST spectrum.
In Figure 2 we compare both model continua (and ) to the observed JWST spectrum. We also present the continuum-subtracted spectra obtained from both interpretations, and highlight the locations of the spectral features in emission and in absorption. We fit these features with Gaussian profiles, and extract estimates for their peak wavelength, full-width, half-maximum (FWHM) velocity () and total flux – summarised in Extended Data Table 2. From this fitting procedure, we derive , comparable with the inferred photospheric velocities.
The presence of these broad spectral absorption and emission features is indicative of the existence of some ion(s) in the ejecta of GRB 230307A influencing the observed continuum shape. As such, we performed a line identification study to constrain the presence of emitting species in the ejecta (as detailed in Ref. [24] and in the Supplementary Material). Our search returned matches with light (e.g., silver, tellurium), intermediate (e.g., neodymium, erbium) and heavy (e.g., tungsten, platinum) -process elements that possess transitions in coincidence with the observed emission features (see Extended Data Table 4 for the full list). We searched for matches to the absorption features with Ce iii and Th iii (as in Ref. [43]), but found no convincing explanation for these ions dominating these spectral features (see Supplementary Material).
5 Kilonova modelling with SuperNu
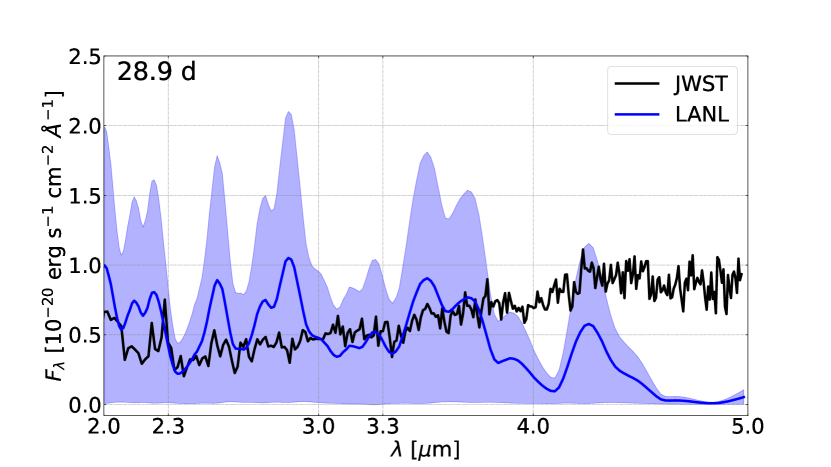
We explore whether the observed thermal emission could be interpreted as a kilonova. To this aim, we apply the Los Alamos National Laboratory (LANL) radiative transfer code, SuperNu [52], to model the spectrum at days. SuperNu lightcurves and spectra have proven successful in recovering estimates for the ejecta properties of AT 2017gfo [53, 54, 37, 55, 56], motivating its application here.
We use simulated two-component (lanthanide-rich dynamical ejecta and lanthanide-poor wind ejecta) spectra derived from the LANL simulation library [36, 57, 33, 37]. Due to the prevalence of the signal in the infrared, we expect the dynamical ejecta component to dominate. The higher opacities in this ejecta, largely due to the atomic line contributions of heavy -process elements, lead to the re-processing of photons to longer wavelengths, not observed in the wind component. Given the detection of a GRB, we only consider spectra for nearly on-axis viewing angles (∘).
Using the same approach detailed in Ref. [55], we infer a dynamical ejecta mass M⊙, and velocity . As we discuss below, the small errors in these inferred models are, in part, an artifact of the model assumptions. Extended Data Figure 4 compares the day JWST spectrum with the simulated spectrum, corresponding to the best-fitting SuperNu model parameters. The main discrepancy between the model and observation is in the continuum trend – the observed spectrum trends upward for longer wavelengths, whereas the simulated spectrum demonstrates the opposite behavior, trending downward, with a sharp fall-off m. There is some minor agreement at m where the model can match the observed spectrum, but beyond m, the flux is typically too under-luminous to fit the observed red spectrum.
In addition, we also explored a range of low-mass ( M⊙) ejecta models with different compositions. In these SuperNu models, the photosphere has receded significantly, and most of the emission arises from optically-thin regions, where electrons are still sufficiently trapped to thermalise and produce emission. If the opacity was dominated by iron-peak or first -process peak elements, the emission would be much bluer than what is observed. Models with heavy -process distributions match the observed level of IR flux; however, their spectra display strong spectral features rather than a smooth continuum. Either our models are missing sufficient atomic data information to fill in these spectral features (we do not use a full complement of the lanthanide and actinide elements in these models), or a true photosphere is necessary to interpret the red continuum observed by JWST.
6 Kilonova semi-analytic modelling
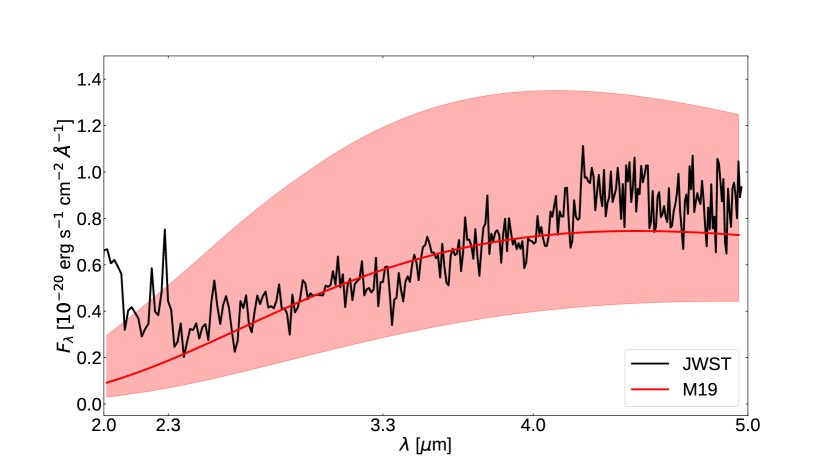
Motivated by our inability to reproduce the observed spectra with SuperNu models, we shift our modelling of the thermal continuum to an empirically-motivated analysis using the semi-analytic model presented by [1] (hereafter referred to as M19).
The M19 model assumes a one-zone, single-component ejecta with total mass (split into mass shells which are distributed as a function of velocity ), minimum velocity , wavelength-independent (grey) opacity , and a power-law parameter which describes the mass-distribution of the ejecta in velocity space, as . The model calculates the energy evolution of the system which is assumed to be expanding homologously (i.e., non-accelerating) in the radial direction. In our case, the energy evolution focusses only on heating by -process radioactive () decays and cooling via radiative losses and ejecta expansion. The -process heating prescription uses the analytic heating rate presented in [58], with thermalisation efficiencies from [59]. Radiative emission is measured from the photosphere, identified as the radius at which the optical depth, . The final model output produces the spectral energy density emitted by a blackbody with photospheric temperature and radius, and . Throughout this calculation, the model does not perform any radiative transfer.
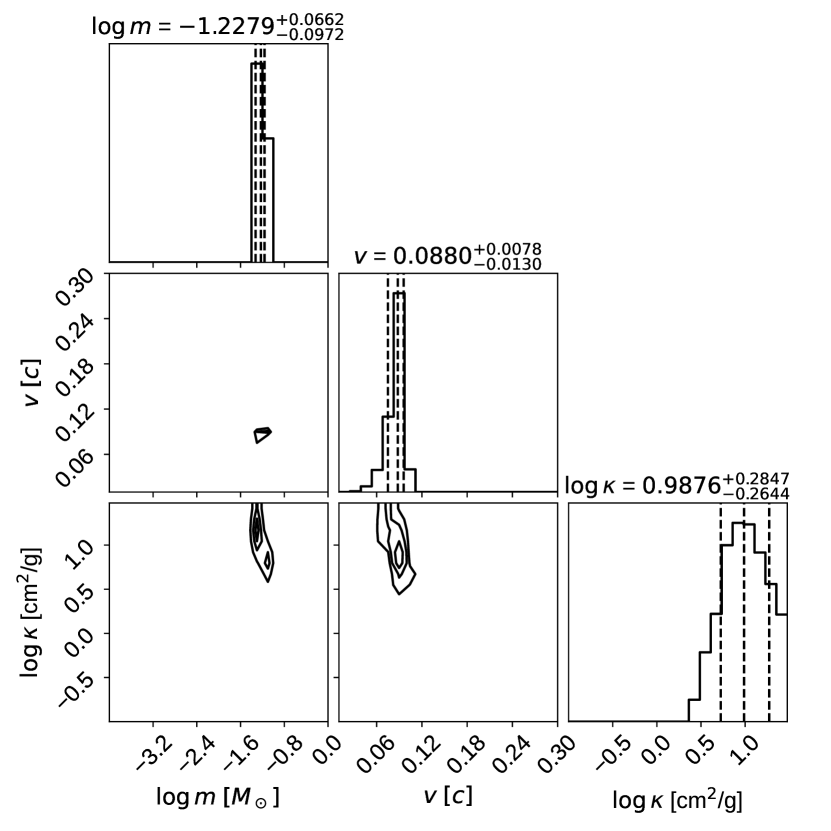
Spectra are generated using iterative grids of input model parameters drawn from our prior-constrained parameter space (, , , ). The final posteriors presented in Extended Data Figure 6 are generated using total samples. Agreement to the observed data is calculated using reduced statistics. The best-fit spectrum compared to the day JWST spectrum is shown in Extended Data Figure 5. The best-fit model parameters and their 1 confidence intervals are M⊙, , and . The velocity distribution parameter is largely unconstrained; however, its effects on the fit are minor compared to those of the opacity and mass. The main result derived from this analysis is that high opacities are required to reproduce the observed thermal continuum at infrared wavelengths.
As cautioned above, the M19 model makes several simplifying assumptions; however, these do not affect our inference about high opacities. In this model, the ejecta mass is primarily set by the energy deposition needed to produce the observed luminosities. The one-zone model is unable to capture many effects of radiation transport that can alter our final solutions. For example, in full transport models, radiation (both thermal and non-thermal photons) from the inner ejecta can heat the material at the photosphere. This additional energy source would decrease the required mass in our fits. The trend from this effect would be for our current set of models to over-estimate the ejecta mass, and under-estimate the opacity.
7 White dwarf – neutron star mergers
The long-duration of the gamma-ray emission could suggest a less compact progenitor system, such as a WD–NS/BH merger [60, 44, 61]. Current WD–NS merger models produce a wide range of bolometric light curves [62, 44], some of which are consistent with the observed luminosity of GRB 230307A. Due to the fast 56Ni ejecta, their spectra are initially blue, but become redder over time [44]. Other models are instead always dominated by their reddest band (e.g., -band; [62]), although none of these models or simulations achieve the rapid reddening observed for GRB 230307A.
Moreover, given that the heaviest elements in these mergers are typically limited to the iron-peak, achieving the high atomic opacities required to produce a photosphere at late-times is difficult (Figure 3). CO molecules dominate the slow-moving ejecta in these WD–NS merger models. At temperatures K, CO molecular lines have been observed in SNe [63, 64], and these present a good match to the observed emission features in GRB 230307A, assuming a modest bulk blueshift (see Extended Data Figure 7). Molecular features can also contribute to the inferred high infrared opacities.
Our models of WD–NS mergers match the current state-of-the-art simulations using SuperNu (or similar high-order transport schemes), assuming LTE opacities. Extended Data Figure 8 shows the simulated spectra at 30 d for a range of WD–NS merger models, whose ejecta are sensitive both to the masses of the WD and NS, and the evolution of the disk and its wind [44]. Because the opacities are derived assuming LTE, Ca i lines produce a strong feature m [44], that could plausibly explain the observed feature in GRB 230307A.
8 Ejecta opacity
The high opacities required to produce a photosphere in the infrared are evidence that lanthanides (or other heavy -process elements, e.g., actinides) exist in the ejecta. Figure 3 shows the binned LTE opacities from the LANL database [65], assuming a density, g . At the low radiation temperatures expected in our kilonova models ( K), the atoms are expected to be in their neutral states (according to LTE), and only lanthanides and actinides (e.g., Nd, U) have strong features. It has been argued that high-energy electrons produced via -decay can drive the atoms to higher ionisation states than expected by collisions from thermal electrons [66]. To try to understand the spectra from atoms at higher ionisation states, we plot the Fe and Te spectra at 3 eV, when these elements are doubly-ionised. Even with these conditions, we cannot produce the high opacities needed to explain the photosphere and match the observed red spectra. Therefore, to obtain high atomic opacities beyond m, heavier -process species (i.e., lanthanides or actinides) are required. We have varied both the temperature and density to determine the sensitivity of these results on the exact conditions and, although specific line features vary, these basic conclusions do not change.

| Time since | Luminosity | |||
|---|---|---|---|---|
| (days) | (K) | ( cm) | () | (erg s-1) |
| 2.36 | ||||
| 28.9a | ||||
| 28.9b | ||||
| 61.4c |
-
a
best-fitting model.
-
b
best-fitting model.
-
c
The validity of invoking a thermal component to model the continuum at this epoch is uncertain.
| Approx. feature | Peak | Feature flux | |
|---|---|---|---|
| position (m) | wavelength (Å) | () | ( erg s-1 cm-2) |
| days () | |||
| 2.1 | 21200 | 0.167 | 15.6 |
| 2.05 | 20500 | 0.079 | 10.1 |
| 2.28 | 22800 | 0.064 | 5.4 |
| 4.4 | 43900 | 0.093 | 7.3 |
| days () | |||
| 3.4 | 33600 | 0.086 | 4.2 |
| 4.0 | 39700 | 0.057 | 4.1 |
| days | |||
| 2.1 | 22000 | 0.173 | 3.5 |
| Parameter | Value | Unit |
|---|---|---|
| [] | ||
| [] | ||
| [] | ||
| – | ||
| [K] | ||
| [ cm] | ||
| [ erg s-1] | ||
| [ g ] |
| Species | (Å) | Level energies (eV) | Lower level | Upper level | Relative level population | |||||||
| Lower | Upper | Configuration | Term | J | Configuration | Term | J | |||||
| m (or and 2.28 m) feature | ||||||||||||
| [47Ag iii] | 21696 | 0.000 | 0.571 | 4d9 | 2D | 4d9 | 2D | 1.0 | ||||
| [50Sn ii] | 23521 | 0.000 | 0.527 | 5s25p | 2P | 5s25p | 2P | 1.0 | ||||
| [52Te i] | 21049 | 0.000 | 0.589 | 5p4 | 3P | 2 | 5p4 | 3P | 1 | 1.0 | ||
| [52Te i] | 21247 | 0.000 | 0.584 | 5p4 | 3P | 2 | 5p4 | 3P | 0 | 0.36 | ||
| [52Te iii] | 21050 | 0.000 | 0.589 | 5s25p2 | 3P | 0 | 5s25p2 | 3P | 1 | 1.0 | ||
| [56Ba i] | 19944 | 2.239 | 2.861 | 6s6p | 1P | 1 | 5d6p | 1D | 2 | 1.0 | ||
| [56Ba ii] | 20518 | 0.000 | 0.604 | 6s | 2S | 5d | 2D | 1.0 | ||||
| [68Er i] | 19860 | 0.000 | 0.624 | 4f126s2 | 3H | 6 | 4f126s2 | 3F | 4 | 1.0 | ||
| [68Er ii] | 21312 | 0.055 | 0.636 | – | – | – | – | 1.0 | ||||
| [68Er ii] | 19483 | 0.000 | 0.636 | – | – | – | – | 1.0 | ||||
| [68Er ii] | 20148 | 0.055 | 0.670 | – | – | – | – | 0.54 | ||||
| [68Er iii] | 19678 | 0.000 | 0.630 | 4f12 | 3H | 6 | 4f12 | 3F | 4 | 1.0 | ||
| [72Hf i] | 21893 | 0.000 | 0.566 | 5d26s2 | 3F | 2 | 5d26s2 | 3F | 4 | 0.053 | ||
| [74W iii] | 22416 | 0.000 | 0.553 | 5d4 | 5D | 0 | 5d4 | 5D | 2 | 0.070 | ||
| [77Ir ii] | 20886 | 0.000 | 0.594 | 5d7(4F)6s | 5F | 5 | 5d7(4F)6s | 5F | 4 | 1.0 | ||
| [78Pt ii] | 21883 | 0.593 | 1.160 | 5d86s | 4F | 5d86s | 4F | 1.0 | ||||
| m feature | ||||||||||||
| [49In i] | 45196 | 0.000 | 0.274 | 5s25p | 2P | 5s25p | 2P | 1.0 | ||||
| [52Te ii] | 45466 | 1.267 | 1.540 | 5s25p3 | 2D | 5s25p3 | 2D | 1.0 | ||||
| [56Ba i] | 44847 | 2.635 | 2.911 | 5d2 | 3F | 3 | 5d2 | 3P | 1 | 0.33 | ||
| [56Ba i] | 43570 | 2.681 | 2.966 | 5d2 | 3F | 4 | 5d2 | 3P | 2 | 0.30 | ||
| [56Ba i] | 43956 | 2.595 | 2.878 | 5d2 | 3F | 2 | 5d2 | 3P | 0 | 0.16 | ||
| [60Nd i] | 42255 | 0.000 | 0.293 | 4f46s2 | 5I | 4 | 4f46s2 | 5I | 6 | 1.0 | ||
| [60Nd iii] | 41884 | 0.000 | 0.296 | 4f4 | 5I | 4 | 4f4 | 5I | 6 | 1.0 | ||
| [72Hf i] | 42433 | 0.000 | 0.292 | 5d26s2 | 3F | 2 | 5d26s2 | 3F | 3 | 1.0 | ||
| [72Hf i] | 45229 | 0.292 | 0.566 | 5d26s2 | 3F | 3 | 5d26s2 | 3F | 4 | 0.053 | ||
| [74W iii] | 44322 | 0.000 | 0.280 | 5d4 | 5D | 0 | 5d4 | 5D | 1 | 1.0 | ||
| [74W iii] | 45352 | 0.280 | 0.553 | 5d4 | 5D | 1 | 5d4 | 5D | 2 | 0.070 | ||
| [89Ac i] | 44814 | 0.000 | 0.277 | 6d7s2 | 2D | 6d7s2 | 2D | 1.0 | ||||
-
o
Denotes an odd parity.
Supplementary material
1 Spectral observations
GRB 230307A was observed with both Gemini and JWST. Here we summarise the main details of each observation, and their reduction.
1.1 Gemini
We carried out spectroscopic observations of GRB 230307A with the 8.1 m Gemini South telescope through Director’s Discretionary Time (DDT) program GS-2023A-DD-104 (PI: B. O’Connor). Observations with GMOS-S commenced on 10 March 2023 at 00:23:20 UTC ( days post-GRB), and consisted of s exposures with the R400 grating, which sampled the Å wavelength range. These observations were reduced using standard recipes in pypeit [68, 69], and the spectrum was calibrated against a standard star. The reduced spectrum agrees well with the optical photometry obtained by Gemini and SOAR at the same phase [18] (see Extended Data Figure 1).
1.2 James Webb Space Telescope
The JWST observations of GRB 230307A were carried out as part of DDT programs 4434 and 4445 (PI: A. Levan) using the Near-Infrared Spectrograph (NIRSpec; [70]) and the Near-Infrared Camera (NIRCam; [71]). The NIRSpec spectra were obtained with the fixed slit using the clear prism with a hour exposure. Observations for the first spectrum commenced on 5 April 2023 at 13:58:28 UTC, which corresponds to a phase of days post-GRB. The second spectrum was obtained almost one month later, on 8 May 2023 at 01:57:38 UTC, corresponding to days post-GRB.
We downloaded all calibrated and reduced Level3 data from the Mikulski Archive for Space Telescopes (MAST)222https://mast.stsci.edu/portal/Mashup/Clients/Mast/Portal.html and performed our own detailed, customised extraction using the JWST pipeline (version 1.10.2; [72]). We compared the results to the default extractions in MAST, and manual extractions from the JWST Data Visualization Tool (Jdaviz; [73]). We found that, in both instances, our custom reductions resulted in comparable (but slightly different) extracted spectra. The spectra obtained from the customised extractions were then flux-calibrated to the contemporaneous NIRCam photometry, to account for the lack of aperture correction and slit losses (see Extended Data Figure 2).
2 Data pre-processing
We down-sample the observational data such that each new observational wavelength bin contains a new observational flux value defined as:
| (1) |
where is the number of original observational wavelength data points that are down-sampled into the relevant wavelength bin . We rebin the observational data to match the 1024 equally log-spaced wavelength bins spanning used by SuperNu, described in the following section. Throughout this work, all simulated spectra are compared to the rebinned, down-sampled observational data . Due to the difference in wavelength ranges between our observed and simulated data sets, we are only able to compare the observed data to at most 193 wavelength bins between m. Unless otherwise noted, we down-sample our data to only include wavelengths m (approximately where the thermal continuum dominates) and below 5 m (the upper limit of the JWST observation).
3 Parameter inference
We identify the best-fit ejecta parameters and using a simple mean-squared-error goodness-of-fit statistic, defined as:
| (2) |
where represents the index for wavelength bins , is the interpolated spectral energy density scaled to a distance of 291 Mpc, is the rebinned observed spectral energy density, and is the uncertainty on the rebinned observed spectral energy density. To assess the relative distribution of different model parameters , we use a likelihood, and an initial uniform prior over ejecta parameters given the limits described in the LANL and M19 modelling sections. From our posterior-weighted Monte Carlo samples, we report the median posterior value as the best-fit sample, with statistical errors on each component derived from the posterior distribution.
4 Line identification
As highlighted above, the day JWST spectrum contains evidence of spectral features in the ejecta at these late times. There exist two interpretations of the continuum location ( and ), which result in the inference of either one absorption ( m) and two emission ( and 4.4 m) features in the case, or one emission ( m) and two absorption ( and 4.0 m) features in the case. We investigate the cause of each of these features below.
4.1 Emission features
4.1.1 Methodology
For emission features at these late phases, it is reasonable to expect their source to be from intrinsically weak (i.e., forbidden) lines, emitted from some optically thin region of the ejecta material [66, 74, 75]. We therefore search for forbidden transitions (either magnetic dipole or electric quadrupole, traditionally labelled M1 and E2, respectively) that match either of the emission features inferred for GRB 230307A. We utilise the same methodology outlined by [24] to generate our synthetic line lists for all heavy elements of interest (neutral to doubly-ionised, for ), taking level information from the National Institute of Standards and Technology Atomic Spectra Data base (NIST ASD; [67]).
We follow the same method as outlined by [24], and we summarise the main steps below (but for full details, see [24]). Basically, we generate synthetic line lists from the level information presented by the NIST ASD [67], for all neutral, singly- and doubly-ionised species, with . Although the radiation temperature inferred for the KN ejecta at days is K, fast electrons produced by radioactive decay may be capable of dominating ionisation above the photosphere [66]. This effect can increase the dominant ionisation stage from neutral, up to doubly-ionised. We therefore include data for all three of these ion stages (i–iii), although a quantitative investigation – including both non-thermal and non-local thermal equilibrium effects – is necessary to determine the exact ionisation balance for the ejecta at this phase.
With this level information, we perform a rudimentary set of calculations, whereby we compute the energy differences between all levels. This returns a list of all transitions that are theoretically possible, between all known levels in the NIST ASD. Since we are interested in forbidden M1 and E2 transitions, we apply their transition rules to subsequently filter our line lists. We apply the LS-coupling rules (where applicable), and discard any transitions that have an upper level with an energy greater than the ionisation threshold of the species under investigation. We perform a crude estimate for the relative strengths of the transitions of each ion (as in [24]), and discard any negligibly weak transitions from our comparisons to the data (i.e., those with strengths that of the strongest line within m). We apply an upper level energy cut at eV, and discard any lines that originate from upper levels that exceed this (since we do not expect these levels to be significantly populated in a K plasma). Finally, we compare the line locations and strengths with the observed spectrum, and determine if there is agreement between any of the strong transitions of each ion and the observed emission feature locations, adopting a tolerance corresponding to a Doppler shift.
We note that the level information contained within the NIST ASD has been critically evaluated, and so our compiled line list contains transition wavelengths that are accurate enough for line identification studies.
Currently available atomic line lists either: (i) contain complete line lists with estimates for intrinsic line strength, but have not been calibrated, and so the wavelengths are not accurate enough for line identification studies, or (ii) contain calibrated (and therefore accurate) transitions, but are significantly incomplete, particularly for heavy elements and for long wavelengths (which we are most interested in here). Both of these factors impact any detailed line identification study. Therefore, despite the simplicity of our generated line lists, they represent the current best method to capture transition information for many of the heavy -process elements (with some exceptions, see e.g., the Ce iii and Th iii analysis below). As shown by [24], this framework is able to recover the results of other line identification studies for AT 2017gfo, motivating the validity of this approach.
We use this line list to search for ions that are expected to produce prominent emission only in the regions of the observed emission features ( and 4.4 m). We present our shortlist of possible transitions in Extended Data Table 4, and the locations of the most promising of these are marked in Figure 2. We rule out ions if there is no good agreement with the observed emission features. We also rule out any ions that match an emission feature, but possess other prominent transitions that are discrepant with the observed spectrum. Our analysis favours ions that have only a small number of strong transitions within our observable wavelength range, most (or all) of which match the feature locations of the observed data. Also, due to the low temperature invoked ( K), our analysis heavily favours transitions between the lowest-lying energy levels.
4.1.2 Results and discussion
We find agreement with the observed data for a number of ions, including [Ag iii], [Sn ii], [Te i], [Te iii], [Ba i], [Ba ii], [Er i], [Er ii], [Er iii], [Hf i], [W iii], [Ir ii] and [Pt ii] for the m feature (or the 2.05, 2.28 m features). For the m emission feature, we shortlist [In i], [Te ii], [Ba i], [Nd i], [Nd iii], [Hf i], [W iii] and [Ac i]. These shortlists contain ions from all three -process peaks, as well as some lanthanides, and an actinide. Further study of these species, with the aim of generating intrinsic line strengths for their transitions, are necessary to confirm the contribution of any of these transitions to the data. However, we can still reflect upon the validity of these shortlisted transitions based on other works in the literature.
Ref. [76] present an analysis of doubly-ionised tellurium forbidden emission. They demonstrate that the transition between two terms in the ground configuration of Te iii gives rise to a transition at 2.10 m that may be responsible for the emission feature at m in AT 2017gfo (see Extended Data Figure 2; [24, 76]). This [Te iii] transition is the same line we shortlist here (see Figure 2, Extended Data Table 4), and is also the line that [20] favour as the source of the emission feature at m in their analysis of GRB 230307A. The presence of this line is supported not only by its intrinsic strength, but also by nucleosynthetic arguments. As discussed in [24], Te lies at the top of the second -process abundance peak, and so it is expected to be produced in a wide array of -process scenarios.
In addition to the coincidence with this [Te iii] transition and the m emission feature, we note the agreement with the strongest lines of the other ions of Te. Neutral Te possesses two transitions that are also coincident with this m emission feature, while singly-ionised Te possesses a strong transition in agreement with the location of the other inferred emission peak, at m (see Extended Data Table 4). The agreement between the strongest forbidden transitions of the lowest three ion stages of Te and the two observed emission peaks in the observed data warrants further study. A quantitative investigation of the ionisation balance of the ejecta at this phase is needed to determine the dominant ion (or ions). Some scenario where singly- and doubly-ionised Te are both present would (at least based on our rudimentary analysis here) be capable of explaining both prominent emission features in the JWST observations at days.
Ref. [77] have previously investigated singly-ionised tin (Sn ii), and concluded that the 2.3521 m M1 line (see Extended Data Table 4) is expected to be the most prominent of all [Sn ii] transitions across a range of plausible KN ejecta conditions. Although their calculations focussed on hotter temperatures ( K) than exhibited by GRB 230307A, this M1 transition remains prominent across all temperatures, since it arises from a transition between two levels in the ground term. This implies that if singly-ionised tin is present in the ejecta of GRB 230307A, its most prominent observational signature would be a late-time emission feature centred at 2.3521 m. Tin is another second -process peak element that is expected to be abundant across a range of -process scenarios [38]. Therefore, it seems reasonable to expect to see evidence of it in the observations, especially if we can constrain the presence of other second -process peak elements (e.g., Te).
Ref. [34] present detailed analysis of the presence of platinum and gold, from neutral to doubly-ionised (Pt i–iii, Au i–iii), in the context of kilonova ejecta. They utilise a complete atomic data set that has been calibrated to experiment, meaning they have access to a complete line list, which possesses accurate line wavelengths, in addition to estimates for the intrinsic line strengths. Crucially, this dataset possesses information for both strong permitted transitions (i.e., electric dipole, or E1, transitions) and intrinsically weak forbidden transitions (M1 and E2). In their analysis, they investigate a range of plausible late-time kilonova ejecta conditions, and in addition to comparing to the spectra of AT 2017gfo, they make a number of predictions for the presence of prominent lines that may appear in the spectra of future observations of kilonovae. Specifically, they propose that the [Pt ii] 2.1883 m M1 line we shortlist here (see Extended Data Table 4) is the second most prominent forbidden transition expected to be produced by [Pt ii] across all wavelengths (the 1.1877 m line is expected to be stronger, but it lies in the wavelength range dominated by afterglow emission, and so might not be visible in our JWST spectrum).
Ref. [34] also predict the presence of a strong [Au ii] M1 transition, with m. This is expected to be the strongest [Au ii] transition above 1 m, yet it is not detected in the JWST spectra. While Pt and Au are expected to be co-produced (since they lie at the top of the third -process abundance peak), Au is expected to be less abundant than Pt (by a factor of a few; [34]), due to Au being an odd- element. Therefore, it seems plausible that Pt may have an observable impact on the observed spectrum at 2.1883 m, without Au also having an observable effect (at 3.8446 m).
Alternatively, the feature at m may not possess any contribution from Pt emission, and may simply represent coincident agreement. With only a single transition matched to the data, it is impossible to definitively link the emission to [Pt ii]. This point applies not only to [Pt ii], but to all shortlisted transitions we present in Extended Data Table 4. Of our shortlisted species, the ones that are most convincing (and are of most interest) are those that match multiple features, or possess matches to the data across multiple ions.
[Ba i], [Hf i] and [W iii] possess multiple strong lines in agreement with the data. Similar to the Te case, elements that can reproduce the data with multiple ions are of interest, since positive identification of these would enable some inferences about the ionisation of the ejecta material to be made. Nd i & iii both possess transitions capable of producing the m emission feature, while Er i, ii & iii all possess strong transitions that match the data at m.
Complete and accurate atomic data is sorely lacking for heavy ions, and for NIR–MIR wavelengths. Further work to improve the available atomic data is of utmost importance to interpret future JWST observations of kilonovae. We propose the species presented in Extended Data Table 4 are those capable of producing the observed emission features of GRB 230307A. We conclude that these species (with particular emphasis on the ones discussed above) are the ones that most pertinently need improved atomic data, to further investigate their contribution to the observed emission of GRB 230307A.
4.2 Absorption features
We explore elemental species that can reproduce the absorption features at and 4.0 m. Candidate species for strong absorption features in the spectra of the kilonova AT 2017gfo include He, Sr, La and Ce [7, 78, 43, 38, 79, 80]. These elements all have small numbers of valence electrons, and thus, each transition tends to be strong [43]. Also, lanthanides and actinides tend to have transitions at infrared wavelengths, due to small energy level spacings [81, 82, 83, 84]. Because of these atomic properties, we focus on lanthanides and actinides with a small number of valence electrons as candidate elements for the absorption features in the day JWST spectrum.
A large part of kilonova ejecta is optically thin at this epoch, and fast electrons produced by radioactive decay may dominate ionisation above the photosphere. In such conditions, typical ions of lanthanides and actinides are expected to be singly- or doubly-ionised [66]. Therefore, singly- or doubly-ionised lanthanides or actinides with a small number of valence electrons can be good candidates for strong absorption features. Although atomic data of such heavy elements are not complete, in particular at infrared wavelengths, accurate atomic data has been constructed for Ce iii and Th iii [43]. Thus, here we explore the wavelengths and strengths of Ce iii and Th iii lines by extending the line list of [43], up to 5 m.
Figure 2 shows the positions of the strongest Ce iii and Th iii lines, blueshifted by , and compared with the continuum-subtracted day JWST spectrum. We only show the lines that we expect to be strong; i.e., those with and originating from low-lying levels ( cm-1), that produce a large Sobolev optical depth. For the evaluation of the Sobolev optical depth, we adopt the abundance patterns to match with the -process residuals of the solar abundances at (‘Solar’ model in [78]). For the ionisation, we do not take non-thermal ionisation into account, but instead solve the Saha equation for a density, g , as used for the opacity study, and a temperature of K, which is typical for kilonova nebular ejecta [66].
We find that the absorption feature at m can be matched with a strong Ce iii line, but this requires a velocity, , lower than the inferred photospheric velocity. Interestingly, we also expect strong absorption features around m, as proposed for the NIR feature of AT 2017gfo [43, 85, 24]. However, the signal-to-noise ratio around this wavelength range is not as good as at the longer wavelengths, and so no definitive statement as to the presence (or absence) of this feature can be made.
The absorption feature around m may be matched with a Th iii line (see Figure 2). If this feature is attributed to Th iii, we also expect to see several other absorption features at shorter wavelengths, which are not clearly visible in the JWST spectrum. Therefore, the positive identification of Th iii is not very robust.
Although neither Ce iii or Th iii are capable of convincingly reproducing the data, the general trend of many strong transitions spanning the NIR and MIR are typical of the lanthanide and actinide elements. With more complete line information, future studies of this (and other) kilonova events will be able to better interpret the transformative observations of the NIR and MIR, only possible through the use of JWST.
Author contribution statements
JHG initiated and led the project, reduced all spectral observations, identified the presence of the spectral features in the and day JWST spectra, led the spectral analysis of the distance constraint, performed the combined afterglow and blackbody fitting, led the investigation of the emission features in the JWST data, led the writing and editing of the manuscript, and produced Figures 1 and 2, and Extended Data Figures 1, 2, 3 and 7.
ET helped lead the project, assisted with the interpretation of all analyses, and contributed significantly to the writing and editing of the manuscript.
CLF led the analysis and discussion of the WD–NS/BH merger scenario, led the investigation of the opacities, made Figure 3 and Extended Data Figure 8, and contributed significantly to the writing of the manuscript.
MR led the M19 and LANL kilonova modelling and associated parameter inference, made Extended Data Figures 4, 5 and 6, and contributed significantly to the writing and editing of the manuscript.
BO assisted with data reduction, interpretation of the evolution of GRB 230307A, and contributed significantly to the editing of the manuscript.
CJF assisted with the opacity analysis and discussion.
Y-HY assisted with the empirical afterglow and blackbody fitting.
ND, SR, and MT led the investigation of the absorption features in the JWST data, assisted with the interpretation of the emission features, and helped make Figure 2.
ODF assisted with the detailed extraction of the JWST spectra.
SD assisted with data reduction and interpretation of the evolution of GRB 230307A.
All authors contributed to the writing and editing of the manuscript.
Acknowledgments
We thank Kathleen Labrie for useful discussions on Gemini data and DRAGONS, and Peter Hoeflich for his comments on the spectral features.
This work was supported by the European Research Council through the Consolidator grant BHianca (grant agreement ID 101002761).
This work was in part carried out at the Aspen Center for Physics, which is supported by National Science Foundation grant PHY-2210452.
Data Availability
All data presented in this manuscript are available upon reasonable request to the corresponding author.
References
- \bibcommenthead
- [1] Metzger, B. D. Kilonovae. Living Reviews in Relativity 23, 1 (2019).
- [2] Cowan, J. J. et al. Origin of the heaviest elements: The rapid neutron-capture process. Reviews of Modern Physics 93, 015002 (2021).
- [3] Troja, E. Eighteen Years of Kilonova Discoveries with Swift. Universe 9, 245 (2023).
- [4] Abbott, B. P. et al. Multi-messenger Observations of a Binary Neutron Star Merger. ApJ 848, L12 (2017).
- [5] Pian, E. et al. Spectroscopic identification of r-process nucleosynthesis in a double neutron-star merger. Nature 551, 67–70 (2017).
- [6] Smartt, S. J. et al. A kilonova as the electromagnetic counterpart to a gravitational-wave source. Nature 551, 75–79 (2017).
- [7] Watson, D. et al. Identification of strontium in the merger of two neutron stars. Nature 574, 497–500 (2019).
- [8] Wu, M.-R., Barnes, J., Martínez-Pinedo, G. & Metzger, B. D. Fingerprints of Heavy-Element Nucleosynthesis in the Late-Time Lightcurves of Kilonovae. Physical Review Letters 122, 062701 (2019).
- [9] Kasliwal, M. M. et al. Spitzer mid-infrared detections of neutron star merger GW170817 suggests synthesis of the heaviest elements. MNRAS 510, L7–L12 (2022).
- [10] Fermi GBM Team. GRB 230307A: Fermi GBM Final Real-time Localization. GRB Coordinates Network 33405, 1 (2023).
- [11] Dalessi, S. & Fermi GBM Team. GRB 230307A: Fermi GBM detection of a very bright GRB. GRB Coordinates Network 33407, 1 (2023).
- [12] Dalessi, S., Roberts, O. J., Meegan, C. & Fermi GBM Team. GRB 230307A: Fermi GBM Observation of a very bright burst. GRB Coordinates Network 33411, 1 (2023).
- [13] Evans, P. A. & Swift Team. GRB 230307A: Tiled Swift observations. GRB Coordinates Network 33419, 1 (2023).
- [14] Burrows, D. N. et al. GRB 230307A: Swift-XRT observations. GRB Coordinates Network 33429, 1 (2023).
- [15] Costa, E. et al. Discovery of an X-ray afterglow associated with the -ray burst of 28 February 1997. Nature 387, 783–785 (1997).
- [16] Mészáros, P. & Rees, M. J. Optical and Long-Wavelength Afterglow from Gamma-Ray Bursts. ApJ 476, 232–237 (1997).
- [17] Wijers, R. A. M. J., Rees, M. J. & Meszaros, P. Shocked by GRB 970228: the afterglow of a cosmological fireball. MNRAS 288, L51–L56 (1997).
- [18] Yang, Y.-H. et al. A lanthanide-rich kilonova in the aftermath of a long gamma-ray burst. Submitted (2023).
- [19] Selsing, J. et al. The X-shooter GRB afterglow legacy sample (XS-GRB). A&A 623, A92 (2019).
- [20] Levan, A. et al. JWST detection of heavy neutron capture elements in a compact object merger. arXiv e-prints arXiv:2307.02098 (2023).
- [21] Sun, H. et al. Magnetar emergence in a peculiar gamma-ray burst from a compact star merger. arXiv e-prints arXiv:2307.05689 (2023).
- [22] Freedman, W. L. et al. The Carnegie-Chicago Hubble Program. VIII. An Independent Determination of the Hubble Constant Based on the Tip of the Red Giant Branch. ApJ 882, 34 (2019).
- [23] Planck Collaboration et al. Planck 2018 results. VI. Cosmological parameters. A&A 641, A6 (2020).
- [24] Gillanders, J. H., Sim, S. A., Smartt, S. J., Goriely, S. & Bauswein, A. Modelling the spectra of the kilonova AT2017gfo – II: Beyond the photospheric epochs. arXiv e-prints arXiv:2306.15055 (2023).
- [25] Taddia, F. et al. Analysis of broad-lined Type Ic supernovae from the (intermediate) Palomar Transient Factory. A&A 621, A71 (2019).
- [26] Drout, M. R. et al. Light curves of the neutron star merger GW170817/SSS17a: Implications for r-process nucleosynthesis. Science 358, 1570–1574 (2017).
- [27] Patat, F. et al. The Metamorphosis of SN 1998bw. ApJ 555, 900–917 (2001).
- [28] Gagliano, A. et al. An Early-time Optical and Ultraviolet Excess in the Type-Ic SN 2020oi. ApJ 924, 55 (2022).
- [29] Yaron, O. & Gal-Yam, A. WISeREP—An Interactive Supernova Data Repository. PASP 124, 668 (2012).
- [30] Gillanders, J. H., Sim, S. A. & Smartt, S. J. AT2018kzr: the merger of an oxygen-neon white dwarf and a neutron star or black hole. MNRAS 497, 246–262 (2020).
- [31] Yang, J. et al. A long-duration gamma-ray burst with a peculiar origin. Nature 612, 232–235 (2022).
- [32] Li, L.-X. & Paczyński, B. Transient Events from Neutron Star Mergers. ApJ 507, L59–L62 (1998).
- [33] Korobkin, O. et al. Axisymmetric Radiative Transfer Models of Kilonovae. ApJ 910, 116 (2021).
- [34] Gillanders, J. H., McCann, M., Sim, S. A., Smartt, S. J. & Ballance, C. P. Constraints on the presence of platinum and gold in the spectra of the kilonova AT2017gfo. MNRAS 506, 3560–3577 (2021).
- [35] Waxman, E., Ofek, E. O., Kushnir, D. & Gal-Yam, A. Constraints on the ejecta of the GW170817 neutron star merger from its electromagnetic emission. MNRAS 481, 3423–3441 (2018).
- [36] Wollaeger, R. T. et al. Impact of ejecta morphology and composition on the electromagnetic signatures of neutron star mergers. MNRAS 478, 3298–3334 (2018).
- [37] Ristic, M. et al. Interpolating detailed simulations of kilonovae: Adaptive learning and parameter inference applications. Physical Review Research 4, 013046 (2022).
- [38] Gillanders, J. H., Smartt, S. J., Sim, S. A., Bauswein, A. & Goriely, S. Modelling the spectra of the kilonova AT2017gfo – I. The photospheric epochs. MNRAS 515, 631–651 (2022).
- [39] Goriely, S., Bauswein, A. & Janka, H.-T. r-process Nucleosynthesis in Dynamically Ejected Matter of Neutron Star Mergers. ApJ 738, L32 (2011).
- [40] Goriely, S. et al. New Fission Fragment Distributions and r-Process Origin of the Rare-Earth Elements. Phys. Rev. Lett. 111, 242502 (2013).
- [41] Goriely, S., Bauswein, A., Just, O., Pllumbi, E. & Janka, H. T. Impact of weak interactions of free nucleons on the r-process in dynamical ejecta from neutron star mergers. MNRAS 452, 3894–3904 (2015).
- [42] Bauswein, A., Goriely, S. & Janka, H. T. Systematics of Dynamical Mass Ejection, Nucleosynthesis, and Radioactively Powered Electromagnetic Signals from Neutron-star Mergers. ApJ 773, 78 (2013).
- [43] Domoto, N. et al. Lanthanide Features in Near-infrared Spectra of Kilonovae. ApJ 939, 8 (2022).
- [44] Kaltenborn, M. A. et al. Abundances and Transients from Neutron Star-White Dwarf Mergers. arXiv e-prints arXiv:2209.13061 (2022).
- [45] Tinyanont, S. et al. Supernova 2020wnt: An Atypical Superluminous Supernova with a Hidden Central Engine. ApJ 951, 34 (2023).
- [46] Troja, E. et al. A nearby long gamma-ray burst from a merger of compact objects. Nature 612, 228–231 (2022).
- [47] Schlafly, E. F. & Finkbeiner, D. P. Measuring Reddening with Sloan Digital Sky Survey Stellar Spectra and Recalibrating SFD. ApJ 737, 103 (2011).
- [48] Tanvir, N. R., Cucchiara, A. & Cenko, S. B. GRB 130408A – Gemini-S/GMOS redshift determination. GRB Coordinates Network 14366, 1 (2013).
- [49] Labrie, K., Anderson, K., Cárdenes, R., Simpson, C. & Turner, J. E. H. Teuben, P. J., Pound, M. W., Thomas, B. A. & Warner, E. M. (eds) DRAGONS - Data Reduction for Astronomy from Gemini Observatory North and South. (eds Teuben, P. J., Pound, M. W., Thomas, B. A. & Warner, E. M.) Astronomical Data Analysis Software and Systems XXVII, Vol. 523 of Astronomical Society of the Pacific Conference Series, 321 (2019).
- [50] Labrie, K. et al. Dragons (2022). URL https://doi.org/10.5281/zenodo.7308726.
- [51] Sudilovsky, V., Nicuesa Guelbenzu, A. & Greiner, J. GRB 130408A: GROND detection of the afterglow. GRB Coordinates Network 14364, 1 (2013).
- [52] Wollaeger, R. & van Rossum, D. SUPERNU: Radiative transfer code for explosive outflows using Monte Carlo methods. Astrophysics Source Code Library, record ascl:2103.019 (2021). 2103.019.
- [53] Evans, P. A. et al. Swift and NuSTAR observations of GW170817: Detection of a blue kilonova. Science 358, 1565–1570 (2017).
- [54] Troja, E. et al. The X-ray counterpart to the gravitational-wave event GW170817. Nature 551, 71–74 (2017).
- [55] Ristic, M. et al. Interpolated kilonova spectra models: necessity for a phenomenological, blue component in the fitting of AT 2017gfo spectra. arXiv e-prints arXiv:2304.06699 (2023).
- [56] Kedia, A. et al. Surrogate light curve models for kilonovae with comprehensive wind ejecta outflows and parameter estimation for AT2017gfo. Physical Review Research 5, 013168 (2023).
- [57] Wollaeger, R. T. et al. A Broad Grid of 2D Kilonova Emission Models. ApJ 918, 10 (2021).
- [58] Korobkin, O., Rosswog, S., Arcones, A. & Winteler, C. On the astrophysical robustness of the neutron star merger r-process. MNRAS 426, 1940–1949 (2012).
- [59] Barnes, J., Kasen, D., Wu, M.-R. & Martínez-Pinedo, G. Radioactivity and Thermalization in the Ejecta of Compact Object Mergers and Their Impact on Kilonova Light Curves. ApJ 829, 110 (2016).
- [60] Fryer, C. L., Woosley, S. E., Herant, M. & Davies, M. B. Merging White Dwarf/Black Hole Binaries and Gamma-Ray Bursts. ApJ 520, 650–660 (1999).
- [61] Zhong, S.-Q., Li, L. & Dai, Z.-G. GRB 211211A: A Neutron Star-White Dwarf Merger? ApJ 947, L21 (2023).
- [62] Bobrick, A., Zenati, Y., Perets, H. B., Davies, M. B. & Church, R. Transients from ONe white dwarf - neutron star/black hole mergers. MNRAS 510, 3758–3777 (2022).
- [63] Tinyanont, S. et al. Supernova 2017eaw: Molecule and Dust Formation from Infrared Observations. ApJ 873, 127 (2019).
- [64] Rho, J. et al. Near-infrared Spectroscopy of Supernova 2017eaw in 2017: Carbon Monoxide and Dust Formation in a Type II-P Supernova. ApJ 864, L20 (2018).
- [65] Olsen, K. et al. NIST-LANL Lanthanide Opacity Database (version 1.2), [Online]. Available: https://nlte.nist.gov/OPAC. National Institute of Standards and Technology, Gaithersburg, MD 20899. (2022).
- [66] Hotokezaka, K., Tanaka, M., Kato, D. & Gaigalas, G. Nebular emission from lanthanide-rich ejecta of neutron star merger. MNRAS 506, 5863–5877 (2021).
- [67] Kramida, A., Ralchenko, Y., Reader, J. & NIST ASD Team. NIST Atomic Spectra Database (version 5.10), [Online]. Available: https://physics.nist.gov/asd. National Institute of Standards and Technology, Gaithersburg, MD. (2022).
- [68] Prochaska, J. et al. PypeIt: The Python Spectroscopic Data Reduction Pipeline. The Journal of Open Source Software 5, 2308 (2020).
- [69] Prochaska, J. X. et al. pypeit/pypeit: Version 1.12.2 (2023). URL https://doi.org/10.5281/zenodo.7779402.
- [70] Jakobsen, P. et al. The Near-Infrared Spectrograph (NIRSpec) on the James Webb Space Telescope. I. Overview of the instrument and its capabilities. A&A 661, A80 (2022).
- [71] Rieke, M. J. et al. Performance of NIRCam on JWST in Flight. PASP 135, 028001 (2023).
- [72] Bushouse, H. et al. JWST calibration pipeline (2023). URL https://doi.org/10.5281/zenodo.7829329.
- [73] Developers, J. et al. Jdaviz. Zenodo (2023).
- [74] Pognan, Q., Jerkstrand, A. & Grumer, J. On the validity of steady-state for nebular phase kilonovae. MNRAS 510, 3806–3837 (2022).
- [75] Pognan, Q., Jerkstrand, A. & Grumer, J. NLTE effects on kilonova expansion opacities. MNRAS 513, 5174–5197 (2022).
- [76] Hotokezaka, K., Tanaka, M., Kato, D. & Gaigalas, G. Tellurium emission line in kilonova AT 2017gfo. arXiv e-prints arXiv:2307.00988 (2023).
- [77] Bondarev, A. I., Gillanders, J. H., Cheung, C., Safronova, M. S. & Fritzsche, S. Calculations of multipole transitions in Sn II for kilonova analysis. The European Physical Journal D 77, 126 (2023).
- [78] Domoto, N., Tanaka, M., Wanajo, S. & Kawaguchi, K. Signatures of r-process Elements in Kilonova Spectra. ApJ 913, 26 (2021).
- [79] Perego, A. et al. Production of Very Light Elements and Strontium in the Early Ejecta of Neutron Star Mergers. ApJ 925, 22 (2022).
- [80] Tarumi, Y., Hotokezaka, K., Domoto, N. & Tanaka, M. Non-LTE analysis for Helium and Strontium lines in the kilonova AT2017gfo. arXiv e-prints arXiv:2302.13061 (2023).
- [81] Kasen, D., Badnell, N. R. & Barnes, J. Opacities and Spectra of the r-process Ejecta from Neutron Star Mergers. ApJ 774, 25 (2013).
- [82] Fontes, C. J., Fryer, C. L., Hungerford, A. L., Wollaeger, R. T. & Korobkin, O. A line-binned treatment of opacities for the spectra and light curves from neutron star mergers. MNRAS 493, 4143–4171 (2020).
- [83] Tanaka, M., Kato, D., Gaigalas, G. & Kawaguchi, K. Systematic opacity calculations for kilonovae. MNRAS 496, 1369–1392 (2020).
- [84] Fontes, C. J., Fryer, C. L., Wollaeger, R. T., Mumpower, M. R. & Sprouse, T. M. Actinide opacities for modelling the spectra and light curves of kilonovae. MNRAS 519, 2862–2878 (2023).
- [85] Tanaka, M. et al. Cerium features in kilonova near-infrared spectra: implication from a chemically peculiar star. arXiv e-prints arXiv:2306.04697 (2023).