Comprehensive X-ray and Multi-wavelength Study of ULXs in NGC 1566
Abstract
This paper presents a comprehensive X-ray and multi-wavelength study of ultraluminous X-ray sources (ULXs) in NGC 1566 using archival Chandra, Swift/XRT, James Webb Space Telescope, JWST, and Hubble Space Telescope, HST observations. The main results are, first, from the hardness ratio diagram, where spectral state transitions from hard to soft as seen in typical Galactic high mass X-ray binaries for ULX-3 was observed. Second, a new transient ULX candidate (ULX-4) was identified, reaching a peak luminosity of 1040 erg s-1. Third, the optical and NIR (near-infrared) counterparts of the ULXs were searched from the precise astrometric calculations. For ULX-1 and ULX-2, evidence was found that the observed NIR emission is due to the circumbinary disk/dust disrupted by X-rays. Fourth, the optical observations suggest that the possible donor star of ULX-3 is a B-type supergiant. In the case of ULX-4, the multi-wavelength properties are not clear since many sources are detected within the astrometric error radius.
keywords:
space vehicles: instruments – circumstellar matter – stars: general – galaxies: individual: NGC 1566 – X-rays: binaries – X-rays: individual: ULXs in NGC 1566.1 Introduction
Ultraluminous X-ray sources (ULXs) are a sub-class of X-ray binaries (XRBs) with an isotropic X-ray luminosity (LX 1039 erg s-1)exceeding the Eddington limit of a 10 M black hole (BH). Almost a consensus has been reached that ULXs are thought to be powered by supercritical accretion onto neutron stars or stellar mass black holes (sMBHs) (see review by Kaaret et al., 2017; Fabrika et al., 2021; King et al., 2023 and Pinto & Walton, 2023). On the other hand, many studies suggested the existence of intermediate-mass black holes (IMBHs, 102- 105 M) accreting at sub-Eddington rates for the compact object nature of ULX systems (Roberts, 2007; Sutton et al., 2012; Caballero-García et al., 2013; Pasham & Strohmayer, 2013). Alternatively, geometric beaming and/or accretion at super-Eddington rates on stellar mass compact objects can explain the observed properties of ULXs (Roberts, 2007; King, 2009; Middleton et al., 2015; Walton et al., 2018).
Temporal variability is a crucial aspect observed for ULXs and accretion-powered sources. The variability properties of the many Galactic XRBs and ULXs have unveiled quasi-periodic oscillations (Agrawal & Nandi, 2015), and coherent pulsations (e.g., Bachetti et al., 2014; Carpano et al., 2018; Rodríguez Castillo et al., 2020) that can provide insights into the nature of the compact object. Moreover, some study of the long-term variability of ULXs has shown orbital or super-orbital variations (e.g., Brightman et al., 2019). Thanks to Neil Gehrels Swift Observatory X-ray Telescope (hereafter Swift/XRT) it is possible to obtain long and regularly sampled light curves of ULXs (La Parola et al., 2015; Song et al., 2020; Brightman et al., 2022; Allak et al., 2022a). Therefore, comparing the variability properties of Galactic XRBs, which are well-known, with ULXs gives us the chance to place strong constraints on compact objects. Moreover, the discovery of a cyclotron resonance scattering feature (CRSF), which is directly related to the measurement of the magnetic field, in the X-ray spectrum of ULXs indicates the presence of a neutron star (NS) candidate (Brightman et al., 2018; Kong et al., 2022).
Studying Galactic XRBs enhances our understanding of the characteristics of the donor star of ULXs, the mass of the compact object, the existence of focused outflows known as jets, and the surrounding environment (Pinto & Walton, 2023). The observed optical emission in ULXs can originate from the accretion disk, the donor star, or a combination of both (Tao et al., 2011; Allak et al., 2022b; Allak, 2022). In the many studies ( e.g., Soria et al., 2012; Ambrosi & Zampieri, 2018; Yao & Feng, 2019; Sutton et al., 2014), focusing on optical variability, multi-band colors, and SED modeling, strongly suggest that the optical emission is likely contaminated or even dominated by reprocessed radiation from an irradiated accretion disk. Additionally, the super-orbital or orbital period (sinusoidal modulations) has been determined for a few optical counterparts in long-term optical light curves (Allak et al., 2022a; Allak, 2022; Liu et al., 2009).
Such as dynamical mass construction, considerable study has been conducted to determine the donor stars of ULXs (Liu et al., 2012). However, this is quite difficult to do for all ULXs because their apparent magnitudes (mV) are usually faint (mV 19 mag). Moreover, they are located in star-forming and crowded fields, therefore, space detectors with good enough spatial resolution are needed. The significant improvement in sensitivity and resolution provided by the JWST may allow us to identify counterparts in such fields with a high degree of confidence. The studies of Allak (2023a, b) showed that even in the HST images, some optical counterparts appear to be uniquely blended sources. Previous studies (e.g., Heida et al. (2014); López et al. (2020)) have claimed that some counterparts of ULXs, bright in the NIR band, might be red supergiants (RSGs). Since ULXs are located in crowded regions of the host galaxies, the past images of many of the point-like and/or bright NIR counterparts are likely unresolved sources in the distant galaxies, therefore, many sources may not be red color enough for them to be an RSG
(Allak, 2023a, b).
Cold astronomical objects that are not detectable by optical detectors can be observed in the infrared (IR) bands. ULXs whose counterparts could not be determined, in other words, no optical source could be determined in the derived astrometric error radii in the past studies, are highly probable to have counterparts in the good enough resolution JWST images. Recently, in some studies, XRBs including ULXs whose optical counterparts cannot be detected have been classified as low-mass X-ray binaries (LMXBs) (Chandar et al., 2020). However, recently published studies (Allak, 2023a, b) have shown evidence of circumbinary disk/dust around ULXs whose optical counterparts could not be determined. These results show that the emission of optical counterparts (possible donor stars) can be obscured by hot dust and/or circumbinary disks around them, which does not imply that they are LMXBs.
This work carries out a comprehensive X-ray and multi-wavelength study of the ULXs in the galaxy NGC 1566 observed with Swift/XRT, Chandra, JWST and HST. The primary goal of this work is to search for and identify possible NIR and optical counterparts of ULXs by deploying all available JWST and HST images. In addition, the X-ray spectral and temporal properties of these ULXs are analyzed in detail, aiming to impose constraints on the nature of the compact objects nature as well as on their X-ray emission. The paper is structured as follows. Section 2 presents the properties of galaxy NGC 1566 as well as the target ULXs, and also it gives details of X-ray, optical, and infrared observations. Details of these observations and data reduction and analysis are presented in Section 3. Section 4 presents results and discussions of the properties of X-ray and multi-wavelength of ULXs. Finally, Section 5 summarizes the main conclusions of this study.
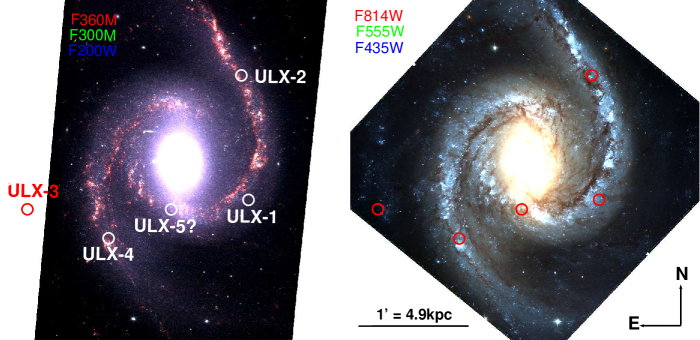
2 Target of ULXs & Observations
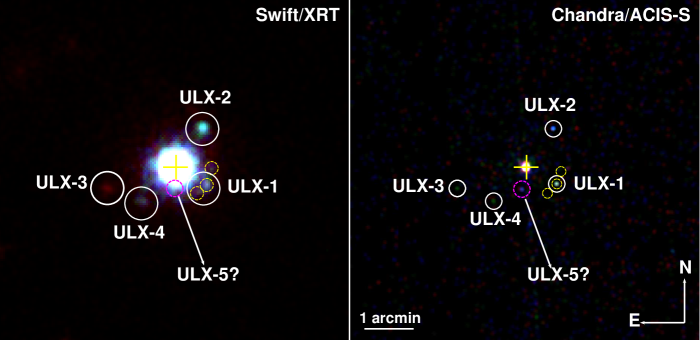
Liu & Bregman (2005) presented several ULX samples in nearby galaxies through observations made with the ROSAT High-Resolution Imager (ROSAT/HRI). Among these samples, they identified three ULXs located in the face-on barred Sbc spiral galaxy NGC 1566. In their study, the X-ray luminosity ranges of these three ULXs were given as LX (1.36-6.5) 1039 erg s-1, and these ULXs showed variability of approximately a factor of 6 in ROSAT/HRI observations based on a distance of 13.4 Mpc. The locations of these sources are shown in Figure 1. As seen in Figure 2, ULX-1 and ULX-2 are located in the thin spiral arms, and ULX-3 is located on the edge of a spiral arm. Furthermore, ULX-3 was not observed in the JSWT observations. The host galaxy NGC 1566 of ULXs is a massive, face-on star-forming (SFR = 4.5 M yr-1) spiral galaxy at a distance of 17.69 Mpc (Mayker Chen et al., 2023 and references therein). This distance is used throughout this study.
The galaxy NGC 1566 was observed on November 22, 2022, by using both the JWST near-infrared camera instrument (NIRCam) and mid-infrared instrument (MIRI) (GO program 2107, PI: J. Lee). The JWST observations include NIRCam imaging by using the F200W, F300M, F335M, and F360M filters and MIRI imaging using the F770W, F1000W, F1130W, and F2100W filters. NGC 1566 was also observed by HST on September 03, 2013, using WFC3/UVIS (The Wide Field Camera 3) (GO program 13364). The HST observations include UVIS imaging by using F275W, F336W, F438W, F555W, and F814W filters. Moreover, NGC 1566 was also observed during 3 ks by Chandra ACIS (Advanced CCD Imaging Spectrometer) in 2006 (Obs ID: 21478), and it was observed many times by Swift/XRT between 2011 and 2022. Additionally, the GAIA DR3111https://www.cosmos.esa.int/web/gaia/data-release-3 source catalog is used for astrometric calculations. The details of observations are given in Table 1.
| Observatory/Instrument | Proposal ID | Date | Exp | Filter | |
|---|---|---|---|---|---|
| (YYYY-MM-DD) | (s) | ||||
| HST/WFC3/UVIS | 13364 | 2013-09-03 | 2382 | F275W | |
| HST/WFC3/UVIS | 13364 | 2013-09-03 | 1119 | F336W | |
| HST/WFC3/UVIS | 13364 | 2013-09-03 | 965 | F438W | |
| HST/WFC3/UVIS | 13364 | 2013-09-03 | 1143 | F555W | |
| HST/WFC3/UVIS | 13364 | 2013-09-03 | 989 | F814W | |
| HST/WFC3/IR | 15133 | 2018-04-06 | 596.9 | F160W | |
| JWST/MIRI | 2107 | 2022-11-22 | 532.8 | F770W | |
| JWST/MIRI | 2107 | 2022-11-22 | 732.6 | F1000W | |
| JWST/MIRI | 2107 | 2022-11-22 | 1864.8 | F1130W | |
| JWST/MIRI | 2107 | 2022-11-22 | 1931.4 | F2100W | |
| JWST/NIRCam | 2107 | 2022-11-22 | 2405.0 | F200W | |
| JWST/NIRCam | 2107 | 2022-11-22 | 773.1 | F300M | |
| JWST/NIRCam | 2107 | 2022-11-22 | 773.1 | F335M | |
| JWST/NIRCam | 2107 | 2022-11-22 | 858.9 | F360M | |
| Target ID | Start time | Na | Expb | ||
| (YYYY-MM-DD YYYY-MM-DD) | (ks) | ||||
| Swift/XRT | 00014916 | 2021-11-11 2022-01-17 | 27 | 55.53 | |
| Swift/XRT | 00014923 | 2021-11-18 2021-11-19 | 2 | 8.67 | |
| Swift/XRT | 00015302 | 2022-08-23 2022-08-26 | 4 | 7.99 | |
| Swift/XRT | 00031742 | 2010-06-23 2020-10-21 | 13 | 15.66 | |
| Swift/XRT | 00033411 | 2014-09-11 2015-07-30 | 28 | 52.10 | |
| Swift/XRT | 00035880 | 2007-12-12 2019-07-31 | 133 | 123.21 | |
| Swift/XRT | 00045604 | 2011-08-25 2020-07-20 | 43 | 44.22 | |
| Swift/XRT | 00088910 | 2019-08-08 2019-08-21 | 3 | 5.55 | |
| Swift/XRT | 03111666 | 2022-06-21 2022-08-19 | 9 | 5.30 | |
| Obs ID | Date | Exp | |||
| (YYYY-MM-DD) | (ks) | ||||
| Chandra/ACIS-S | 21478 | 2018-12-03 | 3.00 | ||
| Notes: a Number of observations b Total exposure time |
3 Data Reduction and Analysis
3.1 Chandra and Swift/XRT
Chandra ACIS-S observation was analyzed by using Chandra Interactive Analysis of Observations (ciao)222https://cxc.cfa.harvard.edu/ciao/ v4.15 software and calibration files caldb v4.10. The level 2 event files were obtained with chandra_repro in ciao. The wavdetect tool in ciao was used for source detection, and eight X-ray sources were identified in Chandra image, including the three ULXs previously identified by Liu & Bregman (2005). The source and the background events were extracted from circular regions of 4 and 8 arcsec radius. The source spectra and light curves were obtained with the tasks specextract and dmextract, respectively. In the case of Chandra spectra, by using the task grppha in HEASOFT v 6.32.1 all spectra were grouped with at least 5 counts per energy bin due to low data quality, and the C-statistic was used for fitting to source spectra, but no acceptable models could be achieved for all ULXs. Therefore, unabsorbed flux values were calculated with a generic spectral shape assuming a power-law photon index of =1.7 (Song et al., 2020) and a Galactic absorption component, NH=0.031022 cm-2 using the srcflux task in ciao.
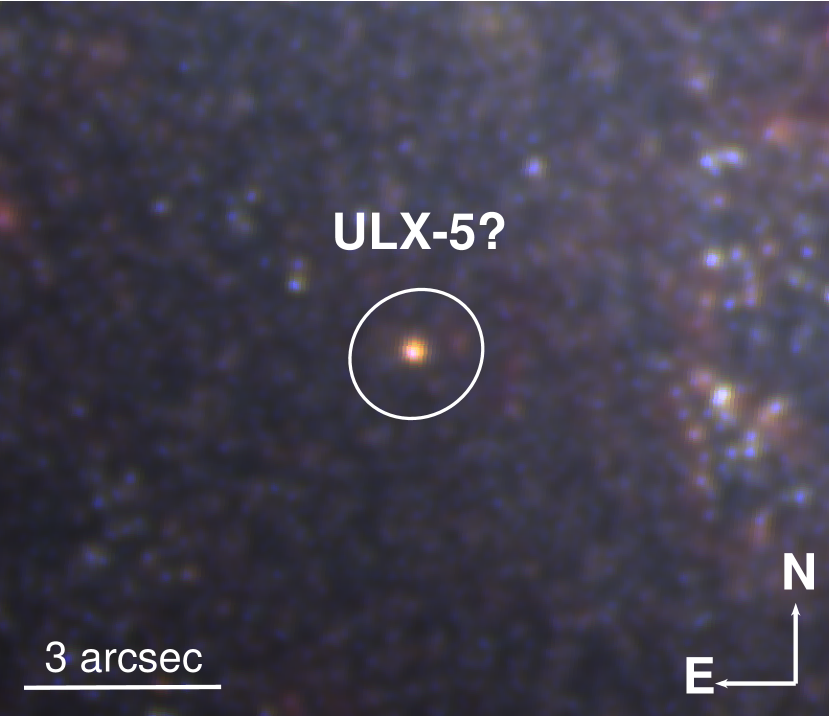
To determine the most accurate positions of the ULXs, a stacked image was created using all available Swift/XRT observations due to the short exposure times and poor data statistics of the single Swift/XRT observations. The XIMAGE was used to source detection for a stacked event file with the signal-to-noise threshold of 3-. Accordingly, three Swift/XRT sources were identified at the ULX-1 position in the Chandra image (see Figure 1). The detail of the X-ray properties of ULX-1 in this study is quite limited because the Swift/XRT detector does not have good enough spatial resolution to analyze these three sources. In addition, the X-ray source (ULX-5?) is very close to the core of the galaxy NGC 1566, detected only in the Chandra image, therefore Swift/XRT analyses could not be performed for this source due to insufficient angular resolution. The Chandra unabsorbed X-ray luminosity of this source was calculated as (3 0.18) 1039 erg s-1 in 0.3-10 keV energy band by using srcflux, hence a name like ULX-5? was chosen. On the other hand, in this study, due to its multi-wavelength properties (for more detail see Section 3.3), ULX-5? was identified as an AGN candidate. Furthermore, a source labeled ULX-4 in this study was found to be at the ULX luminosity level (>1039 erg s-1) using the Swift/XRT observations.
Pipeline-processed event files from the XRT detector were processed using the XSELECT package, as described in the Swift/XRT user manual. Source regions of 30 arcsec were used, with larger accompanying background regions of 50 arcsec, and care was taken to exclude other sources in the source and background regions. Background of galaxy light curves were determined from each event file and checked for background flaring and/or contamination by the core of the galaxy which proved to be a problem in all observations. In other words, the emission of the core of NGC 1566 is fully contaminating all observations of the ULXs. Therefore, in order to avoid both contamination and background flaring, the source regions were reduced until the lowest contamination and flaring were achieved. The result of the best possible source regions was determined to be 18 arcsec, which is the angular resolution of the Swift/XRT detector. For the background regions, source-free regions were selected according to the stacked image.
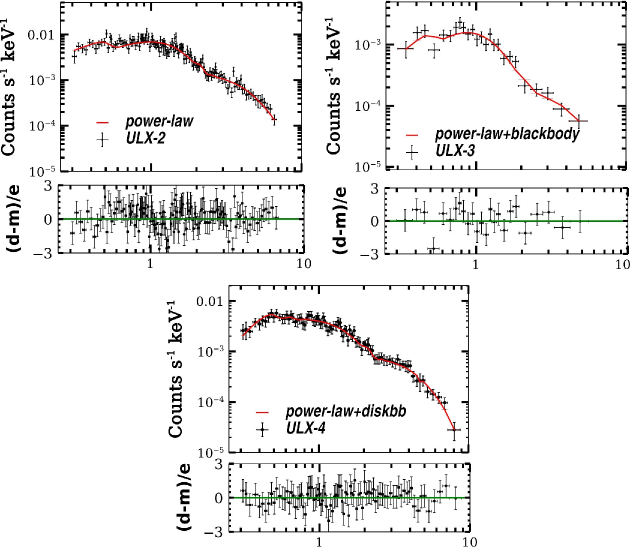
Due to poor data quality, an attempt was made to combine spectra from many observations with similar spectral characteristics, such as hard and soft colors, for fitting purposes, but this attempt was unsuccessful as ULXs could not be detected in each observation. Therefore, time-averaged spectra were obtained for ULX-2, ULX-3, and ULX-4 using all available observations in the 0.3-10 keV energy band. The spectra of the ULXs with the instrument responses and ancillary files were generated for Swift/XRT observations. According to the averaged source counts, the source energy spectra were grouped using the FTOOLS grppha with at least 15 counts per energy bin for Swift/XRT observations. Spectral fits were performed on all available 0.3-10 keV spectral data to determine the best-fitting model for each time-averaged spectrum using xspec v12.13. In all cases a hydrogen column density (NH) component (tbabs) was used. ULX-2 was adequately fitted by power-law (po) and in the case of ULX-3 and ULX-4, the time-averaged spectrum gave better statistics according to the F-test for the power-law+blackbody and power-law+diskbb models, respectively at 3-, along with well-constrained model parameters and statistics. The best-fit results are presented in Table 2 and Figure 3 shows the spectral fits of the ULXs.
| Source | N | Npo | Nbb | Ndiskbb | Tin/kT | F | L | /dof | |
|---|---|---|---|---|---|---|---|---|---|
| (1) | (2) | (3) | (4) | (5) | (6) | (7) | (8) | (9) | |
| ULX-2 | … | … | … | 146.55/132 (1.1) | |||||
| ULX-3 | … | 20.59/20 (1.0) | |||||||
| ULX-4 | … | 74.63/84 (0.9) |
Notes. — Col. (1): Intrinsic X-ray absorption value in units of 10. Col. (2): Normalization parameter of power-law model in units of 10-5. Col. (3): Normalization parameter of blackbody model in units of 10-6. Col. (4): Normalization parameter of diskbb model in units of 10-6. Col. (5): Photon index from the power-law model. Col. (6): Tin is the temperature of the Multi-color disk blackbody (diskbb) in keV (for ULX-4) and kT is the temperature of the blackbody in keV (for ULX-3). Col. (7): Unabsorbed fluxes in units of 10-13 ergs . Col. (8): Unabsorbed luminosities in units of 1039 ergs in the 0.3–10 keV energy band, adopting a distance of 17.69 Mpc. Col. (9): The reduced is given in parentheses. All errors are at the confidence range of 2.706.
3.1.1 Long-term Variability
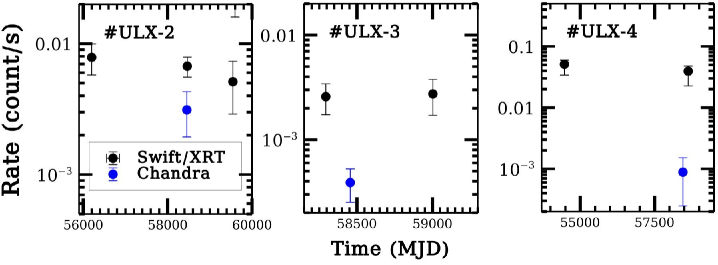
The count rates for Swift/XRT in PC (Photon-counting) mode were extracted using automated procedures specified on the web page333https://www.swift.ac.uk/user_objects/ in the 0.3-10 keV energy band, taking into account the positions determined from the combined event file. Due to the angular resolution of Swift/XRT (18 arcsec) and the angular separation between the ULXs and the core of NGC 1566 (> 60 arcsec), the source regions had to be chosen carefully to avoid contamination. Since this automated procedure generally uses regions with large radii when calculating the count rates of the sources, the previously detected variable background flaring was predominantly detected for each source. Therefore, contamination was limited (as much as possible) by choosing a search radius of 18 arcsec using the centroid function, and the binning method was chosen as one bin per observation. However, out of 262 observations, the background subtracted source count rates of ULX-2 were detected in only three observations, while ULX-3 and ULX-4 were detected only in two observations. Due to fact that the majority of single Swift/XRT observations have short exposure times, the upper limits (3-) of non-detection were not calculated. There are insufficient high-quality data sets available to place certain constraints on the long-term characteristics of ULXs, but by examining the observations where ULXs are detected, clues for the long-term variabilities may be found. Therefore, according to the Swift/XRT, the Chandra count rates were normalized with Chandra PIMMS444https://cxc.harvard.edu/toolkit/pimms.jsp by using a power-law photon index of =1.7 and a Galactic absorption component, NH=0.031022 cm-2. The long-term light curves of ULX-2, ULX-3, and ULX-4 are plotted in Figure 4.
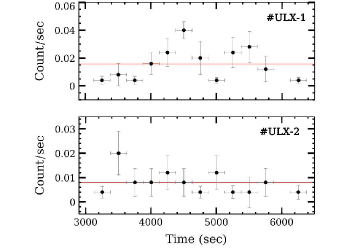
To quantify the variability factors (FV), the ratios of maximum to minimum count rates (Fmax/Fmin) were derived. Where Fmax and Fmin are the maximum and minimum count rates. Considering the variability factors, no significant variability was observed in the Swift/XRT observations, whereas when the Chandra and Swift/XRT observations were compared, the variability factors were derived as 7 2 and 60 11 for ULX-3 and ULX-4, respectively. In the case of ULX-2, no significant variation could be found (2 1). Finally, the short-term count rate variability was also searched for all ULXs using Chandra data (3 ks). For this, the light curve of the ULXs was binned over intervals of 100 s and 250 s in the 0.310 keV energy band using the ciao tool dmextract. A barycenter correction was applied to the data before the timing analysis using the ciao tool axbary. The short light curves of ULX-1 and ULX-2 are shown in Figure 5. FV for the short-time light curves were derived as 10 4 and 5 3, respectively. The light curves for ULX-3 and ULX-4 are not plotted due to the low data statistics.
3.2 Optical and Near-infrared data
3.2.1 Source Detection & Photometry
To identify the positions and aperture photometry of the sources, the steps described in Allak (2023a) (and references therein) were followed. Sources were detected using 3- threshold detection. Vega magnitudes were obtained from aperture photometry using a circular aperture with a radius of 3 pixels, and the background was subtracted from an annulus nine pixels from the source center. For all drizzled HST/WFC3 images, point-like sources were detected with the daofind task, and aperture photometry for these sources was performed using the DAOPHOT package (Stetson, 1987) in the iraf555https://iraf-community.github.io/ (Image Reduction and Analysis Facility). In the case of JWST observations, 3 pixels of aperture radius were selected for the aperture photometry and nine pixels for the background (for more details see Allak, 2023a) using photutils v1.8666https://photutils.readthedocs.io/en/stable/index.html#.
3.3 Determination of Counterparts
To determine both the IR and optical counterparts of the ULXs precise astrometry was performed by following the works of Allak et al. (2022b) and Allak (2023a). Since no matching sources were identified from the GAIA/DR3 source catalog with the XRB or XRB candidates, the reference sources were searched by comparing Chandra X-ray image with NIRCam observations.
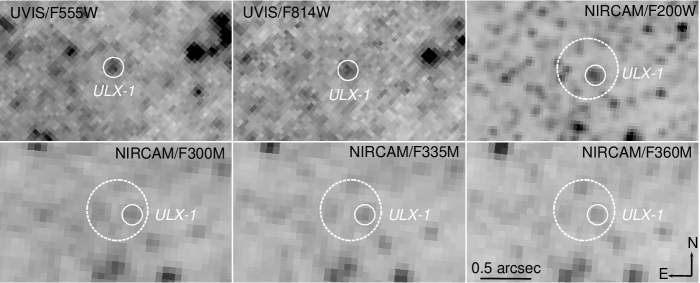
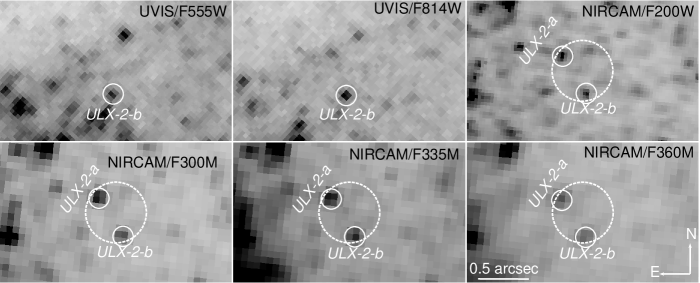
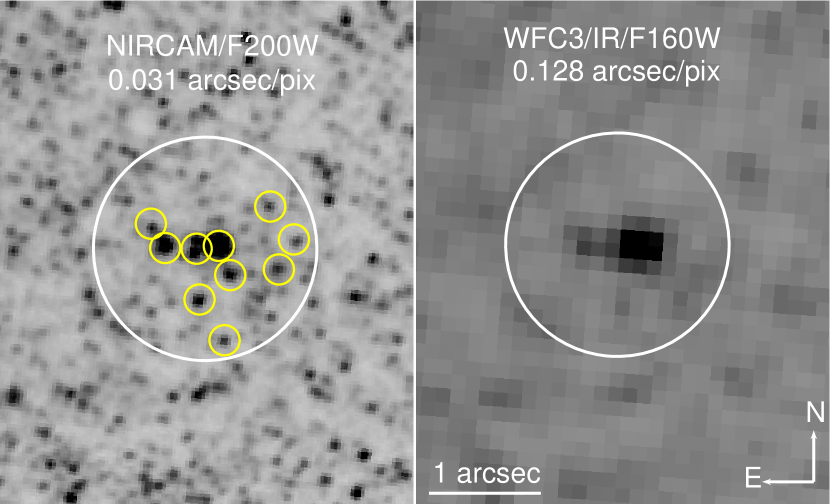
Only four of the eight X-ray sources (including ULXs) are in the field of view of the JWST/NIRCam images. These XRB candidates were compared with NIR point sources, and two reference sources (excluding ULXs) were found for astrometric calculations. The coordinates in degrees of the identified reference sources are R.A = 65.00385 and Decl. = -54.94534 (AGN) and R.A = 65.00172 Decl. = -54.93789 ( core of the galaxy). The astrometric offsets between the Chandra and JWST/NIRCam F200W images were found as -0.22 0.01 for R.A and -0.04 0.05 for Decl. with 1- errors. The total astrometric errors between Chandra-JWST/NIRCam were derived as 0.12. The astrometric error radius was derived as 0.38 with a 90% confidence level. According to the corrected X-ray positions, a unique NIR counterpart for ULX-1, two NIR counterparts for ULX-2 (hereafter 2-a and 2-b), and several NIR counterparts for ULX-4 were identified within the astrometric error radius. A unique source was identified that is too extended to be the donor star within the derived astrometric error radius of ULX-5? (see figure 6). Although it was identified as a potential ULX source in Section 3.1 due to its X-ray luminosity, the multi-wavelength observations suggest that it is more likely to be an uncatalogued AGN. Therefore, the possibility of this source being a ULX is excluded in this study. In the case of ULX-3, the NIR counterpart(s) could not be identified for ULX-3 because it was not observed by JWST.
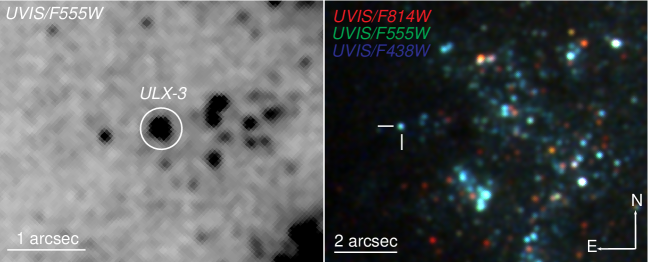
Moreover, relative astrometry was performed between JWST/NIRCam and HST/WFC3 images to determine the optical counterparts of ULXs using the GAIA/DR3 source catalog. The astrometric offsets between JWST/NIRCam and HST/WFC3 were derived as R.A= 0.26 0.01 and Decl.=0.33 0.01 at 1- significance. At the corrected position of the NIR counterpart, a unique optical source was identified for ULX-1, while only a unique optical source consistent with 2-b was identified for ULX-2 at the 3- detection threshold only in the HST/WFC3 F555W and F814W images. In addition, a unique optical counterpart was identified for the ULX-3. Figure 7 shows the corrected X-ray position of the ULX-3 on the F555W and RGB HST/WFC3 images. The corrected X-ray positions of the counterparts of ULX-1, ULX-2, and ULX-4 are shown in Figures 8, 9, and 10. The Chandra and corrected X-ray positions of counterparts are given in Table LABEL:T3. The dereddened Vega magnitudes, corrected with AV 0.04 mag (Tripathi & Dewangan, 2022), of the optical and NIR counterparts are given in Table 4.

| Source number | Chandra R.A. | Chandra Decl. | JWST R.A. | JWST Decl. | HST R.A. | HST Decl. |
|---|---|---|---|---|---|---|
| … | (hh:mm:ss.sss) | ( : : ) | (hh:mm:ss.sss) | ( : : ) | (hh:mm:ss.sss) | ( : : ) |
| ULX-1 | 4:19:56.08 | -54:56:36.5 | 4:19:56.11 | -54:56:36.4 | 4:19:56.07 | -54:56:36.8 |
| ULX-2 | 4:19:56.55 | -54:55:29.3 | 4:19:56.58 | -54:55:29.2 | 4:19:56.54 | -54:55:29.6 |
| ULX-3 | 4:20:10.12 | -54:56:42.0 | … | … | 4:20:10.06 | -54:56:42.31 |
| ULX-4 | 4:20:05.03 | -54:56:56.8 | 4:19:56.58 | -54:55:29.2 | 4:20:05.01 | -54:56:57.1 |
| ULX-5? | 4:20:05.00 | -54:56:57.4 | … | … | … | … |
Note: The coordinates of the NIR and optical counterparts are given according to their positions in the F200W and F555W images.
| Counterparts | UVIS/F555W | UVIS/F814W | NIRCAM/F200W | NIRCAM/F300M | NIRCAM/F335M | NIRCAM/F360M | |
|---|---|---|---|---|---|---|---|
| ULX-1 | 25.87 0.12 | 24.81 0.11 | 21.92 0.08 | 22.65 0.08 | 22.51 0.06 | 22.53 0.05 | |
| ULX-2-a | >28 | >26.8 | 22.84 0.06 | 20.74 0.06 | 20.73 0.05 | 20.68 0.04 | |
| ULX-2-b | 25.36 0.16 | 23.94 0.08 | 22.12 0.06 | 21.65 0.06 | 21.42 0.05 | 20.77 0.06 | |
| UVIS/F275W | UVIS/F336W | UVIS/F438W | UVIS/F555W | UVIS/F814W | |||
| ULX-3 | 22.39 0.03 | 22.68 0.03 | 24.16 0.03 | 24.12 0.02 | 24.03 0.03 |
3.4 Spectral Energy Distributions
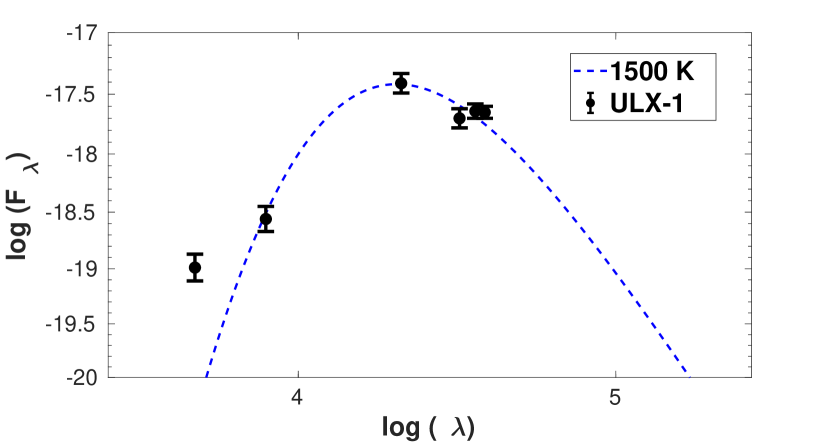
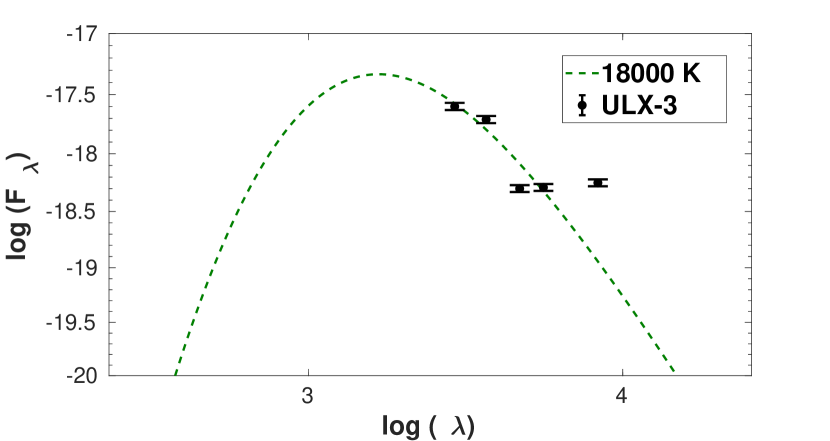
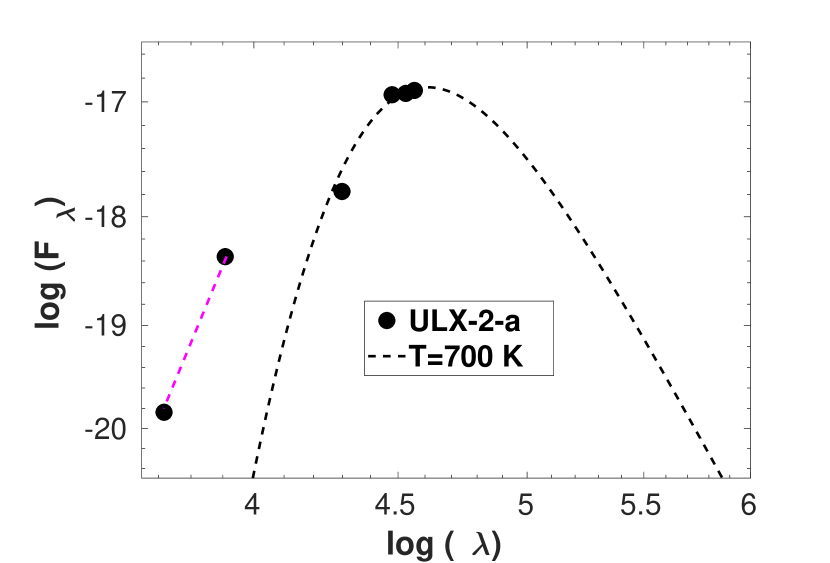
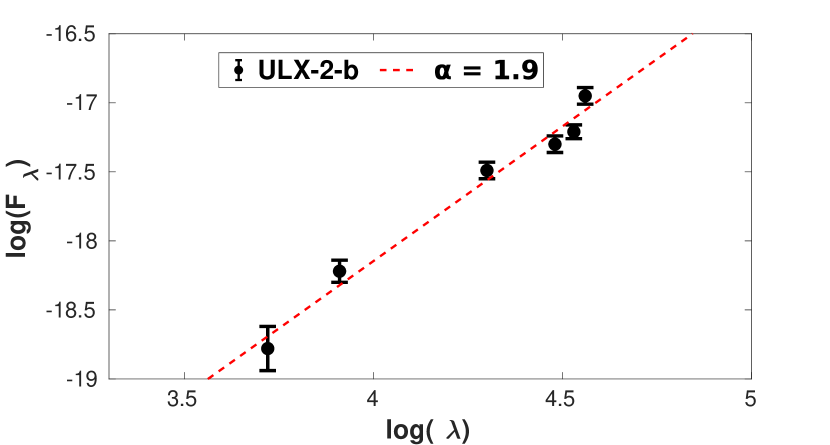
The SEDs (spectral energy distributions) of the counterparts were plotted by using the flux values derived from Table 4 to constrain the optical and NIR emission of counterparts. For this, the SEDs were fitted using either a blackbody or a power-law, F , spectrum by following the similar approach given in our previous study of Allak et al. (2022b). The reddening corrected SEDs of ULX-1 and ULX-3 were adequately well-fitted by the blackbody with temperature (T) of 1500 K and 18000 K, respectively (see Figure 11). In the case of ULX-2, reddening corrected SED of 2-a was adequately well-fitted by a blackbody model with T=700 120 K, and SED of ULX-2-b was well-fitted by a power-law model with =1.19 0.10 at 3- confidence level. The reduced chi-square, , values of ULX-1, 2-a, 2-b, and ULX-3 are 0.70, 0.55, 0.67 and 0.81, respectively. For ULX-2, the number of degrees of freedom (dof) is four while in the case of both ULX-1 and ULX-3 is three.
4 Results and Discussion
4.1 X-ray
ULX-1: As can be seen in Figure 1, two X-ray sources are located close to ULX-1 in the Swift/XRT image. However, these sources were not detected in the Chandra image, so they could be candidates for transient X-ray sources. Therefore, a detailed study of the Swift/XRT X-ray properties of ULX-1 could not be performed due to insufficient angular resolution. On the other hand, the Chandra X-ray luminosity of ULX-1 was derived as (6 0.12) 1039 erg s-1 using srcflux in the 0.3-10 keV energy band. It also varies by almost an order of magnitude in the short-term (3ks) light curve constructed from the Chandra observation. Due to the lack of high spatial resolution images such as Chandra, the long-term variability feature is not clear. Based on a distance of 17.69 Mpc, ROSAT/HRI (Liu & Bregman, 2005) luminosity values are re-derived as (3-10) 1039 erg s-1. On the other hand, the spatial resolution of ROSAT/HRI (2 arcsec/pixel) is almost the same as Swift/XRT (2.36 arcsec/pixel), probably contributed by the potential transient X-ray source candidates shown in Figure 1.
ULX-2: Time-averaged 0.3-10 keV Swift/XRT spectrum of the ULX-2 is composed of power-law with = 1.72 a non-thermal emission continuum due to Comptonization in corona. From the best fitting tbabs power-law model, the unabsorbed X-ray luminosity (LX) of ULX-2 was derived as 1040 erg s-1 which is compatible with the luminosity values of ROSAT/HRI (3-10) 1039 erg s-1 using distance of 17.69 Mpc. Outbursts for the typically Galactic X-ray binaries, begin and end in the hard state which shows a power-law X-ray spectrum with a hard photon index (1.4 < < 2.1) and also strong variability on short timescales. However, in the case of ULX-2, there was no clear evidence of an outburst due to low data quality. In addition, no clear evidence for short-term count rate variability was found. For the properties of short and long-term variability, high-quality X-ray observations with good enough resolution, such as the Chandra observatory, are needed.
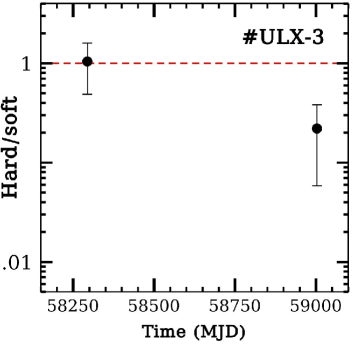
ULX-3: The time-averaged Swift/XRT spectrum of the ULX-3 is well-fitted by two-component power-law + blackbody model with 2 and kT = 0.12 keV. The unabsorbed X-ray luminosity was derived as 4 1039 erg s-1 in 0.3-10 keV energy band. The blackbody component is dominant and contributes to 80% of the luminosity. The power-law component represents a hard tail in the spectrum (out of a standard accretion disk) while a single cool blackbody component may indicate the soft thermal emission arises from the photosphere of thick outflows (Feng et al., 2016 and references therein). To search for a possible spectral state transition, hardness ratios, defined as Hard/Soft (Hard=2-8 keV, Soft= 0.3-1.5 keV) were plotted using two Swift/XRT observations. As can be seen from the diagram of the hardness ratios in Figure 13, a clue of transition from hard to soft states is observed for ULX-3, as seen in typical high-mass Galactic X-ray binaries (Kaaret et al., 2017). A scenario for this state transition is that the accretion rate increases, more mass falls into the accretion disk, which can lead to more soft X-ray emission. In other words, the mass transfer and the change in disk geometry can be observed as transitions. Provided that Chandra and Swift/XRT observations are compared, as seen in Figure 4, the possibility of long-term variability is not ruled out, but the short-term variability of ULX-3 is not fully clear due to a lack of high-quality data.
ULX-4: The time-averaged spectrum of the ULX-4 is well-fitted by a two-component model power-law + diskbb with 1.5 and Tin = 0.26 keV, and unabsorbed X-ray luminosity of 1040 erg s-1 in 0.3-10 keV energy band. ULX-4 has not been identified as ULX in previous studies and/or observations but, this luminosity value makes it a strong ULX candidate. The X-ray spectrum of accreting black hole binaries (BHBs) is commonly modeled using a combination of a diskbb and a power-law (e.g., Feng et al., 2016). As can be seen from the time-averaged spectrum in Figure 3, the diskbb component is dominant below 2 keV, and the power-law component is dominant above 2 keV. The diskbb component is predominant and carries 65% of the luminosity. The thermal state of BHB is represented by a spectrum consisting of a dominant thermal diskbb with secondary power-law or Comptonization (Remillard & McClintock, 2006). However, results of the discovery of NSs in ULX systems (e.g., NGC 7793 P13 Israel et al. (2017)) and the availability of high-quality X-ray energy spectra of ULXs (e.g., NGC 5907 ULX-1; Sutton et al. (2013)) from new generation X-ray observatories, there is no longer a strong suspicion of the presence of IMBHs for ULXs. For this source, the variability factor was found as 60 (see Figure 4) using both Chandra and Swift/XRT count rates that this may make it a transient ULX candidate. The short-term variability for ULX-4 is unclear due to lack of quality and/or insufficient observations.
4.2 Astrometry and Identification of Counterparts
Taking into account astrometric calculations, for ULX-1, ULX-2, and ULX-4 at least one NIR counterpart was identified within the astrometric error radius of 0.38 arcsec, and at least one of the NIR counterparts matches the optical counterpart. As seen in the F200W image of Figure 8, there are faint sources below the 3- detection threshold within the error radius, except for the bright NIR counterpart. In this study, the source that is bright and close to the center of the error radius is considered as the NIR counterpart, but the possibility that other fainter sources could be possible donor star candidates for ULX-1 is not completely excluded. In the case of ULX-4, seven NIR counterparts were detected within the error radius therefore, there are too many possibilities to decide which is a possible donor star for ULX-4. In addition, these sources could not be resolved in the JWST/MIRI observations due to their relatively low angular resolution. Hence, no constraints could be placed on the possible donor star of the new ULX candidate identified in this study. Simultaneous X-ray and multi-wavelength observations are needed to identify possible donor stars. In the case of ULX-3, since it was not observed by JWST its NIR counterparts were not determined, and only a unique optical counterpart was identified. In this study, only the optical and IR counterparts of ULX-1, ULX-2, and ULX-3 were analyzed in detail to constrain the nature of possible donor stars.
Since the ULXs are located in crowded regions (in terms of point sources), JWST/MIRI instrument does not have sufficient angular resolution to resolve counterparts at this distance of galaxy NGC 1566. Therefore, Mid-IR counterparts were not identified in the JWST/MIRI images. Moreover, although, there is almost no difference between the spatial resolution of the JWST/NIRCam F200W (0.03 arcsec/pixel) and HST/WFC3 (0.04 arcsec/pixel), as seen in Figure 10, two NIR sources are detected in the F200W image while a unique source is observed at the same location in the HST/WFC3 image. Furthermore, as seen in Figure 14, randomly selected sources that can be resolved in the JWST/NIRcam images are observed as bright point-like sources in the JWST/MIRI images (0.11 arcsec/pixel). Due to the fact that ULXs are often found in crowded fields, such as spiral arms, it is quite possible that past IR studies of ULXs especially in distant galaxies might be identified blended sources as counterpart(s). Therefore, the previously reported IR properties of ULXs should be re-examined with JWST observations.

4.3 Properties of Counterparts
ULX-1: The SED (optical to NIR) for the counterpart of ULX-1 is fitted with a blackbody model with T 1500 K. This indicates that the emission of ULX-1 could be due to the accretion disk, the donor star, or the circumbinary disk/dust. On the other hand, the blackbody temperature (1500 K), which represents the NIR excess, is not hot enough to come from any donor star (e.g., Levesque et al., 2005) so, it is more likely that this temperature comes from the circumbinary disk or from warm dust disturbed by X-rays (Lau et al., 2019). Since the emissions at optical wavelengths are generally the same size as local dust particles, it is easily scattered by the dust while longer-wavelength emission passes through unobstructed. Therefore, the optical counterpart of ULX-1 might be observed as very faint ( 26 mag) in the HST/WFC3 F555W image. Since the observed emission does not come from the outer part of the accretion disk (reprocessing) and/or the donor star, the multi-wavelength properties of ULX-1 are still unclear.
ULX-2: The SED for the counterpart of 2-b is well-fitted with a power-law model with = 1.9. This indicates that the emission from of ULX-2 could be due to the accretion disk. The power-law does not cut off at optical wavelengths and extends into the NIR. In the case of the accretion disk, such an emission indicates the presence of a quite large ( 1013 cm) disk than expected for ULXs (Tao et al., 2011; Grisé et al., 2012; Sutton et al., 2014) therefore, the source 2-b may not be the possible donor star of ULX-2. On the other hand, another counterpart of ULX-2 (2-a ) is not detected at the 3- detection threshold in the HST/WFC3 images hence, for HST/WFC3 F555W and F814W images, the 3- upper limit magnitude values of 2-a were derived as 26.8 and 28 , which are close to the detection limit of HST/WFC3 instrument. The SED of 2-a was represented by the blackbody model with T=700 K. As seen in the top panel of Figure 12, the only NIR excess is represented by the blackbody model. This thermal emission is due to the presence of circumbinary disk/dust similar to the case of ULX-1, but colder.
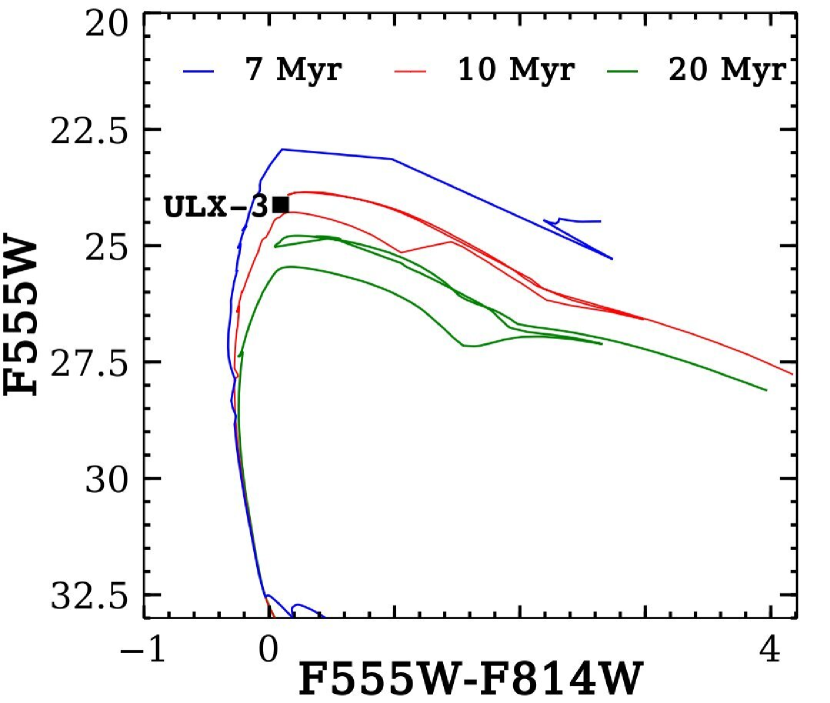
ULX-3: The optical counterpart of ULX-3 is bright in the optical bands and there are no JWST observations to investigate its IR counterpart(s). As seen in the reddening corrected SEDs of ULX-3, Figure 11, optical emission was represented by the blackbody model with a temperature of 18000 K.According to Straizys & Kuriliene (1981) the measured temperature and absolute magnitude (M -7) of the possible donor star indicate that spectral classification would be an B-type supergiant. In addition, its colors (U-B and V-I) are also consistent with the B-type supergiants in the Large Magellanic Cloud (Bonanos et al., 2009). Moreover, to estimate age of the counterparts, color-magnitude diagrams (CMDs) were plotted for the counterpart. The solar metallicity of 0.02 and AV 0.04 mag (Tripathi & Dewangan, 2022) were used to obtain the corresponding Vega mag PARSEC (Bressan et al., 2012) isochrones forHST/WFC3 wide filters. The distance modulus was calculated as 32.22 using the adopted distance of 17.7 Mpc. CMD, F555W vs F555WF814W was plotted for the counterpart, and the point sources around ULX-3 (see Figure 15).According to CMD, the range of age of ULX-3 was estimated as 7-10 Myr. If indeed the isochrones represent this source, in other words, if the radiation comes from possible donor, the mass range of the optical counterpart should be limited to 10-20 M. In typical Galactic BHB, the X-ray flux from the inner source is reprocessed within the outer parts of the accretion disk, and this can observed as a dominant effect on the UV and optical spectrum. The surface area of the emitting regions of ULX-3 was derived as 8 1022 cm2 or a radius of 3 1011 cm using temperatures of 18000 K. This radius is expected for many ULXs (Tao et al., 2011; Grisé et al., 2012; Tao et al., 2012), hence this study rule out the possibility of reprocessing. In this case, the optical emission observed for ULX-3 is most likely due to the donor star.
5 CONCLUSIONS AND SUMMARY
The timing and spectral properties of the four ULXs in the NGC 1566 analyzing all the available archival Swift/XRT PC mode and Chandra observations. Moreover, the optical and NIR counterparts of ULXs were identified by precise astrometric calculations by using HST HST/WFC3 and JWST/NIRCam images. To constrain the optical and NIR emissions of the counterparts, SEDs were plotted using all available multi-wavelength observations. Moreover, CMDs were constructed to estimate the age and type of donor star. The main findings from this study are summarized as follows:
-
•
new transient ULX candidate (ULX-4) with a peak luminosity of1040 erg s-1 was identified.
-
•
For ULX-1, ULX-2, and ULX-3, no strong evidence of long-term variability is found, while ULX-4 shows variability of more than an order of magnitude in the long-term X-ray light curve. In addition, a hint of short-term (3 ks) variability was found in the Chandra data for the only ULX-1.
-
•
The transition track of ULX-3 is most likely the spectral state transition seen in Galactic X-ray binaries.
-
•
The time-averaged spectrum of the source ULX-2 was adequately well-fitted by power-law model with 1.7,and L 1040 erg s-1.
-
•
The time-averaged spectrum of the source ULX-3 was well-fitted by the power-law+blackbody model with 2 and kT =0.12 keV, and L 4 1039 erg s-1.
-
•
The time-averaged spectrum of the source ULX-4 was well-fitted by the power-law+diskbb model with 1.6 and Tin =0.26 keV, and L 1040 erg s-1.
-
•
A unique optical and NIR counterparts of ULX-1 were identified within the astrometric error radius while two NIR and optical counterparts, 2-a and 2-b, were identified for ULX-2. At least seven NIR sources were identified for ULX-4 within the error radius. In the case of ULX-3, a unique optical counterpart was identified.
-
•
The SEDs for the NIR counterparts ULX-1 and ULX-2-a were adequately well-fitted by a single blackbody model with temperatures of 1500 K and 700 K, respectively. These indicate that observed NIR emission comes from the circumbinary disk or from warm dust.
-
•
The SED of ULX-3 is represented by a single blackbody temperature of 18000 K. Both the absolute magnitude and temperature indicate that the observed optical emission comes from a B-type supergiant donor.
Acknowledgements
I would like to thank the anonymous referee for helpful suggestions that greatly improved this paper. This paper was supported by the Scientific and Technological Research Council of Turkey (TÜBİTAK) through project number 122C183. I would like to thank A. Akyuz for her valuable suggestions.
Data Availability
The scientific results reported in this article are based on archival observations made by the James Webb Space Telescope and Hubble Space Telescope, and obtained from the data archive at the Space Telescope Science Institute777https://mast.stsci.edu/portal/Mashup/Clients/Mast/Portal.html. This work has also made use of observations made with the Chandra888https://cda.harvard.edu/chaser/ and Swift/XRT999https://swift.gsfc.nasa.gov/about_swift/xrt_desc.html X-ray Observatories.
References
- Agrawal & Nandi (2015) Agrawal V. K., Nandi A., 2015, MNRAS, 446, 3926
- Allak (2022) Allak S., 2022, MNRAS, 517, 3495
- Allak (2023a) Allak S., 2023a, arXiv e-prints, p. arXiv:2306.11163
- Allak (2023b) Allak S., 2023b, MNRAS, 526, 5765
- Allak et al. (2022a) Allak S., et al., 2022a, MNRAS, 510, 4355
- Allak et al. (2022b) Allak S., Akyuz A., Sonbas E., Dhuga K. S., 2022b, MNRAS, 515, 3632
- Ambrosi & Zampieri (2018) Ambrosi E., Zampieri L., 2018, MNRAS, 480, 4918
- Bachetti et al. (2014) Bachetti M., et al., 2014, Nature, 514, 202
- Bonanos et al. (2009) Bonanos A. Z., et al., 2009, AJ, 138, 1003
- Bressan et al. (2012) Bressan A., Marigo P., Girardi L., Salasnich B., Dal Cero C., Rubele S., Nanni A., 2012, MNRAS, 427, 127
- Brightman et al. (2018) Brightman M., et al., 2018, Nature Astronomy, 2, 312
- Brightman et al. (2019) Brightman M., et al., 2019, ApJ, 873, 115
- Brightman et al. (2022) Brightman M., Kosec P., Fürst F., Earnshaw H., Heida M., Middleton M. J., Stern D., Walton D. J., 2022, ApJ, 929, 138
- Caballero-García et al. (2013) Caballero-García M. D., Belloni T., Zampieri L., 2013, MNRAS, 436, 3262
- Carpano et al. (2018) Carpano S., Haberl F., Maitra C., Vasilopoulos G., 2018, MNRAS, 476, L45
- Chandar et al. (2020) Chandar R., Johns P., Mok A., Prestwich A., Gallo E., Hunt Q., 2020, ApJ, 890, 150
- Fabrika et al. (2021) Fabrika S. N., Atapin K. E., Vinokurov A. S., Sholukhova O. N., 2021, Astrophysical Bulletin, 76, 6
- Feng et al. (2016) Feng H., Tao L., Kaaret P., Grisé F., 2016, ApJ, 831, 117
- Grisé et al. (2012) Grisé F., Kaaret P., Corbel S., Feng H., Cseh D., Tao L., 2012, ApJ, 745, 123
- Heida et al. (2014) Heida M., et al., 2014, MNRAS, 442, 1054
- Israel et al. (2017) Israel G. L., et al., 2017, MNRAS, 466, L48
- Kaaret et al. (2017) Kaaret P., Feng H., Roberts T. P., 2017, ARA&A, 55, 303
- King (2009) King A. R., 2009, MNRAS, 393, L41
- King et al. (2023) King A., Lasota J.-P., Middleton M., 2023, New Astron. Rev., 96, 101672
- Kong et al. (2022) Kong L.-D., et al., 2022, ApJ, 933, L3
- La Parola et al. (2015) La Parola V., D’Aí A., Cusumano G., Mineo T., 2015, A&A, 580, A71
- Lau et al. (2019) Lau R. M., et al., 2019, ApJ, 878, 71
- Levesque et al. (2005) Levesque E. M., Massey P., Olsen K. A. G., Plez B., Josselin E., Maeder A., Meynet G., 2005, ApJ, 628, 973
- Liu & Bregman (2005) Liu J.-F., Bregman J. N., 2005, ApJS, 157, 59
- Liu et al. (2009) Liu J., Bregman J. N., McClintock J. E., 2009, ApJ, 690, L39
- Liu et al. (2012) Liu J., Orosz J., Bregman J. N., 2012, ApJ, 745, 89
- López et al. (2020) López K. M., Heida M., Jonker P. G., Torres M. A. P., Roberts T. P., Walton D. J., Moon D. S., Harrison F. A., 2020, MNRAS, 497, 917
- Mayker Chen et al. (2023) Mayker Chen N., et al., 2023, arXiv e-prints, p. arXiv:2301.05718
- Middleton et al. (2015) Middleton M. J., Walton D. J., Fabian A., Roberts T. P., Heil L., Pinto C., Anderson G., Sutton A., 2015, MNRAS, 454, 3134
- Pasham & Strohmayer (2013) Pasham D. R., Strohmayer T. E., 2013, ApJ, 774, L16
- Pinto & Walton (2023) Pinto C., Walton D. J., 2023, arXiv e-prints, p. arXiv:2302.00006
- Remillard & McClintock (2006) Remillard R. A., McClintock J. E., 2006, ARA&A, 44, 49
- Roberts (2007) Roberts T. P., 2007, Ap&SS, 311, 203
- Rodríguez Castillo et al. (2020) Rodríguez Castillo G. A., et al., 2020, ApJ, 895, 60
- Song et al. (2020) Song X., Walton D. J., Lansbury G. B., Evans P. A., Fabian A. C., Earnshaw H., Roberts T. P., 2020, MNRAS, 491, 1260
- Soria et al. (2012) Soria R., Hakala P. J., Hau G. K. T., Gladstone J. C., Kong A. K. H., 2012, MNRAS, 420, 3599
- Stetson (1987) Stetson P. B., 1987, PASP, 99, 191
- Straizys & Kuriliene (1981) Straizys V., Kuriliene G., 1981, Ap&SS, 80, 353
- Sutton et al. (2012) Sutton A. D., Roberts T. P., Walton D. J., Gladstone J. C., Scott A. E., 2012, MNRAS, 423, 1154
- Sutton et al. (2013) Sutton A. D., Roberts T. P., Gladstone J. C., Farrell S. A., Reilly E., Goad M. R., Gehrels N., 2013, MNRAS, 434, 1702
- Sutton et al. (2014) Sutton A. D., Done C., Roberts T. P., 2014, MNRAS, 444, 2415
- Tao et al. (2011) Tao L., Feng H., Grisé F., Kaaret P., 2011, ApJ, 737, 81
- Tao et al. (2012) Tao L., Kaaret P., Feng H., Grisé F., 2012, ApJ, 750, 110
- Tripathi & Dewangan (2022) Tripathi P., Dewangan G. C., 2022, ApJ, 925, 101
- Walton et al. (2018) Walton D. J., et al., 2018, ApJ, 857, L3
- Yao & Feng (2019) Yao Y., Feng H., 2019, ApJ, 884, L3