Remixing of a phase separated binary colloidal system with particles of different sizes in an external modulation
Abstract
We explore phase behaviour of a binary colloidal system under external spatially periodic modulation. We perform Monte Carlo simulation on a binary mixture of big and small repulsive Lennard-Jones particles with diameter ratio 1:2. We characterise structure by isotropic and anisotropic pair correlation function, cluster size distribution, bond angle distribution, order parameter and specific heat. We observe demixing of the species in the absence of the external modulation. However, mixing of the species gets enhanced with increasing potential strength. The de-mixing order parameter shows discontinuity and the specific heat shows a peak with increasing modulation strength, characterizing a first order phase transition
Keywords: Modulated liquid, Binary colloid, Phase separation, order parameter
I Introduction
Mixing of different components in condensed phase is of paramount importance in systems ranging from alloyspaper 1 ; paper 2 ; paper 3 to those as complicated as biological cellspaper 4 ; paper 5 . Tuning miscibility among macro-molecules is thus an active area of research, spanning a diverse areas as well as technological applications. Here we examine the mixing property of a binary colloidal macro-molecular system in the presence of an external modulation potential.
Colloids are ideal systems to explore condensed phase properties at microscopic level following the individual particle motions. This is so because the colloidal particles can be probed via laser light scattering and optical microscopy paper 6 ; paper 7 ; paper 8 due to their length size and slow movement. Colloids can be easily modulated by external perturbations, like laser field, electric fieldpaper 9 , magnetic fieldpaper 10 and shearpaper 11 . Modulated structures are often important for technological applications as well. Understanding colloidal systems under external perturbations from microscopic considerations has drawn considerable research interestspaper 12 ; paper 12 ; paper 13 ; paper 14 ; paper 15 ; paper 16 ; paper 17 . Modulated colloids often show nontrivial behaviour. For instance, a mono-disperse colloidal system subject to a one-dimensional stationary laser modulation with wavelength matching with the mean inter-particle separation undergo re-entrant melting with increasing modulation strength paper 18 ; paper 19 ; paper 20 . Many interesting studies are reported on colloids under external potentialpaper 21 ; paper 22 ; paper 23 , such as two-dimensional melting behavior of super-paramagnetic colloidal particles under quenched disorderpaper 24 , freezing and melting of a colloidal adsorbate on a one dimensional quasi-crystalline substratepaper 25 , effective forces in modulated colloidspaper 26 , modulated phases in dense colloids paper 27 , heterogeneous dynamics of colloids under external potential paper 28 ; paper 29 ; paper 30 and so on.
Experiments on a binary colloidal system with particles of different sizes subject to a spatially periodic potential has also been reported using the external modulation generated in a given direction by interfering laser beamspaper 31 . The wavelength of the modulation is equal to the size of the bigger particles, and the modulation is stronger for them than the smaller particles. The arrangement of the particles are recorded using optical microscopy and characterized in terms of various static quantities. It is observed that an increase in the external modulation amplitude leads to localization of the large particles analogous to a modulated liquidpaper 32 with an increasing fraction of small particles caged by the bigger particles. The smaller particles arrange themselves in a triangular fashion inside those cages. The large particles are observed to remains ordered, whereas the lattice of small particles became disordered upon increasing the temperature.
Numerous demixing studies have been reported on colloidal mixtures. There have been studies on demixing of model colloids composed of two different sizes of polystyrene spheres using diffusing wave spectroscopy paper 33 . Experiments on a binary dispersion of like-charged colloidal particles with large charge asymmetry but similar size exhibit phase separation into crystal and fluid phases under very low salt conditions. Here the colloid–ion interactions provide a driving force for crystallization of one speciespaper 34 . Confocal-microscopy studies on demixing and remixing with temperature in binary liquids containing colloidal particles has been reported paper 35 ; paper 36 . However, there has been no study yet to the best of our knowledge how an external modulation changes the demixing behaviour in a binary colloid.
In this backdrop we study a model binary system with different particles of diameter ratio 1:2 in an external modulation as in Ref.paper 37 . The external modulation wavelength is equal to the diameter of the big particles and the strength of modulation is twice for the big particles than the small ones. We study the system using the Monte Carlo (MC) simulation at room temperature where the Metropolis sampling has been performed based on the energy cost of a particle movement due to interaction with all other particles and the external modulation. For a fixed 1:1 composition and particle density as in Ref.paper 37 , we vary the external modulation strength. We calculate pair correlation function, cluster size distribution and bond angle parameter to characterize structural changes in the system with the strength of external modulation. We also compute thermodynamic quantities such as demixing order parameter and specific heat in order to investigate the phase transition as the structural changes occur in the system.
We observe that the two components in the system undergo phase separation in absence of any external modulation at room temperature. presence of external potential, the bigger particles align themselves along the potential minima due to the matching of their diameter with the wavelength of the external potential and stronger modulation strength, while the clusters of the smaller particles break into smaller clusters. We observe hexagonal ordering among the small particles within the clusters. The enhanced remixing of the species with increasing field strengths is reflected in the decrease of the mean cluster size and the shift of the mean demixing order parameter to lower values with discontinuity as a function of the external potential. The specific heat shows peak as a function of the modulation strength, suggesting the presence of a thermodynamic first order phase transition.
II System details
The particles are taken to interact via repulsive potential of the form:
| (1) |
Here is the distance between and particles belonging to species and respectively. Here corresponds to the particles of the same species, while corresponds to the cross species interactions. We take and , Db and Ds being the diameter of the big and small particles respectively. We fix and vary . We further subject the system to an external spatially periodic potential of the form:
| (2) |
where denote the x-coordinate of the particles, the wavelength of the external potential equal to the diameter of the bigger particles, and .
Here and . The packing fraction, , where is the area of the system) = 0.72. We take as the unit of length and for room temperature as the unit of energy. Monte Carlo (MC) simulations are carried out on a fixed N number of particles with equal number of big and small particles in a box of reduced length in x-direction, and that in y-direction . We run for a total of MC steps where the equilibration is judged from the energy values. Different quantities of interests are calculated over the equilibrated trajectories and averaged over five independent runs. Most of the results are reported on N=1024 particles. We also study the system for N=144 and N=4096 keeping the area fraction fixed to check the size dependence around the structural changes.
III Results and discussions
Structure without modulation
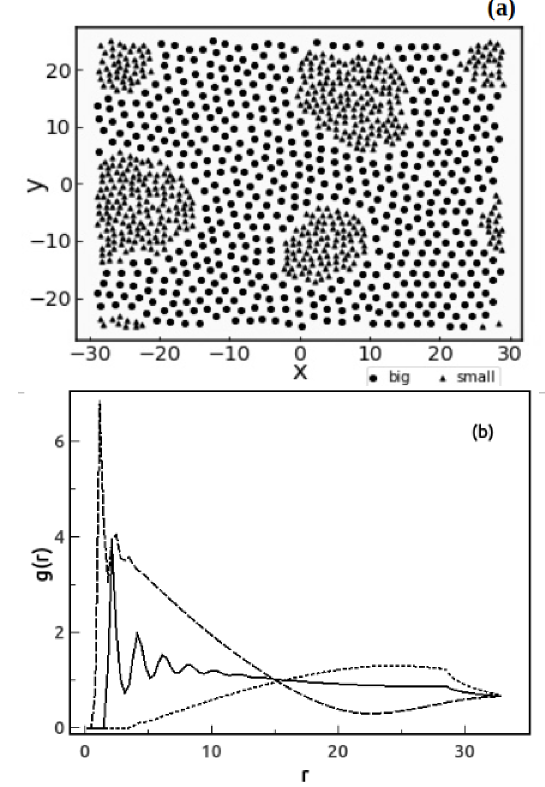
Let us consider the system in absence of external potential. Fig. 1(a) shows a typical particle arrangement in equilibrium. We observe clusters of small particles in the background of the big particles. We characterise the structural correlations from the histograms of the separation between particle pairs, also called the radial distribution function (rdf) paper 38 . This quantity describes the probability of finding a pair of particles belonging to species and at separation . Fig. 1 (b) shows the rdf for big-big , small-small , big-small pair of particles in absence of external potential. We observe liquid-like short ranges structure behaviour in both and . However, is much weaker. This means that the two species do not find in the vicinity of each other due to phase separation between them.
Modulated system
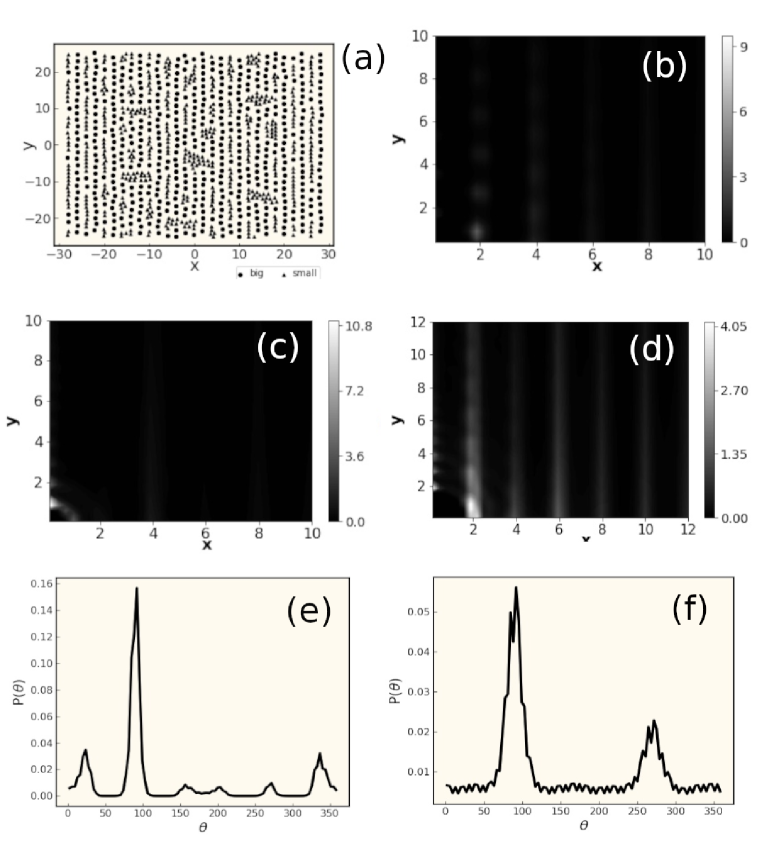
Let us now consider the effect of the external potential. We show equilibrated snapshot for in fig. 2(a). The snapshot shows that the big particles are aligned along the potential minima due to the matching of wavelength of external potential to the diameter of the bigger particles and stronger modulation strength than the smaller particles. The clusters of the smaller particles break into smaller clusters to make way for the bigger particles.
The anisotropic structure of the system is characterized by the pair correlation functions (PCF) in Figs. 2(b)-(d). They are obtained by binning the pair separations both in x- and y-directions. It may be noted that the rdf is the circular symmetric counter-part of the PCF. (Fig.2(b)) shows parallel strips along potential minima as per the periodicity of the external potential. This further confirms preferred particle positions at the modulation minima. in Fig.2 (c) shows dark patches on overall circular pattern, signifying slight deviation from isotropic structure. Due to breaking of clusters, the smaller particles arrange themselves nearer the bigger species. This leads to peaked structure in the big-small correlations (Fig. 2(d)), suggesting enhanced mixing tendency between the two species which are phase separated in the absence of the external potential.
The alignment tendency of the particles is quantified by the relative orientation () between and particles with respect to modulation direction, . We show in Fig. 2(e) and (f) the distribution of bond angle considering all the pairs over equilibrium configurations. Data for the big particles and small particles are shown in Fig. 2(e) and (f) respectively. Peaks in are at and , indicating alignment along the minima of the external potential. The smaller peaks in at , and are due to neighbouring big particles. versus for smaller particle (Fig. 2(e)) shows peaks at integral multiples of . This suggests that the smaller particles are forming clusters with a local hexagonal order among themselves, similar observation that reported in earlier experimental work paper 37 .
All the tendencies enhance with increasing as can be seen in SI show stronger alignment of bigger particles along the potential minima.(Fig. SI 1(a)) The clusters of the small particles further break up into smaller clusters, thus the big-small species shows enhanced tendency of mixing together (Fig. SI 1(b)-(d)). Even the smaller particles also tend to get aligned along the potential minima now. The alignment tendency is further reflected by the strong peak of in both (Fig. SI 1(e)) and (Fig. SI 1(f)) at .
Mixing behaviour
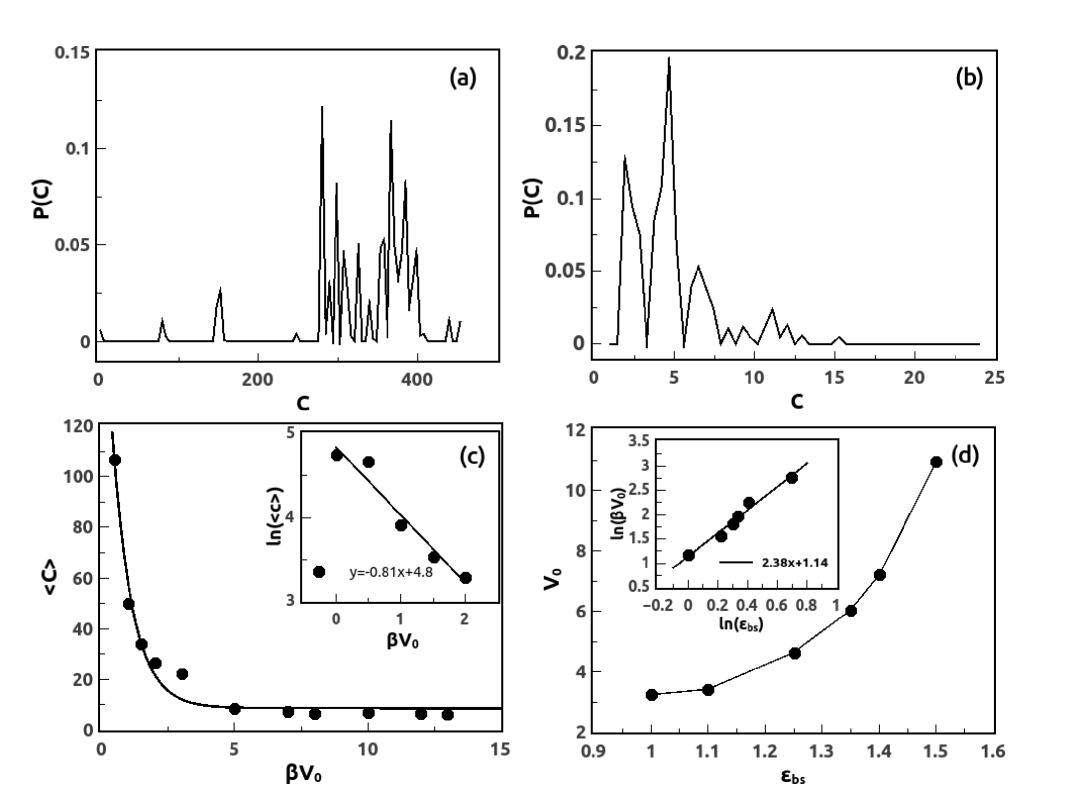
We further quantify the mixing tendency in the presence of the external modulation. First, we characterize the breaking of the small particle clusters. We compute the size of clusters of the small particles as follows. We take the small particles to belong to a cluster whose centre to centre distances in x- and y-direction are less than and respectively. We choose and . Here corresponds to the first minimum in and is slightly larger. We show distribution for smaller particles in Fig. 3(a)-(b) for two different ’s. Large clusters of the smaller particles are observed in agreement to phase separation between two species in absence of external potential. It is clear that the distribution peaks are shifted to lower values of cluster sizes for (Fig. 3(b)).
We plot the mean cluster size versus in Fig. 3(c). We observe that with and as shown in the inset of Fig. 3(c). The exponential decay suggests that energy needed to break the clusters is supplied by the external modulation. Note that falls to at as shown in Fig. 3(d). We observe that in the inset of fig.3(d).
We calculate the demixing order parameter for different . We partition to this end the simulation box into small rectangular cells with dimension , as per the appearance of first peak in anisotropic PCF data. Let and be the numbers of big and small particles in each of the boxes respectively. The demixing order parameter is defined as:
| (3) |
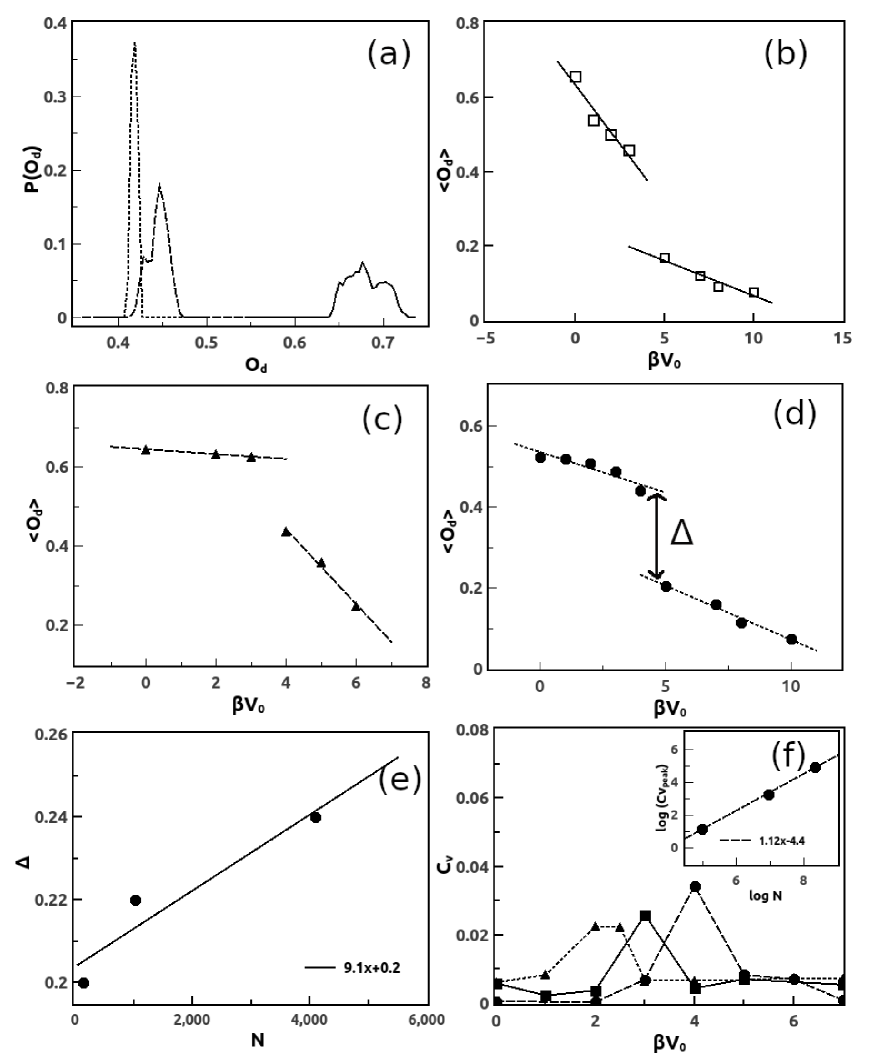
Here is the total number of particles and the total number of partitions of the system. Fig. 4(a) shows the distribution for all three cases for different . We observe a prominent peak at large value for . The peak shifts to a lower value, indicating mixing enhanced with . We show in Fig. 4(b) the order parameter averaged over the configurations vs . We observe that decreases with following two distinct branches, one branch for low values and the other one for higher values with discontinuity around =3.0.
We also simulate the system behaviour for different system sizes, namely, N=144 and N=4096. The data for in Fig. 4(c) and 4(d) also show discontinuity. The discontinuity in , is estimated as the gap between the points where the discontinuity starts at the upper branch and the lower branch. Fig. 4(e) shows the gap for different N. We observe that this discontinuity increases systematically, confirming a first order transition.
We also examine the behaviour of the specific heat of the system, using the fluctuation of energy:
| (4) |
Here E is the energy per particle at a given configuration and is the average energy per particle. Fig. 4(f) shows the vs. plot. We observe peak in specific heat at =3.0 where the discontinuity in is located.
The peak in specific heat data, shown in Fig.4(f), show shifts to larger with increasing as , although the point of the order parameter discontinuity does not seem to depend sensitively on N. The peak values, of the heat capacity vs. plot in inset of Fig. 4(f) show linear dependence on dependence, as in case of first order transitionpaper 39 . Thus, system undergoes first order phase transition while going from a complete phase separated state to a mixed one in presence of an external modulation potential.
Physically, the big particles tend to get aligned more strongly than the small ones, making their ways splitting through the clusters of smaller particles with increasing . The surface energy cost of this breaking up is supported by the external potential. The minimum value of this external potential above which the cluster will break can be estimated qualitatively. Let us consider for simplicity the case that a cluster of radius R breaks into two of radii and . The change in line energy is given by: where is the coefficient of line tension. The minimum of the change in line free energy can be estimated by minimizing with respect to one radius and if we assume that the mean density of the particles do not change due to breaking cluster and no particle is lost during the break up. This implies that . Using this relation and minimizing with respect to , we find . The droplet radius consisting of small particles in the background of the large particles can be stabilized if the total free energy consisting of the bulk and line tension component is at minimum. If is the free energy per unit area of the droplet, then the minimum free energy corresponds to . Hence, . The line tension experienced by the droplet of the smaller particles in the background of the larger particles is proportional to and consequently, . This amount of energy needs to be supplied through the external potential, implying that . This is consistent to the simulation observation of dependence.
Demixing phase transition is well known in binary systems. Typically demixing is known to show phase coexistence ending in a critical pointpaper 40 . The critical point for demixing of binary colloids tuning the size ratio has been reported paper 41 . Shifting of critical point in case of a critical colloidal-liquid to colloidal-liquid demixing phase transition can be controlled by solvent temperaturepaper 42 . Experiment on suspensions of colloids of differing charge but similar size undergoing phase separation into crystal and fluid phases has also been reported previouslypaper 43 . Phase transition due to demixing between phases rich in high-charge and low-charge colloids is observed in this case. First order phase transition in demixing due to size anisometry in colloids has been reported as wellpaper 44 . It may be noted that in contrast to the earlier reports, we observe here mixing of demixed binary colloids via a first order phase transition induced by an external modulation .
IV Conclusion
To summarize, we study using the MC simulations the mixing behaviour of a binary colloidal film periodically modulated in one direction. The interplay between interaction and external potential results in an enhanced tendency of mixing among the two species which are de-mixed in absence of the modulation. The changes from de-mixed to mixed state is accompanied by a first order phase transition with a jump in de-mixing order parameter. Our results suggest that mixing in a binary colloidal system can be tuned by suitable external potential which may be relevant in technological applications. It will be interesting to study this phase transition including the critical behaviour, if at all, in future.
V Acknowledgements
The authors declare no conflict of interest. S. P. thanks computational centre at SNBNCBS for providing with the high computing facility and DST for financial support through the S N Bose PhD program.
References
- (1) Dieter M Herlach et al 2010 J. Phys.: Condens. Matter 22 153101
- (2) Étienne Ducrot, Mingxin He, Gi-Ra Yi & David J. Pine Nature Materials 16, 652–657 2017
- (3) Friedrich Waag et.al. RSC Adv., 2019, 9, 18547
- (4) Masako Fujioka-Kobayashi, et. al. 2021, PPlatelets, 32:1, 74-81
- (5) Dylan M. Cable et. al. Nature Biotechnology 40, 517–526 2022
- (6) Pusey P N 1991 Colloidal suspensions in Liquids, Freezing and Glass Transition, ed J P Hansen et al (Elsevier Science Publishers), pp. 763-942.
- (7) Berne B J and Pecora R 1976 Dynamic Light Scattering (New York, Wiley).
- (8) Prasad V, Semwogerere D, and Weeks E R 2007 J. Phys.: Condens. Matter 19 113102.
- (9) Acuna-Campa H, Carbajal-Tinoco M D, Arauz-Lara J L and Medina-Noyola M 1998 Phys. Rev. Lett. 80 5802
- (10) Zahn K, Lenke R and Maret G 1999 Phys. Rev. Lett. 13 2721.
- (11) Cui B, Lin B and Rice S A 2001 J. Chem. Phys. 114 9142.
- (12) Bayer M, Brader J M, Ebert F, Fuchs M, Lange E, Maret G, Schilling R, Sperl M and Wittmer J P 2007 Phys. Rev. E 76 011508
- (13) Jepsen D W, Math 1965 J. Math. Phys. 6 405
- (14) Hahn K and Kärger J 1998 J. Phys. Chem. B 102 5766
- (15) Kollmann M 2003 Phys. Rev. Lett. 90 180602
- (16) Delfau B, Coste C and Jean M S 2011 Phys.Rev. E 84 011101.
- (17) Einstein A 1956 Investigations on the Theory of The Brownian Movement ed R Fürth (USA, Dover Publications, INC.)
- (18) Frey E and Kroy K 2005 Ann. Phys. 14 20
- (19) Coupier G, Jean M S and Guthmann C 2006 Phys. Rev. E 73 031112.
- (20) Chowdhury A, Ackerson B J and Clark N A 1985 Phys. Rev. Lett. 55 833
- (21) Loudiyi K, Ackerson B J 1992 Physica A 184 1
- (22) Chakrabarti J, Krishnamurthy H R, Sood A K and Sengupta S 1995 Phys. Rev. Lett. 75 2232
- (23) Bechinger C, Brunner M and Leiderer P 2001 Phys. Rev. Lett. 86 930
- (24) Frey Erwin, Nelson David R, and Radzihovsky Leo 1999 Phys. Rev. Lett. 83 2977.
- (25) Schmiedeberg Michael, Roth Johannes and Stark Holger 2006 Phys. Rev. Lett. 97 158304
- (26) Radzihovsky Leo, Frey Erwin and Nelson David R 2001 Phys. Rev. E 63 031503
- (27) Deutschländer S, Horn T, Löwen H, Maret G and Keim P 2013 Phys. Rev. Lett. 111 098301
- (28) Chaudhuri Chhanda Basu, Chakrabarty Srabani, and Chakrabarti J 2013 J. Chem. Phys. 139 204903
- (29) Jenkins M C and Egelhaaf S U 2008 J. Phys.: Condens. Matter 20 404220
- (30) Bechinger Clemens and Frey Erwin 2001 J. Phys.: Condens. Matter 13 R321
- (31) Löwen H 2001 J. Phys.: Condens. Matter 13 R415
- (32) Löwen H 2013 Eur. Phys. J. ST 222 2727
- (33) Kaplan P D, Yodh A G, and Pine D J 1992 Phys. Rev. Lett. 68 393
- (34) Koki Yoshizaw et.at. Soft Matter, 2012, 8, 11732-11736
- (35) Job H. J. Thijssen and Paul S. Clegg Soft Matter, 2010, 6, 1182-1190
- (36) D. Teuzollilo, J. Chem. Phys. 156, 034904 (2022)
- (37) Capellmann R F, Khisameeva A, Platten F and Egelhaaf S U 2018 J. Chem. Phys. 148 114903
- (38) Jean-Pierre Hansen and Ian R. McDonald, Theory of Simple Liquids,
- (39) K Binder Rep. Prog. Phys. 50 783 1987
- (40) Binder, K. (2015). Demixing. In: Li, D. (eds) Encyclopedia of Microfluidics and Nanofluidics. Springer, New York, NY.
- (41) Hideki Kobayashi, Phy. Rev. E 104, 044603 (2021)
- (42) O. Zvyagolskaya et al 2011 EPL 96 28005 (2011)
- (43) Koki Yoshizawa, Soft Matter, 2012, 8, 11732-11736
- (44) P. C. HEMMER and T. H. MARTHINSEN Mol. Phy. 100 667-671, 2002
VI Supplementary data
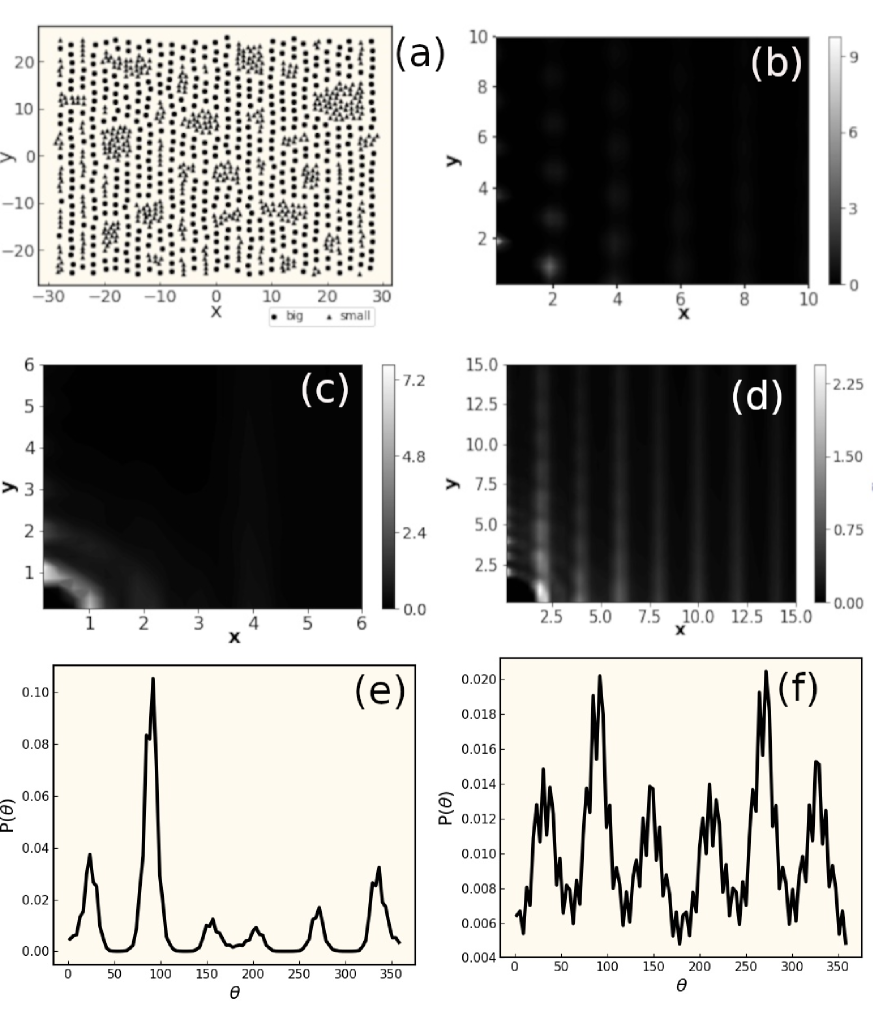
The snapshot showing enhanced mixing of particles under higher modulation is shown in Fig. S1(a). The bigger particles have been strongly aligned along the potential minima while breaking the clusters of the smaller particles into further smaller one; hence an enhanced tendency of mixing is observed. The anisotropic PCF data taking into account for three different interaction is shown in Fig S1(b)=(d). (Fig.2(b)) shows strong allignments of paticles through the parallel strips along potential minima as per the periodicity of the external potential. This confirms strong preference of particle positions at the modulation minima. in Fig. S1(c) shows distorted patches on overall circular pattern, signifying more deviation from isotropic structure. Due to the mixing phenomena, the smaller particles arrange themselves nearer the bigger species more so now. So the big-small correlation shows (Fig. S1(d)) higher peak values, suggesting enhanced mixing tendency between the two species with increment of strength of the external potential.
The alignment tendency is further reflected by the strong peak of in both (Fig. SI 1(e)) and (Fig. SI 1(f)) at big and small particles’ arrangement with respect to the modulation direction. Two significant peaks dominate in both the cases signifying strong alignment perpendicular to the modulation direction, i.e. along the potential minima.