Enhanced Activity Reduces the Duration of Intermittent Lévy Walks
in Bacterial Turbulence
Abstract
Dense bacterial suspensions display collective motion exhibiting coherent flow structures reminiscent of turbulent flows. In contrast to inertial turbulence, understanding the microscopic dynamics of bacterial fluid elements undergoing collective motion is in its incipient stages. Here, we report experiments revealing correlations between the microscopic dynamics and the emergence of collective motion in bacterial suspensions. Our detailed analysis of the passive tracers and the velocity field of the bacterial suspensions allowed us to systematically correlate the Lagrangian and the Eulerian perspectives. Bacteria within the collective dynamics revealed initial ballistic dynamics followed by intermittent Lévy walk before the eventual decay to random Gaussian fluctuations. Intriguingly, the persistence length and time of the fluid motion decrease with an increase in the activity, which, in turn, reduces the duration of Lévy walk. Our results reveal transitions in microscopic dynamics underlying the bacterial turbulence and their control via the intrinsic time scales set by the effective activity of the flow.
Examples of collective motion could be witnessed across various scales ranging from the picturesque flocking of birds, and huddling of penguins, to the crawling of cells and the swarming of bacteria Doostmohammadi et al. (2018); Marchetti et al. (2013); Ramaswamy (2017); Yeomans (2014); Toner et al. (2005); Katz et al. (2011); Ramaswamy (2010); Cavagna et al. (2010); Dunkel et al. (2013a). Despite the apparent differences in their composition and length scales, dedicated efforts over the last couple of decades revealed many similarities in their statistical properties like the scale dependence of spatiotemporal correlations, and the nature of interactions Doostmohammadi et al. (2018); Marchetti et al. (2013); Ramaswamy (2017). In general, a complex interplay of several factors including decision-making based on environmental cues, biochemical gradients, and physical interactions may manifest into macroscopic collective motion Doostmohammadi et al. (2018); Marchetti et al. (2013); Ramaswamy (2017); Yeomans (2014); Toner et al. (2005); Katz et al. (2011); Ramaswamy (2010); Cavagna et al. (2010); Dunkel et al. (2013a); Sokolov et al. (2007); Dombrowski et al. (2004); Gachelin et al. (2014); Sokolov et al. (2007); Sokolov and Aranson (2012); Dunkel et al. (2013a); Xie et al. (2022a); Schwanbeck et al. (2021); Aranson (2022); Cisneros et al. (2010). Here, the absence of cognitive ability in lower forms of life like microbial populations and living polymers (microtubules) reduce the overall complexity of the problem and thus, are excellent model systems to explore the physics underlying the rich dynamics of collective motion Sokolov et al. (2007); Dombrowski et al. (2004); Gachelin et al. (2014); Sokolov et al. (2007); Sokolov and Aranson (2012); Dunkel et al. (2013a); Xie et al. (2022a); Schwanbeck et al. (2021); Aranson (2022); Cisneros et al. (2010); Sokolov and Aranson (2012); Shelley (2016); Opathalage et al. (2019). For instance, the collective behavior observed in bacterial fluids is broadly understood on the basis of interplay between simple physical interactions, force gradients, and local alignment rules Vicsek and Zafeiris (2012); Doostmohammadi et al. (2018); Marchetti et al. (2013); Ramaswamy (2017); Toner and Tu (1995); Toner et al. (2005); Toner (2018); Yeomans (2014). While the orientational order within the bacterial communities may underlie excluded volume interactions between the entities, the hydrodynamic interactions between the neighboring aligned swimmers manifest into collective dynamics including large-scale coherent flow structures like vortices, traveling waves, and jets Qi et al. (2022); Saintillan and Shelley (2007). Dynamic similarities of such coherent flow structures with that of fluid flow in inertial turbulence, especially the emergent power laws in the length scale dependence of the energy spectrum Alert et al. (2022, 2020), inspired coinage of the word active turbulence to describe their flow dynamics Wensink et al. (2012); Qi et al. (2022). Thanks to the intense efforts at the continuum scales, the patterns formed during collective motion can be simulated to a greater extent by just invoking the competition of active stresses and dissipation Dunkel et al. (2013b, a).
The success in capturing the overall flow dynamics allows us to delve deeper into the statistical properties of individual entities involved in collective motion. Several aspects need our attention: Does the dynamics of individual entities change during the emergence of collective motion? Experiments on swarming colonies on a surface suggest that the individual entities exhibit Lévy walks Ariel et al. (2015); Kurtuldu et al. (2011). Recent simulations, solving Toner-Tu-Swift-Hohenberg equations, capturing the Lagrangian characteristics of the active fluids indicated the presence of initial ballistic motion followed by anomalous diffusion and Lévy walks Mukherjee et al. (2021). This observation was in stark contrast to the inertial turbulence as the initial ballistic dynamics is expected to become Brownian at later stages Xia et al. (2013). This suggests that the presence of anomalous diffusion and Lévy walks may allow distinguishing the active and inertial turbulence Mukherjee et al. (2021). However, to date, there are no experiments validating such a transition from ballistic to anomalous diffusion. Clearly, it is essential to experimentally characterize the statistics of microscopic dynamics and interactions to better understand the interactions/rules governing collective motion.
Addressing these pertinent aspects, we report experiments correlating the microscopic dynamics and the collective dynamics observed in dense bacterial suspensions. We systematically controlled the concentration of bacteria in a sessile droplet allowing us to pan the concentration-induced transition from isolated to collective dynamics. Our experiments probe the two-dimensional collective dynamics by focusing only on the air-water interface. Investigating the aforementioned fluids through the utilization of tracer particles will provide valuable insights into the intricate mechanisms governing these flows Gokhale et al. (2022); Angelani (2019); Dolai et al. (2018); Dikshit and Mishra (2022); Leptos et al. (2009); Peng et al. (2016); Xie et al. (2022a); Wu and Libchaber (2000); Valeriani et al. (2011); Peng et al. (2016). We used passive colloids to track the underlying fluid flow and the resultant Lagrangian statistics are compared with the overall two-dimensional flow of the bacterial fluid. The one-to-one correspondence of the Lagrangian statistics of the tracers and the Eulerian flow field in our experiments suggest that the colloidal particles act purely as tracers. Thus, modeling the geometry of colloidal trajectories allowed us to investigate the microscopic nature of the collective dynamics. Our experiments demonstrate, for the first time, that at the microscopic level, the individual entities of the bacterial fluid display a short time ballistic dynamics followed by intermittent Lévy walks and a Brownian motion at later stages. Intriguingly, we observe a reduction in the duration of Lévy walks with an enhancement in the overall activity of the flow. Our results highlight the need for a better understanding of the collective dynamics in bacterial systems.
We use suspensions of Bacillus subtilis IITKSM1 Murugan et al. (2019, 2022). The cell body is approximately 1 m in diameter and 6 m in length. Polystyrene (PS) colloids, procured from Sigma Aldrich, of diameter 3 m are used as tracer particles. Bacterial suspension with concentrations cells/mL is used as the base solution. All other concentrations () are obtained by centrifuging the base solution and redispersing the settled part in appropriate amounts of nutrient solution. For our systematic study, we vary from 1 to 50. A drop of freshly prepared solutions (mixed with 0.04 wt. PS colloids) placed on freshly hydrophilized coverslips (drop diameter 1 cm, after spreading) is probed using time-lapse optical microscopy. The dynamics of colloids are tracked using ImageJ package Schneider et al. (2012) and the underlying velocity distribution of the fluids using the MATLAB-based particle imaging velocimetry tool (PIV lab) Thielicke and Stamhuis (2014); Thielicke and Sonntag (2021). Please refer to sections S1 and S2 in the supporting information (SI) for experimental details and analysis protocols, respectively.
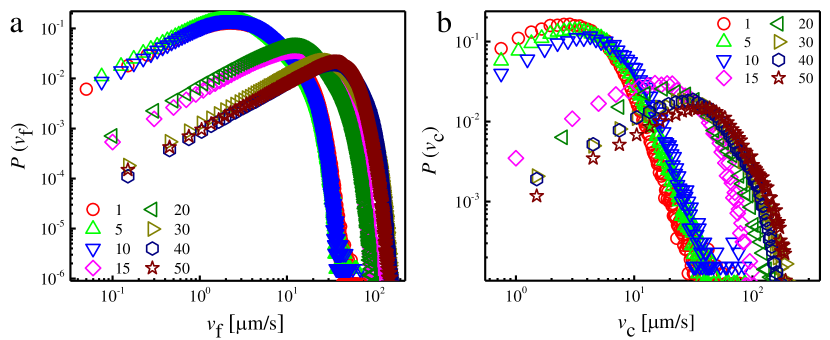
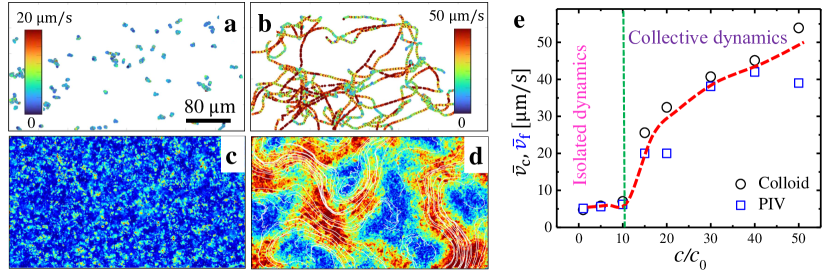
Figure 1 shows the colloidal trajectories spanning a duration of 10 s (a, b) and the Eulerian velocity fields (c, d) of the underlying fluid for two different concentrations: = and = . At lower concentrations, the dynamics of colloids (Fig.1(a)) are limited to length scales corresponding to their own diameter. The two-dimensional velocity distribution (Fig.1(c)) captures specific regions where the velocities are high indicating the movement of bacteria in those locations. On the other hand, colloids dispersed in dense bacterial suspensions show longer trajectories with approximately ten times higher instantaneous velocities (Fig.1(b)). The corresponding spatial distribution of velocities displays larger regions of high activity (Fig.1(d)), revealing collective motion. The characteristics like nonlinear velocity fields, the presence of vortices, and much longer trajectories (better mixing) suggest reminiscence to (inertial) turbulent flows. Interestingly, the streamlines (white lines in Fig.1(d)) reveal two important aspects: a) fluid elements span the entire system, and b) the neighboring streamlines are parallel over long distances revealing the presence of highly correlated flows. These observations suggest a concentration-dependent transition from isolated to collective dynamics Sokolov et al. (2007); Dunkel et al. (2013a). Quantifying these observations, in Fig.1(e), we show the mean velocity of the colloids () and of the fluid elements () as a function of bacterial concentration [refer Fig.S1(a)+(b) for the distribution of and ]. Clearly, both and increase rapidly beyond a threshold bacterial concentration ( = ) capturing the emergence of collective dynamics. In addition, the fact that demonstrates that colloids simply trace the flow dynamics of the underlying fluid, hence, allowing to capture the Lagrangian statistics of the bacterial turbulence. Thus, probing the colloidal dynamics and the dynamics of the bacterial fluid allow us to obtain both the Lagrangian and the Eulerian perspectives of bacterial turbulence.
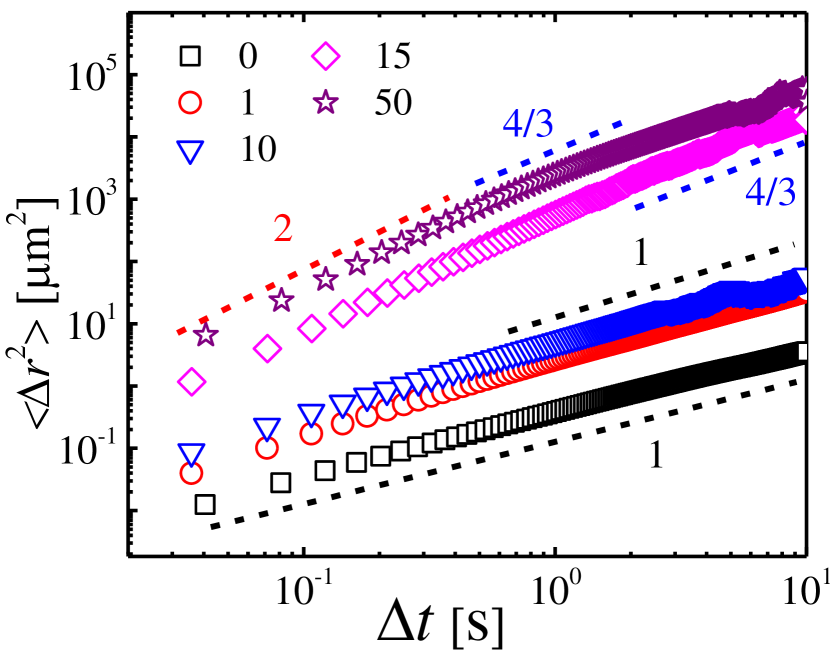
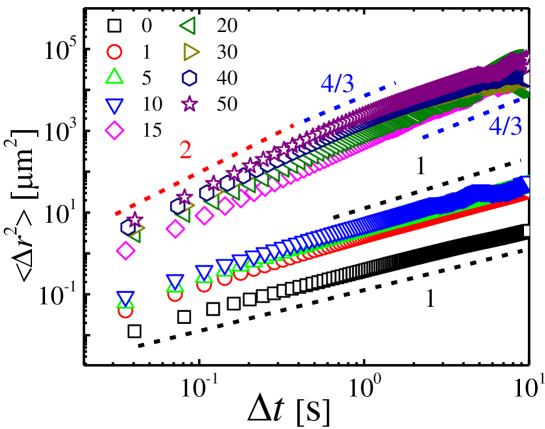
To shed light on the microscopic dynamics underlying the collective motion, we quantify the trajectories of the colloidal particles using the ensemble-averaged mean squared displacement (MSD). Figure 2(a) shows the double logarithmic representation of the temporal evolution of MSD of colloids dispersed in bacterial suspensions of various concentrations. Please refer Fig. S2 for the MSDs of all the concentrations used in this study. With an increase in the bacterial concentration, we observe a vertical shift of the MSDs supporting the increase in the overall velocity (see Fig.1). With increase in , we witness systematic variations in the exponent (where, ). As expected, pristine colloids without any added bacteria exhibit Brownian motion (). With an increase in the bacterial concentration up to , colloids exhibit short time super diffusive () motion, which eventually becomes random () at longer times Lagarde et al. (2020). The short-time super-diffusive behavior is a manifestation of the increased rate of collisions with bacteria. For much higher concentrations, , at short times suggesting a ballistic motion of colloids. At such high concentrations, the collective motion of bacteria transports colloids over large distances (see Fig.1(b)) supporting the initial ballistic motion, which is in accordance with the observations in inertial turbulence Xia et al. (2013). In addition, we observe an intermediate region displaying anomalous diffusion (). This is a distinctive characteristic of active turbulence and is in accordance with recent experiments Ariel et al. (2015) and simulations Mukherjee et al. (2021). Intriguingly, the time scales at which we observe shift towards lower time scales with an increase in bacterial concentration. This is a novel observation and the microscopic reasons underlying this is not yet clear. We may conceive that the initial ballistic and the intermediate anomalous dynamics of colloids suggest persistent motions over long length and time scales. Thus, probing the role of bacterial concentration on the length and time scales of the persistent motion may improve our understanding.
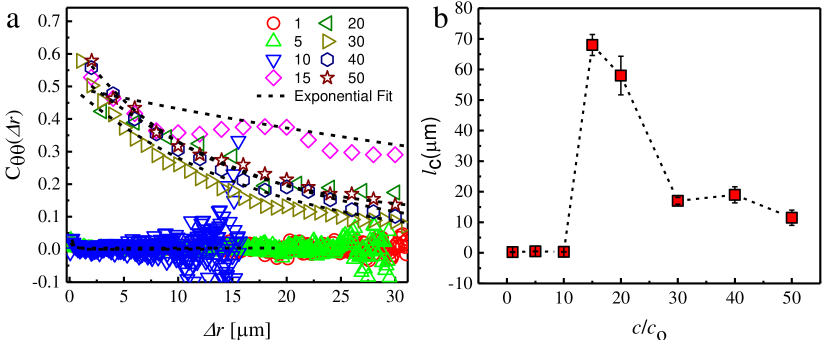
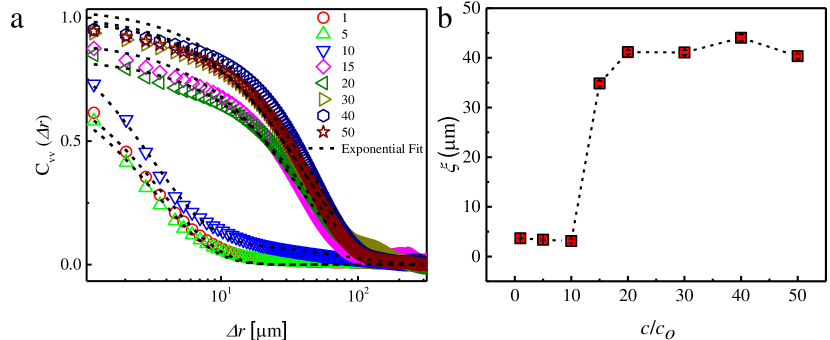
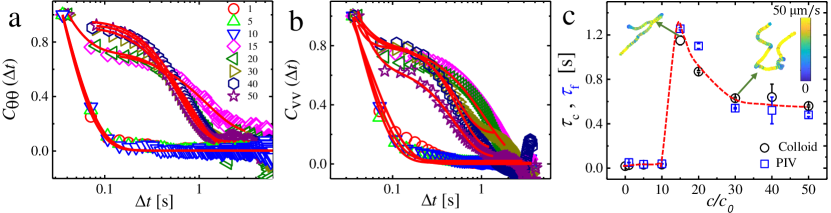
We rely on the orientation correlation function () of colloids to deduce persistence length and time [see section S3 for details]. Figure 3(a) depicts the time-dependent decay of the orientation correlation functions. Building on the equivalence of the Lagrangian and the Eulerian perspectives (see Fig. 1), we may expect the persistent motion of colloids to be a manifestation of the correlations in the underlying fluid. To capture this, we compute the velocity-velocity correlation function () and its temporal evolution. As depicted in Fig. 3(b), systematically decayed allowing us to capture a timescale for the velocity-velocity correlation. While and decay exponentially with a single relaxation time at low bacterial concentrations, colloids dispersed in dense bacterial fluids display two characteristic decays. Intriguingly, the long time decay of both and show a compressed exponential with exponents ranging from 1.2 to 1.8 [see Table S1] for the tabulation of the compressed exponents]. We tentatively interpret this compressed decay of the correlation functions as a manifestation of the highly driven dynamics of the colloids and fluid elements once the collective motion sets in the system. We may conceive that the faster decay of the correlation functions is related to the fluctuation of colloids and the longer relaxation times may depend on the timescale over which flow structures stay correlated. Thus, for understanding the microscopic dynamics of the fluids, we rely only on the longer relaxation times. As depicted in Fig. 3(c), the flow decorrelation time () and the persistent time of the colloids () are very similar, reassuring the fact that colloids simply act as tracers of the fluid flow. Intriguingly, both and had a maximum at the bacterial concentration , which marks the lowest concentration at which we observe the collective dynamics. Subsequently, and decreased and saturated at a lower value for higher bacterial concentrations. This is highly intriguing as with an increase in bacterial concentrations the overall activity, defined by the mean flow velocity, of the system increase (see Fig. 1(e)) monotonously. How do we understand a decrease in the persistent time with an increase in the overall activity? For systems with , the suspension becomes denser, and the overall activity (see fig.1(e)) increases. At much denser suspensions, the vortices start to mix faster and, affect the persistent motion of colloids (see the representative trajectories in Fig. 3(c)). This may explain the decrease in and after . Similarly, the persistence length [refer section S3 and Fig. S3(a)+(b)] of the colloid decreases for , corroborating that colloids follow loop-like trajectories at higher activity. The fluid correlation length increases discontinuously around the transition from isolated to collective dynamics [refer section S3 and Fig. S4(a)+(b)]. As reported earlier Sokolov and Aranson (2012); Xie et al. (2022b); Sokolov et al. (2007), irrespective of the flow activity, the correlation length is similar for all the concentrations exhibiting collective bacterial dynamics. On the one hand, collective motion increase the persistence time (and persistence length) over orders of magnitude. On the other, we observe a novel decrease in persistence with the activity of the system. Would these changes affect the way bacteria explore the available phase space?

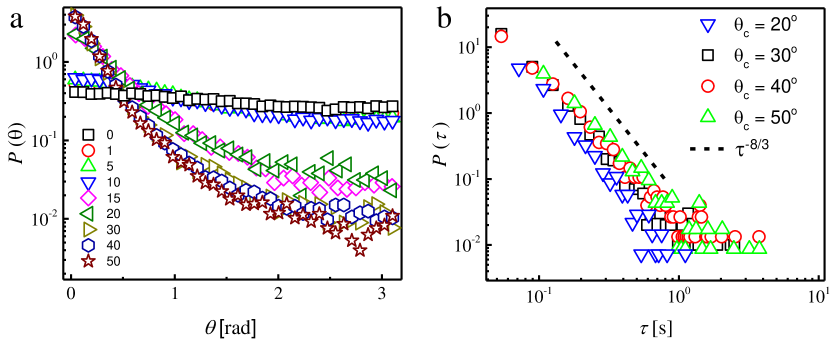
The long persistence time scales and length scales may suggest the presence of occasional lengthy steps, i.e., the Lévy walks Zaburdaev et al. (2015). It has been observed that active suspensions exhibit a notable presence of heavy tails in their space-time distribution Mukherjee et al. (2021); Ariel et al. (2015); Kurtuldu et al. (2011), indicative of the occurrence of Lévy-walk behavior and anomalous diffusion patterns Zaburdaev et al. (2015). Such lengthy steps in our experiments originate from the collective dynamics of underlying fluid and thus may reflect the spatiotemporal correlation scales of the bacterial fluid. Motivated by these results, we probe the geometrical nature of the colloidal trajectories exploring the existence of such long steps or correspondingly long times. We obtain the waiting times by dividing the trajectories into several segments based on the effective turning angle between the segments. This approach provides scope for precise analysis of the data and facilitates the calculation of waiting times corresponding to different step lengths. An angle change is recognized as a turn if , where for Fig. 4. Refer Fig. S5 (a)+(b) for the probability distribution of turn angles and of the distribution of waiting times corresponding to a few different turning angles. The time between two successive turns is considered as . The probability distributions of for different bacterial concentrations are shown in Fig. 4 (a)-(c). We observe important deviations in the distribution with increasing bacterial concentration. Without any added bacteria, the colloidal tracers exhibit a Gaussian distribution of waiting times as expected for random motion. However, with added bacteria, the distribution deviates from Gaussian and has an exponential tail (see continuous lines in Fig.4(a)) at long times. This observation suggests that the diffusion of colloids at low concentrations of bacteria exhibit Brownian (see long-time behavior of MSD in Fig. 2) yet non-Gaussian behavior. This is observed for tracer motion in various soft matter systems including colloids, polymers, and active suspensions Chechkin et al. (2017). Interestingly, once the large-scale collective motion emerges (for ), the probability follows a power law dependence with waiting time: . The local slope analysis shows for over a decade. According to the theoretical prediction, we expect for Zaburdaev et al. (2015). With , we obtain , which is identical to the intermediate exponent in MSD [refer Fig.2]. Step length distribution follows identical behavior and thus the joint probability of waiting time and step length [refer Fig. S6] follow a linear dependence suggesting a finite Lévy velocity. All these observations provide compelling evidence in favor of Lévy walk. Interestingly, the most active suspensions () exhibit a deviation from power law-like behavior at larger time scales, where a Gaussian distribution starts to set in. This highlights a transition from Lévy walk-like dynamics to diffusion-like dynamics at longer times.
What sets these transitions from Lévy to Gaussian for these systems, and why they are not visible in less active suspensions? We have seen that with an increase in activity, for the suspensions displaying collective motion, the flow correlation time and colloid persistence time decrease. Interestingly, the transition point for the distribution curves matches the flow correlation timescales and the persistence time of colloids (shown with the vertical dotted lines). Thus, in active suspensions, the timescale related to its flow sets an upper bound for the Lévy walk. In less active suspensions ( 15 and 20) the flow remains correlated for a longer time than our experimental window, and thus we could not capture the transition to Gaussian statistics. With higher activity, this critical timescale appeared within our experimental window, thus, we could capture the transition. These observations clearly demonstrate that enhanced activity reduces the duration of Lévy walk in bacterial turbulence. Earlier simulations Mukherjee et al. (2021) did not capture this transition and suggest the need for developing newer concepts and ideas.
To conclude, we experimentally capture three different microscopic dynamic regimes underlying bacterial turbulence: initial ballistic, intermittent Lévy walk, and the eventual Brownian dynamics. The fact that these transitions are marked by the intrinsic correlation time scales of the suspensions provides new insights into the Lagrangian description of Bacterial turbulence. The intriguing decrease in the duration of Lévy walk with the activity of the system needs further attention. We believe that the corroboration of the Lagrangian and the Eulerian perspectives highlights that our results are applicable not only to bacterial turbulence but also to collective dynamics observed in various systems.
Acknowledgement: We greatly acknowledge the fruitful discussions with Rahul Pandit from IISc, Sagar Chakraborty, and Jayanta K Bhattacharjee from IIT Kanpur. We thank the initial help of Muktesh, from BSBE IIT Kanpur, in setting up the bacterial cultures. Funding support from DST-FIST (SR/FST/PS-II/2021/170(C)), SERB (SRG/2021/001276), and STARS-MoE projects is greatly acknowledged.
References
- Doostmohammadi et al. (2018) A. Doostmohammadi, J. Ignés-Mullol, J. M. Yeomans, and F. Sagués, Nature Communications 9, 3246 (2018).
- Marchetti et al. (2013) M. C. Marchetti, J. F. Joanny, S. Ramaswamy, T. B. Liverpool, J. Prost, M. Rao, and R. A. Simha, Rev. Mod. Phys. 85, 1143 (2013).
- Ramaswamy (2017) S. Ramaswamy, Journal of Statistical Mechanics: Theory and Experiment 2017, 054002 (2017).
- Yeomans (2014) J. M. Yeomans, Nature Materials 13, 1004 (2014).
- Toner et al. (2005) J. Toner, Y. Tu, and S. Ramaswamy, Annals of Physics 318, 170 (2005), special Issue.
- Katz et al. (2011) Y. Katz, K. Tunstrøm, C. C. Ioannou, C. Huepe, and I. D. Couzin, Proceedings of the National Academy of Sciences 108, 18720 (2011), https://www.pnas.org/doi/pdf/10.1073/pnas.1107583108 .
- Ramaswamy (2010) S. Ramaswamy, Annual Review of Condensed Matter Physics 1, 323 (2010), https://doi.org/10.1146/annurev-conmatphys-070909-104101 .
- Cavagna et al. (2010) A. Cavagna, A. Cimarelli, I. Giardina, G. Parisi, R. Santagati, F. Stefanini, and M. Viale, Proceedings of the National Academy of Sciences 107, 11865 (2010), https://www.pnas.org/doi/pdf/10.1073/pnas.1005766107 .
- Dunkel et al. (2013a) J. Dunkel, S. Heidenreich, K. Drescher, H. H. Wensink, M. Bär, and R. E. Goldstein, Phys. Rev. Lett. 110, 228102 (2013a).
- Sokolov et al. (2007) A. Sokolov, I. S. Aranson, J. O. Kessler, and R. E. Goldstein, Phys. Rev. Lett. 98, 158102 (2007).
- Dombrowski et al. (2004) C. Dombrowski, L. Cisneros, S. Chatkaew, R. E. Goldstein, and J. O. Kessler, Phys. Rev. Lett. 93, 098103 (2004).
- Gachelin et al. (2014) J. Gachelin, A. Rousselet, A. Lindner, and E. Clement, New Journal of Physics 16, 025003 (2014).
- Sokolov and Aranson (2012) A. Sokolov and I. S. Aranson, Phys. Rev. Lett. 109, 248109 (2012).
- Xie et al. (2022a) C. Xie, Y. Liu, H. Luo, and G. Jing, Micromachines 13, 746 (2022a).
- Schwanbeck et al. (2021) J. Schwanbeck, I. Oehmig, U. Groß, A. E. Zautner, and W. Bohne, Frontiers in Microbiology 12 (2021), 10.3389/fmicb.2021.715220.
- Aranson (2022) I. S. Aranson, Reports on Progress in Physics 85, 076601 (2022).
- Cisneros et al. (2010) L. Cisneros, R. Cortez, C. Dombrowski, R. Goldstein, and J. Kessler, Animal Locomotion , 99 (2010).
- Shelley (2016) M. J. Shelley, Annual Review of Fluid Mechanics 48, 487 (2016), https://doi.org/10.1146/annurev-fluid-010814-013639 .
- Opathalage et al. (2019) A. Opathalage, M. M. Norton, M. P. N. Juniper, B. Langeslay, S. A. Aghvami, S. Fraden, and Z. Dogic, Proceedings of the National Academy of Sciences 116, 4788 (2019), https://www.pnas.org/doi/pdf/10.1073/pnas.1816733116 .
- Vicsek and Zafeiris (2012) T. Vicsek and A. Zafeiris, Physics Reports 517, 71 (2012), collective motion.
- Toner and Tu (1995) J. Toner and Y. Tu, Phys. Rev. Lett. 75, 4326 (1995).
- Toner (2018) J. Toner, “Why walking is easier than pointing: Hydrodynamics of dry active matter,” (2018).
- Qi et al. (2022) K. Qi, E. Westphal, G. Gompper, and R. G. Winkler, Communications Physics 5, 49 (2022).
- Saintillan and Shelley (2007) D. Saintillan and M. J. Shelley, Phys. Rev. Lett. 99, 058102 (2007).
- Alert et al. (2022) R. Alert, J. Casademunt, and J.-F. Joanny, Annual Review of Condensed Matter Physics 13, 143 (2022), https://doi.org/10.1146/annurev-conmatphys-082321-035957 .
- Alert et al. (2020) R. Alert, J.-F. Joanny, and J. Casademunt, Nature Physics 16, 682 (2020).
- Wensink et al. (2012) H. H. Wensink, J. Dunkel, S. Heidenreich, K. Drescher, R. E. Goldstein, H. Löwen, and J. M. Yeomans, Proceedings of the National Academy of Sciences 109, 14308 (2012), https://www.pnas.org/doi/pdf/10.1073/pnas.1202032109 .
- Dunkel et al. (2013b) J. Dunkel, S. Heidenreich, M. Bär, and R. E. Goldstein, New Journal of Physics 15, 045016 (2013b).
- Ariel et al. (2015) G. Ariel, A. Rabani, S. Benisty, J. D. Partridge, R. M. Harshey, and A. Be’er, Nature Communications 6, 8396 (2015).
- Kurtuldu et al. (2011) H. Kurtuldu, J. S. Guasto, K. A. Johnson, and J. P. Gollub, Proceedings of the National Academy of Sciences 108, 10391 (2011), https://www.pnas.org/doi/pdf/10.1073/pnas.1107046108 .
- Mukherjee et al. (2021) S. Mukherjee, R. K. Singh, M. James, and S. S. Ray, Phys. Rev. Lett. 127, 118001 (2021).
- Xia et al. (2013) H. Xia, N. Francois, H. Punzmann, and M. Shats, Nature Communications 4, 2013 (2013).
- Gokhale et al. (2022) S. Gokhale, J. Li, A. Solon, J. Gore, and N. Fakhri, Phys. Rev. E 105, 054605 (2022).
- Angelani (2019) L. Angelani, Journal of Physics: Condensed Matter 31, 075101 (2019).
- Dolai et al. (2018) P. Dolai, A. Simha, and S. Mishra, Soft Matter 14, 6137 (2018).
- Dikshit and Mishra (2022) S. Dikshit and S. Mishra, The European Physical Journal E 45 (2022), 10.1140/epje/s10189-022-00174-6.
- Leptos et al. (2009) K. C. Leptos, J. S. Guasto, J. P. Gollub, A. I. Pesci, and R. E. Goldstein, Phys. Rev. Lett. 103, 198103 (2009).
- Peng et al. (2016) Y. Peng, L. Lai, Y.-S. Tai, K. Zhang, X. Xu, and X. Cheng, Phys. Rev. Lett. 116, 068303 (2016).
- Wu and Libchaber (2000) X.-L. Wu and A. Libchaber, Phys. Rev. Lett. 84, 3017 (2000).
- Valeriani et al. (2011) C. Valeriani, M. Li, J. Novosel, J. Arlt, and D. Marenduzzo, Soft Matter 7, 5228 (2011).
- Murugan et al. (2019) P. A. Murugan, H. Chinnasamy, V, S. Hari, S. Abhas, and S. Matheshwaran, Microbiol. Resour. Announc. 8 (2019).
- Murugan et al. (2022) P. A. Murugan, M. K. Gupta, T. S. Sankar, S. Chandran, and S. Matheshwaran, bioRxiv (2022), 10.1101/2022.02.15.480532.
- Schneider et al. (2012) C. A. Schneider, W. S. Rasband, and K. W. Eliceiri, Nature Methods 9, 671 (2012).
- Thielicke and Stamhuis (2014) W. Thielicke and E. J. Stamhuis, Journal of Open Research Software 2 (2014), 10.5334/jors.bl.
- Thielicke and Sonntag (2021) W. Thielicke and R. Sonntag, Journal of Open Research Software (2021), 10.5334/jors.334.
- Lagarde et al. (2020) A. Lagarde, N. Dagès, T. Nemoto, V. Démery, D. Bartolo, and T. Gibaud, Soft Matter 16, 7503 (2020).
- Xie et al. (2022b) C. Xie, Y. Liu, H. Luo, and G. Jing, Micromachines 13 (2022b), 10.3390/mi13050746.
- Zaburdaev et al. (2015) V. Zaburdaev, S. Denisov, and J. Klafter, Rev. Mod. Phys. 87, 483 (2015).
- Chechkin et al. (2017) A. V. Chechkin, F. Seno, R. Metzler, and I. M. Sokolov, Phys. Rev. X 7, 021002 (2017).
Supporting Information
S1 Experimental Details
For the experiments, a 10 aliquot is taken from an overnight bacterial culture. This sample is then inoculated in 10 mL of Luria-Bertani (LB) media. The resulting mixture is carefully placed within a falcon tube, which is loosely sealed to allow for sufficient air exchange. Subsequently, the falcon tube is inserted into a shaking incubator operating at a temperature of C at 220 rpm. Afterward, the optical density (OD600) was quantified using a Bio spectrophotometer (Eppendorf AG 223331, Hamburg). The utilization of OD600 as a means to assess cell density in liquid culture is a common practice. The bacterium Bacillus subtilis IITKSM1 has been found to exhibit a cell density of approximately cells per milliliter when measured at an OD600 of 1. In order to initiate the experimental procedure, the bacterial samples were extracted from their growth phase, characterized by an OD600 range of 0.7-1.2.
Subsequently, the samples were subjected to centrifugation at a rate of 4000 rpm for a duration of ten minutes. The desired concentration can be achieved by mixing the settled part with the appropriate amounts of nutrient solution. In this study, the solution for the experiment was prepared by combining 50 of the bacterial solution with 5 of colloidal solution with a concentration of 0.5 . The effective concentration of colloids in the final bacterial solutions is ca. 0.04 . From this solution, we take 10 and put a drop on the glass slide. The glass slides were subjected to a thorough cleaning process utilizing the widely accepted standard RCA cleaning procedure. The cover slips utilized in this experiment have been freshly cleaned and possess hydrophilic properties. Consequently, when a drop is placed on the cover slips, it exhibits radial spreading. The drop diameter is measured to be around 1 cm, which gives a nearly flat surface near the center of the drop and possesses the least curvature effects. The colloidal motion is captured through a high-resolution time-lapse optical microscope, OLYMPUS BX53M.
S2 Movie analysis
In order to monitor and analyze the movement of colloids, we employed ImageJ. In the initial step, the experimental movie was converted into individual frames. Subsequently, these frames were further processed to generate binary files by applying an appropriate threshold. To distinguish the colloid from the background, we applied filters based on the size of the colloid. To model the geometrical nature of the colloidal trajectories, we relied on custom-made codes in MATLAB. For the Particle Image Velocimetry (PIV), we used the open-access Matlab PIV tool. The smallest pixel size for PIV was chosen to be 4 pixels.
S3 Length and time correlations
The orientational correlation of the colloid’s motion is calculated as:
| (1) |
is the displacement vector connecting points and , and is the angle between vectors and . Here, is the smallest time step accessible in our experiments and is a variable and can be any multiples of .
| (2) |
The orientational correlation of the colloid’s motion with distance is calculated as
| (3) |
Where is the angle between displacement vectors R, those are separated by a distance . For the averaging, we first calculate all the possible and plotted a histogram, then averaged the values of for every bin. The time correlation of fluid flow is calculated as follows:
| (4) |
Where represents the velocity field of fluid at a position , at time . To improve the statistics, the average is performed for all similar values.
The velocity-velocity space correlation is calculated as follows:
| (5) |
The average is performed for all similar values. The fitting of those functions has been implemented in ORIGIN-LAB.
S4 Turning angle and waiting time calculation
For the waiting time distribution, first, we calculated the turning angles for the trajectory. For this, we used equation 2 and calculated the turning angles for every time step (). For this analysis, we used . Turns are identified using a simple threshold , where we used four different viz 20∘, 30∘, 40∘, and 50∘. The waiting time is calculated as the time taken between those turns.
| 15 | 1.2 0.08 | 1.60.05 |
|---|---|---|
| 20 | 1.70.04 | 1.20.06 |
| 30 | 1.30.03 | 1.80.05 |
| 40 | 1.4 0.2 | 1.70.5 |
| 50 | 1.5 0.04 | 1.50.06 |