Impact of Black Swan Events on Ethereum Blockchain ERC20 Token Transaction Networks
Abstract
The Ethereum blockchain and its ERC20 token standard have revolutionized the landscape of digital assets and decentralized applications. ERC20 tokens developed on the Ethereum blockchain have gained significant attention since their introduction. They are programmable and interoperable tokens, enabling various applications and token economies. Transaction graphs, representing the flow of the value between wallets within the Ethereum network, have played a crucial role in understanding the system’s dynamics, such as token transfers and the behavior of traders. Here, we explore the evolution of daily transaction graphs of ERC20 token transactions, which sheds light on the trader’s behavior during the Black Swan Events – crypto crash and the COVID-19 pandemic. By using the tools from network science and differential geometry, we analyze billion of ERC20 token transaction data from November to January . Our analysis reveals that ERC20 financial ecosystem has evolved from a localized wealth formation period to a more mature financial ecosystem where wealth has dispersed among the traders in the network after the crypto crash and during the pandemic period. Before the crash, most sellers only sell the tokens, and buyers only buy the tokens. However, after the crash and during the pandemic period, sellers and buyers both performed buying and selling activities. In addition, we observe no significant negative impact of the COVID-19 pandemic on user behavior in the financial ecosystem.
keywords:
Ethereum Blockchain , Financial Networks , Transaction graph , Forman-Ricci Curvature1 Introduction
The growing enthusiasm worldwide to understand the financial ecosystem is largely due to several Black Swan events like the credit crisis of , the great depression of , the OPEC oil price shock of , the Asian crisis of 1997, and financial crisis [1, 2]. Modeling a financial system as a network has helped us to understand a wide range of phenomena crucial for financial professionals, economists, and researchers [3]. Analysis of a financial network sheds light on underlying salient features which may not be evident without the holistic approach of network science [5], thereby providing a better understanding of how the traders interact with each other and how their interactions affect the whole system [6, 7]. However, it was not as much of a success as thought it would be, as there exist constraints in modeling the underlying networks of traditional financial systems arising due to many reasons; for example, confidentiality issues where a financial institution or bank may not fully provide all the transaction details due to the intellectual property restrictions, and privacy rules. Consequently, various features of the traditional economy still need to be explored. We consider the Ethereum Blockchain transaction data to analyze the trader’s behavior during the crypto crash and the COVID-19 pandemic [8, 9].
Ethereum blockchain may be modeled using networks as entities are connected through transactions of many assets [10, 11, 12]. Initially, transaction graphs within the ERC20 token financial ecosystem were relatively simple and characterized by straightforward transfers between token holders. However, as the financial ecosystem evolved, transaction graphs became increasingly complex, reflecting the growth and diversification of token-related activities [13]. New patterns, including token swaps [14], lending protocols [15], and decentralized exchanges [16], led to intricate and intertwined transaction graphs. Analyzing and understanding ERC20 transaction graphs has become crucial for researchers, developers, and regulators seeking to comprehend token movements, identify patterns, and assess network health. Tools and techniques, such as graph analysis algorithms and visualization frameworks, have emerged to extract meaningful insights from transaction graphs, aiding in risk assessment, fraud detection, and market analysis within the Ethereum Financial Ecosystem [17, 18, 19, 20, 21]. A few existing works analyze the ERC20 transaction data and crypto crash [22]. However, the impact of critical events and the behavior of traders still needs to be discovered as the system is continuously evolving.
This article studies the impact of the crypto crash and the COVID-19 pandemic on the trader’s behavior of the ERC20 token transactions. We use network methods to model and analyze the structural and dynamic behavior of the blockchain’s transaction graphs. To examine the financial ecosystem, we create daily transaction graphs from November to January . We investigate the evolution of traders’ behavior in the Ethereum blockchain. Our analysis unveils that before the crash, most sellers only sell the tokens, and buyers only buy the tokens. Few transactions among the small traders lead to the localization of wealth among the individual traders. However, after the crash and during the pandemic, the seller sells the token, and buyers buy the token. But at the same time, the seller buys the tokens, and the buyer sells the token leading to the dispersal of the wealth among the traders and making the ERC20 financial ecosystem more stable during the pandemic. In addition, we show no significant negative effect of the COVID-19 pandemic on user behavior in the financial system.
The article is organized as follows: Section 2 discusses preliminaries of the Ethereum Blockchain and ERC20 tokens. Section 3 illustrates the details of the extraction and preprocessing of the ERC20 transaction data and the modeling of the daily transaction network. It also contains the notations and definitions used in the later discussions. Section 4 explains the results and analysis. Finally, section 5 summarizes the current study and discusses the open problems for further investigation.
2 Preliminary
Blockchain is an underlying technology on which the famous cryptocurrency, BitCoin, was built; nowadays, blockchain applications are widespread, which cover supply chains, financial services, healthcare, and public registers [23, 4, 24, 25]. The core components of blockchain are transparency and trustlessness, through which transactions are validated and broadcasted. In the blockchain financial ecosystem, a block comprises several transactions and is linked to its previous block via a digital link, thus forming a chain of blocks.
2.1 Ethereum Blockchain
In the year 2015, Ethereum came into existence [8]. Ethereum allows for the creation and direct peer-to-peer exchange of digital assets without intermediaries. Ethereum platform is a software built on blockchain technology that enables the creation of cryptocurrency (Ether), crypto-assets (e.g., ERC20 tokens, ERC721 tokens [26]), and Decentralized Applications (DApps) [27]. The Ethereum blockchain is a digital ledger where Ether and crypto-assets can be securely stored and exchanged. Ether is the backbone of the platform, which facilitates transactions and pays for the deployment of smart contracts on the Ethereum Blockchain.
The primary focus of the platform is to use decentralized blockchain technology for smart contracts [25, 28]. The smart contract is a computer protocol used to create and develop DApps, and crypto assets. Smart contracts are conditional codes on the blockchain executed when smart contract conditions are met. In other words, they are statements written in the form of code and deployed on the blockchain. For example, a certificate contract in which the smart contract will provide the certificate when the participants attend the required number of classes of a course and score more than or equal to 60 marks in that course. The usage of smart contracts is very diverse and includes digital identity, real estate [29], insurance, flash loans [15], gaming [30], and decentralized finance [15].

In the Ethereum Financial ecosystem, users interact with the Ethereum network through their Ethereum account. With the help of accounts, users can transfer assets, create or invoke smart contracts, and interact with DApps [8]. A user account consists of a -byte public address (like a bank account number) with the prefix (e.g., ), which other users use to transfer assets. A transaction in the Ethereum platform can execute various things, such as transferring assets (ERC20 tokens), deploying smart contracts, and triggering the smart contract [8]. To deploy a smart contract, a person uses an Ethereum account and sends a transaction containing compiled code of the smart contract without the recipient of the transaction [31]. This article limits our discussion to the transactions related to the ERC20 tokens.
2.2 ERC20 Token
Ethereum Blockchain platform provides a more accessible opportunity for companies and individuals to develop blockchain products instead of building their own blockchain platform [13]. The Ethereum Request for Comment 20 (ERC20) standard allows developers to create smart contract-enabled tokens that can be used with other products and services, such as DApps on the Ethereum network, which started on Nov [32]. Sometimes we refer to tokens and coins as the same, but they are different in what they represent and their functions. In both cases, they are digital assets, but the coin is a native asset of the platform, which facilitates operations on the platform, whereas tokens are built on the platform for the creation and flow of wealth. For instance, Ether is the native coin of Ethereum, and Polygon MATIC [33] and USDT [34] are tokens built on the Ethereum platform.
In the Ethereum Blockchain, the digitalization of the value of a particular asset into tradeable digital units is known as tokenization, and the digital assets are represented as tokens. Tokens allow a seamless, borderless, and almost free flow of value in the form of digital assets across the globe. Once any product is tokenized, these tokens can be managed, detected, accounted for, and leveraged in the context of incentives that may promote fair wealth. For example, XAUt (Tether Gold) is a token representing gold as a digital token on the Ethereum platform. One XAUt token equals grams of gold. Hence, XAUt tokens digitally represent the value associated with gold assets so that they can be traded across the globe using the Ethereum Platform. The above example of the XAUt token is an asset-backed token; there are various other types of tokens on the Ethereum platform with multiple functions and features [32].
The ERC20 token can be created by any individual or organization that defines the rules governing them, such as monetary policy, token features, user incentive systems, etc. The current market cap of Ethereum is approximately , and ERC20 tokens are approximately , around of the total Ethereum blockchain [35]. A high market capitalization implies that the market highly values the asset, and our interest lies in studying the trader’s behavior involved in ERC20 token transaction.
3 ERC20 Token Transaction Data and Network Modeling
3.1 Transaction Data sets
To analyze the underlying network of ERC20 transactions in the Ethereum Blockchain, we use the past years of ERC20 transaction data [36]. We analyzed ERC20 token transaction data from November to January . The data set consists of columns (Fig. 1); each column gives us specific information regarding the ERC20 transaction data and can be summarized as follows.
-
1.
blockNumber: block number in which the transaction information has been stored.
-
2.
timeStamp: time in which the block was minted, and every transaction in a block has the same timestamp.
-
3.
transactionHash: unique identifier that serves as proof of transaction validation.
-
4.
tokenAddress: the hash value refers to the actual smart contract address of the ERC20 token, which also acts as an identifier for an ERC20 token.
-
5.
from: address of the sender of ERC20 token
-
6.
to: address of the receiver of ERC20 token
-
7.
fromisContract: if this field value is , it signifies the ‘from’ column is a smart contract address otherwise an externally owned account address.
-
8.
toisContract: if this field value is , it signifies the ‘to’ column is a smart contract address otherwise an externally owned account address.
-
9.
value: tells about the number of tokens transferred
Each row provides information about an ERC20 token transaction in the data set. The ‘from’ and ‘to’ columns are the addresses between whom the transaction has taken place (Fig. 1). For our analysis, we use four columns ‘timeStamp’, ‘tokenAddress’, ‘from’, and ‘to’. The ‘timestamp’ column is in seconds, which we convert into () format. For instance, after transforming the timestamp in Fig. 1, becomes where base time () is considered standard time UTC [37]. The rest of the three columns’ data are in hash value which is very difficult to analyze. For better viewing and analyzing the data, we iterated over the ‘from’ and ‘to’ columns and mapped every unique address with a unique integer number. The same iteration process is carried out for the ‘tokenAddress’ column. Finally, we divide the whole data set in day-wise.
3.2 Transaction Network
To model the ERC20 transaction data, we use the graph model [38]. In the Ethereum Financial Ecosystem, wallets are the nodes that buy or sell ERC20 tokens, and transactions between two wallets are the edges (links). For instance, let wallets make a transaction in which sends token to , then the link will be directed from to (). Further, if a wallet, makes transactions with other wallets ( and ) in a day, then there will be two directed edges between the nodes as and . Here, the node has out-degree and both having in-degree . A node can have edges with another node if it makes transactions with the same node in a day with different tokens; then, there will be parallel edges between them. Therefore, ERC20 token transaction graph is a multi-edges directed graph consisting of source and target nodes, where source nodes are the wallets that sell the ERC20 tokens, and target nodes are the wallets that buy the ERC20 tokens. We can think of tokens as the attributes on the edges of the transaction graphs (Fig. 1). The transaction graph for a given day , represented as (, ) where set of vertices () consists of all wallets trading during that day as [17]
| (1) |
and the set of edges is defined as:
| (2) |
We denote the adjacency matrices corresponding to multi-edge directed graph as and which can be defined as if there are edges from to and otherwise. The out-degree of a node, on day can be represented as and in-degree as . The average out-degree and in-degree of can be defined as and , respectively. Here, we consider number of wallets participated on day as , and number of transactions as , thus . Further, a node that sent the maximum number of transactions in a day as a max-out-degree node and represented as . Similarly, a node that receives a maximum number of transactions in a day as max-in-degree and defined as . We can define sets containing all the nodes having out-degree equal to as and in-degree equal to as , where and , are the number of elements inside the sets [17]. Hence, sets containing all the nodes having out-degree and in-degree equal to as and , where , and . From the economic perspective – is a wallet that is a maximum selling hub, is a wallet that is a maximum buying hub, is the number of wallets which sell once and is the number of wallets which buy once on a daily basis. Note that in the later discussion, we omit from the above notations for convenience.
4 Results and Discussion
In January , the Ether price reached its record high of , and by the middle of December 2018, the Ether price was down by [39]. This period was marked as the Crypto Market Crash, where various other cryptocurrencies also hit record lows [40]. On the other hand, in March , COVID-19 was declared a pandemic by the World Health Organization, resulting in severe societal and economic ramifications worldwide [41]. During these events, significant changes occurred in the trading behavior of the Ethereum ERC20 Financial Ecosystem. To understand, we analyze the behavior of the daily transaction graphs.
4.1 Dynamics of the System
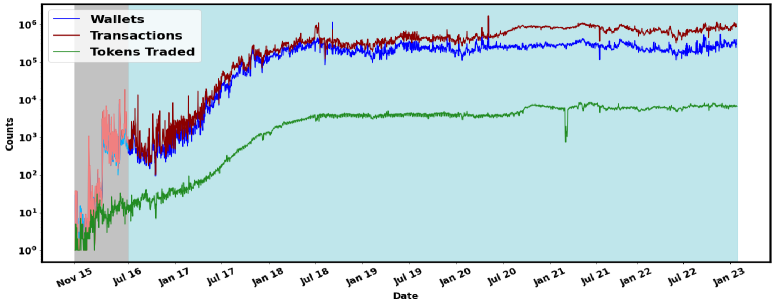
After the inception of Ethereum ERC20 tokens, the number of wallets and transactions was lower; however, after July 2016, we can see a notable increase in the development of nodes, edges, and the volume of tokens traded over time (Fig. 2). After July , the everyday number of wallets (nodes) involved in trading is approximately constant. Still, the number of daily transactions (edges) increases gradually, which infers the growing activity between the wallets of the Ethereum ERC20 Financial Ecosystem. From the daily transaction graph, we can also predict that on average, wallets perform around transactions, and on average, distinct types of tokens traded (Fig. 2).
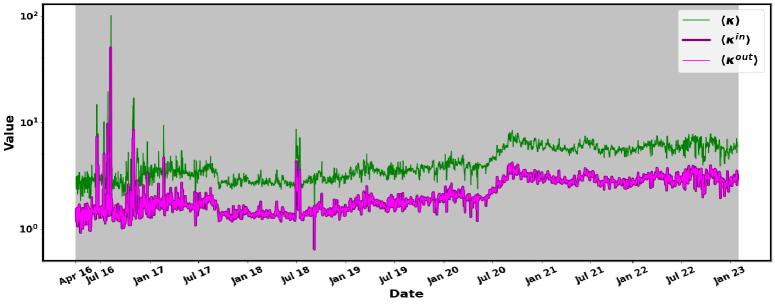
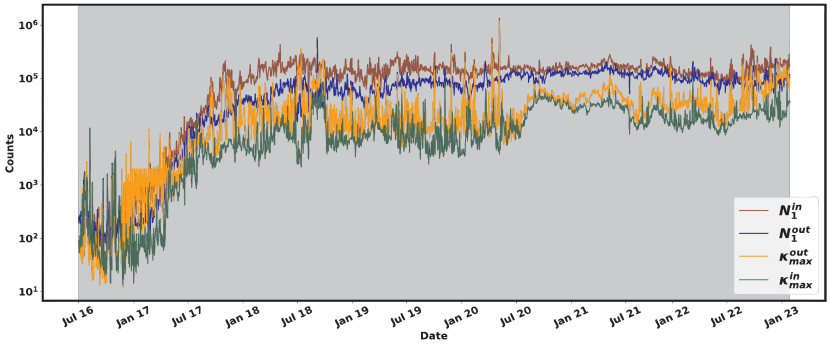
Additionally, for the initial period, the average number of transactions carried out by wallets per day is around and gradually grows to around after July (Fig. 3). However, if we separately look into the average out-degree and in-degree, it is close to . On the contrary, Fig. 4 reveals that the max-out-degree () is very large as compared to the average out-degree (). Also, we can notice a large number of nodes having one out-degree (). Similar, behavior for the max-in-degrees (, and ). It infers degree distribution might be heavy-tailed where and are the extreme points of the degree distribution [17]. If we randomly pick a daily transaction graph, it shows a heavy-tailed degree distribution for both the out-degrees and in-degrees. The out-degree distribution is of the seller’s wallet, and the in-degree distribution is of the buyer’s wallet of the ERC20 token. The distribution clearly shows that the Ethereum ERC20 Financial Ecosystem follows heavy-tailed distribution for daily transaction graphs, which coincides with numerous previous works showing that the degree distribution of blockchain transaction data is heavy-tailed [13, 17].
To get insights on the buyers’ and sellers’ behavior before and after the crypto crash, we examine the dynamical behavior of the extreme points of degree distribution – maximum selling hub (), number of wallets which sell once (), maximum buying hub (), and the number of wallets which buy once () daily (Fig. 4). We observe that until July , all four variables grow substantially. But after that, the number of wallets buying once daily reached stability. In contrast, the number of wallets selling once is still gradually increasing but not substantially, and there is a decrease in the maximum selling and buying hub until July (Fig. 4).
Furthermore, we calculate the ratios between the extreme points of the degree distribution for each day. In that case, we can observe significant changes in the network’s global dynamics during the crypto crash and the COVID-19 pandemic. We can define the ratio as follows [17]
| (3) |
The ratios show the interplay between the buyers’ and sellers’ behavior of the Ethereum ERC20 token transactions and provide insight into their evolution over time. We can observe high volatility in the dynamics of the ratios (Fig. 6). However, close observation of and reveals a change in the dynamical behavior of the ratios before and after the crypto crash, which suggests a change in the trader’s trading behavior. The moving average of the ratios denoted as and can prominently show the behavioral changes of the buyers and sellers. We remark that before July ,
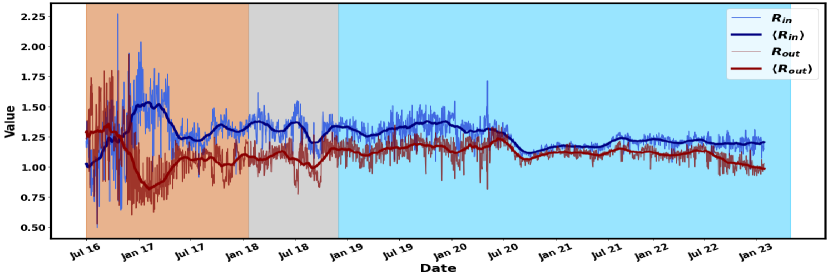
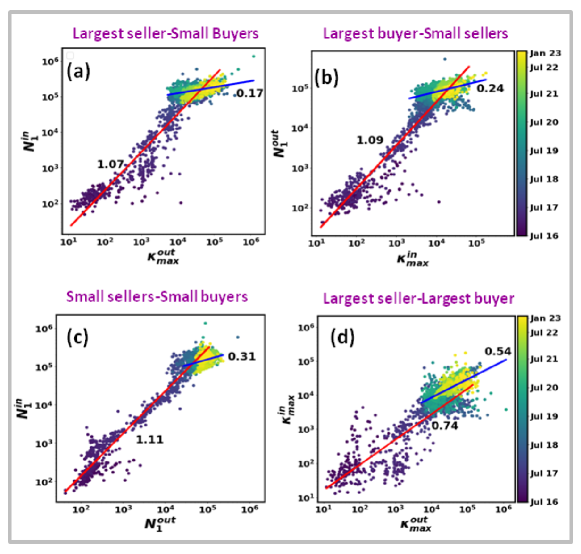
when buyers’ activity () increasing, sellers’ activity () decreasing and vice-versa (Fig. 6). We characterize this day-wise phenomenon in transaction graphs as anti-phased oscillations [17]. Notably, after July , there was a co-movement of the buyers’ and sellers’ activity (Fig. 6). The daily transaction graph size is very large and dynamic, so it is difficult to understand the internal behavior. Therefore, we use the correlation measure and regression analysis among the variables in Eq. (3). Anti-phase oscillation of and to each other in the initial period is resulted due to a strong correlation between entities in Eq. (3) – maximum selling hub () vs. number of wallets buying once (), and maximum buying hub () vs. the number of wallets selling once () (Fig. 7(a-b)). Simultaneously, the correlation between the number of wallets selling once vs. the number of wallets buying once, and a weak correlation between the maximum buying hub and maximum selling hub (Fig. 7(c-d)). The slopes in the regression analysis also show that after July , the value of the slope decreases (Fig. 7)(a-b). From the correlation and slope analysis, we might conclude that during the initial period, most of the transactions of the small traders are with big traders, fewer among small traders, and similarly, fewer transactions between big traders.
However, after July , both and show co-movement to each other, which grows stronger over the period, especially after July (COVID-19 period). We observe the co-movement of the ratios lead to a decrease in the correlations between the maximum selling hub and the number of wallets buying once (Fig.7(a)), as well as the maximum buying hub and the number of wallets selling once (Fig. 7(b)). Simultaneously, there is an increase in the correlation between the number of wallets selling and buying once and between maximum buying and selling hubs (Fig.7(c-d)). One can notice the decrement of the slopes during the co-movement for relations and an increase in other relations.
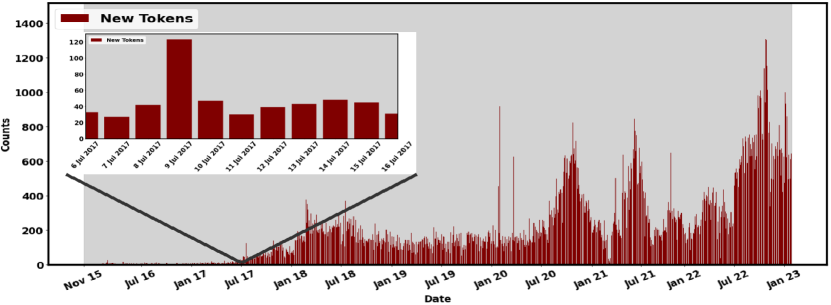
In other words, the increase in the trading activity among small traders and among the big traders, and at the same time, a decrease in the trading activity between big traders and small traders has resulted in the co-movement of the ratios. From the above analysis of trading activity before and after the crypto crash, there is an evolution in the trading behavior of the traders. Before the crash, small traders perform most of the transactions with the big traders, but after the crash, small traders make most of the transactions among themselves. Also, there was an increase in trading activity among the big traders after the crash. Further from the dynamics of ratios, we observe a stronger co-movement during the pandemic period, which indicates the absence of a significant impact of COVID-19 on the trading behavior of the traders in the Ethereum platform. However, volatility exists in the evolution of the new ERC20 token inclusion to the platform during the COVID-19 period, whereas, after the crypto crash, the dynamics remained constant until July (Fig. 5). Note that the key difference between correlation and regression is that correlation measures the degree of a relationship between two independent variables. In other words, the correlation between two variables captures how both variables are related. In contrast, regression is how one variable affects another. Both of the measures can not say whether variables are directly interacting with each other or not.
4.2 Forman-Ricci curvature analysis
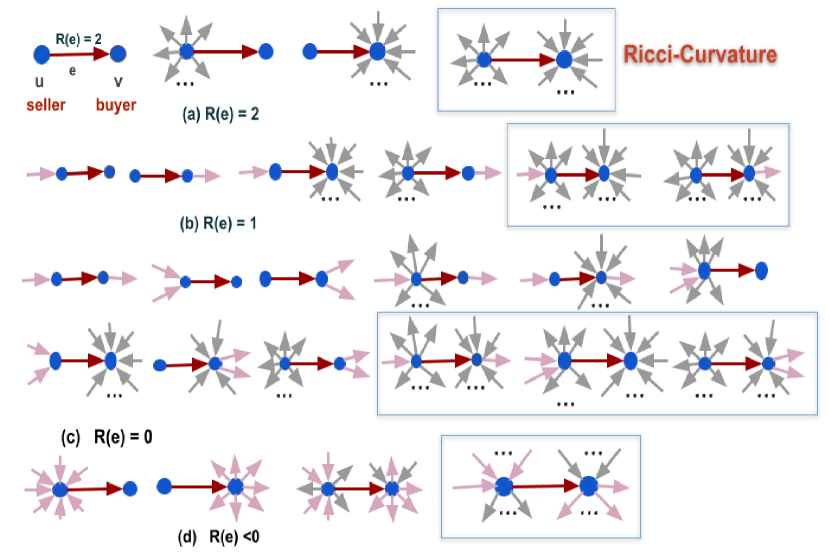
Now we use discrete Forman-Ricci curvature of networks introduced by R. Forman [42] to provide better insight into the trading behavior of the system. Forman-Ricci curvature is an edge-based concept that measures how fast edges spread in different directions [42]. Importantly, edges with negative curvature are vital in spreading information in a network. Previously, it has been used to characterize complex networks, which yield insights into their dynamical structure [43]. Since our networks are directed, we use the Forman-Ricci curvature of directed networks. The curvature of a directed edge of weight , is defined as follows:
| (4) |
where , are the edges connected to node , and , are weights associated with the edges, respectively. Here, we only consider those directed edges that terminate at node and originate at node . Since edges are unweighted, the above expression (Eq. (4)) reduces to
| (5) |
where is the seller wallet, is the buyer wallet and is the transaction from to . Here, as and . The curvature infers the structural properties of a network. Fig. 8 shows some examples of the respective curvature of edges and the structure around them.
The positive curvature of an edge infers limited types of trading activity between seller and buyer (Fig. 8). For instance, if a seller wants to buy more than times or a buyer wants to sell more than times, it can not be captured by the positive curvature (Fig. 8(a-c)). In other words, positive curvature refers to buyer-seller interaction with other traders in an isolated or restricted manner. There are few in-degree of the seller and fewer out-degree of the buyer, so wealth flows across the wallets in the network will be very slow and sometimes localized among peers (Fig. 8). On the other hand, the negative curvature of an edge refers to various trading activities carried out by the seller and buyer. It infers that the seller and the buyer can buy and sell multiple times. Therefore, increasing negative curvature infers dispersion of wealth across the network.
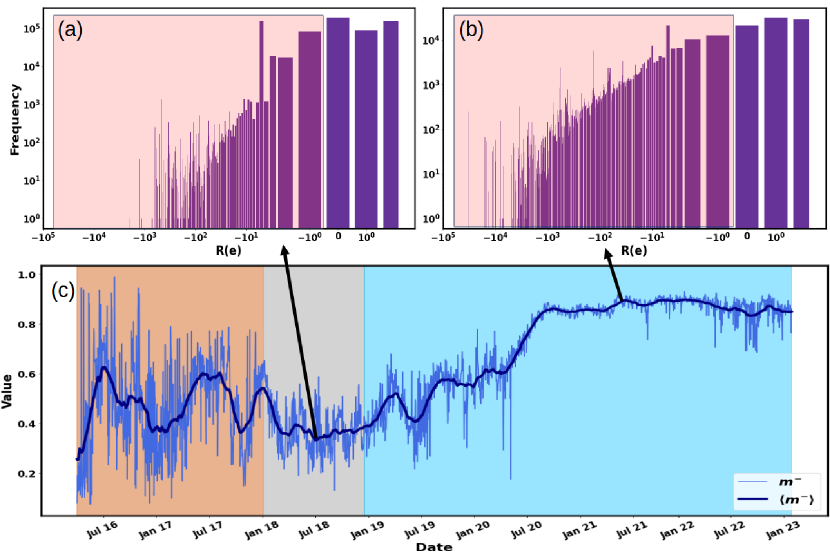
We calculate the fraction of edges () contributing to the negative Ricci curvatures for the daily transaction network (Fig. 9). We observe an increase in the fraction over time; it signifies an increase in the trading activity among the traders where simultaneously the seller sells and buys the tokens (Fig. 9(c)). Similarly, buyers can also buy and sell the tokens. It shows the evolution in the behavior of the traders, where before the COVID-19 pandemic, most of the sellers only sold the tokens and buyers only bought the tokens, which resulted in a small percentage of edge with negative Ricci curvature, thus resulting in large positive Ricci curvature, and wealth localizes among the buyers (Fig. 9(c)). However, after the crypto crash and during the COVID-19 pandemic, sellers and buyers both performed buying and selling activity which led to an increase in the percentage of edges having negative Ricci curvature value. Notably, one can observe that during both events, the number of daily transactions remains stable; only the trader’s behaviors change.
5 Conclusion
In conclusion, the evolution of transaction graphs within the Ethereum blockchain’s ERC20 token financial ecosystem from simple token transfers to complex DeFi protocols [15] reflects on the growth, complexity, and innovation occurring in the tokenized economy. Understanding and harnessing the insights from transaction graphs will be pivotal in addressing scalability challenges, fostering regulatory compliance, and unlocking opportunities for decentralized finance and digital asset utilization.
Using complex network analysis and differential geometry tools, we analyzed the dynamic evolution of transaction graphs in the ERC20 token financial ecosystem. We observed the evolution in the trading activity of the traders and the dynamics of ERC20 tokens in the financial ecosystem. We focused here on two big events - the crypto crash and the COVID-19 pandemic. We started the investigation by analyzing the evolution of wallets, transactions, and tokens for the period of November 2015 to January 2023. There existed a constant addition of new tokens to the financial ecosystem until the pandemic; however, after that, there were fluctuations. Our analysis of the daily transaction graphs unveiled that before the crash, the trading activities of the traders led to the localization of wealth among individual traders. However, after the crash and during the pandemic, the change in trading activity by most traders led to the dispersal or continuous flow of wealth over the network.
Here though, we used the extreme points of the degree distribution, incorporating other variables ( and ) in the analysis can provide more insight into the system which requires further investigation. Moreover, we use fields from the extracted data, and including other data, fields can provide greater insights into the financial ecosystem’s underlying features. For instance, if we include the ‘value’ field, the transaction networks become weighted and can provide insights into the flow of wealth in the financial ecosystem during the black swan events. Here, we examined the pairwise interactions of the transaction data, which cannot capture the higher-order interactions of the traders’ behavior [44]. We intend to pursue higher-order interactions, which will provide insights into the existence and role of simultaneous many-body interactions in the financial market. As financial ecosystems continue to mature, further research and innovation in transaction graph analysis will be essential to unlock the full potential of ERC20 tokens and drive the adoption of decentralized applications built on the Ethereum blockchain.
6 Acknowledgement
MP is thankful to the Complex Systems Lab (IIT Indore) members for the useful discussion. SJ acknowledges DST grant . PP acknowledges SERB grant .
References
- [1] N. Nicholas, The black swan: the impact of the highly improbable, Journal of the Management Training Institut 36, no. 3, 56 (2008).
- [2] P. Bondarenko, 5 of the World’s Most Devastating Financial Crises, Encyclopedia Britannica, https://www.britannica.com/list/5-of-the-worlds-most-devastating-financial-crises
- [3] M. Bardoscia, P. Barucca, S. Battiston, F. Caccioli, G. Cimini, D. Garlaschelli, F. Saracco, T. Squartini, G. Caldarelli. The physics of financial networks. Nat. Rev. Phys. 3, no. 7, 490-507 (2021).
- [4] K. Patil, D. Ojha, E. M. Struckell, P. C. Patel. Behavioral drivers of blockchain assimilation in supply chains–A social network theory perspective. Technological Forecasting and Social Change 192, 122578 (2023).
- [5] Caldarelli, G., Battiston, S., Garlaschelli, D., Catanzaro, M. Emergence of Complexity in Financial Networks. In: Ben-Naim, E., Frauenfelder, H., Toroczkai, Z. (eds) Complex Networks. Lecture Notes in Physics, vol 650. Springer, Berlin, Heidelberg, (2004).
- [6] N. Paltalidis, D. Gounopoulos, R. Kizys, Y. Koutelidakis, Transmission channels of systemic risk and contagion in the European financial network, Journal of Banking & Finance, Volume 61, Supplement 1, Pages S36-S52, (2015).
- [7] G. Prasanna, K. Sujit, Contagion in financial networksProc. R. Soc. A.4662401–2423, (2010).
- [8] V. Buterin, A next-generation smart contract and decentralized application platform, white paper 3, no. 37, 2-1 (2014).
- [9] A. Day, E. Medvedev, Ethereum in BigQuery: a Public Dataset for smart contract analytics, 2018.
- [10] L. Zhao, S. S. Gupta, A. Khan, and R. Luo, Temporal analysis of the entire Ethereum blockchain network, In Proceedings of the Web Conference 2021, pp. 2258-2269, 2021.
- [11] S. Somin, G. Gordon, and Y. Altshuler. Network analysis of ERC20 tokens trading on ethereum blockchain. In Unifying Themes in Complex Systems IX: Proceedings of the Ninth International Conference on Complex Systems 9, pp. 439-450. Springer International Publishing, 2018.
- [12] X. L. Tong, A. Khan, S. S. Gupta, Y. H. Ong, and X. Liu. Measurements, analyses, and insights on the entire ethereum blockchain network. In Proceedings of The Web Conference 2020, pp. 155-166. 2020.
- [13] Victor, Friedhelm, and B. K. Lüders, Measuring Ethereum-based erc20 token networks, In Financial Cryptography and Data Security: 23rd International Conference, pp. 113-129. Springer International Publishing, 2019.
- [14] Y. C. Lo, F. Medda, Uniswap and the Emergence of the Decentralized Exchange, Journal of Financial Market Infrastructures 10, no. 2, 1-25 (2021).
- [15] D. A. Zetzsche, D. W. Arner, R. P. Buckley, Decentralized Finance (DeFi), Journal of Financial Regulation,6, 172–203,(2020).
- [16] S. Malamud, M. Rostek, Decentralized Exchange, American Economic Review, 107 (11): 3320-62, (2017)
- [17] S. Somin, Y. Altshuler, G. Gordon, A. S. Pentland, and E. Shmueli. Network dynamics of a financial ecosystem. Scientific Reports 10, no. 1, 4587, (2020).
- [18] Y. Li, U. Islambekov, C. Akcora, E. Smirnova, Y. R. Gel, M. Kantarcioglu. Dissecting Ethereum blockchain analytics: What we learn from topology and geometry of the Ethereum graph? In Proceedings of the 2020 SIAM international conference on data mining, pp. 523-531. Society for Industrial and Applied Mathematics, 2020.
- [19] J. Liang, L. Li, D. Zang, Evolutionary dynamics of cryptocurrency transaction networks: An empirical study, (2018)
- [20] Wang, J., Chen, P., Yu, S., Xuan, Q. TSGN: Transaction Subgraph Networks for Identifying Ethereum Phishing Accounts. In: Dai, HN., Liu, X., Luo, D.X., Xiao, J., Chen, X. (eds) Blockchain and Trustworthy Systems. BlockSys 2021. Communications in Computer and Information Science, vol 1490. Springer, (2021).
- [21] S.Ferretti, G D’Angelo. On the Ethereum blockchain structure: A complex networks theory perspective, Special Issue on Cryptocurrencies and Blockchain for Distributed Systems, Volume 32, Issue 12, (2019).
- [22] V. N. Soloviev, A. Belinskiy, Complex systems theory and crashes of the cryptocurrency market, In Information and Communication Technologies in Education, Research, and Industrial Applications: 14th International Conference, pp. 276-297, (2019).
- [23] D. Yaga, P. Mell, N. Roby, K. Scarfone, Blockchain Technology Overview, (2019).
- [24] J. Y. Huumo, D. Ko, S. Choi, S. Park, K. Smolander, Where is current research on blockchain technology? - A systematic review, PloS one 11, no. 10, e0163477 (2016).
- [25] P. Dutta, , T. M. Choi, S. Somani, R. Butala, Blockchain technology in supply chain operations: Applications, challenges, and research opportunities, Transportation research part E: Logistics and Transportation review 142, 102067 (2020).
- [26] F. Valeonti, A. Bikakis, M. Terras, C Speed, A. H. Smith, K. Chalkias, Crypto Collectibles, Museum Funding and OpenGLAM: Challenges, Opportunities and the Potential of Non-Fungible Tokens (NFTs). Appl. Sci. 2021, 11, 9931.
- [27] R. Taş, Ö. Ö. TanriÖver, Building A Decentralized Application on the Ethereum Blockchain, 2019 3rd International Symposium on Multidisciplinary Studies and Innovative Technologies (ISMSIT), Ankara, Turkey, 2019, pp. 1-4,
- [28] K. Christidis and M. Devetsikiotis, Blockchains and Smart Contracts for the Internet of Things, in IEEE Access, vol. 4, pp. 2292-2303, (2016).
- [29] A. Gupta, J. Rathod, D. Patel, J. Bothra, S. Shanbhag, T. Bhalerao, Tokenization of real estate using blockchain technology, In Applied Cryptography and Network Security Workshops: ACNS 2020 Satellite Workshops, Proceedings 18, pp. 77-90. Springer International Publishing, (2020).
- [30] K. Iyer, C. Dannen, Building Games with Ethereum Smart Contracts. New York: Apress, 2018.
- [31] D. Mohanty, Deploying Smart Contracts. In: Ethereum for Architects and Developers. Apress, Berkeley, CA, (2018).
- [32] O. Luis, Z. Liudmila, B. Ingrid, S. Gerhard, To Token or not to Token: Tools for Understanding Blockchain Tokens. In: International Conference of Information Systems (ICIS 2018).
- [33] J. Kanani, S. Nailwal, A. Arjun, Matic whitepaper, Polygon, Bengaluru, India, Tech. Rep., (2021).
- [34] S. Aggarwal, N. Kumar, Cryptocurrencies., In Advances in Computers, vol. 121, pp. 227-266, Elsevier, (2021).
- [35] Ethereum Market Cap, collected on Jul 11 2023 https://ycharts.com/indicators/ethereum_market_cap
- [36] P. Zheng, Z. Zheng, J. Wu, H. N. Dai, Xblock-eth: Extracting and exploring blockchain data from ethereum. IEEE Open Journal of the Computer Society, 1, 95-106, (2020). http://xblock.pro/xblock-eth.html
- [37] Unix time, https://en.wikipedia.org/wiki/Unix_time.
- [38] S. H. Strogatz, Exploring complex networks. Nature 410, no. 6825 (2001): 268-276.
- [39] O. Godbole, Ether Price Now Down 94% from January’s Record High, coindesk (2018). https://www.coindesk.com/markets/2018/12/07/ether-price-now-down-94-from-januarys-record-high/
- [40] N. Kyriazis, S. Papadamou, S. Corbet, A systematic review of the bubble dynamics of cryptocurrency prices, Research in International Business and Finance 54: 101254, (2020).
- [41] S. Barua, Understanding Coronanomics: The Economic Implications of the Coronavirus (COVID-19) Pandemic (2020).
- [42] E. Saucan, A. Samal, M. Weber, J. Jost, Discrete curvatures and network analysis, MATCH Commun. Math. Comput. Chem. 80, 605-622, (2018).
- [43] M. Weber, E. Saucan, J. Jost, Characterizing complex networks with Forman-Ricci curvature and associated geometric flows. Journal of Complex Networks 5, no. 4: 527-550, (2017).
- [44] F. Battiston, E. Amico, A. Barrat, G. Bianconi et al. The physics of higher-order interactions in complex systems. Nature Physics 17, no. 10 (2021): 1093-1098.