Flexible heat pumps: must-have or nice to have in a power sector with renewables?
Abstract
Heat pumps are a key technology for reducing fossil fuel use in the heating sector. A transition to heat pumps implies an increase in electricity demand, especially in cold winter months. Using an open-source power sector model, we examine the power sector impacts of a massive expansion of decentralized heat pumps in Germany in 2030, combined with buffer heat storage of different sizes. Assuming that the additional electricity used by heat pumps has to be fully covered by renewable energies in a yearly balance, we quantify the required additional investments in renewable energy sources. If wind power expansion potentials are limited, the roll-out of heat pumps can also be accompanied by solar PV with little additional costs, making use of the European interconnection. The need for additional firm capacity and electricity storage generally remains limited even in the case of temporally inflexible heat pumps. We further find that relatively small heat storage capacities of 2 to 6 hours can substantially reduce the need for short- and long-duration electricity storage and other generation capacities, as well as power sector costs. We further show that 5.8 million additional heat pumps save around 120 TWh of natural gas and 24 million tonnes of CO2 emissions per year.
1 Introduction
In light of the climate crisis, heat pumps are regarded as a central technology to reduce greenhouse gas emissions in the heating sector [10]. When powered with electricity from renewable energy sources (RES), heat pumps can displace traditional heating technologies such as oil- and gas-fired heating and thus mitigate greenhouse gas emissions. In addition, the Russian invasion of Ukraine has led to a further political push in Europe, but especially Germany, to reduce the dependence on Russian natural gas imports. In Germany, natural gas is, at the moment, still the principal source of residential heating. The electrification of heating can therefore be seen as a critical measure to reduce the use of natural gas.
In Germany, policymakers aim for an accelerated roll-out of decentralized heat pumps, with a declared target of six million installed heat pumps by the year 2030 [15]. Given the current stock of around 1.5 million heat pumps, such a transition implies an increase in the electricity demand. So far, it is not yet understood how an increased heat pump stock affects the power sector in detail, considering that the electricity needs for mobility, hydrogen production, and other energy services will also increase. One common concern is that heat pumps constitute an additional burden on the power sector if they are operated in an inflexible manner. Given that electricity load profiles often coincide with heat demand profiles, inflexible heat pumps could add to existing load peaks and thus increase the need for firm generation capacity or electricity storage. Therefore, we explore the power sector effects of different German heat pump roll-out scenarios. In particular, we focus on different degrees of temporal flexibility in heat pump operations by varying the heat storage capacities assumed to be attached to heat pumps. To do so, we apply the open-source capacity expansion model DIETER to the central European power sector for various scenarios of the year 2030.
Previous studies have highlighted the important role of heat pumps in the decarbonization of the heating sector. A recent study shows that deploying heat pumps is one of the fastest strategies to reduce natural gas consumption in the German heating sector.. Several studies investigate the potential of heat pumps to facilitate the integration of renewable energy sources in the power sector [2, 13, 8, 16, 4]. For example, analyses show that a roll-out of heat pumps aligns well with additional investments into wind power deployment [16, 4]. With respect to the flexibility of heat pumps and optimal heat storage size, the picture is inconclusive. Investigating heat storage sizes, a study finds that an optimal heat storage capacity for Spain and the UK lies between 12 and 14 hours [12]. An older analysis of wind power deployment in Denmark finds that the flexible operation of heat pumps provides only moderate system benefits and that even inflexible heat pumps enable a higher share of wind power energy [8]. A study for Germany points out that the power system cost savings from flexible electric heating with night storage in Germany is moderate because renewable availability patterns do not align well with heat demand profiles [17]. The seasonal demand pattern gives flexible electric heating a disadvantage compared to other sector coupling options without this seasonality, such as electric vehicles. This finding is also supported by another study [11] that identifies a larger potential for load shifting in electric vehicles than in heat pumps. Another study focuses on the role of flexible, large-scale, centralized heat pumps in district heating grids [2], finding a correlation between RES expansion and the choice of heating technologies. With higher deployment of RES, large heat pumps become more competitive. Including other flexibility options in the analysis might reduce the value of flexibility in the heating sector. Other studies focus on the competition of the flexibility provided by heat pumps with electricity storage units. In power systems with an 80 percent renewable share or higher, the flexible use of heat pumps reduces the investment needs for short-term electricity storage significantly [9]. The substitutional nature between pumped hydro storage and thermal storage is also highlighted in the literature [16].
Our paper adds to the existing body of literature by investigating the power sector effects of decentralized heat pumps in detail, specifically accounting for different levels of temporal flexibility facilitated via heat storage. We do so with an open-source capacity expansion model that considers the hourly variability of renewable generation as well as electricity and heat demand over a full year, also accounting for additional loads related to electric vehicles and the production of green hydrogen. To the best of our knowledge, suchan analysis has not been done so far. We investigate how different roll-out paths of heat pumps with different heat storage sizes impact the optimal capacity investment and dispatch decisions in the power system. In contrast to prior studies, we also examine how increases in natural gas prices impact the power system effects of an accelerated heat pump roll-out. To check the robustness of our results, we carry out numerous sensitivity analyses with alternative assumptions on relevant input parameters such as renewable availability, including an extended drought period, natural gas prices, and a German coal phase-out.
2 Methods
Power sector model DIETER
In this study, we use the power sector model DIETER (Dispatch and Investment Evaluation Tool with Endogenous Renewables).111The model code can be accessed here: https://gitlab.com/diw-evu/projects/heatpumps_2030. It is an open-source linear program to determine the least-cost investment and dispatch decisions for all electricity generation and storage technologies. DIETER not only covers the traditional electricity sector but also includes a detailed space heating module, e-mobility, and flexible hydrogen production options. The model minimizes total system costs and considers all subsequent hours of a year to accurately capture renewable energy variability and storage use. Input data for DIETER include time series of electric load, heat demand, electric vehicle charging, hydrogen demand, and capacity factors of renewable energies. Cost assumptions and technology investment constraints are further inputs.
Heat sector
The space heating sector is included in Germany using twelve classes of residential buildings categorized by two size classes (single-/two-family homes and multi-family buildings) and six age classes, which correspond to varying energy efficiency levels [17]. We exogenously specify the proportion of space heating which is covered by two different types of heat pumps for each scenario. Based on these inputs and assumptions, the model optimizes the hourly use of electricity by heat pumps. We assume that heat pumps can be combined with buffer thermal energy storage of different sizes, which we vary between scenarios.
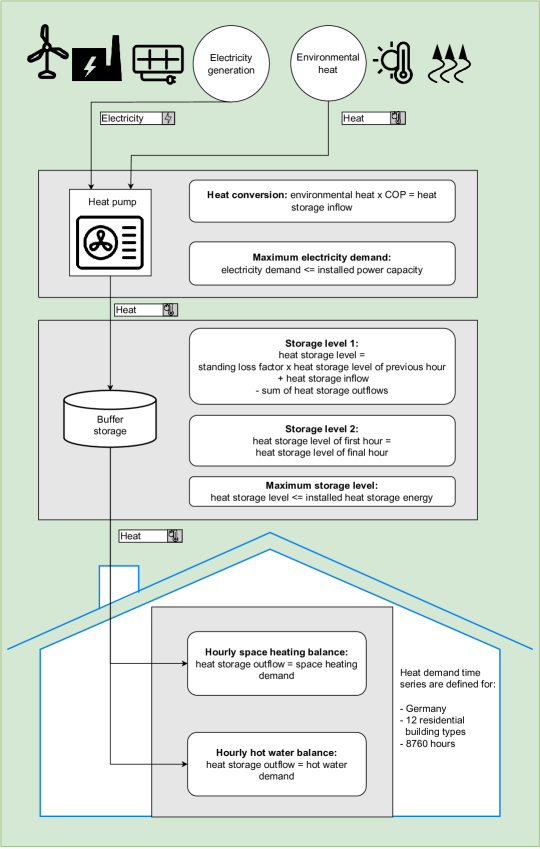
Figure 1 depicts how heat pumps are modeled in DIETER. The heating energy generated by a heat pump is determined by its coefficient of performance (COP) and the amount of environmental heat available. How much heating energy is provided to the building depends on the heat outflow from the buffer storage, which cannot exceed the total amount of heating energy stored plus the storage inflow in the same hour. Finally, the heat storage outflow feeds both the space heating demand and the hot water demand. We only consider decentralized heat pumps with decentralized thermal energy storage. Centralized large heat pumps supplying district heating grids and centralized seasonal heat storage are not considered.
Sector coupling
As the electrification of other sectors is a policy target in Germany, we also account for electric mobility and green hydrogen. The additional system load of electric vehicles enters the model as an electricity demand time series. Cars are assumed to charge with a balanced, yet not wholesale market price-driven time profile determined by the open-source tool “emobpy“ [7] (for further details, see SI.1.1). The model also has to satisfy a given yearly demand for green hydrogen via electrolysis. The hourly hydrogen production profile is endogenously optimized, with given electrolysis capacity and assuming hydrogen storage at no cost. We provide the equations that describe the simple hydrogen model in SI.1.2.
Geographical scope
We conduct the study focused on Germany and its neighboring countries, including Denmark, Poland, Czechia, Austria, Switzerland, France, Luxembourg, Belgium, the Netherlands, and Italy. To keep the model tractable while still taking into account the effects of the European interconnection, we optimize investment decisions only for Germany while assuming fixed power plant fleets for other countries, and also do not model sector coupling explicitly for other countries than Germany.
3 Data and scenario assumptions
3.1 Input data sources
Time series data for the electric load in Germany and renewable energy availability profiles for all countries are taken from the “Open Power System Data” platform, using the weather year 2016 for renewables and the year 2019 for load [18]. German load time series are scaled to the expected yearly electricity load in 2030 according to the medium scenario (B) of the German Grid Development Plan NEP 2019 [3]. Load data for other countries is derived from the TYNDP 2020 [5], based on the scenario “Distributed Energy” and the climate year 1984. Cost and technology parameters of electricity generation and storage technologies are depicted in Table 3(b) in the Supplemental Information. We assume that electrolysis happens at a conversion factor of 71 percent; hence 1 kilowatt-hour (kWh) of electricity is transformed into 0.71 kWh of hydrogen. The relevant technical assumptions related to heating technologies as well as gas-based electricity generation technologies for the ex-post analysis of natural gas savings are shown in Table 1. The estimation of natural gas and emission savings due to heat pumps is based on this data (more information in Section 4.3).
| Parameter | Value |
|---|---|
| Overnight investment costs [EUR/kWth] | |
| Air-sourced heat pumps | 850 |
| Ground-sourced heat pumps | 1400 |
| Gas boilers | 296 |
| Efficiencies | |
| Open-cycle gas turbine | 0.4 |
| Combined-cycle gas turbine | 0.542 |
| Gas boilers | 0.9 |
| Technical lifetime of heat pumps [Years] | 20 |
| Interest rate | 0.04 |
| Annuity factor | 0.074 |
| Emission factor [t CO2eq / MWhth] | 0.2 |
3.2 Scenario assumptions
We refer to our main set of scenario assumptions as “baseline”. In the following, we briefly sketch the most important features of this scenario. Whenever we deviate from the baseline, for example, when we present sensitivity analyses, we make this explicitly clear.
Heating sector
We distinguish between four scenarios of the overall heat pump stock in the year 2030. In the reference roll-out, we assume 1.7 million decentralized heat pumps in 2030, based on the assumption that the historic shares of heat pumps in different building types remain constant, based on [17]. In the slow roll-out, the number of heat pumps reaches 3.9 million by 2030. Here, the additional heat pumps are installed exclusively in single- and two-family homes of the two highest energy efficiency categories. In the mid roll-out, 6.5 million heat pumps are installed by 2030. Unlike the previous scenario, single- and two-family homes from the next worst energy efficiency class are also fitted with heat pumps. In the fast roll-out, heat pumps are additionally installed in multi-family homes of the same energy efficiency classes, which increases their total number to 7.5 million by 2030. Table 2 provides an overview of the heat pump roll-outs. In the most ambitious scenario, decentralized heat pumps provide nearly a quarter of total space heating and domestic hot water needs (Table 2).
Across all building types, air-source heat pumps account for 75 percent of installed heat pumps across all building classes, with ground-source heat pumps accounting for the remaining 25 percent. While ground-source heat pumps are more energy-efficient, air-source heat pumps are cheaper to install. We assume that all heat pumps are combined with thermal energy storage. We conduct analyses with varying thermal storage capacities ranging from zero to 168 hours (0, 2, 6, 24, and 168 hours). For instance, a heat storage of 2 hours could deliver the maximum heat output for two consecutive hours.
| Reference | Slow | Mid | Fast | ||
|---|---|---|---|---|---|
| Number of installed heat pumps | [million] | 1.7 | 3.9 | 6.5 | 7.5 |
| Heat pump power rating | [GWe] | 8.5 | 17.4 | 28.9 | 40.1 |
| Heat pump thermal rating | [GWth] | 19.6 | 40.1 | 66.6 | 92.6 |
| Share of air-sourced heat pumps | 0.75 | 0.75 | 0.75 | 0.75 | |
| Share of ground-sourced heat pumps | 0.25 | 0.25 | 0.25 | 0.25 | |
| Heat supplied by heat pumps | [TWhth] | 24.7 | 45.9 | 103.1 | 142.6 |
Note: Heat includes space heating and domestic hot water.
We model 12 different building archetypes, which we distinguish by year of construction (six classes: before 1957, four periods between 1958 and 2019, and after 2019) and housing type (two classes: one -& two-family homes and multi-family homes). Depending on the year of construction, the building archetypes are characterized by different energy efficiency levels: younger buildings have a lower annual heating requirement, and buildings constructed after 2020 are characterized as passive houses. Table SI.1 illustrates the building stock assumptions for 2030, which are based on [17].
Generation capacity bounds
In accordance with the 2030 German Grid Development Plan (NEP 2030) [3], we assume that fossil-fuel power plant capacity expansion in Germany is limited. In sensitivity analyses with a German coal phase-out, we assume the upper capacity limit for hard coal and lignite to be zero. Regarding renewable energy sources, we fix capacities of run-of-river hydropower and bioenergy under the assumption that their potential for further capacity expansion is exhausted. Furthermore, we align upper capacity bounds for on- and offshore wind energy with the current German government targets of 115 GW for onshore wind and 30 GW for offshore wind in the baseline scenarios. In the sensitivity analysis, we remove these limits. Capacities for other countries are fixed based on the Ten-Year Network Development Plan (TYNDP) [5] of the European Transmission System Operators. Electrolysis capacity is fixed at 10 GWe. Table SI.2 provides an overview of the lower and upper capacity extension limits in Germany and fixed capacities in other countries.
Sector coupling demand
In Germany, we take into account electric loads related to sector coupling. To incorporate the impact of e-mobility, we include a fleet of 12.5 million electric cars, which require approximately 29 TWh of electricity annually. Additionally, we account for 28 TWh of hydrogen demand in Germany, which must be generated by domestic electrolysis. This results in an additional electricity demand of around 39 TWh. The assumption is based on the target set in the German National Hydrogen Strategy 2020 to build up an electrolysis capacity of 6 GW, and scaled by the new target of 10 GW declared in 2022. Due to the assumed free hydrogen storage, electrolyzers can operate with some degree of flexibility to produce the above-mentioned total amount of hydrogen over the course of the year. In countries other than Germany, additional loads related to sector coupling are included in the electric load time series data provided by ENTSO-E.
Renewable energy constraint
In all scenarios, 80 percent of the yearly electricity consumption in Germany, including electric vehicles and electrolysis, has to be covered by renewable energy sources. That is in line with the goal of the current German government coalition. In addition, the electricity demand by heat pumps has to be entirely met by additional renewable energy sources over the course of a year (but not in every single hour). That means that the entire yearly electricity demand of heat pumps has to be generated by renewable energy sources, not necessarily that renewable energy sources in Germany can supply enough electricity for heat pumps every hour. In other countries, we do not assume any renewable energy targets.
Fuel and carbon prices
For fuel prices, see table 3(b). We further assume a carbon emission cost of 130 euros per ton of CO2 for 2030 [14]. This cost is associated with the emission factor of fossil-based heating and electricity generation technologies and is considered a variable generating cost, along with fuel expenses.
4 Results
4.1 Results for baseline assumptions
The baseline scenario includes expansion limits of 115 GW for onshore wind power and 30 GW for offshore wind power, has no regulated phase-out of coal-fired power plants, and assumes a natural gas price of 50 euros per MWh. We show the effects of alternative assumptions in the subsequent section 4.2.
4.1.1 Heat storage reduces electricity generation and storage capacity investments
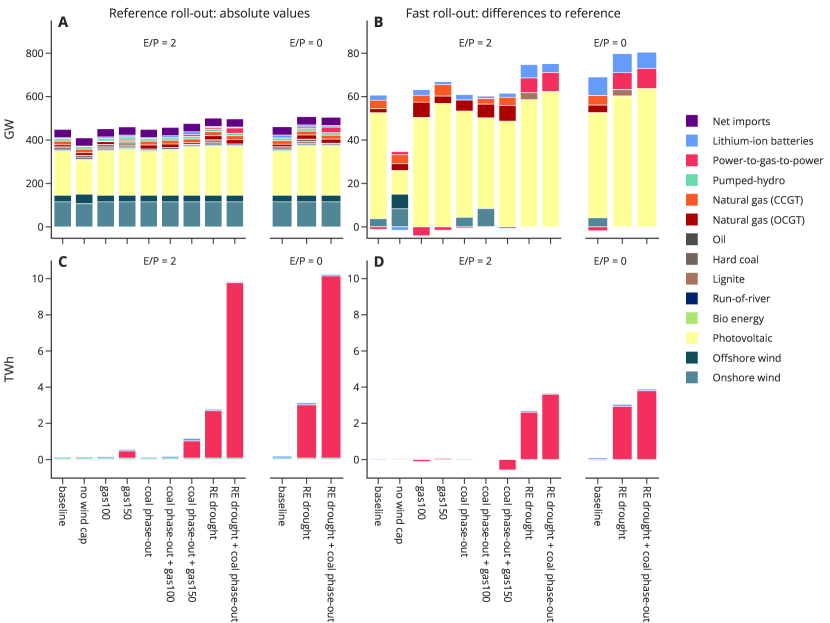
Expanding the stock of heat pumps requires additional investments into electricity generation infrastructure. We first look at the case of temporally inflexible heat pumps, i.e., heat pumps with no attached heat storage. These have to consume electricity exactly at the time of heat demand (left rows in Figure 2). In the reference roll-out scenario, the stock of heat pumps only increases slightly above the level of 2022. In this reference scenario and under baseline assumptions, the German electricity sector requires renewable power plant capacities of 111 GW onshore wind, 30 GW offshore wind, and 153 GW of solar PV (2, Panel A) to reach the goal of 80% renewable energy. Further, 10 GW of hard coal and 21 GW of gas-fired power plants are installed.
An increasing roll-out of heat pumps requires higher generation capacity additions. In the scenario fast with the highest roll-out of around 7.5 million heat pumps (Panel D), there is a need for an additional 48 GW of solar PV capacity to generate the electricity the heat pumps need over the year. This capacity expansion is driven by the fact that the additional electricity demand by heat pumps has to be covered 100% by renewable energy. At the same time, wind power capacity can hardly be expanded because of the assumed expansion limit of 115 GW.
The effects of heat pumps on firm electricity generation and storage capacities are smaller, with 8 GW of additional gas power plants (close and open cycle together) and 9 GW of battery storage in terms of power rating (Panel D) as well as 87 GWh energy capacity (Panel H). This aligns well with the expansion of solar PV and respective increases in diurnal fluctuations of electricity generation. The growth in batteries, in turn, is crowding out power-to-gas-to-power storage, which is substituted completely in the fast scenario.
In the scenarios slow and mid (Panel B & C), in which fewer additional heat pumps are installed, results are qualitatively similar but require overall lower capacity additions. For instance, scenario slow requires 3.5 GW of solar PV and 3.7 GW of onshore wind, and hardly any additional power plant capacities (Panel B).
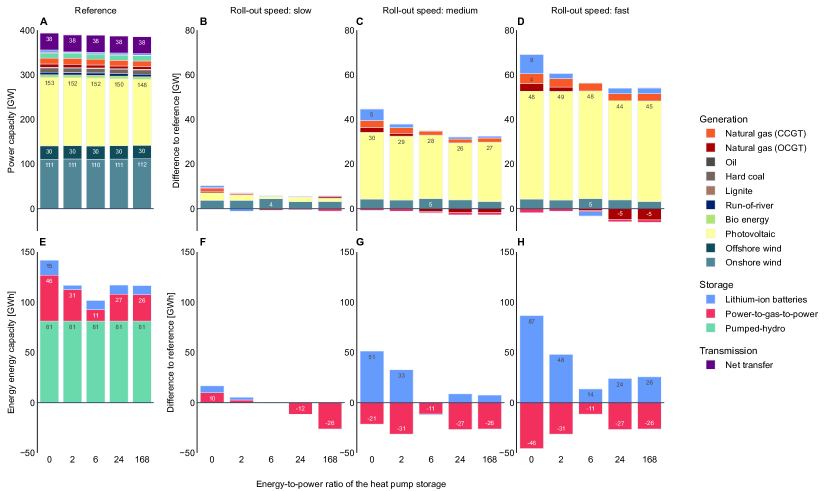
Notes: Absolute values in the reference scenarios (panel A & E) and changes caused by the roll-out of heat pumps with different heat storage sizes.
Equipping heat pumps with heat storage reduces the need for electricity generation and storage capacities. With a heat storage capacity of 2 hours of maximum heat pump output, there is hardly an effect on the optimal installed solar PV capacity (Panel D, second column), but it reduces the need for battery storage: the additional power rating of battery storage is reduced by 7 GW (2 GW instead of 9 GW, Panel D). This is because short-duration electricity and heat storage serve as complements, especially when it comes to taking up daily PV surplus generation peaks. If the heat storage capacity becomes larger than 2 hours, this further decreases the capacity needs for solar PV as well as open-cycle gas turbines (OCGT), which are used to supply peak residual loads. As heat storage helps balancing the fluctuations of solar generation, heat demand profiles, and the overall system load, other additional peak supply capacities are not needed. Increasing the heat storage capacity beyond 2 hours requires even fewer additional fixed power plant capacities (such as gas power plants). Yet, the overall effects remain moderate even if heat storage becomes very large (168 hours, i.e., one week).
The effects of additional heat storage on optimal battery storage energy capacities (lower row of panels Figure 2) are even more pronounced. Compared to the fully inflexible 0-hour heat storage scenario, the additionally needed battery storage energy capacity is 39 GWh lower with 2 hours of heat storage (48 GWh instead of 87 GWh, Panel H). Heat storage of 6 hours makes heat pumps so flexible that they can be rolled out almost without any complementary battery storage. While in the case without heat storage, a maximum of 87 GWh of additional battery storage is installed (scenario “fast”), this need is diminished to 14 GWh by a 6 hour heat storage. Larger heat storage conversely causes optimal battery storage energy capacity to increase again slightly, but this is compensated by lower long-duration electricity storage needs (power-to-gas-to-power). For any roll-out path, we see that less long-duration electricity storage is needed when more heat pumps are rolled out. That is because batteries and heat storage replace long-duration electricity storage. Note that in all of these scenarios, pumped-hydro storage capacities in Germany are assumed to be fixed.
4.1.2 Heat storage helps to integrate renewable electricity
The impact of an increased heat pump roll-out on the optimal yearly dispatch of generation and storage capacities is largely in line with its impact on optimal capacities (Figure 3). Yet, the share of onshore wind power in additional electricity generated is larger than its share in additional capacity, as it comes with higher full-load hours than PV. As the time profiles of solar PV and heat pump load only align to some extent, the expansion of heat pumps triggers additional generation by gas-fired power plants and increased battery storage use. Similar to optimal investment, larger heat storage capacities decrease the use of batteries. Beyond a 6-hour heat storage capacity, battery storage use increases again, in line with slightly increasing generation from solar PV. Net imports of electricity slightly decrease with the roll-out of heat pumps, especially when they do not come with heat storage, i.e., are operated in an inflexible manner. As renewable generation capacity expansion that goes along with the heat pump roll-out causes increasing renewable surplus generation events, especially solar PV peaks at noon, these surpluses are partly exported, especially in case of inflexible heat pump operation. Accordingly, net imports decrease.
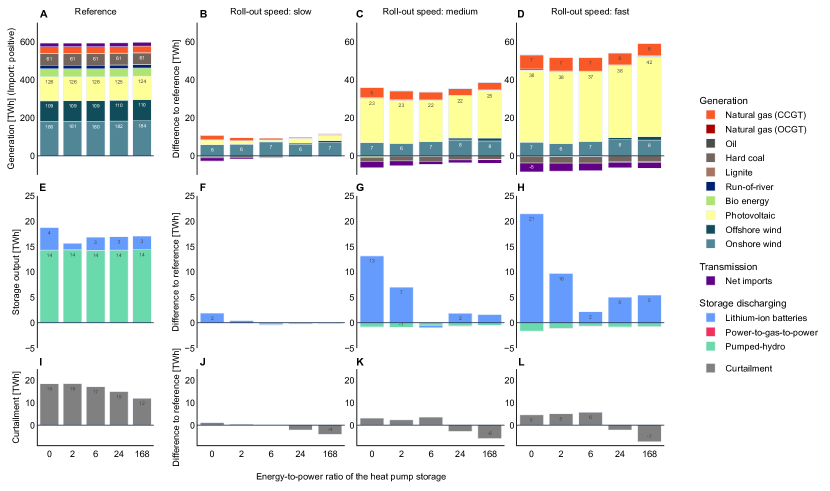
Notes: Absolute values in the reference scenarios (Panel A & E) and changes caused by the roll-out of heat pumps with different heat storage sizes.
Figure 4 provides an illustration of hourly electricity generation and heat pump operation in combination with additional heat pumps. The figure depicts two exemplary weeks in the baseline scenario, with a fast roll-out and 2 hours of heat storage. The diurnal fluctuations of solar PV generation are visible. In contrast, wind power generation has less regular, yet longer variability patterns. In hours of low wind and solar PV generation, gas-fired power plants and imports cover the remaining residual load. Even with only 2 hours of heat storage capacity, heat pumps can align a substantial part of their electricity consumption with PV peak generation periods. This indicates that even small heat storage capacities already improve the integration of heat pumps into the system. Hours of electricity exports, storage charging, and heat pump use often coincide, which are also hours with relatively low prices. Conversely, heat pumps largely avoid drawing electricity from the grid during hours when imports take place, which often coincides with hours of low renewable generation and relatively high prices.
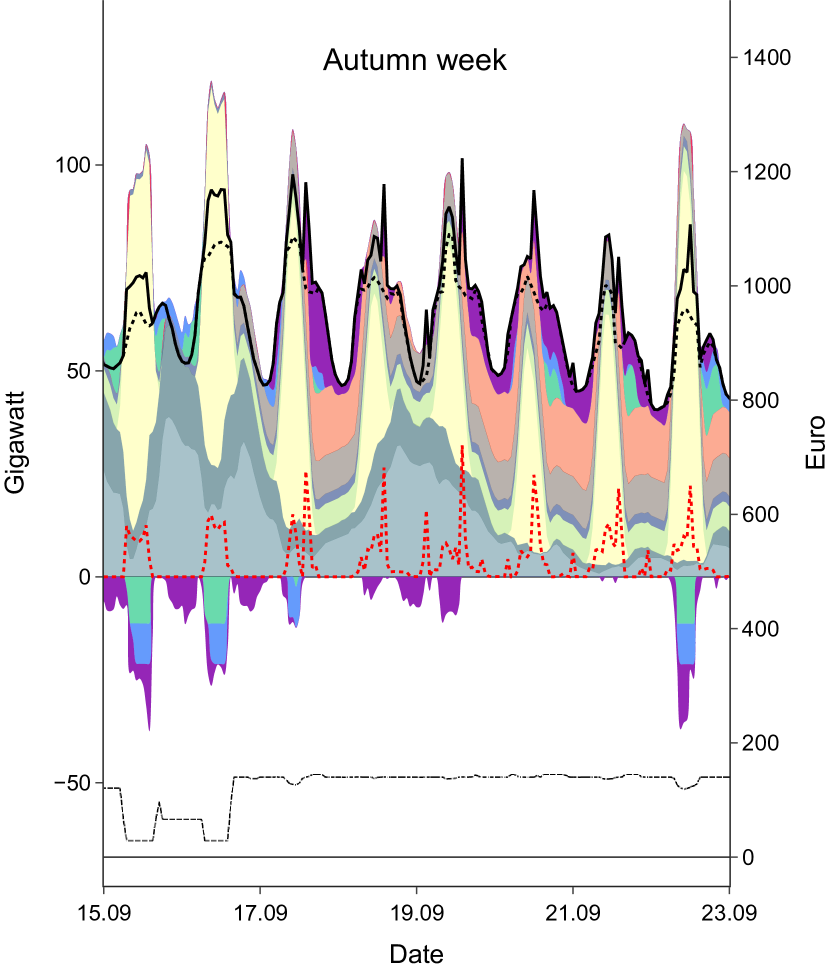
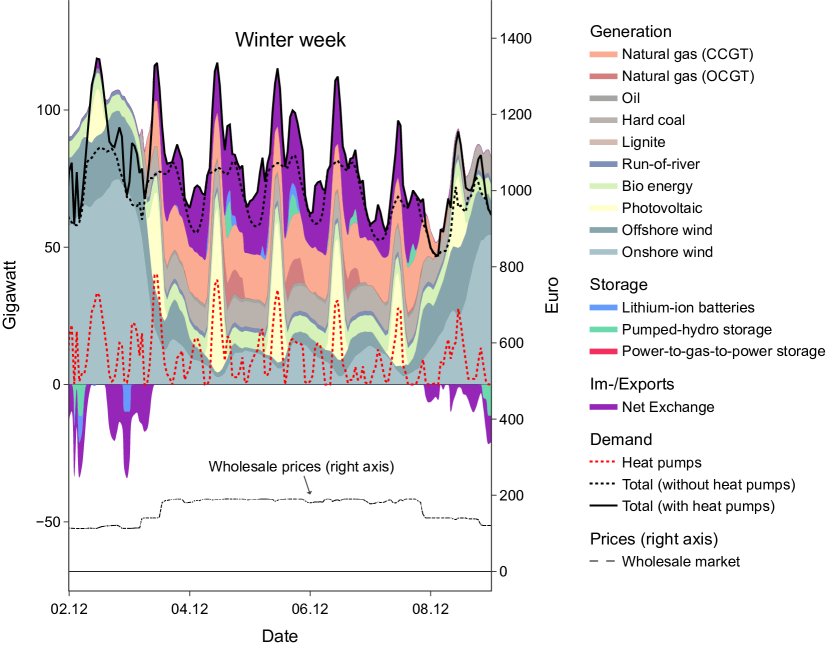
Notes: Two exemplary weeks are shown for the fast roll-out of heat pumps with 2 hours of heat storage.
Given our model setup, heat pumps are operated in a way to minimize system cost, which can be interpreted as if they are following (wholesale) market price signals. Heat pumps can align their electricity consumption better with periods of low residual load (which goes along with low prices) when they are equipped with heat storage. As visible in Figure 5, there is a strong alignment of heat pump electricity intake and relatively low residual load levels. While heat pumps with no heat storage are inflexible electricity consumers, even small 2-hour thermal storage makes them sufficiently flexible that they can adjust their demand to the overall system to a considerable extent. If heat storage is expanded further (rows “6” and “168” of Figure 5), heat output and electricity intake are even less correlated. However, as shown before, the effects on optimal storage capacity installation are comparatively small beyond 6 hours of heat storage (Figure 2).
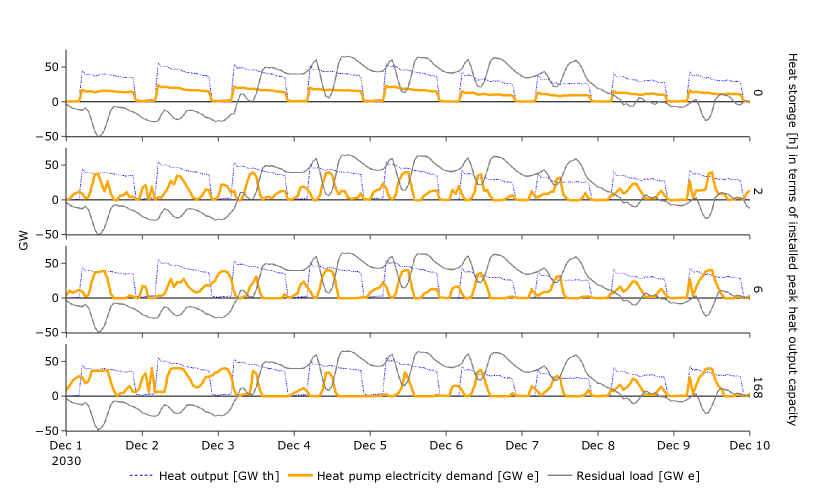
Notes: The figure shows the electricity demand of heat pumps, their heat output, and the residual load in the baseline scenario with a fast roll-out.
4.1.3 Electricity sector costs
With respect to electricity sector costs, our analysis focuses on additional system costs caused by the heat pump expansion. We relate these costs to the additional heating energy provided (Figure 6). More heat pumps lead to additional costs for the electricity sector. We find a cost increase of around 4 ct/kWh of additional heating energy provided in the fast roll-out scenario with 2 hours of heat storage. That is because the expansion of heat pumps triggers additional investments into electricity generation and storage infrastructure. This increase in electricity sector costs is much lower than average consumer prices for natural gas in Germany.
Electricity sector costs decrease with larger heat storage. This decrease is very small between a day (24 hours) and a week of heat storage (168 hours), hinting at the fact that heat storage is primarily used to balance daily fluctuations. That is, the marginal electricity sector cost savings decrease with larger heat storage. The power sector cost effect is largest when the heat storage capacity is increased from 0 hours to 2 hours.
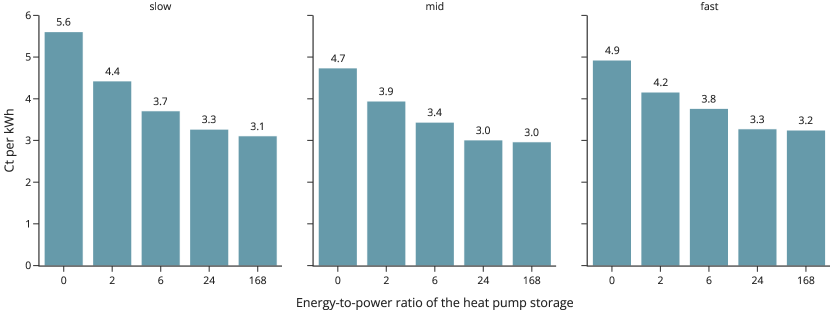
Figure 6) does not include the installation costs of heat pumps and heat storage, but only the costs related to the electricity sector, such as investment and operational costs of generation and electricity storage capacities. Therefore, we can interpret these figures as opportunity costs of heat storage. Taking the fast roll-out path as an example, an introduction of heat storage of 6 hours comes with a reduction of around 10 euros per MWhth of the additional heat provided. This is a benchmark of how cheap heat storage would have to become in order to lower overall system costs.
4.2 Sensitivity analyses
In addition to our baseline scenario runs in which we vary the roll-out speed of heat pumps and heat storage durations (see sections above), we conduct several sensitivity analyses. Those help us judge how strongly our results hinge on certain fundamental model assumptions. Table 3 provides an overview of all sensitivity analyses conducted.
| Name | Description | |
|---|---|---|
| 1 | no wind cap | No upper capacity on capacity on- and offshore wind investment in Germany. |
| 2 | gas100 | Natural gas price set to 100 euros per MWh. |
| 3 | gas150 | Natural gas price set to 150 euros per MWh. |
| 4 | coal phase-out | No coal-fired plants allowed to operate by 2030. |
| 5 | coal phase-out + gas100 | Combination of 2 and 4. |
| 6 | coal phase-out + gas150 | Combination of 3 and 4. |
| 7 | RE drought | All renewable energy capacity factors in one winter week are set to zero. |
| 8 | RE drought + coal phase-out | Combination of 4 and 7. |
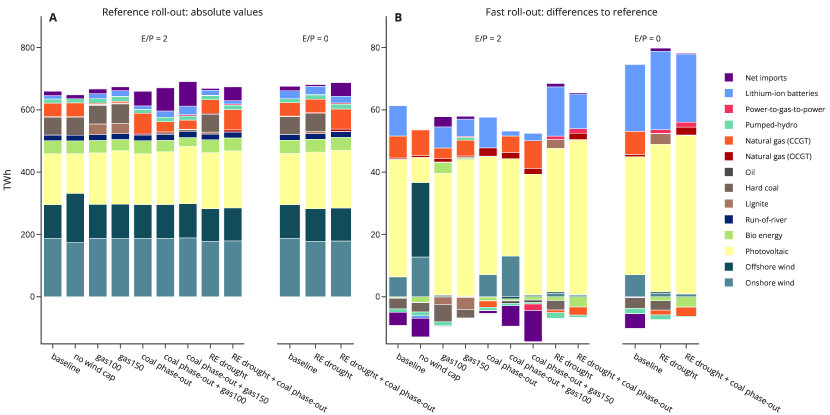
In the following, we briefly present the different sensitivity analyses and discuss their results in terms of capacity investments (Figure 7), dispatch (Figure 8), and additional system costs of heating provided (Figure 9).
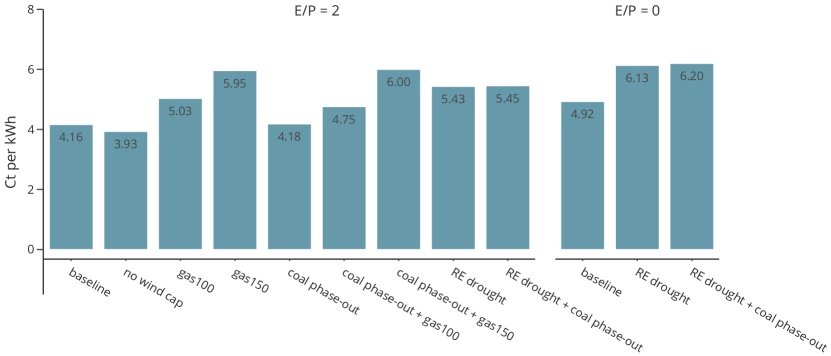
Notes: The figure shows the additional system costs per heating energy provided [in euro cent per kWh] of 5.8 million additional heat pumps in different sensitivity scenarios (with heat storage durations of 0 or 2 hours as shown below the labels).
No capacity expansion limit of wind energy (no wind cap)
In the baseline scenarios, we set an upper limit for on- and offshore wind power capacity expansion in Germany of 115 GW and 30 GW, respectively. This appears to be more policy relevant in a 2030 perspective as compared to assuming unbounded wind power expansion potentials, considering real-world constraints related to regulation, land availability and public acceptance. In a sensitivity analysis, we drop this upper limit so that investments into on- and offshore wind power are unconstrained.
The removal of the upper cap for wind power leads to higher overall wind capacities and lower PV capacity expansion, even in the reference roll-out scenario (Figure 7, Panel A). This in turn reduces overall capacity requirements. Investments into onshore wind energy even decrease slightly, but are overcompensated by additional offshore wind capacities. These changes correspond with a higher yearly generation of offshore wind energy in the reference roll-out scenario (Figure 8, Panel A) compared to the baseline scenario. Given this reference, an additional roll-out of heat pumps leads to a substantial expansion of wind onshore and particularly offshore capacities, yet far fewer additional PV capacities (Figure 7, Panel B) than in the baseline. In consequence, additional dispatch consists mainly of offshore wind energy instead of solar PV (Figure 8, Panel B). The increased use of wind power hints to the fact that its availability aligns better with the seasonality of the heating demand than solar PV. Optimal storage energy installation rarely changes in comparison to the baseline (Figure 7, Panel C and D). Despite the relatively large shift between wind power and PV, overall system costs barely change compared to the baseline setting (Figure 9). This implies that a roll-out of heat pumps can also be combined with solar PV capacity expansion in case of binding wind power capacity limits with little additional costs, making use of the flexibility provided by the European interconnection.
Sustained high gas prices (gas100 and gas150)
As a consequence of the Russian invasion of Ukraine, the natural gas supply structure of Europe was fundamentally changed. For the foreseeable future, Germany will not import any more Russian gas, but will rely on more costly imports of liquefied natural gas (LNG) from other regions. Although wholesale gas prices have been falling strongly since their peak levels of over 300 euros per MWh in August 2022 and range by the time of writing at around 30 euros per MWh, it remains possible that new spikes arise in the near future. In our set of baseline scenarios, we assume a natural gas price of 50 euros per MWh. We introduce two alternative scenarios, gas100 and gas150, in which we assume natural natural gas prices of 100 or 150 euros per MWh.
Higher gas prices barely alter the optimal capacity expansion in the reference roll-out. Even a fast heat pump roll-out leads to very similar capacity installations compared to baseline assumptions, with slightly increased solar PV (for a gas price of 150 euros per MWh) and even slightly more additional gas power plants. This is because with a reference roll-out, the capacity of gas-fired power plants is higher under baseline assumptions (Figure 7, Panel A) than in the sensitivities with higher gas prices, where nearly no gas-fired power plants are built. Thus, additional heat pumps have a slightly larger effect in these scenarios. Regarding yearly energy generation, the higher gas prices drive out natural gas in the reference roll-out and lead to slightly less additional dispatch by gas power plants in the fast roll-out scenario. Overall, we do not observe substantial changes compared to our baseline scenario. Nonetheless, the additional power system costs per heating unit increase substantially compared to the baseline because of more expensive natural gas.
Coal phase-out (coal phase-out)
In the baseline scenarios, we allow coal-fired power plants to generate electricity in 2030, in accordance with the currently planned German coal phase-out by 2038. However, the current governmental coalition agreed to “ideally bring forward” the coal phase-out to 2030. Although this agreement has not yet been translated into binding law, we aim to analyze the power sector consequences of an earlier coal phase-out combined with a faster heat pump roll-out. Hence, in this sensitivity analysis, we assume that electricity generation by coal-fired power plants is not possible.
In the reference roll-out, coal-fired power plants that are present in the baseline scenario would be mainly replaced by gas-fired generation. For a fast roll-out of heat pumps, the additional capacity needs hardly differ from those in the baseline, as heat pumps also do not trigger an expansion of coal-fired power plant capacities under baseline assumptions. In terms of dispatch, generation by coal-fired power plants in the reference roll-out scenario is mainly compensated by gas-fired (CCGT) plants, as well as by increased net imports. Expanding heat pumps leads to largely similar dispatch effects as in the baseline. Power system costs increase only very slightly.
We also combine the coal phase-out with higher gas prices (scenarios coal phase-out + gas100 and coal phase-out + gas150). In consequence, we see slightly higher solar PV capacity installations in the reference roll-out. Additional capacities in the fast roll-out barely differ from those under baseline assumptions. In terms of dispatch, results do not differ too much from the baseline either. For the reference roll-out, the missing coal-fired generation is partly displaced by electricity net imports. Yet, these net imports diminish with additional heat pumps in the fast roll-out. Overall, additional dispatch does not vary strongly between these sensitivity scenarios and the baseline. Yet, the combination of a coal phase-out and higher gas prices lead to considerably higher power system costs because of higher production costs of gas-fired power plants, which often are the marginal plant.
A week of a renewable energy drought (RE drought)
As the share of variable renewable energy increases, the security of supply during prolonged periods with low renewable energy supply becomes an increasing concern. Therefore, we assess how a week of a severe renewable energy drought in Europe would affect our results. To simulate an extreme case of such a week, we artificially set wind and solar PV capacity factors to zero in all modeled countries during one winter week.
Because of this massive imput parameter modification, this sensitivity analysis substantially impacts our results. Effects on generation capacities are generally limited for the reference roll-out, yet substantial long-duration storage capacities (power-to-gas-to-power) are needed. In contrast to the baseline, where almost no long-duration storage is installed, 2.6 TWh of energy capacity are installed in the RE drought scenario already in the reference roll-out of heat pumps. In the fast roll-out scenario, another 2.6 TWh are added, a substantial difference from the baseline, in which long-duration energy storage capacity remains unaltered in the fast roll-out. Also, the fast roll-out of heat pumps triggers significantly higher solar PV capacity additions: over 58 GW instead of 48 GW in the baseline. In terms of dispatch, the fast roll-out of heat pumps leads to a higher use of solar PV generation and short-duration electricity storage compared to the baseline. Considering the binding minimum renewable energy share constraint, the PV capacity addition is required to compensate for the missing generation from renewables (largely wind power) during the drought week. As wind power capacities are capped, additional solar PV capacities are installed, which in turn trigger additional short-duration storage capacities to integrate optimally the electricity generated by solar PV. Including a renewable energy drought accordingly also leads to higher system cost increases of a fast heat pump roll-out of 6.1 cent per kWh heat provided. This can be explained by additional capacity investments needed as well as the dispatch of gas-fired power plants in the week of energy drought.
Combining the scenarios RE drought with coal phase-out, we find very similar capacity expansion results. The biggest difference is, however, that already in the reference roll-out scneario 9.7 TWh of long-duration electricity storage are installed. This is because coal-fired power plants are missing as a firm generation technology, and also the generation capacities of gas-fired power plants cannot be increased further. In the fast roll-out of heat pumps, generation capacities are similar to RE drought, yet even more additional long-duration electricity storage is installed: an additional 3.6 TWh instead of 2.6 TWh for the RE drought only and almost 0 in the baseline. Dispatch in the scenario RE drought + coal phase-out does not greatly change from RE drought, and power system costs only increase mildly.
For baseline, RE drought, and RE drought + coal phase-out, we ran additional sensitivity analyses assuming zero heat storage instead of heat storage with an energy-to-power ratio of 2 in all the other scenarios. Generation capacity changes are very limited and differ barely from the respective scenario with an E/P of 2. We see slightly higher capacity investments into solar PV, as well as short- and long-duration storage. Concerning yearly electricity generation, we fnid that the absence of heat storage leads to a more intensive use of short-duration electricity storage. This can already be detected in the fast roll-out of heat pumps in the baseline scenario, and the use is further increased in the scenarios RE drought and RE drought + coal phase-out. The overall impact on costs remains limited. That is, small-scale heat storage reduces overall system costs in all sensitivities investigated here, but mildly so.
Summarizing the results of our extensive sensitivity analyses shows that the principal results and insights remain largely robust. Adding a considerable number of heat pumps to the German power sector leads to substantial capacity investments into mainly solar PV to fulfill the renewable energy constraint. Additional investments into gas-fired power plant capacities and short-duration lithium-ion storage capacities are also optimal. If the expansion of heat pumps could be accompanied with unlimited wind power expansion, this would lead to favorable results compared to a setting where the additional energy is largely supplied by PV. Yet, overall costs decrease only to a small extent when relying more on wind power. Overall, sensitivity scenarios point to the fact that especially when a renewable energy drought is present, firm generation and storage capacities are most strongly expanded compared to the baseline.
4.3 Natural gas and carbon emission savings
Based on the power sector optimization results, we can also examine the effects on natural gas usage and carbon emissions of an accelerated roll-out of heat pumps. In doing so, we compare the reference roll-out of 1.7 million heat pumps with 2.2 million additional heat pumps in the slow roll-out scenario and 5.8 million additional heat pumps in the fast roll-out scenario. The underlying assumptions for the calculation of gas and emission savings are stated in Table 1. Table 4 summarizes the results.
Under the assumption that each heat pump replaces one gas boiler with a thermal efficiency of 0.9222A thermal efficiency of 0.9 means that 1 kWh of natural gas will be transformed to 0.9 kWh of heat., additional heat pumps displace around 24 TWhth of natural gas in case of a slow roll-out and around 131 TWhth with a fast roll-out. At the same time, natural gas usage for electricity generation increases in both scenarios, but this is by far overcompensated by the large natural gas savings in the heating sector, leading to total savings of up to 117 TWhth of natural gas (fast roll-out). In the scenarios with gas prices of 100 euros or 150 euros per MWhth, gas usage for electricity generation drops compared to the scenario with a price of 50 euros. That leads to slightly larger total yearly natural gas savings of up to 122 TWhth. To put these numbers into perspective, 120 TWh of natural gas correspond to around 14 percent of Germany’s overall natural gas consumption in 2022, or around a third of private and commercial natural gas demand, or to around 100 shipments of large LNG tankers. In general, we find that all scenarios lead to a substantial reduction in natural gas consumption, which is mainly driven by the substitution of gas boilers with heat pumps. The additional natural gas consumption in the electricity sector has a minor effect. Note that this is also a consequence of our renewable energy constraint which requires that the roll-out of heat pumps goes along with a corresponding expansion of yearly renewable electricity generation.
We also observe a general decrease in overall costs in all scenarios. Here, overall costs include the increase in power system costs due to higher electricity demand, the total annualized overnight investment costs of the additional heat pumps against the savings in natural gas expenditures, CO2 emission costs, as well as investment costs of replaced natural gas boilers. Overall cost savings are 2.3 billion euros per year in the fast toll-out scenario and a 50 euros per MWh gas price; assuming a higher gas price of 150 euros per MWhth, cost savings increase to nearly 14 billion euros per year.
The reduced consumption of natural gas leads to lower CO2 emissions. In a fast roll-out scenario of heat pumps, CO2 emission savings of 23-24 million tons CO2eq can be expected under different gas price assumptions, strongly exceeding the emission savings of around 4 million tons CO2eq in the slow roll-out. 24 million tons of CO2 correspond to around 3 percent of Germany’s CO2 emissions of the year 2021, hence an ambitious heat pump roll-out as described in this paper could make a sizeable contribution to Germany’s strategy to reduce emissions. A further expansion of heat pumps beyond 2030 would lead to even higher reductions of carbon emissions.
| Gas price | euros/MWh | 50 | 100 | 150 | |||
|---|---|---|---|---|---|---|---|
| Heat pump roll-out | slow | fast | slow | fast | slow | fast | |
| Natural gas displaced by additional heat pumps | TWhth | -23.5 | -131.0 | -23.5 | -131.0 | -23.5 | -131.0 |
| Additional electricity generated from natural gas | TWh | 38.5 | 44.4 | 0.9 | 5.1 | 0.4 | 5.6 |
| Additional gas usage for electricity | TWhth | +2.9 | +14.0 | +0.7 | +8.9 | +0.6 | +10.2 |
| Total change in gas usage | TWhth | -20.6 | -117.0 | -22.8 | -122.0 | -22.9 | -120.7 |
| Total change in emissions | Mio t CO2eq | -4.1 | -23.4 | -4.6 | -24.4 | -4.6 | -24.1 |
| Change in overall costs | billion EUR | -0.1 | -2.3 | -1.1 | -8.0 | -2.2 | -13.7 |
5 Discussion and conclusion
As heat pumps are considered a key technology in the heating transition, their potential future impact on the electricity sector is of interest. We determine the impacts of different roll-out paths of decentralized heat pumps in Germany, combined with thermal buffer storage of different sizes, on the central European power sector. We find that the addition of nearly 6 million heat pumps in Germany would require additional investments of around 48 GW of solar PV capacity, regardless of the assumed size of the attached heat storage. These results are partly driven by the assumption that the additional electricity consumption of heat pumps has to be covered by additional renewable electricity on a yearly basis and that onshore, and that the expansion of wind power is limited to 115 GW (offshore) and 30 GW (offshore), respectively. Our results suggest that the need for additional firm capacities remains limited, such as gas-fired power plants and lithium-ion batteries which can provide flexible generation in times of low renewable energy generation. This is true even if heat pumps are operated in an inflexible way, as heat pumps benefit from the European interconnection.
The need to expand electricity storage capacities can be reduced by coupling decentralized heat pumps with thermal storage. Already small buffer heat storage of 2 hours enables heat pumps to align electricity consumption with the residual load to a sizable extent. This results in substantial power system cost savings compared to a system with inflexible heat pumps. We find the largest mitigation of electricity storage needs in a setting with a heat storage capacity of 6 hours. To sum up, operating heat pumps in a temporally flexible manner cannot be considered to be a “must-have” in the power sector modeled here, but it appears to be desirable.
Sensitivity analyses show that results are generally robust against changes in key scenario assumptions. Assuming unconstrained expansion potentials for wind power substantially reduces solar PV capacity deployment, but not overall costs, since wind energy aligns better with heat demand (compare [16]. A complete coal phase-out in the electricity sector does not have major effects, but requires additional dispatchable generation capacity from natural gas to satisfy load peaks. A further increase in gas prices changes these results only slightly but increases power system costs substantially. Considering a week-long, pan-European renewable energy drought requires that the expansion of heat pumps is accompanied by a substantial expansion in long-duration electricity storage capacity to satisfy the additional electricity demand of heat pumps.
We further find that an accelerated replacement of gas boilers with heat pumps (fast roll-out scenario) can bring about yearly natural gas savings of up to 122 TWhth, already accounting for increased gas usage in the electricity sector. This corresponds to around a third of private and commercial natural gas demand in Germany and corroborates related findings by [1]. Overall yearly cost savings depend, among other factors, on the natural gas price and range between around 2 and 14 billion for different natural gas price assumptions. CO2 emissions decrease by 23-24 million tons per year.
As any model-based analysis, our study has limitations. For example, we implicitly assume perfect distribution and transmission grids within countries, which limits our analysis with respect to any kind of grid congestion caused by heat pumps. In some distribution grid settings, the effect of heat pumps on grid congestion may be more severe than the impacts on system-wide generation capacities and dispatch modeled here. Furthermore, the size of the heat buffer storage is exogenously varied and not an endogenous investment decision in the model. That means that we cannot draw conclusions regarding the optimal heat storage capacity from this analysis. Yet, our results show that even relatively small heat storage capacities may already have substantially positive power system effects. Further, flexibly operating heat pumps requires according incentives for consumers in the real world. Finding ways of exposing heat pump operators to wholesale market price signals, either directly or indirectly via aggregators, appears to be important in this respect. Next, our analysis could be expanded by allowing for optimal generation capacity expansion also in other European countries in order to assess the potential interactions of capacity expansion in Germany and abroad. This has been left out in this analysis for numerical reasons and to improve tractability. Furthermore, Germany is not the only country pushing for an accelerated roll-out of heat pumps. Future analysis could include similar developments in other European countries to obtain more comprehensive insights into a wider European heating transition.
In summary, we find the power sector impacts of an accelerated heat pump roll-out in Germany to be moderate and manageable, even under the assumption that the electric load from heat pumps is met by a corresponding expansion of renewable electricity generation in a yearly balance. If wind energy cannot be expanded beyond certain limits, additional solar PV capacity can be deployed instead without substantially increasing the overall system costs. This is despite a seasonal mismatch of PV generation and heat demand profiles, which can be mitigated via the European interconnection. In general, operating heat pumps in a temporally flexible manner entails power sector benefits. Even relatively small heat storage already facilitates lower electricity storage needs and power system costs. Yet, such flexible operations do not appear to be a “must-have” in the scenarios modeled here. Overall, the need to add firm generation and storage capacities still remains limited even in a less optimistic setting if heat pumps are operated as fully inflexible loads.
Acknowledgments
We thank our colleague Adeline Guéret for supporting the calculations described in section 4.3. We further thank various colleagues of the Ariadne project for feedback on an earlier draft. We gratefully acknowledge financial support from the German Federal Ministry of Education and Research (BMBF) via the Kopernikus project Ariadne (FKZ 03SFK5N0).
Author contributions
Conceptualization: WS, Methodology: AR, CG, DK, WS, Formal analysis: AR, DK, WS, Investigation: AR, DK, WS, Data Curation: AR, CG, DK, Writing - Original Draft: AR, DK, Writing - Review & Editing: CG, WS, Visualization: AR, CG, DK, Funding acquisition: WS
References
- Altermatt et al., [2023] Altermatt, P. P., Clausen, J., Brendel, H., Breyer, C., Gerhards, C., Kemfert, C., Weber, U., and Wright, M. (2023). Replacing gas boilers with heat pumps is the fastest way to cut German gas consumption. Communications Earth & Environment, 4(1):56.
- Bernath et al., [2019] Bernath, C., Deac, G., and Sensfuß, F. (2019). Influence of heat pumps on renewable electricity integration: Germany in a European context. Energy Strategy Reviews, 26:100389.
- Bundesnetzagentur, [2018] Bundesnetzagentur (2018). Genehmigung des Szenariorahmens 2019-2030. Technical report.
- Chen et al., [2021] Chen, Y.-k., Jensen, I. G., Kirkerud, J. G., and Bolkesjø, T. F. (2021). Impact of fossil-free decentralized heating on northern European renewable energy deployment and the power system. Energy, 219:119576.
- ENTSOE, [2018] ENTSOE (2018). TYNDP 2018. Project Sheets. Technical report.
- Gaete-Morales, [2021] Gaete-Morales, C. (2021). emobpy: application for the German case.
- Gaete-Morales et al., [2021] Gaete-Morales, C., Kramer, H., Schill, W.-P., and Zerrahn, A. (2021). An open tool for creating battery-electric vehicle time series from empirical data, emobpy. Scientific Data, 8(1):152.
- Hedegaard and Münster, [2013] Hedegaard, K. and Münster, M. (2013). Influence of individual heat pumps on wind power integration – Energy system investments and operation. Energy Conversion and Management, 75:673–684.
- Hilpert, [2020] Hilpert, S. (2020). Effects of Decentral Heat Pump Operation on Electricity Storage Requirements in Germany. Energies, 13(11):2878.
- IEA, [2022] IEA (2022). The future of heat pumps. Technical report, IEA, Paris.
- Kröger et al., [2023] Kröger, D., Peper, J., and Rehtanz, C. (2023). Electricity market modeling considering a high penetration of flexible heating systems and electric vehicles. Applied Energy, 331:120406.
- Lizana et al., [2023] Lizana, J., Halloran, C. E., Wheeler, S., Amghar, N., Renaldi, R., Killendahl, M., Perez-Maqueda, L. A., McCulloch, M., and Chacartegui, R. (2023). A national data-based energy modelling to identify optimal heat storage capacity to support heating electrification. Energy, 262:125298.
- Papaefthymiou et al., [2012] Papaefthymiou, G., Hasche, B., and Nabe, C. (2012). Potential of Heat Pumps for Demand Side Management and Wind Power Integration in the German Electricity Market. IEEE Transactions on Sustainable Energy, 3(4):636–642.
- Pietzcker et al., [2021] Pietzcker, R., Feuerhahn, J., Haywood, L., Knopf, B., Leukhardt, F., Luderer, G., Osorio, S., Pahle, M., Dias Bleasby Rodrigues, R., and Edenhofer, O. (2021). Notwendige CO2-Preise zum Erreichen des europäischen Klimaziels 2030. Technical report, Potsdam Institute for Climate Impact Research. Artwork Size: 20 pages Medium: pdf.
- Roth and Schill, [2023] Roth, A. and Schill, W.-P. (2023). Renewable heat. Open Energy Tracker.
- Ruhnau et al., [2020] Ruhnau, O., Hirth, L., and Praktiknjo, A. (2020). Heating with wind: Economics of heat pumps and variable renewables. Energy Economics, 92:104967.
- Schill and Zerrahn, [2020] Schill, W.-P. and Zerrahn, A. (2020). Flexible electricity use for heating in markets with renewable energy. Applied Energy, 266:114571.
- Wiese et al., [2019] Wiese, F., Schlecht, I., Bunke, W.-D., Gerbaulet, C., Hirth, L., Jahn, M., Kunz, F., Lorenz, C., Mühlenpfordt, J., Reimann, J., and Schill, W.-P. (2019). Open Power System Data – Frictionless data for electricity system modelling. Applied Energy, 236:401–409.
- Zerrahn et al., [2018] Zerrahn, A., Schill, W.-P., and Kemfert, C. (2018). On the economics of electrical storage for variable renewable energy sources. European Economic Review, 108:259–279.
Appendix SI Supplemental Information
SI.1 Model
SI.1.1 Electric vehicles
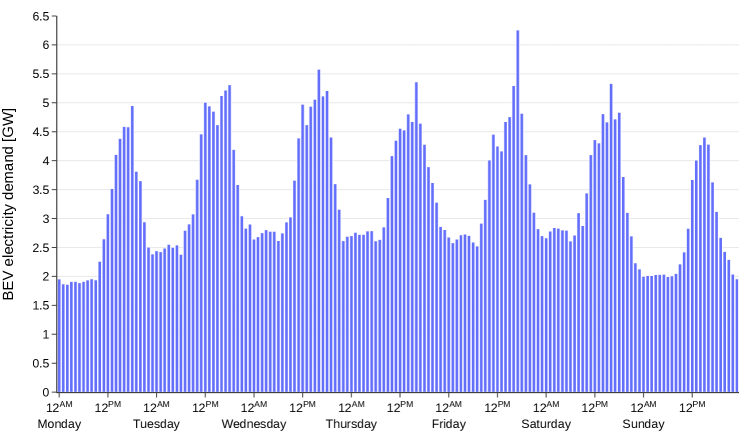
In this analysis, we include battery electric vehicle (BEV) time series using the emobpy tool [7]. The dataset [6] used has been created utilizing data from the “Mobilität in Deutschland” survey, distinguishing between commuter and spontaneous drivers and incorporating various factors such as trip frequencies, distances, trip duration, departure times, charging station availability, and charging strategies, as well as the use of popular BEV models.
The dataset encompassed multiple charging strategies. For this research, we select the “immediate-balanced” approach to reflect the electricity drawn from the grid. Under this charging strategy, the vehicles’ batteries are charged upon arriving at charging stations, with a constant and often lower power rating than the charging station. This approach ensured that the BEV reached a 100% state of charge just before commencing the next trip. The selected time series are scaled to represent the demand for 12.5 million battery electric vehicles with an annual electricity demand of 29 TWh (see Figure SI.1).
SI.1.2 Green hydrogen
The production of green hydrogen is modeled in a simple way, following the approach described in [19]. We assume that a given hydrogen demand of 28 TWh has to be covered by electrolysis over the course of a year (Equation 1). That is, we implicitly assume a temporally flexible hydrogen demand or unlimited hydrogen storage. In contrast, investments into electrolysis capacity are modeled endogenously (Equation 3).
| (1) | |||
| (2) | |||
| (3) |
Appendix SI Tables
| Year of construction | Overall number of | Annual heating energy | Floor area |
|---|---|---|---|
| buildings [million] | demand [kWh/m2] | [million m2] | |
| One- & two-family houses | |||
| Before 1957 | 1.41 | 276 | 247 |
| 1958-1978 | 2.46 | 203 | 431 |
| 1979-1994 | 2.55 | 153 | 446 |
| 1995-2009 | 3.02 | 112 | 528 |
| 2010-2019 | 1.75 | 66 | 306 |
| After 2019 | 2.15 | 15 | 375 |
| Multi-family houses | |||
| Before 1957 | 0.34 | 223 | 170 |
| 1958-1978 | 0.64 | 164 | 322 |
| 1979-1994 | 0.46 | 130 | 230 |
| 1995-2009 | 0.47 | 103 | 239 |
| 2010-2019 | 0.36 | 51 | 181 |
| After 2019 | 0.46 | 11 | 232 |
| Country | Germany | Austria | Belgium | Switzerland | Czech Republic | Denmark | France | Luxembourg | Italy | Netherlands | Poland | |
|---|---|---|---|---|---|---|---|---|---|---|---|---|
| Technology | Lower | Upper | fixed capacities | |||||||||
| Run-of-river hydro | 5.60 | 5.60 | 6.14 | 0.15 | 4.11 | 0.40 | 0 | 13.64 | 0.05 | 5.64 | 0.05 | 0.54 |
| Nuclear | 0 | 0 | 0 | 0 | 1.19 | 4.04 | 0 | 58.21 | 0 | 0 | 0.49 | 0 |
| Lignite | 0 | 0 / 9.3 | 0 | 0 | 0 | 3.89 | 0 | 0 | 0 | 0 | 0 | 6.32 |
| Hard coal | 0 | 0 / 9.8 | 0 | 0.62 | 0 | 0.37 | 0.77 | 0 | 0 | 0 | 0 | 9.88 |
| Natural gas (CCGT) | 0 | 17.60 | 2.82 | 7.61 | 0 | 1.35 | 0 | 6.55 | 0 | 38.67 | 8.65 | 5.00 |
| Natural gas (OCGT) | 0 | 19.60 | 0.59 | 1.08 | 0 | 0 | 0 | 0.88 | 0 | 5.40 | 0.64 | 0 |
| Oil | 0 | 1.20 | 0.17 | 0 | 0 | 0.01 | 0 | 0 | 0 | 0 | 0 | 0 |
| Other | 0 | 0 | 0.95 | 1.32 | 0.89 | 1.23 | 0.24 | 1.87 | 0.03 | 5.99 | 3.77 | 6.82 |
| Bio energy | 6.00 | 6.00 | 0.60 | 0.21 | 1.20 | 1.06 | 0.67 | 2.56 | 0.05 | 4.93 | 0.54 | 1.41 |
| Onshore wind | 56.00 | 115 / +Inf | 10.00 | 5.93 | 1.25 | 3.00 | 5.48 | 44.11 | 0.35 | 19.05 | 8.30 | 11.28 |
| Offshore wind | 7.77 | 30 / +Inf | 0 | 4.30 | 0 | 0 | 4.78 | 3.00 | 0 | 0.60 | 6.72 | 0.90 |
| Solar PV | 59.00 | +Inf | 15.00 | 13.92 | 11.00 | 10.50 | 4.75 | 42.63 | 0.25 | 49.33 | 15.46 | 12.19 |
| Lithium-ion batteries | ||||||||||||
| … power in/out | 0 | +Inf | 0.53 | 0.90 | 0.39 | 0.50 | 0.44 | 3.10 | 0.06 | 1.56 | 0.75 | 0.25 |
| … energy [GWh] | 0 | +Inf | 0.53 | 0.90 | 0.39 | 0.50 | 0.44 | 3.10 | 0.06 | 1.56 | 0.75 | 0.25 |
| Power-to-gas-to-power | ||||||||||||
| … power in/out | 0 | +Inf | 0 | 0 | 0 | 0 | 0 | 0 | 0 | 0 | 0 | 0 |
| … energy [GWh] | 0 | +Inf | 0 | 0 | 0 | 0 | 0 | 0 | 0 | 0 | 0 | 0 |
| Pumped hydro storage | ||||||||||||
| … power in/out | 11.60 | 11.60 | 5.70 | 1.40 | 3.99 | 1.16 | 0 | 3.50 | 1.31 | 11.90 | 0 | 1.50 |
| … energy [GWh] | 81.20 | 81.20 | 39.88 | 9.77 | 27.92 | 8.11 | 0 | 24.50 | 9.17 | 83.29 | 0 | 10.51 |
| Reservoirs | ||||||||||||
| … power out | 2.94 | 2.94 | 7.83 | 0 | 8.15 | 1.17 | 0 | 10.09 | 0 | 13.07 | 0 | 0.36 |
| … energy [TWh] | 0 | 0 | 15.66 | 0 | 16.30 | 2.34 | 0 | 20.19 | 0 | 26.13 | 0 | 0.73 |
| Electrolysis | 10 | 10 | 0 | 0 | 0 | 0 | 0 | 0 | 0 | 0 | 0 | 0 |
| Interest | Lifetime | Availability | Overnight costs | Efficiency | Marginal costs | ||||||
|---|---|---|---|---|---|---|---|---|---|---|---|
| Technology | rates | energy | charging power | discharging power | charging | discharging | charging | discharging | |||
| [years] | [1000 EUR] | [1000 EUR] | [1000 EUR] | [EUR] | [EUR] | ||||||
| Li-ion battery | 0.04 | 20 | 0.98 | 142 | 80 | 80 | 0.96 | 0.96 | 0.5 | 0.5 | |
| Pumped hydro | 80 | 0.89 | 10 | 550 | 550 | 0.97 | 0.91 | 0.5 | 0.5 | ||
| Power-to-gas-to-power | 25 | 0.95 | 2 | 550 | 435 | 0.73 | 0.42 | 0.5 | 0.5 | ||
| Technology | Interest rates | Lifetime | Availability | Overnight costs | Fixed costs | Efficiency | Carbon content | Fuel costs |
|---|---|---|---|---|---|---|---|---|
| [years] | [1000 EUR] | [1000 EUR] | [t/MWh] | [EUR/MWh] | ||||
| Run-of-river | 0.04 | 50 | 1.00 | 3,000 | 30 | 0.90 | 0.00 | 0 |
| Nuclear | 40 | 0.91 | 6,000 | 30 | 0.34 | 0.00 | 3.4 | |
| Lignite | 35 | 0.95 | 1,500 | 30 | 0.38 | 0.40 | 5.5 | |
| Hard coal | 35 | 0.96 | 1,300 | 30 | 0.43 | 0.34 | 8.3 | |
| Closed-cycle gas turbine | 25 | 0.96 | 800 | 20 | 0.54 | 0.20 | 30.0 | |
| Open-cycle gas turbine | 25 | 0.95 | 400 | 15 | 0.40 | 0.20 | 30.0 | |
| Oil | 25 | 0.90 | 400 | 6.7 | 0.35 | 0.27 | 29.0 | |
| Other | 30 | 0.90 | 1,500 | 30 | 0.35 | 0.35 | 18.1 | |
| Bioenergy | 30 | 1.00 | 1,951 | 100 | 0.49 | 0.00 | 32.5 | |
| Wind onshore | 25 | 1.00 | 1,182 | 35 | 1.00 | 0.00 | 0 | |
| Wind offshore | 25 | 1.00 | 2,506 | 100 | 1.00 | 0.00 | 0 | |
| Solar photovoltaic | 25 | 1.00 | 400 | 25 | 1.00 | 0.00 | 0 |