1103 \vgtccategoryResearch \vgtcpapertypeApplication/Design Study \authorfooter 1 Harvard John A. Paulson School of Engineering and Applied Sciences 2 Adobe Research 3 The École polytechnique fédérale de Lausanne (EPFL)
VIRD: Immersive Match Video Analysis for
High-Performance Badminton Coaching
Abstract
Badminton is a fast-paced sport that requires a strategic combination of spatial, temporal, and technical tactics. To gain a competitive edge at high-level competitions, badminton professionals frequently analyze match videos to gain insights and develop game strategies. However, the current process for analyzing matches is time-consuming and relies heavily on manual note-taking, due to the lack of automatic data collection and appropriate visualization tools. As a result, there is a gap in effectively analyzing matches and communicating insights among badminton coaches and players. This work proposes an end-to-end immersive match analysis pipeline designed in close collaboration with badminton professionals, including Olympic and national coaches and players. We present VIRD, a VR Bird (i.e., shuttle) immersive analysis tool, that supports interactive badminton game analysis in an immersive environment based on 3D reconstructed game views of the match video. We propose a top-down analytic workflow that allows users to seamlessly move from a high-level match overview to a detailed game view of individual rallies and shots, using situated 3D visualizations and video. We collect 3D spatial and dynamic shot data and player poses with computer vision models and visualize them in VR. Through immersive visualizations, coaches can interactively analyze situated spatial data (player positions, poses, and shot trajectories) with flexible viewpoints while navigating between shots and rallies effectively with embodied interaction. We evaluated the usefulness of VIRD with Olympic and national-level coaches and players in real matches. Results show that immersive analytics supports effective badminton match analysis with reduced context-switching costs and enhances spatial understanding with a high sense of presence.
keywords:
Sports Analytics, Immersive Analytics, Data VisualizationK.6.1Management of Computing and Information SystemsProject and People ManagementLife Cycle;
\CCScatK.7.mThe Computing ProfessionMiscellaneousEthics
\teaser
![[Uncaptioned image]](/html/2307.12539/assets/images/teaser.png) VIRD is an immersive VR platform for top-down badminton match analysis.
Left: Users start with a high-level Match Summary (a), then refine their analysis using the Shot Filter (b). Detailed rally and shot information is available through the Rally Menu (c) and Situated Visualizations (d) on a virtual court.
Right: Users can link to a Game View (e) of a selected shot (Summary Mode) or an entire rally (Game Mode), featuring synchronized video and 3D dynamic player and shot representations.
\vgtcinsertpkg
VIRD is an immersive VR platform for top-down badminton match analysis.
Left: Users start with a high-level Match Summary (a), then refine their analysis using the Shot Filter (b). Detailed rally and shot information is available through the Rally Menu (c) and Situated Visualizations (d) on a virtual court.
Right: Users can link to a Game View (e) of a selected shot (Summary Mode) or an entire rally (Game Mode), featuring synchronized video and 3D dynamic player and shot representations.
\vgtcinsertpkg
Introduction
In the highly competitive world of professional badminton, coaches and players constantly seek ways to gain an edge over their opponents. Detailed match analysis has become indispensable for identifying key patterns, developing winning strategies, and creating tailored training plans. Traditional methods of match analysis require coaches to review video footage of matches, take notes, and identify trends and potential areas for improvement.
However, these traditional methods have significant drawbacks. First, traditional methods require coaches to manually annotate videos while analyzing the match. In order to gather insights from match footage, coaches have to watch videos several times to collect data, such as players’ statistical summaries, shuttle locations and types, and playing styles. After that, coaches have to compare the summary data with their observations to iterate on their hypotheses, verify insights, and draw conclusions. This data collection and analysis process can be highly time-consuming and mentally demanding, as coaches have to watch countless rallies multiple times and maintain a high level of attention to detail. While the analysis efforts vary widely, a badminton match can contain 50 to over 100 rallies and the coaches typically spend 3 to 5 hours analyzing a full match video according to our formative study. As a result, this can increase their cognitive load and limit the time coaches spend working with their players. Furthermore, traditional methods struggle to capture and communicate badminton’s inherently spatial nature effectively. Badminton players use height- and speed-varying tactics to control the pace and aggression of their games, which is harder to perceive in projected 2D videos. In turn, coaches rely on physical demonstrations to help players conceptualize the insights. The limited coaching time available for high-performance athletes can restrict the amount of information conveyed during coaching sessions. Finally, traditional methods separate the in-game data from its physical context. Consequently, coaches often need to switch back and forth between the videos and the collected data, inevitably increasing the mental effort of the analysis process. As shown in our formative studies (Sec. 2), there is a demand for more efficient match analysis and coaching tools.
In this work, we closely collaborated with Olympic badminton professionals to design VR Bird (VIRD)111A badminton shuttlecock is also informally called a bird., a novel interactive coaching tool for badminton match analysis in VR. To address the limitations of traditional methods, VIRD adopts a top-down analysis approach to support an efficient iterative analysis process. It leverages computer vision (CV) techniques to extract game statistics and 3D shot and player data, and enables situated analysis of spatial and dynamic game data in immersive 3D space with an interactive approach. Immersive analytics were found beneficial in supporting 3D data analysis with spatial understanding and immersion [50]. With its high portability and affordability, we chose VR HMD as our targeted platform to design immersive analysis solutions for badminton video match analysis.
To design VIRD, we performed a design study to answer the following three research questions. First, we conduct a formative study with badminton professionals to understand “What data are required for analyzing matches and developing coaching insights?” Second, we identified gaps and iterated solutions with coaches to answer “What is the ideal coaching workflow for badminton video analysis and communication?”. Finally, we conducted a multi-staged user-centered design to address “How to design an integrated video analysis tool to support badminton coaching for professional coaches and players?” We conducted case studies with high-performance badminton experts, including Olympic and national team coaches and players, on match analysis using VIRD. Both coaches and the player were able to perform effective match analyses, and verify and present insights using VIRD with high satisfaction. They leveraged immersive 3D visualizations to generate new insights with concrete evidence, such as observing shot distributions or pinpointing specific game moments, and used VR interaction to accelerate their iteration from hypotheses to insights.
Our research has four main contributions: 1) a formative study with Olympic badminton professionals to identify gaps in current match analysis workflow for coaching, 2) a characterization of goals and tasks for badminton match analysis in coaching, 3) an end-to-end immersive video analysis tool, VIRD, with state-of-the-art CV-based data collection and a VR analytic interface for badminton coaching, and 4) case studies with high-performance badminton experts to evaluate the usefulness of VIRD. Our results suggest that applying immersive analytics to sports videos, with CV-based data collection and human-in-the-loop analysis, can be highly effective for sports professionals.
1 Related Work
Visual Analytics of Sports Games. Sports visualization research often aims to visualize spatial and dynamic data in context, e.g., on a court diagram (basketball[41], tennis[56], baseball[12]), embedded in the game videos (soccer [48], basketball [28, 9]) or projected on a virtual court in immersive environments (baseball [63], badminton[10]). This is largely because contextual understanding is crucial for deriving meaningful and actionable insights from sports games [51, 39, 17].
For racket sports in particular, spatial and temporal data, such as shot locations and trajectories, are crucial for game analysis and regulations. LucentVision [40] is a commercial tennis visualization system based on real-time ball/player tracking. It offers virtual replays of ball trajectories and presents a color heatmap to show the coverage of player movements. Similarly, the Hawk-eye system [38] provides 3D views of tracked tennis balls using multiple cameras, and extends to other sports like baseball and soccer for enhanced game viewing and officiating.
Two prior studies used immersive analytics to analyze spatial badminton stroke data. ShuttleSpace [61] visualizes badminton shot trajectories in a VR environment to support coaches in analyzing shot data from a first-person perspective. They provide an integrated visual design that augments 3D trajectory data with 2D statistical information using a first-person perspective visualization and peripheral vision. ShuttleSpace also enables natural and efficient trajectory selection in VR with a stroke metaphor, allowing analysts to select trajectories by imitating badminton strokes. The system has been evaluated through case studies conducted by domain experts, demonstrating its potential for facilitating badminton data analysis. TIVEE [10] designed an immersive VR system for experts to analyze sequential stroke trajectories in badminton. It allows experts to explore different tactics from a third-person perspective, and provides a detailed court view for inspecting and explaining tactics that lead to wins and losses. Case studies with professional badminton experts demonstrate the system’s effectiveness in identifying patterns of commonly used tactics.
In contrast to tennis, official badminton games do not use tracking systems. Thus, most badminton professionals lack access to manually collected shot datasets [61, 10] and rely on video-based match analysis (Sec. 2.1). Our study fills this gap by providing an end-to-end immersive video analytic tool, VIRD, that integrates computer vision-based data collection directly from match videos. Compared to prior work [10, 61], our study provides comprehensive match analysis for coaching, emphasizing both analysis and communication of insights.
Game Reconstruction of Sports Videos. Reconstructing 3D sports games from videos offers opportunities to improve game understanding and analytics. Computer vision research has focused on reconstructing game scenes and player or ball movement for various sports, such as basketball [8, 62], tennis [40, 38], soccer [45], volley ball [7], or human motion in sports [45]. Badminton games present unique challenges, such as single-camera recordings, fast shuttle speed (the fastest shuttle speed can be over 250 mph), and complex player movement.
Prior studies have addressed shuttlecock detection and tracking, including an instant review system to determine whether a shot was in or out [22]. Other studies focused on tracking the speed, rotation angle, and athlete’s body transformation using sensors and path-tracking algorithms[34]. Recently, MonoTrack [31] improved state-of-the-art models [19, 14, 54] on court recognition and 2D trajectory estimation based on badminton domain knowledge. We use MonoTrack [31] to accurately extract and segment 3D shuttle trajectories in match videos.
While there has been some research on the detection and tracking of badminton players [16, 43], there has been relatively little focus on estimating their poses and shapes. Fortunately, SMPL [32], a learned model of human body shape, allows accurate human shape representation from basic human 3D models. In addition, recent state-of-the-art algorithms are capable of performing 3D human pose and shape estimation [64, 36]. Among them, CLIFF [27] can estimate SMPL parameters from a 2D video, which we use to reconstruct player poses.
Immersive Analytics for Spatial and Dynamic Data. Immersive analytics (IA) has gained significant attention among visualization researchers due to its ability to facilitate analytical reasoning and collaboration for analyzing high-dimensional and multivariate data [50, 13]. IA offers several advantages over traditional desktop visualizations [23] due to its large screen spaces and embodied interaction offered by AR/VR technologies: immersion [35, 18], multi-modal interaction [6, 33, 44], and presenting data in-situ [5, 15, 37], which improves spatial understanding and user experience throughout the visual analysis process. Specifically, prior studies found several benefits of analyzing spatial and dynamic data in immersive environments, i.e., identifying spatial attributes such as distance [60, 24], transitioning between 2D and 3D views [59], and the visceral experience of viewing dynamic, physical data in VR [26].
With these identified benefits of IA, recent works investigate applying immersive analytics to sports [30]. Besides ShuttleSpace [61] and TIVEE [10] for badminton shuttle trajectory analysis in VR, Lin et al. [29] present real-time basketball shot arcs for situated analysis in AR during free-throw training. Sumiya et al. [49] applied a similar approach for basketball shooting training in VR. Rezzil [46] provides a commercial soccer training system in VR that allows players to evaluate their performance with instant visual feedback. Zou et al. [63] presents real-time bat swing spatial data for baseball batting training in VR.
While most IA work in sports focuses on providing real-time feedback for training, our study focuses on immersive video analytics for sports coaching with spatial and dynamic data extracted from sports videos. To the best of our knowledge, we are the first study to propose an immersive analysis system for sports video analysis.
2 Formative Study with Olympian Coaches & Players
We applied a user-centered design process to develop VIRD and involved target users at every design stage. All experts involved in our study are Olympic or national team coaches and players. Section 2 presents the gaps in match analysis based on expert interviews with coaches and players. Section 3 presents our goal and task analysis, which informed the design of VIRD. Section 4 presents VIRD’s design based on three rounds of user testing with coaches. Section 5 presents the evaluation of VIRD with both coaches and players on match analysis for developing game strategy and communicating insights.
2.1 Procedures
To understand current practice and identify gaps in badminton coaching, we interviewed five professional badminton players and coaches (I1-I5; M = 2, F = 3; Age: 30-45). All of them are former Olympic players representing Canada, Taiwan, and the US. All of them have at least 10 years of player experience and four became professional coaches after their playing careers with 2 to 15 years of coaching experience.
We conducted 1-hour semi-structured interviews online to elicit the interviewee’s background, overall coaching workflow, video and data usage in their coaching, and how they evaluate the player’s performance in the video analysis. Finally, we asked interviewees to analyze a short match video to demonstrate their typical analysis workflow.
All interviews were transcribed and analyzed using affinity mapping. Our analysis focused on understanding the current badminton coaching practice and identifying gaps in their match analysis workflow.
2.2 Findings and Gaps
Overall, we observed that coaching practices varied widely among the interviewees due to varying resource levels, player skill levels, and coaching styles. The coaching process typically involves a significant amount of video analysis for both coaches and players. For players, videos are crucial as they help players become aware of their playing technique and style and allow them to create a mental model of other players. Players are often told to record their own match and watch the videos multiple times, e.g., “Most coaches recommend we watch it several times and break it down to focus on one thing at a time” (I3). Coaches also rely on videos to direct coaching by analyzing the root cause of player performance and communicating insights to players, e.g., “They won’t understand what I am saying unless they see it physically” (I2).
All interviewees agreed that video analysis is time-consuming. I4 noted that “if the match is 30-40 minutes, it took 3 to 5 hours to rewatch and discuss with your coach”. When analyzing the videos, coaches and players watch matches, take notes, analyze them for insights, and discuss their findings. With more resources, coaches can proactively share their insights with players, but this requires a significant time investment (I2). Alternatively, in cases where access to a coach is limited, players may seek coaching by requesting feedback on areas to improve (I3, I5) or by coaching each other (I1, I3, I4). Therefore, analyzing matches for coaching is crucial for both coaches and players.
For clarity on badminton terminology, note that a match comprises the best-of-three games. Each game has multiple rallies, with each rally awarding a point. Within every rally, players execute a series of shots. Below, we summarize four gaps in the current match video analysis.
2.2.1 The Current Bottom-Up Workflow is Inefficient
We observed that the experts we interviewed followed a bottom-up approach to generate their insights. They began by scanning videos to detect insights into a player’s playing style and weaknesses. For example, during video scanning, I3 promptly observed, “She’s a lefty … [so] she tends to lean more to her left side for a big forehand.” Upon forming an insight hypothesis, they scrutinized additional videos to identify similar patterns and validate their observations, e.g., “Is this just an outlier or some of these random matches where we didn’t do well, or concrete things that we need to work on?” (I2). Coaches repeatedly watched games until insights emerged and revisited the games to gather further evidence. Because of the limited time and resources to review footage, coaches and players might choose to only look at the most important parts, which leads to incomplete analysis and potentially less effective communication. In summary, the current bottom-up analysis workflow lacks support for efficient iteration and analytic reasoning.
2.2.2 Manual Data Collection from Videos is Time-Consuming
During the current workflow, experts manually collect summary statistics from watching the videos to reveal patterns quantitatively. This allows them to compare the player performance (I1, I2, I4) and communicate better with the players (I1, I2). For example, having these data benefit their coaching greatly, e.g., “If you had like 20 matches that you played for an entire year, then you have a better idea where you can dictate training” (I1). Further, concrete evidence like “70% of time when you do this, you win the point” (I2) allows players to immediately grasp the concept. However, when watching a video, paying attention to multiple metrics and patterns simultaneously is difficult. As a result, coaches and players have to watch the videos multiple times and focus on different aspects one at a time, such as opponent versus their player, and winner shots versus unforced errors. Such a manual process “takes up a lot of time” (I2). In summary, manually collecting data from videos hinders experts to perform match analysis efficiently.
2.2.3 Data Insights and Contexts are Presented Separately
Currently, data insights and videos are often presented separately. Coaches typically provide players with a summary of key insights, such as “you are pushing the tempo and make too many mistakes (6 errors in 11 points you lost)”, without directly connecting to specific moments in the video. This disjointed presentation hinders a comprehensive understanding of the game, as players may struggle to visualize the context behind the numbers. To bridge this gap, coaches might manually note timestamps of critical game moments with the help of some tools (e.g., YouTube, Hudl [21], Clutch [11]). However, collecting the video moments is still very tedious, as noted by I2 that “I have to spend 30 minutes per player writing things down, and another 1 hour to review notes with them to show them here’s what happened”. Moreover, without ample video evidence, sometimes it can be hard to convince the players of a particular finding. For example, I1 mentioned that “The kids don’t realize that they make a lot of unforced errors. If they watched the video clips, they’d understand it better”. Therefore, the current way of presenting data and video separately may impede a holistic understanding of the game due to an inefficient workflow.
2.2.4 2D Game Representation is Insufficient
When asked about the limitation of analyzing matches with videos, multiple coaches expressed that single-camera recordings might fail to capture essential game aspects, such as environmental conditions (e.g., wind), shot timing (“Speed seems slower in the video”), and player reactions. Although official badminton match are limited by monocular videos, some coaches use 360-degree videos in training for comparing players and their opposition, as “you can see both sides and like how the player reacts to the opponent in real-time” (I1). Slow-motion or zoomed views also assist in breaking down techniques and offering objective perspectives (I1, I3). I3 noted “when you’re hitting the shot, you only know how it feels, but you can’t see how it looks”. These remarks indicate that traditional 2D videos fall short in providing spatial comprehension and flexible viewing angles necessary for analyzing specific shot attributes. This finding aligns with previous work [61, 10].
2.3 Summary
Based on the formative study, we identified that high-performance badminton coaches and players perform match analysis to reveal the strengths and weaknesses of players and to develop playing or training strategies. However, data collection (i.e., bottom-up workflow and manual note-taking) and presentation (i.e., separation of data and videos and 2D game representations) gaps exist in their current analysis workflow, leading to inefficient match analysis and communication for coaching.
3 Goal & Task Analysis
3.1 Design Goals
To support coaches and players in analyzing matches and communicating insights effectively, we characterized four design goals with respect to the four identified gaps in Sec. 2.2.
G1. Providing a top-down analysis workflow. Our tool needs to present summary data to enable an immediate overview of the match, and support effective data exploration to discover regions of interest for detailed analysis. Unlike the traditional bottom-up approach that requires users to watch the videos sequentially to observe insights, the top-down approach supports users to analyze game details on demand, driven by observed patterns from summary data, as captured in “Overview first, zoom and filter, details on demand” [47].
G2. Collecting data from videos automatically. To avoid tedious manual data collection from users, our tool must provide the necessary data, including summary statistics and annotation of critical shots (i.e., winners and errors). This data should be automatically collected without user input during the match analysis.
G3. Integrating abstract data with game contexts. Even though summary data can help coaches identify patterns in the game, it is important to investigate the actual game moments in the video to verify observations and analyze root causes, as well as to present the insights to players. Similar to the concept of ”Search, show context, expand on demand” on large graphs [53], the user goal is to search for a meaningful context. Our tool should provide an easy transition between statistics and videos to support iterative analytical reasoning and communication.
G4. Visualizing spatial data in 3D space. 3D data should be visualized within a 3D space to support an accurate interpretation of their spatial attributes, e.g., shot speed and trajectory. In addition, our visualizations should support an analysis from flexible viewpoints to enhance users’ spatial perception and support objective perspectives.
3.2 Task Abstraction
We abstract six analytic tasks users perform when analyzing matches. Currently, users have to manually gather summary data to identify rallies of interest and manually navigate to each rally to extract insights.
T1. Identify the rallies of interest based on game summary data. Users first obtain an overview of the match performance at the game level (e.g., game length, scores). Based on the game metadata, they can focus on a subset of interesting rallies, such as the winning rallies by their player in the first game.
T2. Identify the rallies of interest based on rally summary data. After filtering rallies based on the game summary, users observe patterns of the game (e.g., playing style, competition) at the rally level, such as the ratio of winner versus error rallies. Such statistics allow them to identify specific patterns and further filter rallies for deeper analysis.
T3. Gain a statistical overview of rallies of interest. Focusing on a set of filtered rallies, users compare the statistics of individual rallies to obtain high-level insights, such as assessing the pace of a rally from shot counts and stress levels from score differences.
T4. Gain a spatial overview of rallies of interest. Additionally, users examine spatial and temporal aspects of individual shots among these rallies (e.g., shot trajectory and speed) and compare them against rally summary data (e.g., shot location distributions). The spatial information can help users gain an in-depth understanding of the shot-level data and form insights on specific rallies.
T5. Investigate game details of specific shots. After gaining an overview, users can dive into rallies to examine game details, such as player movement and shot sequence, to get deeper insights into a player’s performance. This often requires users to watch the game moment multiple times from different angles (e.g., player vs. opponent).
T6. Verify insights across rallies. Before concluding their analysis, users need to cross-validate other rallies with similar or contrasting patterns to update and verify their insights. Thus, users need to efficiently navigate to other game moments based on observed patterns.
4 VIRD - VR Bird Video Analysis Tool
We designed VIRD, our immersive video analysis platform for high-performance badminton coaching, targeting professional badminton coaches and players. VIRD features a top-down analysis approach and supports an integrated data and video analysis workflow based on CV-based data collection and a 3D interactive environment in VR. We iterated the designs based on expert feedback from three coaches.
4.1 Top-Down Analysis Workflow
To address G1, we designed a top-down analysis approach and verified it with two coaches (I1 and I2) in a follow-up interview. The top-down user flow contains four steps: First, users find rallies of interest based on summary statistics (T1, T2). Second, they compare and analyze the filtered rallies to gain initial insights (T3, T4). Third, they investigate game details to extract more specific insights (T5). Finally, they examine similar patterns across rallies to verify their insights (T6).
We tested the proposed workflow by gathering coaches’ feedback on a hypothetical top-down analysis workflow for examining a lost game:
Initially, the user reviews the game summary to form an impression of the match. Observing a tight score of 17 (Player A) to 21 (Player B), the user chooses to analyze the 21 rallies where Player A lost points (T1). They find 10 errors among the 21 lost points and focus their analysis on those 10 rallies ending in error shots (T2). On the rally level, the user finds that 6 out of 10 error rallies are short and towards the end of the game (T3). Examining the heat map and shot trajectories, the user notes that 70% are from the middle, and identifies them as defensive shots (T4). The user selects a short rally (T5) to study player movement and the sequence leading to the error shot. After watching multiple error rallies (T6), the user concludes that Player A needs to improve defensive shots on the backhand side and work on physical fitness.
Both coaches agreed that this workflow is precisely what they need. “We’re manually doing that because currently I won’t know where exactly to go back in the video to see all the unforced errors” (I2).
4.2 Computer Vision Data Preprocessing
To address G2, we applied state-of-the-art computer vision (CV) models to automate the data collection from videos. We developed a semi-automatic data processing pipeline for monocular match videos, which includes a manual game breakdown, shot classification algorithms, and automatic 3D shot and player reconstructions. Based on our task abstraction, three types of data must be extracted from a match video:
1) Game and Rally Summary are automatically computed based on manual annotation and output from CV models:
-
•
Rally Breakdown: To obtain a game summary, player scores and aggregated rally statistics are required. Therefore, each game needs to be split into rallies. We manually annotated the time ranges (start and end), player who serves, and the winning side of all rallies from the match video. Our algorithm then derives score and game information based on the rally breakdown.
-
•
Shot Breakdown: To obtain a rally summary, the duration of each rally and shot count are required. We obtain the timestamps and each shot’s hitter running MonoTrack [31] with minor manual clean-up.
2) 3D Spatial Data are automatically reconstructed from CV models.
-
•
3D Shot Trajectory: We automatically reconstruct 3D trajectories and velocities for all shots with MonoTrack [31].
- •
3) Shot Statistics are automatically derived from the 3D spatial data based on experts’ analysis requirements gathered in the formative study.
-
•
Shot Tendency: To detect whether a shot leading to a point is a winner or an unforced error, we first classify the shot tendency by approximating the shuttle’s velocity vector when it passes the net: the tendency is defensive when the vector is going upward (away from the ground), and offensive if opposite.
-
•
Shot Outcome: Our algorithm categorizes shots as winners, errors, or normal shots to calculate the winner and error shot counts. A rally ends with a winner by the scorer or an error by the point loser. If the last shot is offensive by the scorer, it’s a winner; if defensive by the point loser, the penultimate shot is the winner. Conversely, if the last shot is offensive by the point loser, it’s an error; if defensive by the scorer, the penultimate shot is an error. All others are normal shots.
-
•
Shot Distribution: From the formative study, coaches use shot locations to classify shots into six areas on the court, including front/middle/back on the left and right sides. To compute the shot distribution, our algorithm projects each shot’s start (from) and endpoint (to) onto the court to decide shot locations.
Overall, our data preprocessing pipeline is largely automated. Except for rally breakdown and winner/server annotation, all other data are obtained through automatic algorithms. The manual annotation takes up roughly half of the video duration (e.g., 30 minutes for labeling a 1-hour video). While our method is not entirely automatic, we anticipate that CV techniques may be able to address these manual annotations in the future, though they are beyond the scope of our current study.
4.3 Visual Designs
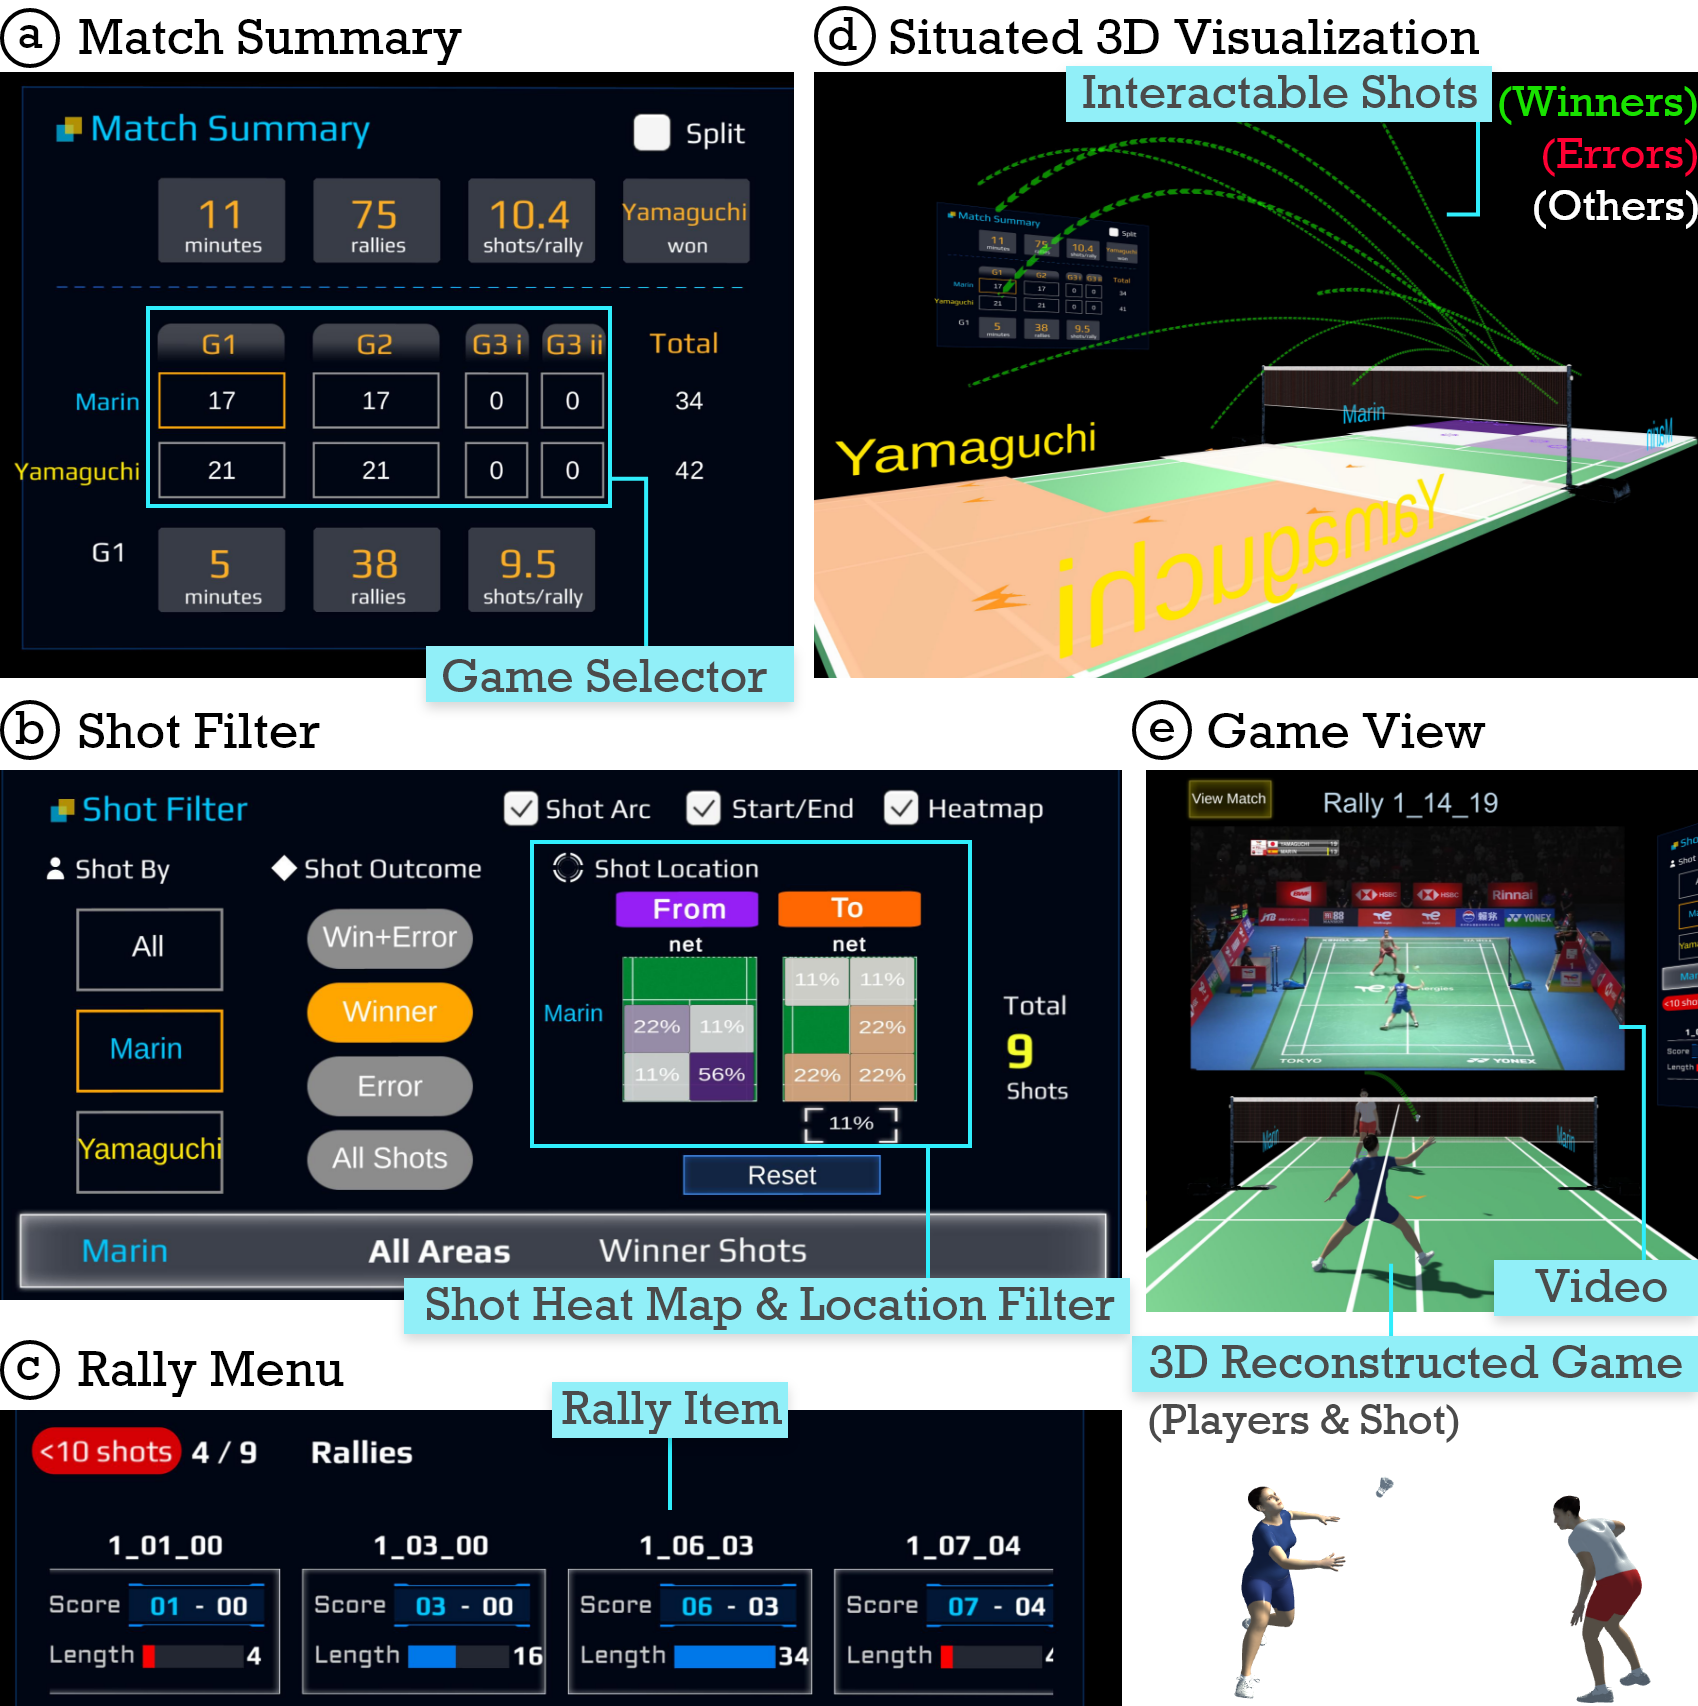
We designed five visual components to support the users’ analytic tasks and fulfill design goals (G1, G3 and G4). On a high level, users analyze data across rallies in Summary Mode (VIRD: Immersive Match Video Analysis for High-Performance Badminton Coaching-1) and dive into a specific rally in Game Mode (VIRD: Immersive Match Video Analysis for High-Performance Badminton Coaching-2). We describe components with examples based on the 2022 BWF World Championship match between Marin and Yamaguchi [3] (M2) used in our case studies (section 5).
(a) Match Summary (Figure 1a), supporting T1, enables users to identify rallies of interest by showing essential statistics, including the match’s duration, rally count, average shot count per rally, winner, and game scores. Users can select a game and view the rallies won by a player from the game selector (e.g., 17 rallies won by Marin in G1). Similar statistics for the selected game are displayed below. Game 3 is split into two halves by default due to the switch of sides at the midpoint, which prevents spatial data from being displayed on the same side. These statistics help experts identify more challenging or outstanding games for deeper analysis. Furthermore, based on user feedback, we added the option to split games into first and second halves for finer granularity. This was based on the need to analyze each half separately due to coaching advice provided during the midpoint break.
(b) Shot Filter (Figure 1b), supporting T2, enables users to analyze specific shots based on player and shot attributes. Finding specific game moments is important to analyze strengths and weaknesses. Therefore, our filter design includes key metrics to support immediate access to the necessary details, including players, shot outcomes, and locations. Coaches in our user testing found it extremely valuable to analyze shots filtered by players. For instance, out of Marin’s 17 points, 9 were scored through Marin’s winners, while 8 were scored due to Yamaguchi’s errors. This provides a different perspective than if Marin had 17 winners. Users can also analyze shot distribution by location filtering. For instance, users can select the purple 56% grid to filter Marin’s winner shots from the back right. Darker colors on the heatmap indicate more shots are from (purple) or to (orange) the area. We picked the color scheme to avoid visual clutter and provide an easier comparison of hot spots and shot tendencies between players and games.
(c) Rally Menu (Figure 1c), supporting T2 and T6, provides an overview of shot count and scoring cadence for the rallies of interest, with direct access to the specific rally upon selection. Each rally is displayed in a scrollable list with score and length information. Short rallies (less than 10 shots) are highlighted in red to draw special attention based on coaches’ requirements. For instance, users can discern the game’s tempo from the number of short rallies (4 out of 9) and the variation of shot counts among the rallies won by Marin. This overview of rally statistics helps identify patterns across rallies of interest (T4). Further, users can investigate game details in Game Mode by selecting a rally (T6), which allows easy transition to the game context.
(d) Situated 3D Visualizations (Figure 1d), supporting T4, display the 3D shot arcs and heatmap of filtered shots (e.g., all winners by Marin in Game 1) on a 1-to-1 virtual court. Shots are color-coded based on their outcome, with red for errors, green for winners, and white for all other shots. Interacting with individual shot arcs displays the shuttle’s dynamic trajectory in real-time (details in Sec. 4.4). The situated visualizations enable users to glean insights into shots’ spatial attributes, such as arc shapes and distributions. Experts use this design to quickly observe insights from shots across multiple rallies.
(e) Game View (Figure 1e), supporting T5, shows a 3D reconstructed game view along with the video to facilitate a more comprehensive analysis of game details. The 3D game view displays the dynamic movement of shots and players, enabling accurate spatial perception and flexible viewing angles. By examining the exact moment of the selected shot, users can quickly compare multiple shots in Summary Mode and expand their analysis to the selected rally in Game Mode.
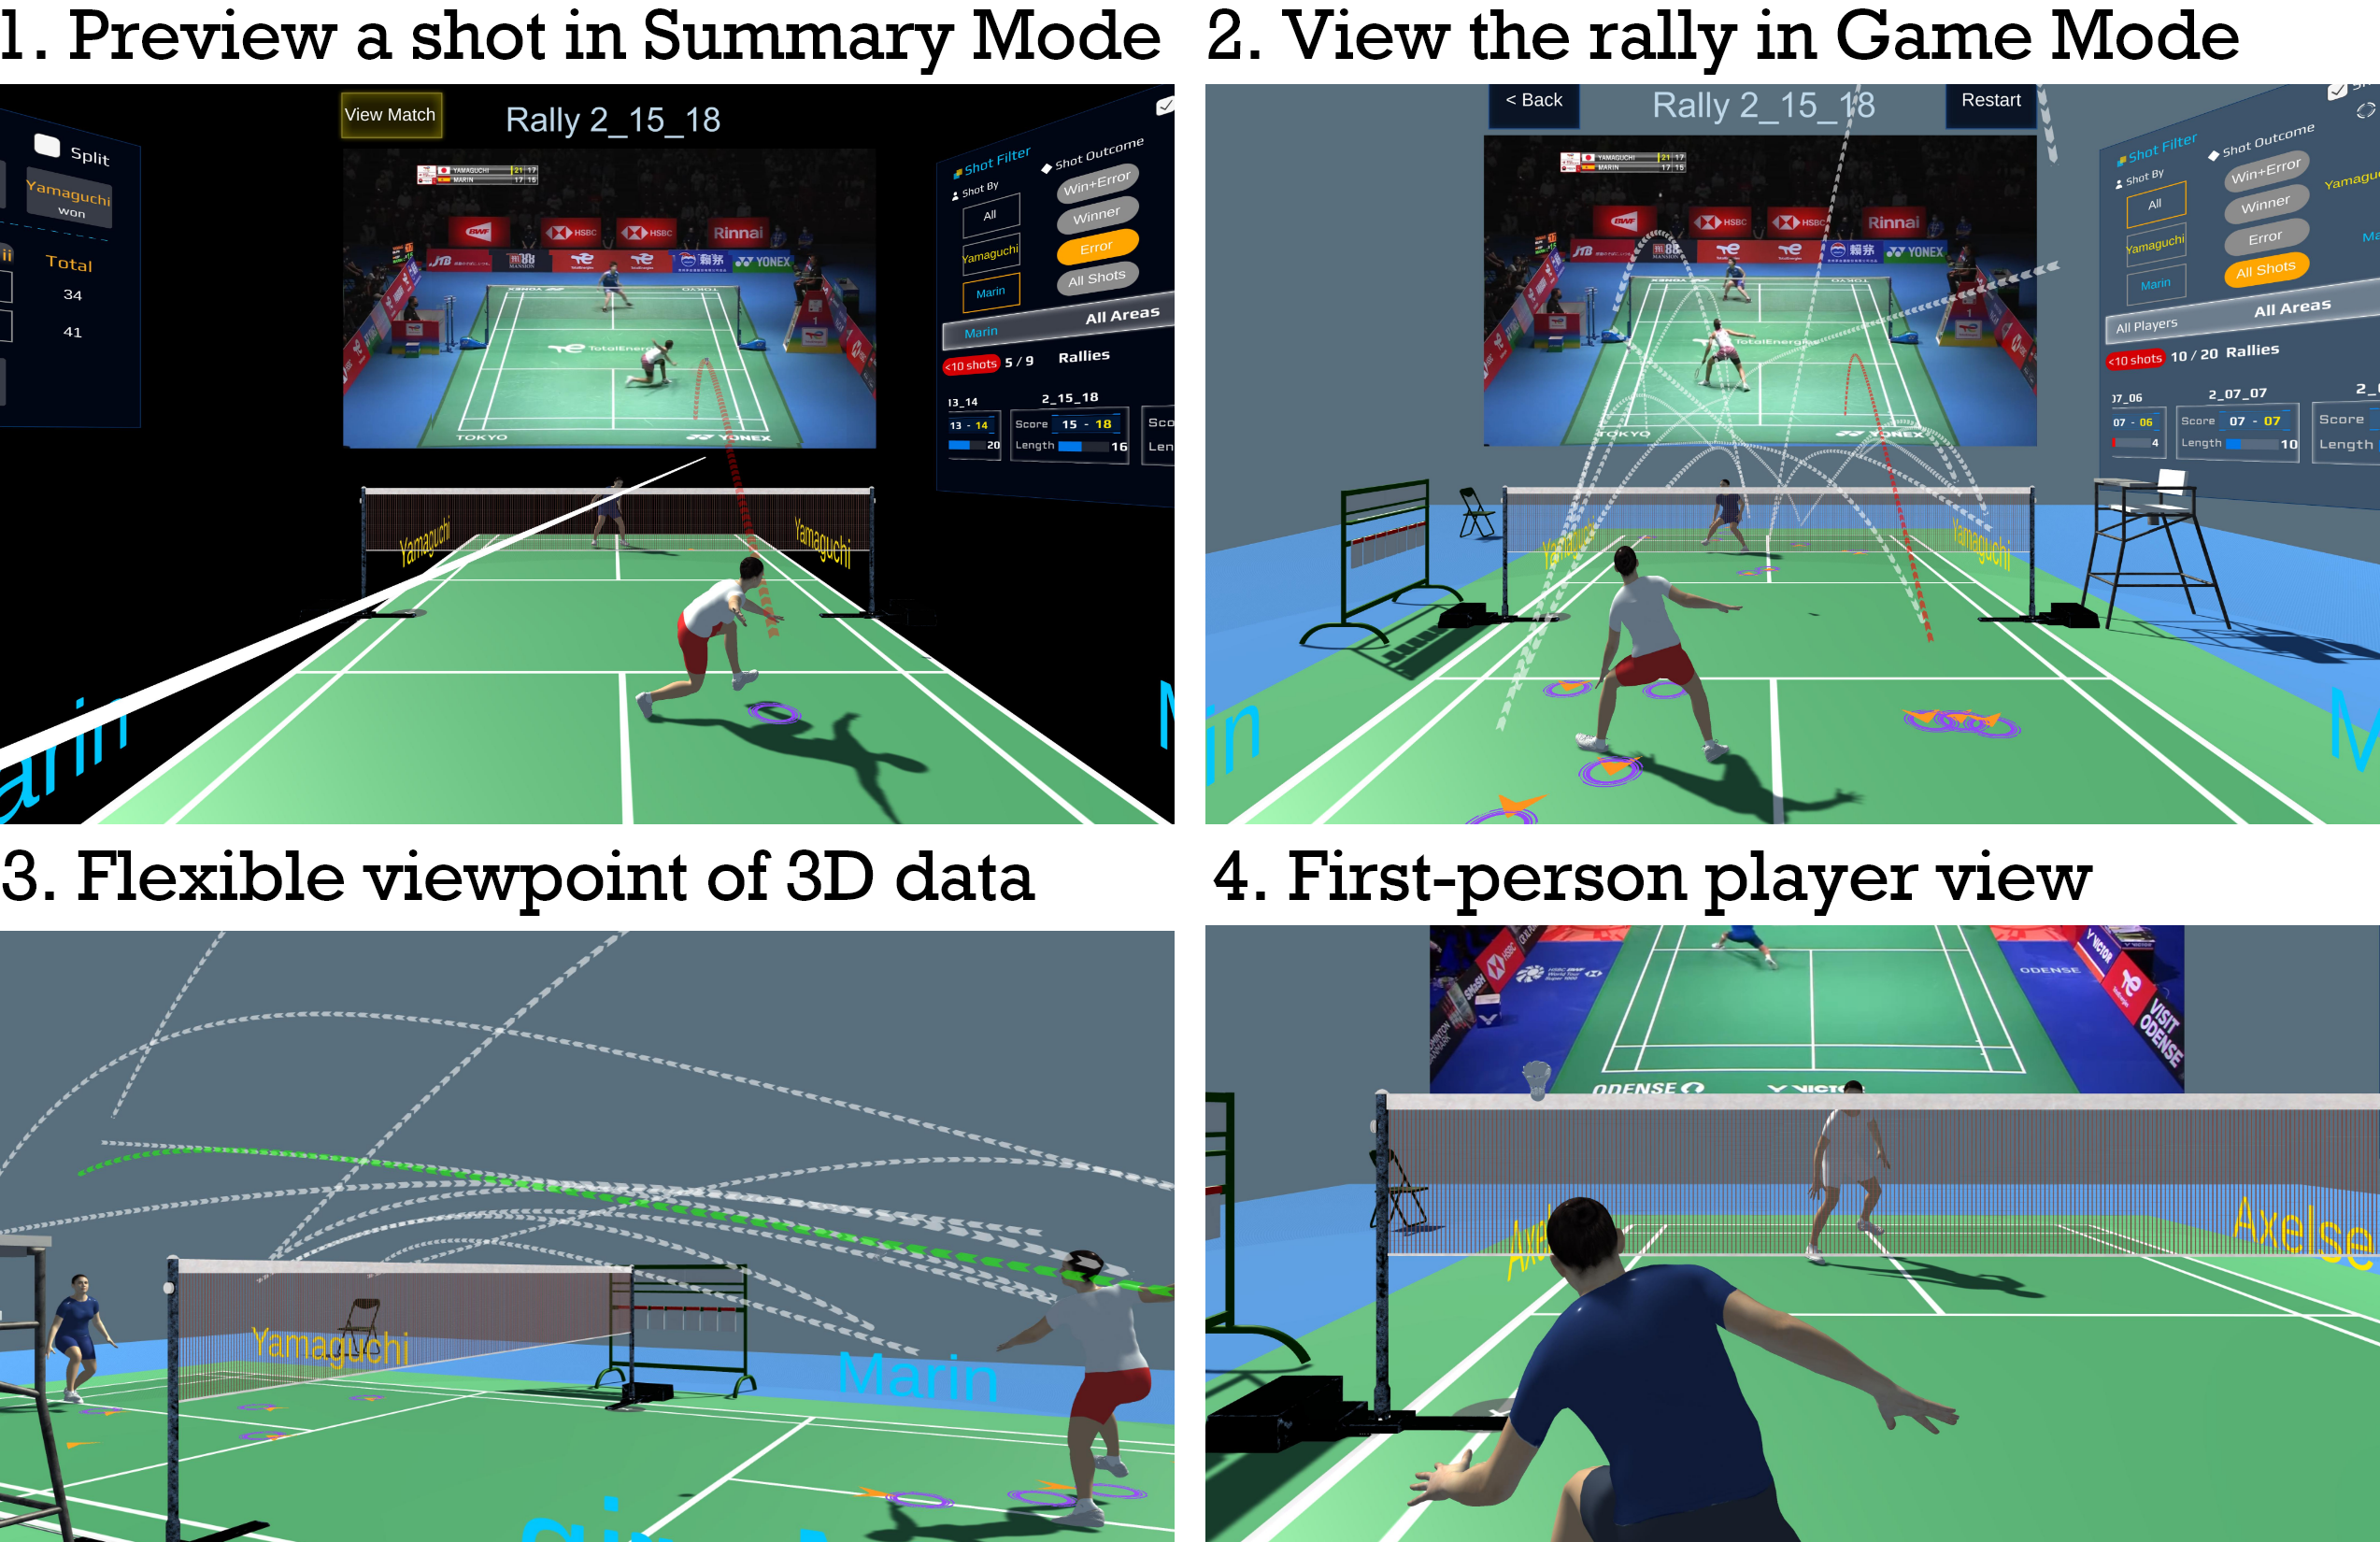
4.4 User Interaction
Users interact with the VIRD interface and visualizations using VR controllers. Each shot can be hovered to select, which will link to the game context of the shot (Figure 2-1) while in Summary Mode, showing a Game View that contains 3D dynamic shot trajectory and player poses, and the same shot duration in the video. This interaction allows users to instantly review the game moment of each shot in the filtered group (e.g., all winner shots) to obtain the context of 3D data. To navigate to the Game Mode (Figure 2-2), the users can select “View Match” from the Game View of the hovered shot, or select a rally from the Rally Menu. Furthermore, the user can directly hover over a shot arc in the rally (Figure 2-3) to play the video from the desired game moment. This feature allows replaying a specific shot or shot sequence efficiently.
Meanwhile, users can flexibly navigate the virtual court, by using a thumb stick or physically moving around, to obtain an accurate spatial and temporal perception of 3D data (Figure 2-3). Our VR environment also offers flexible viewpoints to analyze the 3D game from different perspectives, such as the first-person player view (Figure 2-4).
4.5 Design Iterations
We conducted three rounds of user testing throughout the design process with three active high-performance US badminton coaches (C1-C3; M=3; Age: 40-60). All were former players on the US, Malaysia, and Nepal badminton national teams, respectively. They have coaching experiences ranging from 15 to over 30 years. C1 had participated in our formative study while C2 and C3 were newly introduced at the design iteration stage. Given the challenges in accessing domain experts, we adopted a progressive approach wherein each coach evaluated our prototype at various design stages, focusing on distinct aspects. We tested VIRD on the Women’s Single match of the 2020 BWF World Tour Finals between Tai Tzu Ying and Carolina Marin [1].
Round 1. User flow and data analysis. The first round of testing was conducted on the initial prototype with C1, where we elicited the coach’s feedback on the overall analysis approach and the shot filtering features. The coach appreciated the top-down approach and interactive analysis process with immediate access to all match data and videos. On top of the existing summary data and filters, he suggested showing winner and error shots separately to support an immediate comparison of the shot patterns. Further, we designed two interaction methods to apply the shot location filter, 1) select buttons on the Shot Filter panel and 2) physically move to the desired area on the virtual court. However, the coach felt 1) is more useful as moving around the court to filter shots during the analysis would be tedious and distracting.
Round 2. Interaction with the visualization and interface. The second round of testing was run a month later with C2, with a focus on the interaction of linking the static data to the dynamic trajectories and videos. We showed the dynamic shot trajectory of a hovered shot arc, but to view the original rally video the user had to scroll through and select from the Rally Menu. The coach suggested augmenting the preview of the selected shot arc with the video, as “it takes time to find the video part of it right now”. He also emphasized the importance of pinpointing on the cause of the outcome during coaching. It is not enough to see where an error shot occurred in general, but to let the player see the shot sequence and player movement that lead to the outcome. Therefore, we implemented a shot-to-rally interaction (Figure 2-1 to 2), which allows coaches to look into a specific rally (and the cause for errors/winners) more efficiently.
Round 3. Immersive 3D visualization. We conducted the third test two months later with C3 on the usefulness of immersive visualizations. The coach was able to preview each group of filtered shots (e.g., winners) efficiently and interpreted the shot types from the 3D shot arcs to answer his coaching questions, like “What are the shots Tai used to win?”- 1 cross drop [shot], 2 smash [shots], 1 block [shot]. He also valued the color usage in the visualizations to tell the shot percentage on the heat map and highlight winner and error shots. However, since 3D player poses were not implemented at the moment, we found that coaches still watched the video view to analyze the rally, as player movement is critical in finding the root cause, e.g., “You hit the shot and it was a winning rally, why? Because the opponent wasn’t there yet” (C2). Both C2 and C3 mentioned the inclusion of player poses to enhance the usefulness and engagement of the 3D game view. Therefore, we worked on player pose estimation after the third user testing.
During the user testing, we also elicited coaches’ feedback on the VR environment. They agreed that VR provides additional benefits in analyzing a match video, such as immediate access to all relevant information, flexible viewpoints, and an interactive approach. C1 commented “it was very helpful to see the video and the bird going with the trajectory at the same time.” C2 moved to the bottom left of the court while watching the 3D game view because “this is where I sit as a coach”. C3 shared that the interaction to select a shot and link to the actual match video is very helpful as “it’s important to know how the player put the pressure and create a situation [in the game]”.
4.6 Implementation
The VIRD backend is implemented in Pytorch and leverages CV models [31, 27] to extract data from badminton videos. The processed match data is subsequently rendered in real-time within the front-end’s 3D scene. The font-end of VIRD is built with Unity3D [52], including the user interface and the 3D scene. To be compatible with the Meta Quest 2 platform, we have implemented VR interactions using the XR Interaction Toolkit [57], ensuring a natural, intuitive user experience. The VIRD interface can be accessed at our public website: https://github.com/ticahere/VIRD-demo.
5 Evaluation
5.1 Case Study Design
We conducted in-person case studies [25] with domain experts to evaluate VIRD on match analysis in four aspects: 1) data analysis method, 2) derived insights, 3) useful components, and 4) overall user experience.
Participants & Data. We invited two high-performance coaches from the user testing phase (C1 & C2; M=2; Age: 40-60) along with a US national team player (P1; M; Age: 20-25) who had been mentored by C1 for a decade. None of them had prior experience using VR outside of our study. We selected three professional matches, including two public matches (M1, M2) and one personal match provided by P1 (M3).
We processed the match data as described in Sec. 4.2.
Experiment Set-up. The user study took place in a 300 sq ft meeting room, where participants used VIRD with a Meta Quest 2 headset. VIRD was run on a PC equipped with an i7-11800H 2.30GHz processor and an NVIDIA GeForce RTX 3060 graphics card. The Meta Quest 2 VR headset has a resolution of 1,920 x 1,832 per eye and a 90 Hz refresh rate, connected to the PC via a 5m USB3 Type-C cable. The VIRD view was also projected onto a 65” 4K TV screen connected to the PC, allowing the instructor to observe the VR view.
Study Design. To evaluate how VIRD supports match analysis, each coach analyzed one public match for developing game strategy. C1 and C2 analyzed M1 and M2, respectively. In addition, to evaluate how VIRD helps derive and communicate insights for coaching, both C1 and P1 analyze M3 in the same session. During the study, C1 analyzed M3 using VIRD and provided coaching advice directly to P1, who watched C1’s interaction on a TV screen.
Procedures. We first introduced the study to the expert and obtained their consent to participate and be recorded. They agreed to disclose their identity in the paper. The experts first watched the match video on the desktop for 10 minutes to familiarize themselves with the players in the match, as they had not coached them before. Next, we introduced key features of VIRD with a list of example tasks, such as “select all winners by Momota in G1”, and asked the expert to explore the features freely. This training step took around 10 minutes. The expert then analyzed the assigned match for 10 minutes in think-aloud fashion. After match analysis with VIRD, they were asked to conclude their coaching advice. In addition, C1 performed another match analysis of M3 and shared his advice with P1 in the study for 10 minutes. Finally, we gathered feedback from the expert about their experience with VIRD in a post-study survey and a follow-up interview. Each study took 60 to 75 minutes and we compensated each participant with a $50 gift card.
Measure & Data Analysis. We recorded the user interaction, voices, and VR screen records for analysis. In the post-study survey, we collected subjective ratings on a five-point Likert Scale, including learnability, usability, usefulness of each feature, and overall satisfaction of VIRD. In the follow-up interview, experts commented on the most useful features, pros and cons, and suggestions for using VIRD in actual coaching. To evaluate the experts’ analysis and the insights they obtained, we performed text analysis on audio transcripts. We labeled user comments based on knowledge type, including prior knowledge, analysis, or insight. We also mapped user comments to VR screen records to extract the visualizations used in the analysis.
5.2 Case Study Results
We present the results of two case studies. Case 1 examines a coach developing game strategies using VIRD. Case 2 explores a pair of coach and player communicating insights for coaching. For both cases, we describe coaches’ findings using the match player’s last name.
5.2.1 Case 1: Developing Game Strategy in a Match
We demonstrate C2’s analysis workflow on M2 with both desktop and VIRD, highlighting his analysis approach, insights, and interactions.
Desktop. During the 10-minute warm-up phase, the coach went through M2’s first half (11 points) of game 1. Using his usual video analysis approach, the coach went through the YouTube video sequentially, pausing or fast-forwarding to the rally, and manually recorded statistics (the number of winners, errors, and short rallies) on a spreadsheet after each rally (Figure 3a). Using the collected stats and observations in the video, he discovered that Marin had won 8 out of 11 points very quickly, with 4 winners versus 5 unforced errors. Further, he observed that Marin was playing very flat and trying to push the tempo, leading to Yamaguchi only playing from a small area on the court.
These observations led to two coaching insights. The coach stressed that these were initial observations that he would usually first validate in more detail. First, Marin is playing very fast and not moving the opponent. “[Yamaguchi]’s getting more comfortable with what Marin is doing.” The advice is that Marin needs to utilize the backcourt and open the court more. To explain this insight, the coach pointed to the mid-court areas on a court diagram. Second, Marin is pressing the match and only playing flat shots. “These are world-class players. You can’t just do the same thing the whole time.” The coach thinks she needs to change techniques, such as varying the speed and angle of the shot. Lastly, the coach commented that 5 unforced errors were a little too high for the first half of the game. Yamaguchi is not moving much, leading Marin to waste her energy, “Marin’s going to make more mistakes in the long-term if she doesn’t change the strategy.”
VIRD. During the 10-minute match analysis with VIRD, the coach used the filters to focus on each player’s winners and errors separately. He also drilled down to specific rallies or the shot video to verify observations, and focused on spatial aspects such as shot location, distribution, and shot trajectory in the analysis. To continue his analysis of M2 from the warm-up, he selected the first half of game 1 and explored the shot distribution by players and shot outcomes. He found that Marin’s winners came mostly from the back and she attacked the bottom right corner (Figure 3b left), while most of Yamaguchi’s winning shots were from the front (Figure 3b right). He also found that Marin’s errors were pretty evenly distributed while Yamaguchi had more errors in the front. After an overview, the coach continued his analysis based on different hypotheses, such as wanting to see how Marin did on her winners because that’s an important part of her game. He went through each of the winner rallies in detail and examined the shot locations on the court. He commented “Look at all the dots on the Yamaguchi’s court, none of them pass this white line back here”, pointing at the court with the VR controller (Figure 3c). He further focused on short rallies (less than 10 shots) using the Rally Menu, and observed that Marin’s backhand serve was really flat, giving Yamaguchi scoring opportunities.
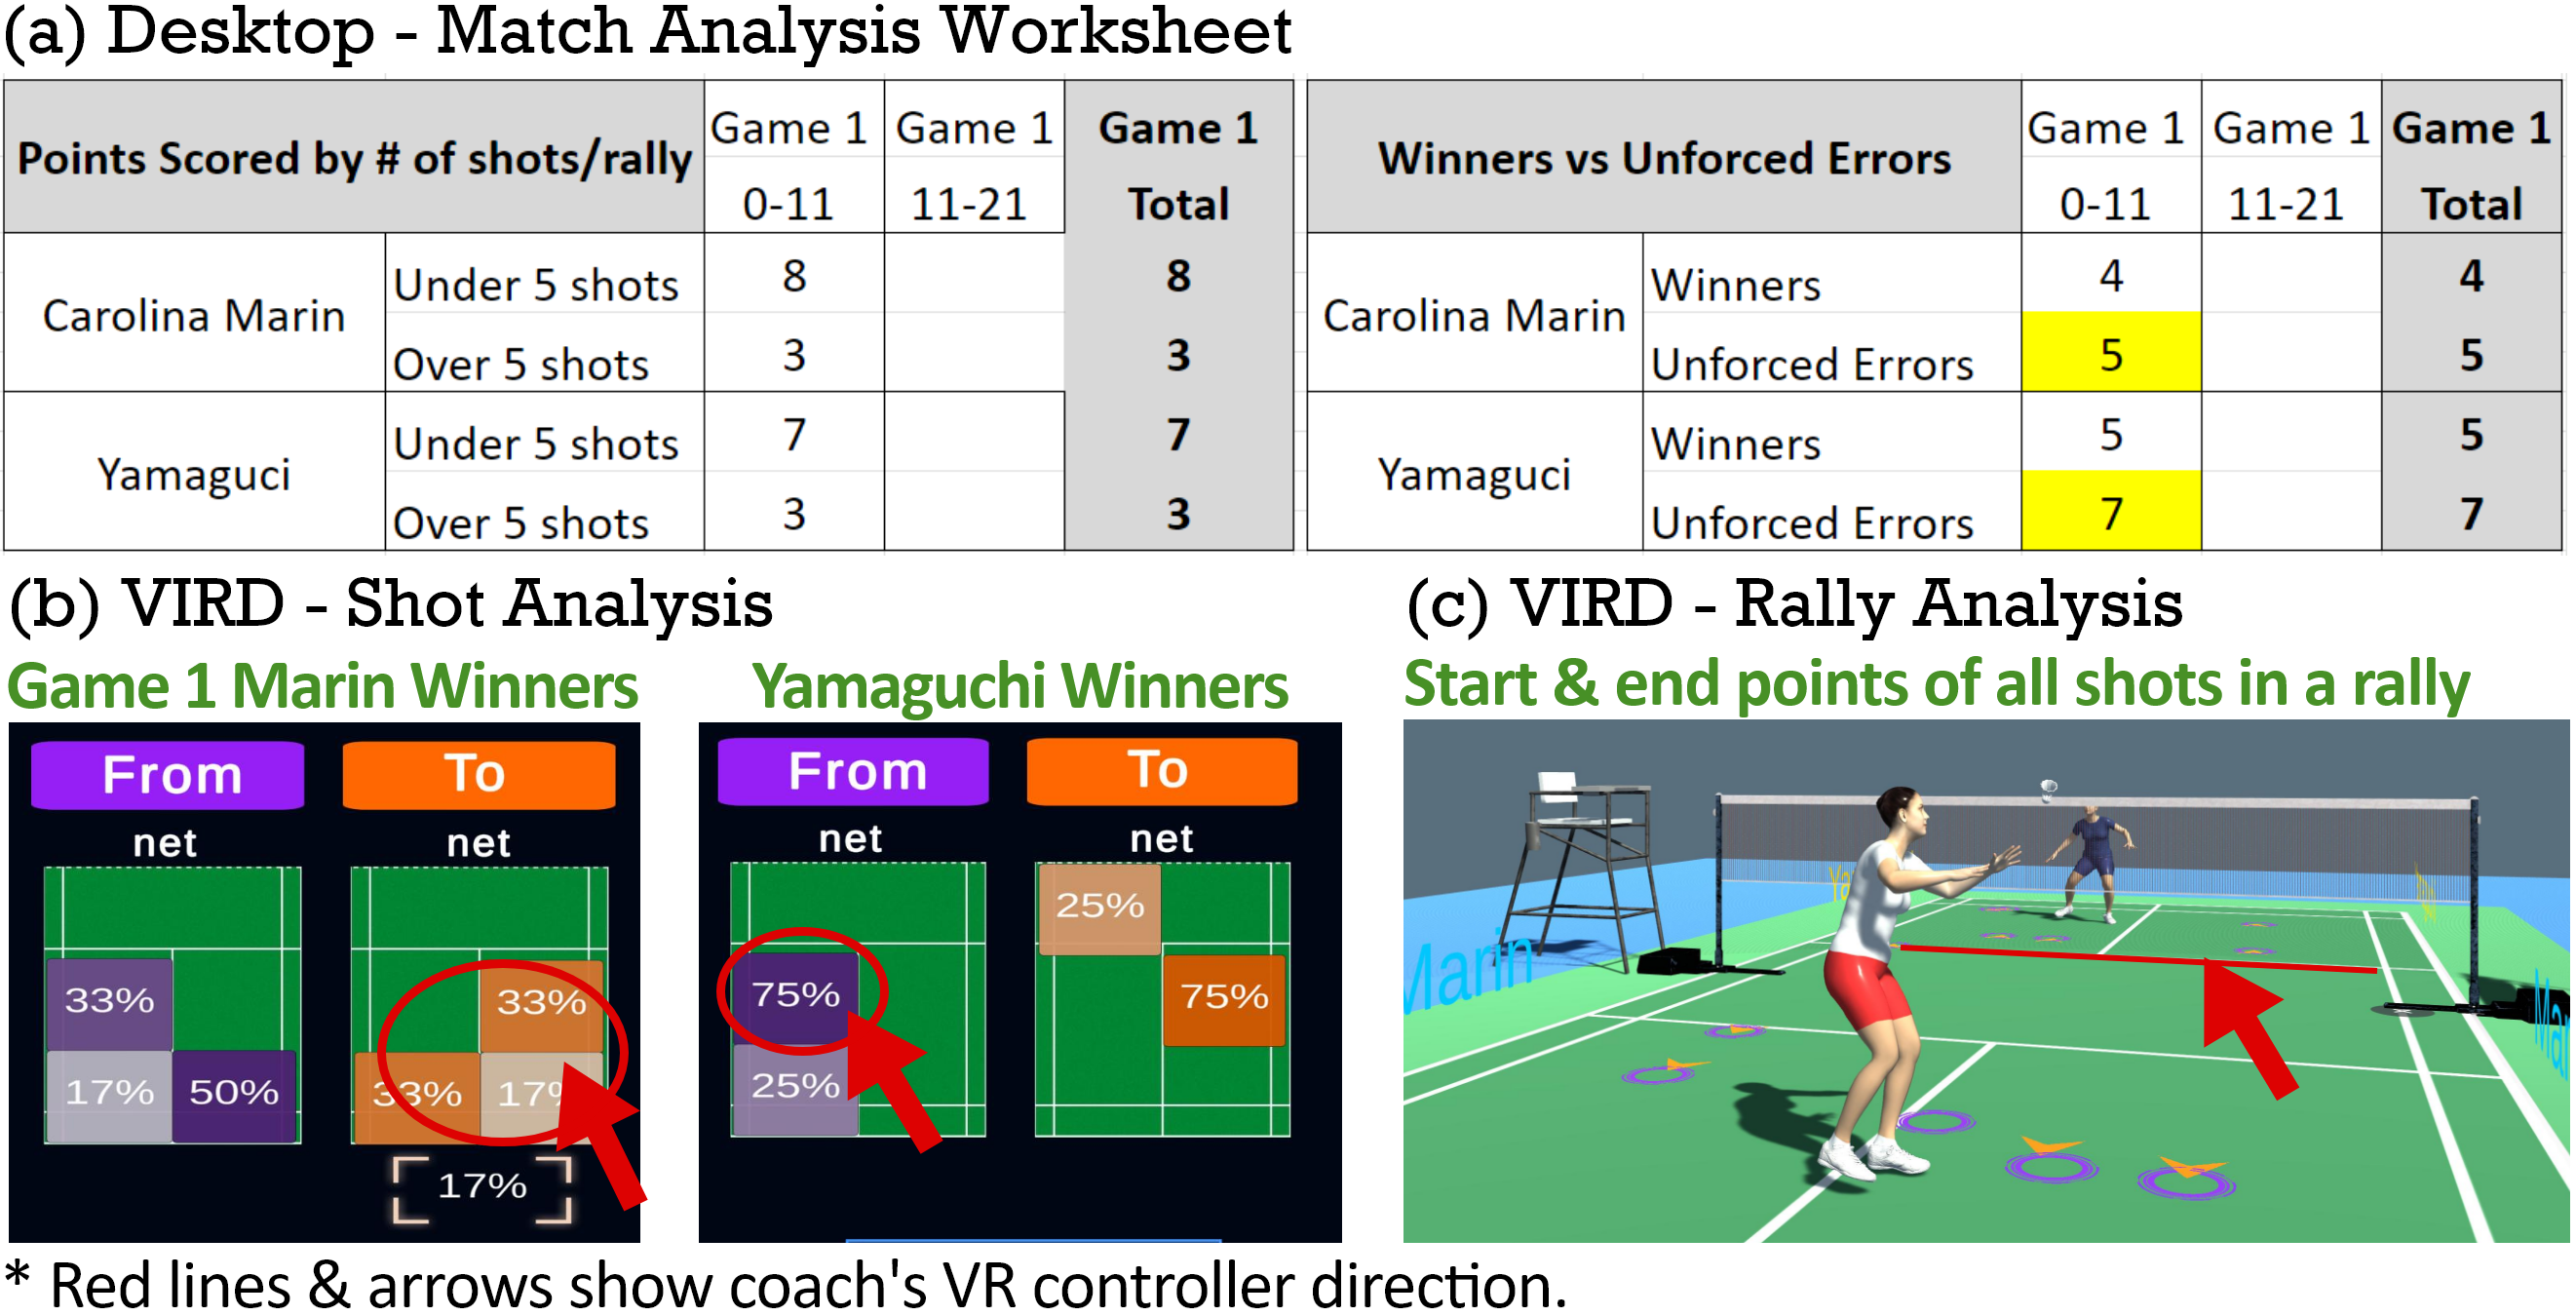
The coach was able to verify his previous insights obtained on the desktop with concrete evidence while pointing out additional details. First, he referred to the shot locations on the court (Figure 3c) to demonstrate that Marin is barely moving the opponent. Further, based on the heatmap showing Yamaguchi has most of her winning shots from the front (Figure 3b right), he suggested “Marin should try to avoid this corner because Yamaguchi is creating scoring opportunities from this corner.” Second, he replayed a short rally and pointed out the flat shot, “Marin’s backhand serve was really flat. [Yamaguchi] didn’t have to move at all. She scored right away”. Based on examining the short rallies, the coach suggested that Marin should “either make the serve higher … or don’t use that type of serve because it’s not working.” To explain these findings, the coach used actual video clips and spatial data and compared patterns between players and rallies. Throughout the analysis, the coach also used the first-person view to describe findings, such as “I want to avoid this corner and play the other ones.”
Case 1 Summary. C2 analyzed the first half of game 1 in match M2 with Desktop and VIRD. The coach effectively verified two initial observations from Desktop using VIRD and explained his insights with spatial data visualizations and specific rallies. He also seamlessly iterated between summary data and detailed game views to support his analytic reasoning.
5.2.2 Case 2: Verifying and Communicating Coaching Insights
We describe how C1 verified and shared coaching advice with P1 using VIRD and how P1, as a player, obtained analysis insights.
Coach. Prior to our study, C1 had already spent 2 hours analyzing M3 and shared his insights with P1 virtually. He had asked P1 questions about his strategy and his opinion about the match. Based on the discussion, the coach followed up with match insights and statistical trends to explain his advice. In this case study, the coach used VIRD to explore the match data in more depth, to communicate directly with P1, and to verify previous insights and update some original hypotheses.
The match between Castillo and Ma was won by Ma (P1) with 21-11 (G1), 19-21 (G2), and 13-21 (G3). The coach first read the score of the match from the Match Summary, and selected G2 with a score of 19-21 won by Ma because it was a close game. He focused on 18 errors made by Ma and examined each rally. Utilizing the virtual red shot arc to immediately pinpoint where the errors were coming from in each rally, he quickly browsed three rallies of errors and identified that Ma made all mistakes on defensive shots. This confirmed one of his previous analysis insights, where he pointed out P1’s recovery shots gave the opponent too many opportunities, and suggested P1 working on his defense, “this shows we’re working on the right thing because he’s making mistakes here”. To demonstrate this insight, he continued to select another rally and used the VR pointer to point at the red shot arc, “you can see the mistake from this mid court when his opponent attacks.” Based on this analysis, he asked follow-up questions to drill down to the root cause with the player, such as footwork issues.
The coach analyzed the 14 winners by Ma and found that 43% of the winners were hit to the front left area on the heatmap. He filtered the shot location to focus on the 6 winners hit to the front left. He was surprised, since P1 is not confident in their net play. He pointed to the heatmap to show P1 that “your front is better than what you expected. You scored from the front the most”. He ended the analysis with a comment that he would go through each rally with the player in more depth, e.g., “Did you score because you’re always in the front, or was it your skill?”
Player. The case study with P1 focused on how VIRD helps players analyze their own match in an immersive environment.
After being introduced to the features of VIRD, the player analyzed M3 for 10 minutes. He first looked at winners and focused on comparing his shot locations and trajectories across each game. He found that his winners came majority from the back left, “the first game was 60% from the back left”. Further, he found almost all of his winners were going down or flat across three games by examining the shot arcs on the virtual court. He then confirmed his observations with the rally video. By comparing data across games, he found that he had more winners in the front but not in the back in G2, but upon further investigation of a rally in G2, “for that rally it seemed like I did win it in the front but a lot of it was set up in the back actually”. Looking at the winner shot analysis, he was surprised that the majority of winners came from his backhand side, “I thought for me it was a lot easier in general to attack from the forehand side”. He also contemplated that he might need to find more ways to keep the shot down as it seemed beneficial if he did not hit it up as often.
The player continued to analyze his errors in each game and compared the shot heat map. Seeing too many errors shown in a game, he chose to split each game into half. He found that most of his errors came from the back across all games. He moved in the virtual court to match his position on the court from the first-person view and pointed at the shot arcs and heat map on the virtual court to communicate his observations. He found his errors were mostly on the backhand side in the second half of G2 , while the majority were on the forehand side. He contemplated that “maybe he started changing strategy…” as G2 had a tight score (19-21) where the opponent was close to winning the match. Upon analyzing the shots on the virtual court and previewing them in the video view, he also found that all of the errors were very high arcing, “the arc tells me I’m losing because of defensive shots. It’s either because I’m hitting into the back or my shots in the front are too high”. The player commented he would use this tool to go through every rally, and considered VIRD very helpful to get a sense of his overall performance and identify areas to discuss with the coach.
Case 2 Summary. In Case 2, C1 analyzed M3 and shared coaching insights with P1, while P1 also analyzed his own performance. The coach used VIRD to verify one previous insight (P1 needs to improve defensive shots) and discovered a new insight (P1 has better net shots than he thought), and used a combination of spatial visualizations and rally videos to explain his insights to the player. The player focused on finding patterns in his performance with spatial visualizations and drew conclusions with two new findings about his shots, including most winners coming from his backhand side and downwards, and most errors coming from the back across all games.
5.2.3 Post-study Survey & Interview
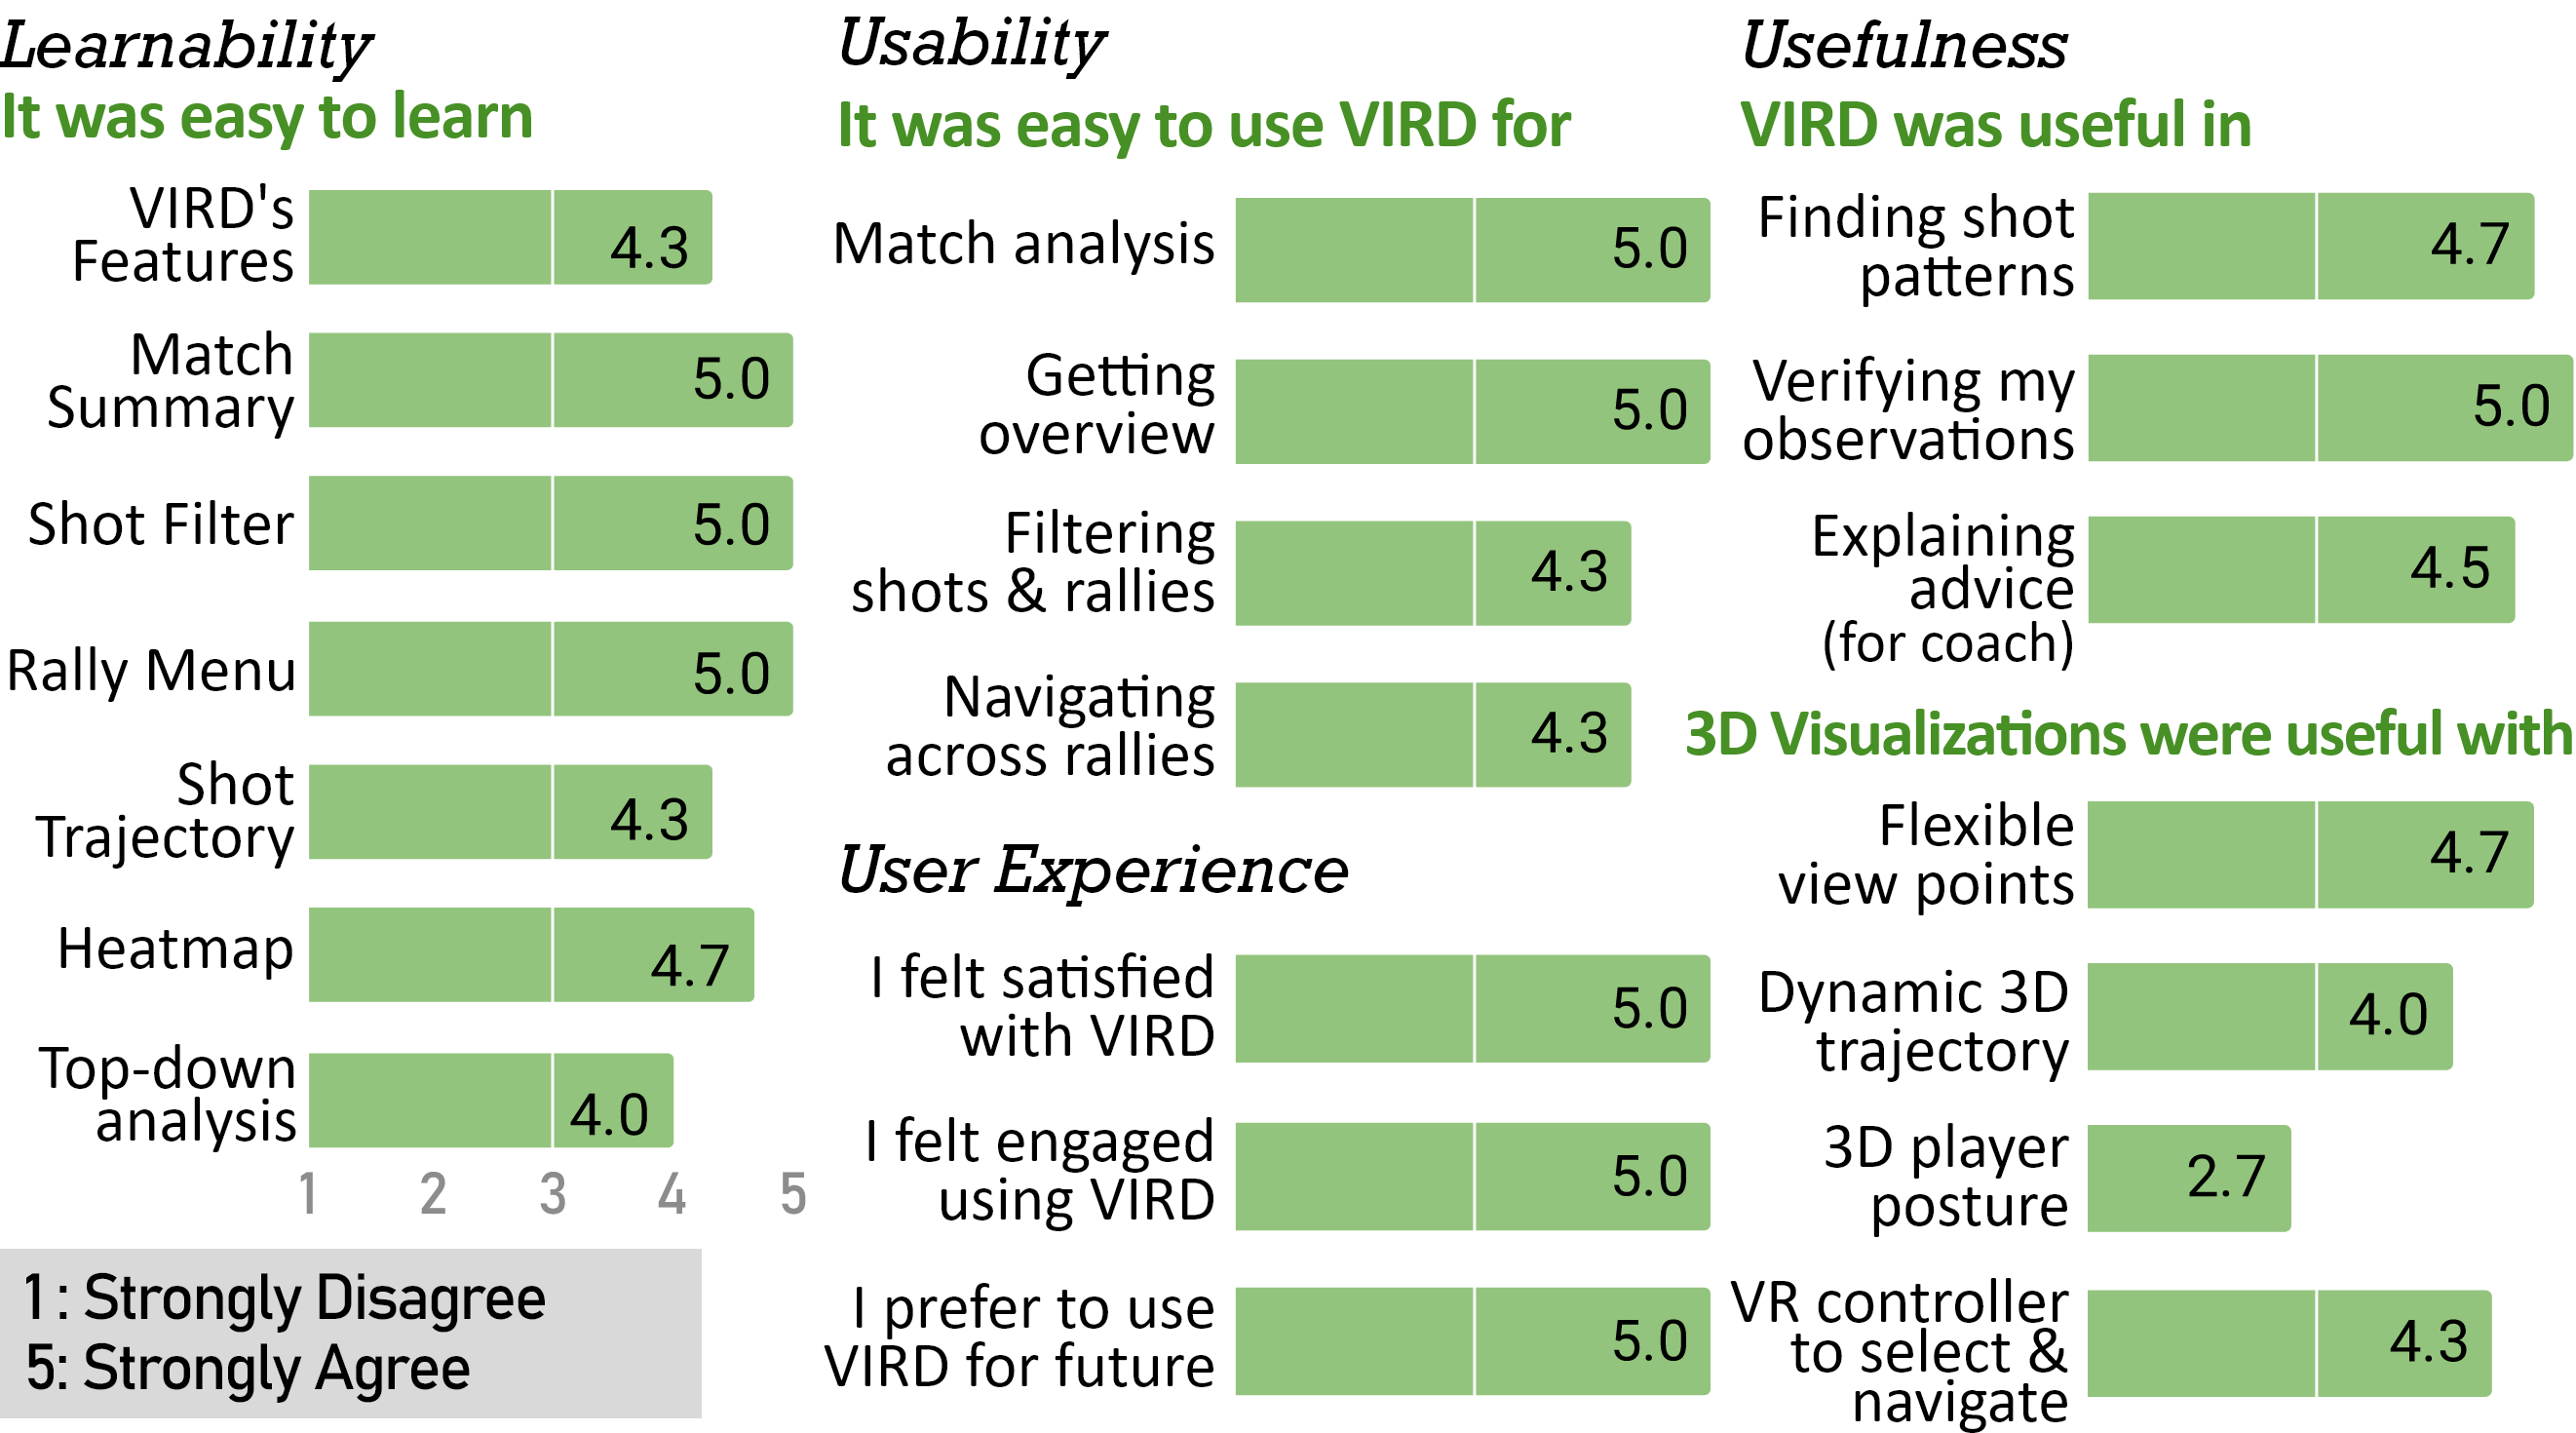
Figure 4 shows the average subjective ratings collected in the post-study survey, ranging from 1 (strongly disagree) to 5 (strongly agree). Overall, experts rated VIRD with high learnability, usability and usefulness ( 4.0 except 3D player posture).
Learnability. Experts found it easy to learn the features in VIRD. Particularly, the data provided in each visual element (Match Summary, Shot Filter, Rally Menu) were clearly understandable. The overall top-down analysis method, and spatial data visualizations in shot trajectories and heat maps were also properly learned during training.
Usability. Experts rated the ease of use of VIRD for analyzing matches highly in each of the analysis tasks, including getting overviews, filtering shots and rallies, and navigating across rallies. The main issues arose in operating the VR controllers, such as clicking on the trigger button. Some suggestions included adding an onboarding tutorial to train users on accurately interacting with each component.
Usefulness. Experts found VIRD helpful for match analysis from finding shot patterns, verifying insights, and explaining coaching advice. The coaches found the static data panels (Match Summary & Shot Filter) most helpful as they provide the foundation of analysis to link to videos and spatial data visualizations, and visually showcase data and videos to the player. Further, experts found it helpful to have a 3D virtual court with flexible view points, use a VR controller to select and navigate, and view dynamic 3D shot trajectories. The interactive approach was highlighted by both the coach and player as a benefit of VIRD, which supports an iterative analysis loop as well as linking static data to dynamic video and shots. The player found 3D visualizations (heatmap and trajectory) very useful in finding shot patterns and generating insights on his performance, especially being able to compare the video with 3D game from different angles. However, 3D player posture was considered less helpful (=2.7) as coaches found the players off balance occasionally due to technical limitations. Experts mentioned they found the player positions in 3D game views helpful, and did not pay much attention to the actual posture. We observed that coaches were mostly interested in player movement and whether they were in good positions when hitting the shot. According to experts, observing slightly off-balanced player postures did not significantly impede their ability to comprehend the 3D gameplay. In cases where it was necessary, they would refer to video views for comparison.
User Experience. Experts felt satisfied, engaged, and prefer to use VIRD for analyzing match videos (all =5.0). The major advantages for coaches were getting instant access to data, using an interactive approach, and access to 3D visualizations, which could lead to a huge reduction on the time to perform match analysis (less than 30 minutes vs. 3-5 hours). For the player, the pros are having spatial data to help dive into one’s own strengths and weaknesses. On the downside, coaches found the shot and pose detection occasionally inaccurate. Although they could refer to the actual video to verify, it hindered the experience of viewing the entire game in 3D. The player felt that the VR environment made him feel like he was in a game and he would get distracted. As a player, he considered using this system for game watching instead of analyzing, since “If I’m training a lot and really tired, then going into this [VR], of course I want to have fun”.
6 Discussion
6.1 Top-down Analysis Approach for Sports Videos
We proposed a top-down data analysis approach in our study to enhance badminton coaches’ video analysis workflow. The approach involved providing an overview of the match and then using filters and visualizations to narrow down the area of interest and identify specific game moments. All experts agreed that this approach was effective in supporting coaches to generate and verify insights in the case study.
While the top-down analysis workflow is a well-established visual analytics approach [47], it is rarely used by sports domain experts for analyzing sports videos. Instead, sports professionals, such as scouts and coaches, typically watch individual game videos to evaluate a player’s performance due to the inaccessibility of high-quality data from videos, and limited resources that lead to experts relying on their own interpretation and annotation of videos. However, this approach can result in a gap between data and context, leading to less comprehensive and communicable insights, as found in Sec. 2.2.3.
To tackle this problem, we combined two promising avenues for sports analytics: CV-based data collection and human-in-the-loop analysis. Our study found that experts leveraged immediate access to both summary data and video to perform top-down analysis, and integrate multiple data sources to develop and communicate their insights, such as domain knowledge, static and dynamic data. Even when automation fails, experts can use the actual video to verify the data. As computer vision techniques continue to improve, we envision automatic data collection to benefit more sports domains, while human-centered design empowers experts with an effective top-down analysis approach without losing contextual understanding of the data.
6.2 Immersive Video Analysis for Sports Coaching
Based on our case studies, we found that an end-to-end immersive analytic pipeline like VIRD can be suitable for sports coaching in badminton. Both coaches and the player in the studies were able to achieve their match analysis goals throughout the entire analysis pipeline in VR, from data exploration, insight generation to communication (using VIRD to showcase their insights to viewers on a TV screen in our study). Unlike immersive analytics for scientific data analysis, where several analytic steps such as analyzing abstract data are better conducted in traditional desktop environments [4, 20], sports data are intrinsically spatial and dynamic, making analyzing and presenting insights using videos and visualizations in 3D desirable. Furthermore, analyzing sports videos for coaching relies heavily on domain knowledge without the need for complex data manipulation. Thus, we found immersive analytics provide several advantages for sports coaching.
1. Situated visualization reduces context-switching costs and shortens the path from hypotheses to insights. As both coaches commented, the most beneficial feature of VIRD was the immediate access to all the required data, “when I put the headset on I already have information that I may need without even having to watch the video first” (C1). In the standard workflow on the desktop, coaches spend much time navigating and finding the critical game moments (e.g., when an error happens) while tallying rallies of interest on a separate note. This process induces high context-switching costs [55] as the coaches need to constantly re-interpret the changed views between data in the notes and the game moments in the video, leading to a longer analysis cycle. With large screen space and situated visualization placed in context (e.g., shots on the badminton court), coaches are presented with all required data in multiple views with spatial-continuous movement, which was found to reduce context-switching costs [58, 42]. Therefore, experts can leverage their visual working memory [42] and focus exclusively on the match analysis. This was shown in the hypothesis-driven workflow with VIRD, where experts can plan their analysis and immediately verify their insights with data, “I’d like to see where I made a mistake on the court. Almost all of it was on the forehand” (P1).
2. Multi-modal data analysis improves visibility of critical game moments. An essential task in video coaching is identifying critical game moments to reveal root causes, “when we coach a player, we have to pinpoint the exact cause and outcome” (C2). The ability to breakdown a rally stroke by stroke and instantly preview each shot in the video with embodied interaction in VR allows experts to directly access and focus on these critical moments. One coach even suggested “it would be good if there’s a way to play a loop of all the winning shots. Just because I’ll spend a lot of time between going into different strokes.” Beyond individual shots, experts also dive into selected rallies in further detail. By comparing static data and 3D visualization from the game, they can develop a more comprehensive analysis from data summary to key moments. For instance, the coach (C1) went through all error rallies and pointed out the player’s weakness on defensive shots as he pinpointed the location of error shots on the court with the VR pointer.
3. Immersive 3D visualizations deepen game understanding and engagement. Experts expressed excitement that they could move freely in the virtual court and watch the game from different angles. Further, all of them were excited seeing the moving bird and the 3D reconstructed game. Throughout the analysis, experts felt engaged and interactive, “I like how I can move my body around and face the shot. I find that more beneficial than just looking at a TV screen or computer” (C1). Experts also expressed their tendency to view a match in 3D and refer to the video only when the 3D view did not make sense. A coach also suggested adding rackets to improve the 3D view. Using VIRD, experts obtained deeper insights on the spatial aspects in their analysis. P1 observed most of his winners were hit downwards from his backhand side from analyzing the shot locations and trajectories. One interesting finding was the sense of presence in VIRD. A coach used the first-person view to describe his analysis for a player in the match, saying “these are my errors”, while the other coach moved to the coaching position by the court and the player moved to his side of the court to view the game from a first-person viewpoint.
6.3 Limitations & Generalizability
Limitations. Our computer vision models are around 90% and 96% accurate in detecting shots and player poses, which causes confusion when inaccuracy occurs. While experts can still perform match analysis by accessing the video view in VIRD, this was mentioned as an area for improvement by all experts. As CV techniques advance, we envision the limitation on automatic data collection can be largely improved with better-trained models, making our approach more reliable.
Due to the limited access to high-performance badminton experts, such as Olympian coaches and players, our study reports the feedback from a few domain experts. We believe the identified problem is significant and common among badminton athletes, but our solution might not generalize to all experts due to varying analysis approaches and resources among coaches and players. Instead, we consider our main contribution to be a design study exploring the use of immersive analytics in real-world sports coaching.
Generalizability. We believe our established data preprocessing pipeline (based on MonoTrack [31] and CLIFF [27]) and the immersive and interactive way to analyze multi-modal game data in badminton can be applied to general match videos and benefit the broader community beyond professional coaches, such as players at all levels, and other racket sports. With the VR benefits in visualizing spatial data and revisiting critical game moments, we also envision expanding VIRD beyond match analysis for leisure game viewing or broadcasting, as noted by the player that watching the game in 3D was fun.
7 Conclusions and Future Work
In this study, we introduced VIRD, an immersive badminton match video analysis tool for high-performance coaching based on a formative study with Olympic coaches and players. VIRD employs a top-down analytic approach in VR with 3D reconstructed game views and multi-modal data analysis. Experts successfully developed game strategies and effectively communicated insights using VIRD in case studies, showcasing the advantages of immersive analytics in badminton coaching. These benefits include reduced context-switching costs, enhanced visibility of critical game moments, and a deeper understanding of and engagement with the game through situated 3D visualizations.
Promising future work includes enabling remote collaboration between coaches and players in a shared immersive VR space, addressing the limited coaching time and insufficient support for video discussions. Additionally, VR could be employed to simulate game scenarios for enhanced athlete training. Incorporating natural language input methods, such as GPT, may also help minimize context-switching costs during match analysis, enabling more efficient analytical iteration.
Supplemental Materials
Our supplemental materials, including post-study survey questions for the case study, are available on OSF at https://osf.io/92px8. The front-end code for VIRD’s VR interface described in Sec.4 has been open-sourced and can be found at https://github.com/ticahere/VIRD-demo. Our other code and video data are the intellectual property of Adobe Research and Badminton World Federation.
Acknowledgements.
This work is supported by Adobe Research, NSF grants III-2107328 and IIS-1901030. We are grateful for the invaluable support of Andy Chong, Daphne Chang, Kai-Hsin Chang, Justin Ma, Hsiao-Ma Pai, Pashupati Paneru, Raju Rai, Rena Wang, Paul Liu, and Toby Ng. Their dedication to advancing badminton has significantly inspired and contributed to this project. We thank the reviewers for their valuable comments.References
- [1] 2020 BWF World Tour Finals, Women Single, Tai Tzu Ying (TPE) vs. Carolina Marin (ESP). https://www.youtube.com/watch?v=HVR7KSJM1XM, 2023.
- [2] 2021 Denmark Open - Final, Men Single, Kento Momota (JPN) vs Viktor Axelsen (DEN). https://www.youtube.com/watch?v=W_Oi9TemBW0, 2023.
- [3] 2022 BWF World Championship Quarter Final, Women Single, Akane Yamaguchi (JPN) vs. Carolina Marin (ESP). https://www.youtube.com/watch?v=6gUzcaGy8PI, 2023.
- [4] B. Bach, M. Cordeil, U. Engelke, B. Ens, M. Serrano, and W. Willett. Interaction design & prototyping for immersive analytics. In Extended Abstracts of the 2019 CHI Conference on Human Factors in Computing Systems, pp. 1–8, 2019.
- [5] H. Benko, E. Ishak, and S. Feiner. Collaborative mixed reality visualization of an archaeological excavation. In Third IEEE and ACM International Symposium on Mixed and Augmented Reality, pp. 132–140, 2004. doi: 10 . 1109/ISMAR . 2004 . 23
- [6] S. Butscher, S. Hubenschmid, J. Müller, J. Fuchs, and H. Reiterer. Clusters, trends, and outliers: How immersive technologies can facilitate the collaborative analysis of multidimensional data. In Proceedings of the 2018 CHI Conference on Human Factors in Computing Systems, CHI ’18, p. 1–12. Association for Computing Machinery, New York, NY, USA, 2018. doi: 10 . 1145/3173574 . 3173664
- [7] H.-T. Chen, C.-L. Chou, W.-J. Tsai, and S.-Y. Lee. 3d ball trajectory reconstruction from single-camera sports video for free viewpoint virtual replay. In 2011 Visual Communications and Image Processing (VCIP), pp. 1–4, 2011. doi: 10 . 1109/VCIP . 2011 . 6115930
- [8] H.-T. Chen, M.-C. Tien, Y.-W. Chen, W.-J. Tsai, and S.-Y. Lee. Physics-based ball tracking and 3d trajectory reconstruction with applications to shooting location estimation in basketball video. Journal of Visual Communication and Image Representation, 20(3):204–216, 2009. doi: 10 . 1016/j . jvcir . 2008 . 11 . 008
- [9] Z. Chen, Q. Yang, J. Shan, T. Lin, J. Beyer, H. Xia, and H. Pfister. iball: Augmenting basketball videos with gaze-moderated embedded visualizations. In Proceedings of the 2023 CHI Conference on Human Factors in Computing Systems, pp. 1–18, 2023. doi: 10 . 1145/3544548 . 3581266
- [10] X. Chu, X. Xie, S. Ye, H. Lu, H. Xiao, Z. Yuan, Z. Chen, H. Zhang, and Y. Wu. Tivee: Visual exploration and explanation of badminton tactics in immersive visualizations. IEEE Transactions on Visualization and Computer Graphics, 28(1):118–128, 2021. doi: 10 . 1109/TVCG . 2021 . 3114861
- [11] Clutch. Ai-powered performance analysis for badminton. https://www.clutchapp.io/.
- [12] C. Dietrich, D. Koop, H. T. Vo, and C. T. Silva. Baseball4d: A tool for baseball game reconstruction & visualization. In 2014 IEEE conference on visual analytics science and technology (VAST), pp. 23–32. IEEE, 2014. doi: 10 . 1109/VAST . 2014 . 7042478
- [13] B. Ens, B. Bach, M. Cordeil, U. Engelke, M. Serrano, W. Willett, A. Prouzeau, C. Anthes, W. Büschel, C. Dunne, et al. Grand challenges in immersive analytics. In Proceedings of the 2021 CHI Conference on Human Factors in Computing Systems, pp. 1–17, 2021. doi: 10 . 1145/3411764 . 3446866
- [14] D. Farin, S. Krabbe, W. Effelsberg, et al. Robust camera calibration for sport videos using court models. In Storage and Retrieval Methods and Applications for Multimedia 2004, vol. 5307, pp. 80–91. SPIE, 2003. doi: 10 . 1117/12 . 526813
- [15] M. Hachet, B. Bossavit, A. Cohé, and J.-B. de La Rivière. Toucheo: multitouch and stereo combined in a seamless workspace. In Proceedings of the 24th annual ACM symposium on User interface software and technology, pp. 587–592, 2011. doi: 10 . 1145/2047196 . 2047273
- [16] M. A. Haq, S. Tarashima, and N. Tagawa. Heatmap Visualization and Badminton Player Detection using Convolutional Neural Network. 2022 International Electronics Symposium (IES), 8 2022. doi: 10 . 1109/ies55876 . 2022 . 9888717
- [17] C. Heaton and P. Mitra. Learning contextual event embeddings to predict player. MIT Sloan Sports Analytics Conference Boston, 2023.
- [18] C. Helbig, H.-S. Bauer, K. Rink, V. Wulfmeyer, M. Frank, and O. Kolditz. Concept and workflow for 3d visualization of atmospheric data in a virtual reality environment for analytical approaches. Environmental earth sciences, 72:3767–3780, 2014. doi: 10 . 1007/s12665-014-3136-6
- [19] Y.-C. Huang, I.-N. Liao, C.-H. Chen, T.-U. İk, and W.-C. Peng. Tracknet: A deep learning network for tracking high-speed and tiny objects in sports applications. In 2019 16th IEEE International Conference on Advanced Video and Signal Based Surveillance (AVSS), pp. 1–8. IEEE, 2019. doi: 10 . 1109/AVSS . 2019 . 8909871
- [20] S. Hubenschmid, J. Wieland, D. I. Fink, A. Batch, J. Zagermann, N. Elmqvist, and H. Reiterer. Relive: bridging in-situ and ex-situ visual analytics for analyzing mixed reality user studies. In Proceedings of the 2022 CHI Conference on Human Factors in Computing Systems, pp. 1–20, 2022. doi: 10 . 1145/3491102 . 3517550
- [21] hudl. Tools to help every team, coach and athlete improve. https://www.hudl.com/.
- [22] M. Kopania, J. Nowisz, and A. Przelaskowski. Automatic Shuttlecock Fall Detection System in or out of a Court in Badminton Games—Challenges, Problems, and Solutions from a Practical Point of View. Sensors, 22(21):8098, 10 2022. doi: 10 . 3390/s22218098
- [23] M. Kraus, J. Fuchs, B. Sommer, K. Klein, U. Engelke, D. Keim, and F. Schreiber. Immersive analytics with abstract 3d visualizations: A survey. In Computer Graphics Forum, vol. 41, pp. 201–229. Wiley Online Library, 2022. doi: 10 . 1111/cgf . 14430
- [24] M. Kraus, N. Weiler, D. Oelke, J. Kehrer, D. A. Keim, and J. Fuchs. The impact of immersion on cluster identification tasks. IEEE Transactions on Visualization and Computer Graphics, 26(1):525–535, 2019. doi: 10 . 1109/TVCG . 2019 . 2934395
- [25] H. Lam, E. Bertini, P. Isenberg, C. Plaisant, and S. Carpendale. Empirical Studies in Information Visualization: Seven Scenarios. IEEE Transactions on Visualization and Computer Graphics, 18(9):1520–1536, Sept. 2012. doi: 10 . 1109/TVCG . 2011 . 279
- [26] B. Lee, D. Brown, B. Lee, C. Hurter, S. Drucker, and T. Dwyer. Data visceralization: Enabling deeper understanding of data using virtual reality. IEEE Transactions on Visualization and Computer Graphics, 27(2):1095–1105, 2020. doi: 10 . 1109/TVCG . 2020 . 3030435
- [27] Z. Li, J. Liu, Z. Zhang, S. Xu, and Y. Yan. Cliff: Carrying location information in full frames into human pose and shape estimation. In Computer Vision–ECCV 2022: 17th European Conference, Tel Aviv, Israel, October 23–27, 2022, Proceedings, Part V, pp. 590–606. Springer, 2022. doi: 10 . 1007/978-3-031-20065-6_34
- [28] T. Lin, Z. Chen, Y. Yang, D. Chiappalupi, J. Beyer, and H. Pfister. The quest for omnioculars: Embedded visualization for augmenting basketball game viewing experiences. IEEE transactions on visualization and computer graphics, 29(1):962–971, 2022. doi: 10 . 1109/TVCG . 2022 . 3209353
- [29] T. Lin, R. Singh, Y. Yang, C. Nobre, J. Beyer, M. Smith, and H. Pfister. Towards an understanding of situated ar visualization for basketball free-throw training. In Proceedings of the 2021 CHI Conference on Human Factors in Computing Systems, CHI ’21, p. 1–12. Association for Computing Machinery, New York, NY, USA. doi: 10 . 1145/3411764 . 3445649
- [30] T. Lin, Y. Yang, J. Beyer, and H. Pfister. SportsXR – Immersive Analytics in Sports. In 4th Workshop on Immersive Analytics: Envisioning Future Productivity for Immersive Analytics at ACM CHI, 2020. doi: 10 . 48550/arXiv . 2004 . 08010
- [31] P. P. Liu and J.-H. Wang. MonoTrack: Shuttle trajectory reconstruction from monocular badminton video. 2022 IEEE/CVF Conference on Computer Vision and Pattern Recognition Workshops (CVPRW), 4 2022. doi: 10 . 1109/cvprw56347 . 2022 . 00395
- [32] M. Loper, N. Mahmood, J. Romero, G. Pons-Moll, and M. J. Black. SMPL: A skinned multi-person linear model. ACM Trans. Graphics (Proc. SIGGRAPH Asia), 34(6):248:1–248:16, Oct. 2015. doi: 10 . 1145/2816795 . 2818013
- [33] D. López, L. Oehlberg, C. Doger, and T. Isenberg. Towards an understanding of mobile touch navigation in a stereoscopic viewing environment for 3d data exploration. IEEE Transactions on Visualization and Computer Graphics, 22(5):1616–1629, 2015. doi: 10 . 1109/TVCG . 2015 . 2440233
- [34] Y. Lyu and S. Zhang. Badminton Path Tracking Algorithm Based on Computer Vision and Ball Speed Analysis. Journal of Sensors, 2021:1–13, 12 2021. doi: 10 . 1155/2021/3803387
- [35] P. Millais, S. L. Jones, and R. Kelly. Exploring data in virtual reality: Comparisons with 2d data visualizations. In Extended abstracts of the 2018 CHI conference on human factors in computing systems, pp. 1–6, 2018. doi: 10 . 1145/3170427 . 3188537
- [36] N. Monet and D. Wee. MEEV: Body Mesh Estimation On Egocentric Video. arXiv (Cornell University), 10 2022. doi: 10 . 48550/arxiv . 2210 . 14165
- [37] A. Moran, V. Gadepally, M. Hubbell, and J. Kepner. Improving big data visual analytics with interactive virtual reality. In 2015 IEEE high performance extreme computing conference (HPEC), pp. 1–6. IEEE, 2015. doi: 10 . 1109/HPEC . 2015 . 7322473
- [38] N. Owens, C. Harris, and C. Stennett. Hawk-eye tennis system. In 2003 international conference on visual information engineering VIE 2003, pp. 182–185. IET, 2003. doi: 10 . 1049/cp:20030517
- [39] A. Patton, M. Scott, N. Walker, A. Ottenwess, P. Power, A. Cherukumudi, and P. Lucey. Predicting nba talent from enormous amounts of college basketball tracking data. MIT Sloan Sports Analytics Conference Boston, 2021.
- [40] G. Pingali, Y. Jean, A. Opalach, and I. Carlbom. Lucentvision: Converting real world events into multimedia experiences. In 2000 IEEE International Conference on Multimedia and Expo. ICME2000. Proceedings. Latest Advances in the Fast Changing World of Multimedia (Cat. No. 00TH8532), vol. 3, pp. 1433–1436. IEEE, 2000. doi: 10 . 1109/ICME . 2000 . 871036
- [41] G. Pingali, A. Opalach, Y. Jean, and I. Carlbom. Visualization of sports using motion trajectories: providing insights into performance, style, and strategy. In Proceedings Visualization, 2001. VIS’01., pp. 75–544. IEEE, 2001. doi: 10 . 1109/VISUAL . 2001 . 964496
- [42] M. Plumlee and C. Ware. Zooming, multiple windows, and visual working memory. In Proceedings of the Working Conference on Advanced Visual Interfaces - AVI ’02, p. 59. ACM Press, Trento, Italy, 2002. doi: 10 . 1145/1556262 . 1556270
- [43] N. A. Rahmad, N. A. J. Sufri, N. S. Muzamil, and M. A. As’ari. Badminton player detection using faster region convolutional neural network. Indonesian Journal of Electrical Engineering and Computer Science, 14(3):1330, 5 2019. doi: 10 . 11591/ijeecs . v14 . i3 . pp1330-1335
- [44] M. Ready, T. Dwyer, and J. H. Haga. Immersive visualisation of big data for river disaster management. In Workshop on Immersive Analytics: Exploring Future Visualization and Interaction Technologies for Data Analytics, Phoenix, AZ, 2018.
- [45] K. Rematas, I. Kemelmacher-Shlizerman, B. Curless, and S. Seitz. Soccer on your tabletop. In Proceedings of the IEEE conference on computer vision and pattern recognition, pp. 4738–4747, 2018. doi: 10 . 1109/CVPR . 2018 . 00498
- [46] Rezzil. https://rezzil.com/, 2020.
- [47] B. Shneiderman. The eyes have it: A task by data type taxonomy for information visualizations. In The craft of information visualization, pp. 364–371. Elsevier, 2003. doi: 10 . 1109/VL . 1996 . 545307
- [48] M. Stein, H. Janetzko, A. Lamprecht, T. Breitkreutz, P. Zimmermann, B. Goldlücke, T. Schreck, G. Andrienko, M. Grossniklaus, and D. A. Keim. Bring it to the pitch: Combining video and movement data to enhance team sport analysis. IEEE transactions on visualization and computer graphics, 24(1):13–22, 2017. doi: 10 . 1109/TVCG . 2017 . 2745181
- [49] M. Sumiya, W. Yamada, and K. Ochiai. Anywhere hoop: Virtual free throw training system. In Adjunct Proceedings of the 35th Annual ACM Symposium on User Interface Software and Technology, pp. 1–3, 2022. doi: 10 . 1145/3526114 . 3558639
- [50] T Chandler, M Cordeil, T Czauderna, T Dwyer, J Glowacki, C Goncu, M Klapperstueck, K Klein, K Marriott, F Schreiber, and E Wilson. Immersive Analytics. 2015 Big Data Visual Analytics (BDVA), pp. 1–8, 2015. doi: 10 . 1109/bdva . 2015 . 7314296
- [51] K. Tuyls, S. Omidshafiei, P. Muller, Z. Wang, J. Connor, D. Hennes, I. Graham, W. Spearman, T. Waskett, D. Steel, et al. Game plan: What ai can do for football, and what football can do for ai. Journal of Artificial Intelligence Research, 71:41–88, 2021. doi: 10 . 1613/jair . 1 . 12505
- [52] Unity Technologies. https://unity.com/, 2022.
- [53] F. Van Ham and A. Perer. “search, show context, expand on demand”: supporting large graph exploration with degree-of-interest. IEEE Transactions on Visualization and Computer Graphics, 15(6):953–960, 2009. doi: 10 . 1109/TVCG . 2009 . 108
- [54] J. Wang, K. Sun, T. Cheng, B. Jiang, C. Deng, Y. Zhao, D. Liu, Y. Mu, M. Tan, X. Wang, et al. Deep high-resolution representation learning for visual recognition. IEEE transactions on pattern analysis and machine intelligence, 43(10):3349–3364, 2020. doi: 10 . 1109/TPAMI . 2020 . 2983686
- [55] M. Q. Wang Baldonado, A. Woodruff, and A. Kuchinsky. Guidelines for using multiple views in information visualization. In Proceedings of the working conference on Advanced visual interfaces, pp. 110–119, 2000. doi: 10 . 1145/345513 . 345271
- [56] Y. Wu, X. Xie, J. Wang, D. Deng, H. Liang, H. Zhang, S. Cheng, and W. Chen. Forvizor: Visualizing spatio-temporal team formations in soccer. IEEE transactions on visualization and computer graphics, 25(1):65–75, 2018. doi: 10 . 1109/TVCG . 2018 . 2865041
- [57] XR Interaction Toolkit. https://docs.unity3d.com/Packages/com.unity.xr.interaction.toolkit@2.3/manual/index.html, 2023.
- [58] Y. Yang, M. Cordeil, J. Beyer, T. Dwyer, K. Marriott, and H. Pfister. Embodied Navigation in Immersive Abstract Data Visualization: Is Overview+Detail or Zooming Better for 3D Scatterplots? IEEE Transactions on Visualization and Computer Graphics, 27(2):1214–1224, Feb. 2021. doi: 10 . 1109/TVCG . 2020 . 3030427
- [59] Y. Yang, T. Dwyer, K. Marriott, B. Jenny, and S. Goodwin. Tilt map: Interactive transitions between choropleth map, prism map and bar chart in immersive environments. IEEE Transactions on Visualization and Computer Graphics, 27(12):4507–4519, 2020. doi: 10 . 1109/TVCG . 2020 . 3004137
- [60] Y. Yang, B. Jenny, T. Dwyer, K. Marriott, H. Chen, and M. Cordeil. Maps and globes in virtual reality. In Computer Graphics Forum, vol. 37, pp. 427–438. Wiley Online Library, 2018. doi: 10 . 1111/cgf . 13431
- [61] S. Ye, Z. Chen, X. Chu, Y. Wang, S. Fu, L. Shen, K. Zhou, and Y. Wu. Shuttlespace: Exploring and analyzing movement trajectory in immersive visualization. IEEE TVCG, 27(2):860–869, 2020. doi: 10 . 1109/TVCG . 2020 . 3030392
- [62] L. Zhu, K. Rematas, B. Curless, S. M. Seitz, and I. Kemelmacher-Shlizerman. Reconstructing nba players. In Computer Vision–ECCV 2020: 16th European Conference, Glasgow, UK, August 23–28, 2020, Proceedings, Part V 16, pp. 177–194. Springer, 2020. doi: 10 . 1007/978-3-030-58558-7_11
- [63] L. Zou, T. Higuchi, H. Noma, L.-G. Roberto, and T. Isaka. Evaluation of a Virtual Reality-based Baseball Batting Training System Using Instantaneous Bat Swing Information. In 2019 IEEE Conference on Virtual Reality and 3D User Interfaces (VR), pp. 1289–1290. IEEE, Osaka, Japan, Mar. 2019. doi: 10 . 1109/VR . 2019 . 8798041
- [64] S. Zou, C. F. Guo, X. Zuo, S. Wang, P. Wang, X. Hu, S. Chen, M. Gong, and L. Cheng. EventHPE: Event-based 3D Human Pose and Shape Estimation. 2021 IEEE/CVF International Conference on Computer Vision (ICCV), 9 2021. doi: 10 . 1109/iccv48922 . 2021 . 01081