Structural and double magnetic transitions in the frustrated spin- capped-kagome antiferromagnet (RbCl)Cu5P2O10
Abstract
The structural and magnetic properties of the geometrically frustrated spin- capped-kagome antiferromagnet (RbCl)Cu5P2O10 are investigated via temperature dependent x-ray diffraction, magnetization, heat capacity, and 31P NMR experiments on a polycrystalline sample. It undergoes a structural transition at around K from a high temperature trigonal () to a low temperature monoclinic () unit cell, where the low temperature structure features the capped-kagome geometry of Cu2+ ions. Interestingly, it shows the onset of two successive magnetic transitions at K and K. The shape of the 31P NMR spectra unfold the possible nature of the transitions below and to be of incommensurate and commensurate antiferromagnetic type, respectively. A large value of the Curie-Weiss temperature as compared to sets the frustration parameter , ensuring strong magnetic frustration in the compound. From the 31P NMR spin-lattice relaxation rate, the leading antiferromagnetic exchange coupling is estimated to be K. These unusual double magnetic transitions make this compound beguiling for further investigations.
I Introduction
Recently, geometrically frustrated magnets have received enormous attention because of their potential to host a rich variety of magnetic and structural phases under different conditions [1, 2]. One of the most engrossing ground states is the quantum spin liquid (QSL), a highly entangled and dynamically disordered state, lacking magnetic long-range-order (LRO) [3]. Among different frustrated magnets, triangular lattice is the simplest example of a geometrically frustrated magnet where the spins are arranged at the vertices of a triangle, defying the antiparallel arrangements, and leading to magnetic frustration. In a triangular lattice, the triangles are edged shared to form a two-dimensional (2D) layer. While in a kagome lattice, the triangles are corner shared in a 2D layer which amplifies the degree of frustration compared to an edge shared triangular lattice. In the perfect low spin () kagome lattice antiferromagnets (KLAFs), quantum fluctuations along with strong magnetic frustration impede the conventional magnetic LRO and gives rise to a strongly correlated QSL or other non-trivial ground states [4]. A celebrated example is herbertsmithite ZnCu3(OH)6Cl2, which is the first realization of a perfect kagome compound with no magnetic LRO down to 50 mK, confirming QSL [5, 6, 7].
Several phase diagrams have been reported theoretically for KLAFs, predicting a large variety of ground states as a function of the ratio of exchange couplings and also applied magnetic field [8, 9, 10]. Experimentally, many compounds have been discovered and investigated which either show a subtle deviation from ideal 2D kagome geometry or are having strong anisotropy, leading to magnetic LRO and/or other exotic phases at finite temperatures [11]. Apart from perfect kagome lattice, many special derivatives of kagome lattice have also been discovered that include square-kagome [12], octa-kagome [13], staircase-kagome [14, 15], sphere-kagome [16], strip-kagome [17, 18], tripod-kagome [19, 20], hyper-kagome [21, 22] etc. Because of the more intricate lattice geometry, these derivatives harbor an array of intriguing magnetic ground states. To name a few, QSL is realized in the square-kagome compound KCu6AlBiO4(SO4)5Cl [12] and hyperkagome compound Na4Ir3O8 [21], spin-singlet and antiferromagnetic ordering are observed in octa-kagome lattices BiOCu2(Te,Se)O3(SO4)(OH)·H2O, respectively [13], a spin-ice type ground state is reported in the tripod kagome lattice Mg2Dy3Sb3O14 [19] etc.
Recently, a new kagome variant, capped-kagome lattice compound with general formula ()Cu5O2(O4)2 [ K, Rb, Cs, Cu; Cl, Br; P, V] is being pursued rigorously. This series belongs to the Averievite family, an oxide mineral found as a product of post-eruption volcanic activity. Most of these compounds show a structural transition from a high symmetric trigonal at high temperatures to a low symmetric monoclinic phase at low temperatures. In this series, the magnetic properties of the only compound (CsCl)Cu5V2O10 (CCCVO) are elaborately studied which undergoes the structural transition at 310 K [23, 24]. Magnetic susceptibility reveals a large Curie-Weiss (CW) temperature K and the compound encounters a magnetic LRO at around K. Zn2+ substitution at the capped Cu2+ site [i.e., (CsCl)Cu5-xZnxV2O10] suppresses the magnetic as well as the structural transitions and is expected to yield QSL for [25, 26]. Some preliminary magnetic data are also reported for the phosphate analog compounds (CsCl, CsBr, CsI)Cu5P2O10 [27]. Recently, two more new capped-kagome compounds (molybdate-tellurites) based on Ni2+ and Cu2+ are also reported [28]. Thus, the interesting structural aspects and highly frustrated geometry make these compounds very special in the context of new quantum phase transitions.
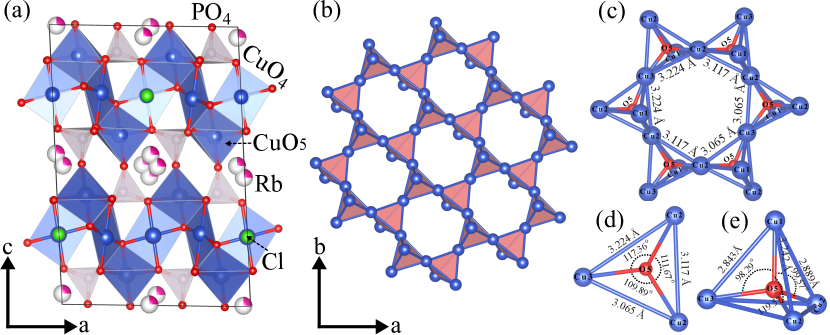
In this paper, we carried out a comprehensive study of the structural and magnetic properties of a phosphate averievite (RbCl)Cu5P2O10, abbreviated as RCCPO. RCCPO is reported to crystallize in a monoclinic structure with space group (No. 15) at room temperature [29]. The crystal structure illustrated in Fig. 1 consists of capped-kagome layers, made up of corner sharing anion-centered OCu4 tetrahedral units, arranged in an up-down-up-down fashion [see Fig. 1(b)]. There are three in-equivalent Cu sites in the formula unit. Two Cu sites (Cu2 and Cu3) possess distorted CuO4 square planar geometry while the Cu1 site forms a distorted CuO5 square pyramid. The CuO4 squares share corners in order to make the kagome plane and the CuO5 square pyramids share the edges with the adjacent CuO4 squares that form the OCu4 tetrahedra units and hence the capped-kagome network. Here, O5 is the common oxygen that provides the interaction path among two Cu2 and one Cu3 ions at the triangular base and the apical Cu1 ion in an anion-centered OCu4 tetrahedron. The Cl- ions are located at the center of the hexagonal rings while the Rb+ ions are located in the inter-layer spacing. The non-magnetic PO4 tetrahedra are placed between the capped-kagome layers and connect the capped Cu2+ of one layer with Cu2+ ions of the neighboring layers. This provides three-dimensional (3D) coupling along the -direction [see Fig. 1(a)]. Further, owing to the low symmetry crystal structure, the Cu2+-Cu2+ distances within each OCu4 tetrahedral unit are unequal, which induces distortion in the capped-kagome layer [see Figs. 1(c - e)]. All these effects render the spin-lattice more complex, opening up the possibility of observing non-trivial ground states. Our magnetic measurements reveal that RCCPO is a highly frustrated magnet and it undergoes two consecutive magnetic transitions at low temperatures.
II Experimental Details
A polycrystalline sample of RCCPO was synthesized by the conventional solid-state reaction technique. The synthesis involves two steps. In the first step, the precursor Cu2P2O7 was prepared by heating the stoichiometric mixture of CuO (Aldrich, 99.999%) and NH2H2PO4 (Aldrich, 99.999%). These reagents were finely ground, pressed into pellets, and prereacted in air at 350 °C for 12 h in order to remove ammonia and water. The obtained soft pellets were ground again, sealed in an evacuated quartz tube, and heated at 800 °C for 24 h. In the second step, the obtained Cu2P2O7 powder was mixed in a stoichiometric ratio with CuO (Aldrich, 99.999%) and RbCl (Aldrich, 99.999%), ground, pelletized, sealed in an evacuated quartz tube, and annealed at 550 - 570 °C with multiple intermediate re-grindings. The phase purity of the product was confirmed by powder x-ray diffraction (XRD) recorded at room temperature using a PANalytical x-ray diffractometer (CuKα radiation, Å). To check if any structural transition is present, temperature-dependent powder XRD was performed over a broad temperature range (13 K K). For low-temperature measurements, a low- attachment (Oxford Phenix) and for high-temperature measurements, a high- oven attachment (Anton-Paar HTK 1200N) to the x-ray diffractometer were used. Rietveld refinement of the powder XRD was performed using the FULLPROF software package [30], taking the initial structural parameters from the previous report [29].
The dc magnetization () was measured as a function of temperature (1.9 K K) in different magnetic fields, using the vibrating sample magnetometer (VSM) attachment to the physical property measurement system [(PPMS) Quantum Design]. Similarly, susceptibility was measured as a function of temperature (1.9 K K) and frequency (200 Hz kHz) in an field of 10 Oe using the ACMS option of the PPMS. Heat capacity () as a function of and was measured on a small piece of sintered pellet using the thermal relaxation technique in PPMS.
Nuclear magnetic resonance (NMR) measurements were carried out using a laboratory-built phase-coherent spin-echo pulse spectrometer on the 31P nuclei (nuclear spin and gyromagnetic ratio MHz/T). We perform the experiments at two radio frequencies ( and 120.6 MHz) and over a wide temperature range (1.8 K 300 K). The 31P NMR spectra were obtained by sweeping the magnetic field, keeping the frequency fixed. The temperature-dependent NMR shift, was calculated by taking the resonance field of the sample () with respect to the resonance field of a nonmagnetic reference () H3PO4. The 31P spin-lattice relaxation rate () was measured by the standard saturation recovery method. 31P spin-spin relaxation rate () was obtained by measuring the decay of the echo integral with variable spacing between the /2 and pulses.
III Results
III.1 X-ray diffraction
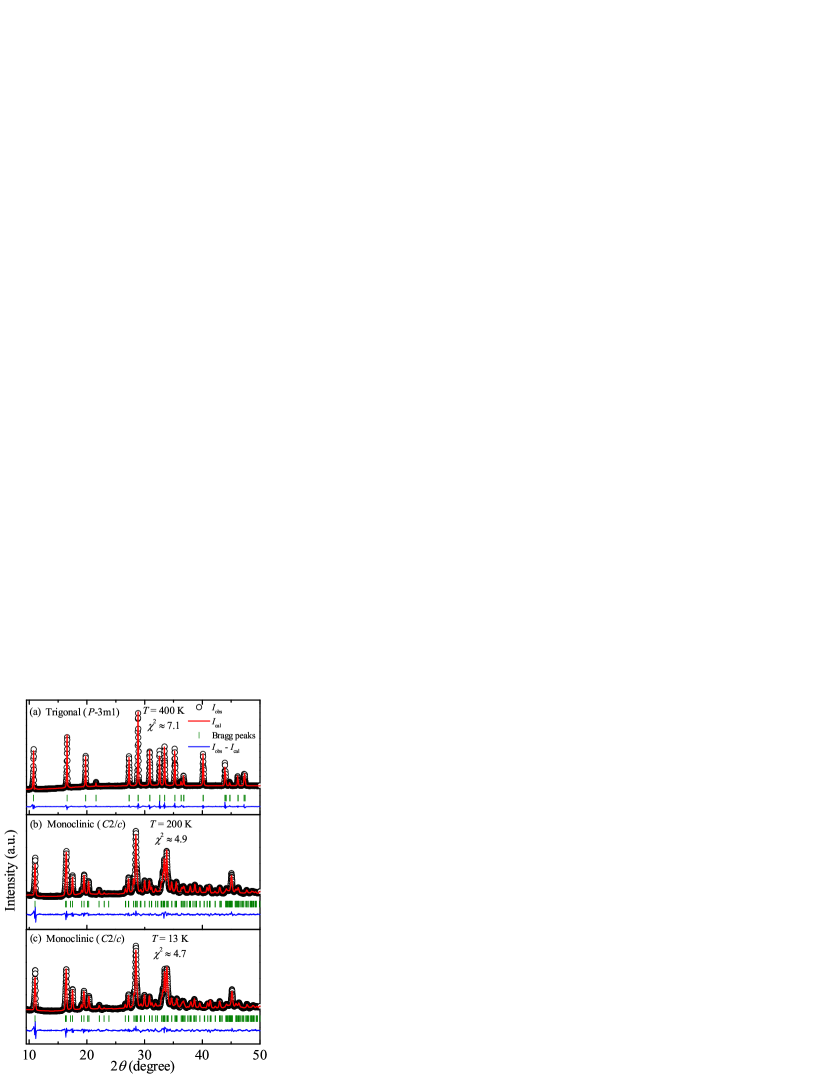
In order to detect the structural transition or lattice distortion, if any, powder XRD was measured at different intermediate temperatures from 13 K to 400 K. Figure 2 displays the powder XRD patterns of RCCPO at 400 K, 200 K, and 13 K along with the Rietveld fit. At room-temperature (300 K), all the diffraction peaks can be well indexed to the monoclinic unit cell with symmetry. The obtained lattice parameters at room temperature are Å, Å, Å, , and the unit cell volume Å3, which are in close agreement with the previous report [29]. The absence of any visible change in the XRD pattern down to 13 K indicates no structural distortion from 300 K down to 13 K. However, a change in the diffraction pattern was observed above K with a splitting of certain Bragg peaks and the appearance of new peaks. Above K, the XRD pattern completely stabilizes in a more symmetric crystal structure with less number of Bragg peaks compare to the room-temperature crystal structure. The analysis of the XRD pattern at 400 K confirmed a trigonal structure with space group (No. 164). The refined lattice parameters are Å, Å, and Å3. Thus, a structural transition occurs at around 310 K from a high temperature trigonal to a low temperature monoclinic structure, similar to the analog compound CCCVO. In an intermediate temperature regime around 300 K both the phases co-exist and the data could be fitted using two phases. The obtained atomic parameters at 400 K (trigonal) and 200 K (monoclinic) are listed in Tables 1 and 2, respectively.
| Atom | Wyckoff | Occ. | |||
|---|---|---|---|---|---|
| Rb1 | a | ||||
| Rb2 | c | (3) | |||
| Cl1 | b | ||||
| Cu1 | d | (1) | |||
| Cu2 | f | ||||
| P1 | d | (2) | |||
| O1 | d | (1) | |||
| O2 | i | (3) | (1) | (4) | |
| O3 | d | (1) |
| Atom | Wyckoff | Occ. | |||
|---|---|---|---|---|---|
| Rb1 | f | (2) | (2) | (2) | |
| Rb2 | f | (2) | (2) | (2) | |
| Cl1 | e | (1) | |||
| Cu1 | f | (2) | (3) | (1) | |
| Cu2 | f | (2) | (2) | (2) | |
| Cu3 | e | (2) | |||
| P1 | f | (2) | (1) | (2) | |
| O1 | f | (2) | (2) | (1) | |
| O2 | f | (1) | (1) | (1) | |
| O3 | f | (2) | (2) | (2) | |
| O4 | f | (2) | (2) | (2) | |
| O5 | f | (2) | (2) | (2) |
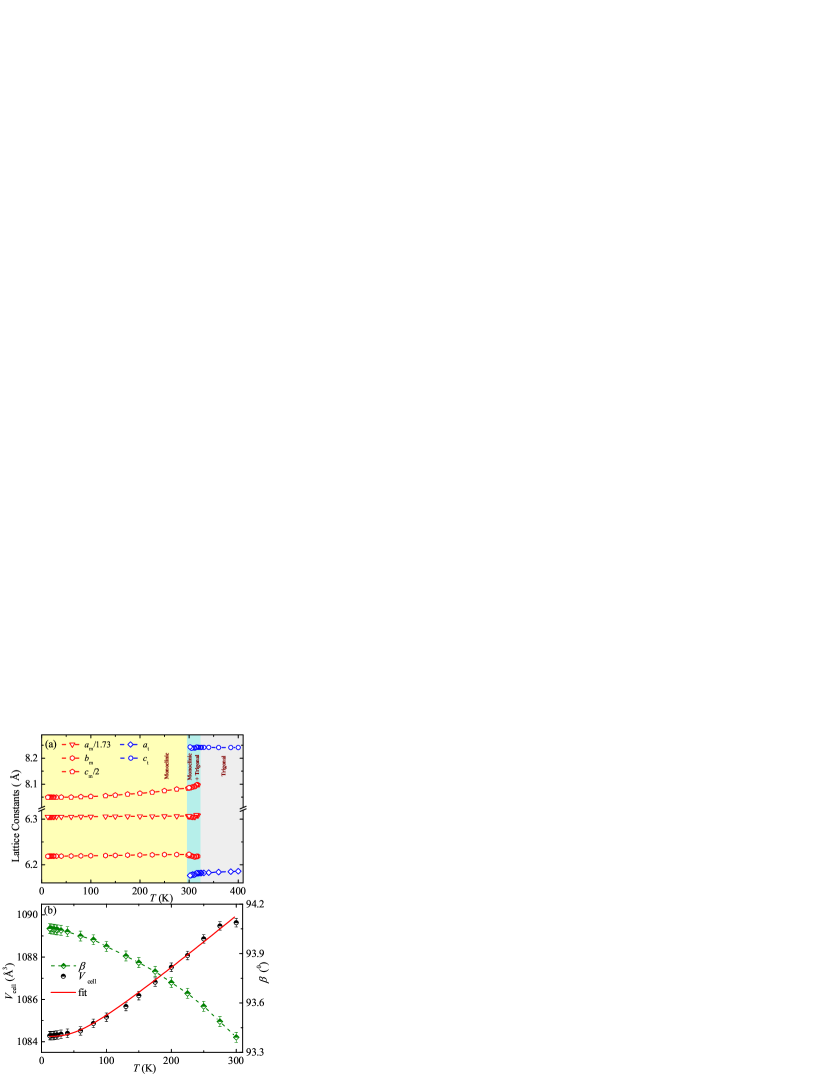
The temperature evolution of lattice parameters from 13 K to 400 K is presented in Fig. 3. As shown in Fig. 3(a), associated with the symmetry lowering, the in-plane and out-of-plane lattice constants transform into , , and , respectively [31, 32]. Here, the subscripts and denote the monoclinic and trigonal structures, respectively. Figure 3(b) presents the temperature variation of angle () and from 13 K to 300 K in the monoclinic phase. increases with decreasing temperature but is found to decrease systematically upon cooling. The variation of with temperature can be expressed in terms of the internal energy [] of the system [33]
| (1) |
where is the cell volume at K, is the bulk modulus of the system, and is the Grneisen parameter. is the internal energy which can be expressed in terms of the Debye approximation [34] as
| (2) |
Here, is the number of atoms in the unit cell, is the Boltzmann constant, and is the Debye temperature. The variable inside the integration stands for the quantity with phonon frequency and Planck constant . Here, and is the upper limit of . The best fit of the data using Eq. (1) [solid line in Fig. 3(b)] yields the parameters: K, 1084.25 Å3, and Pa-1.
III.2 Magnetization
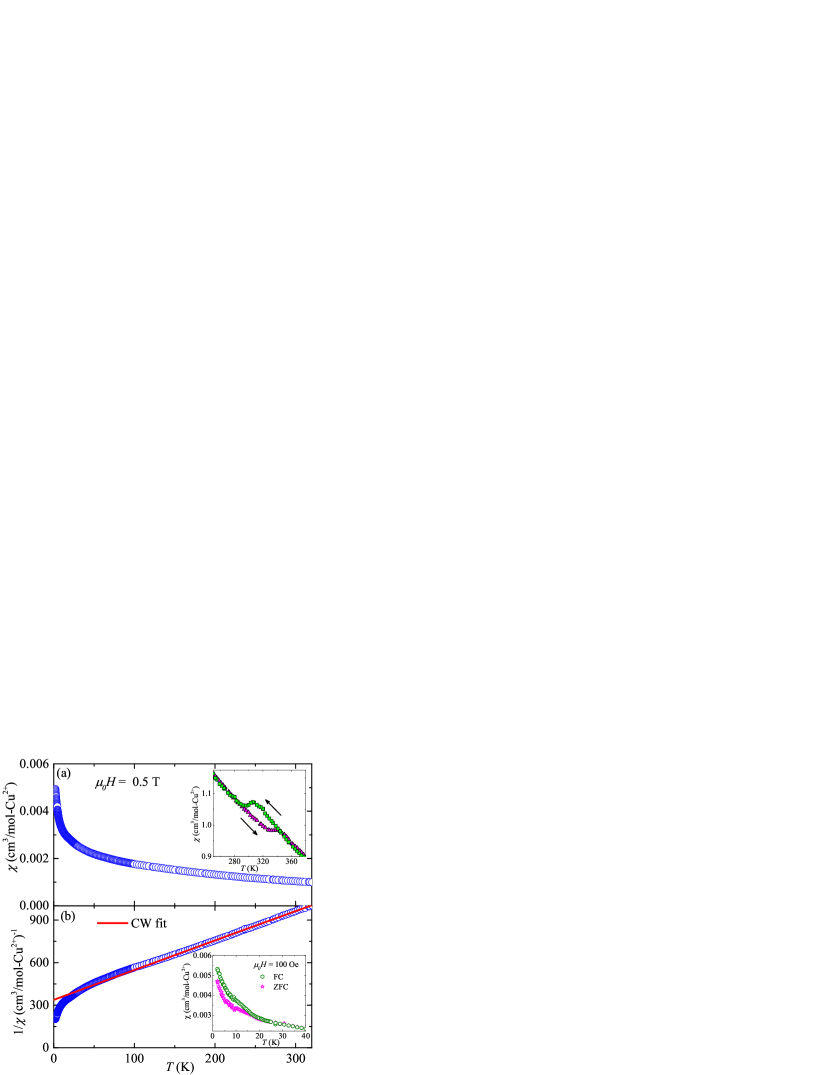
The temperature dependent dc susceptibility () of the polycrystalline RCCPO sample measured in the applied field of T is shown in the Fig. 4(a). At high temperatures, increases with decreasing temperature in a Curie-Weiss (CW) manner as expected in the paramagnetic regime. No clear indication of any magnetic LRO is detected down to 2 K. measured under field-cooled-warming (FCW) and field-cooled-cooling (FCC) conditions shows a clear thermal hysteresis [inset of Fig. 4(a)] confirming the structural phase transition.
Figure 4(b) shows the inverse magnetic susceptibility for T. In the paramagnetic regime typically shows a linear behavior with temperature, due to uncorrelated moments. To extract the magnetic parameters, was fitted in the temperature range 200 K K below the structural transition by the CW law
| (3) |
where, is the temperature-independent susceptibility, which includes Van-Vleck paramagnetism and core diamagnetism. The second term is the CW law where is the Curie constant and is the CW temperature. The fit yields cm3/mol-Cu2+, cm3 K/mol-Cu2+, and K. The large negative value of suggests that the dominant exchange interactions between Cu2+ ions are antiferromagnetic (AFM) in nature. From the value of , the effective moment is calculated to be /Cu2+ using the relation , where is the Avogadro’s number and is the Bohr magneton. For a spin- system, the spin-only effective moment is expected to be , assuming a Land -factor . However, our experimental value of /Cu2+ is slightly higher than the spin-only value and corresponds to . Such a large value of is typically observed for powder samples containing magnetic Cu2+ ion [35]. The core diamagnetic susceptibility of RCCPO is calculated to be cm3/mol by adding the core diamagnetic susceptibilities of the individual ions Rb+, Cl-, Cu2+, P5+, and O2- [36, *Bain532]. The Van-Vleck paramagnetic susceptibility () is estimated by subtracting from to be cm3/mol. This value of is close to the values reported for other cuprates [38, 39].
As depicted in the inset of Fig. 4(b), the zero-field-cooled (ZFC) and field-cooled (FC) susceptibilities in Oe show a weak splitting at K, indicating either the onset of a magnetic LRO or a spin-glass type transition. The extent of frustration in a spin system can be quantified by the frustration ratio . According to the mean field theory, is the sum of all exchange interactions present in the system. Typically, for a non-frustrated AFM system, is close to 1. However, for a highly frustrated AFM, the value is much larger than 1. For RCCPO, the frustration ratio is calculated to be which corroborates the strong frustration in the system.
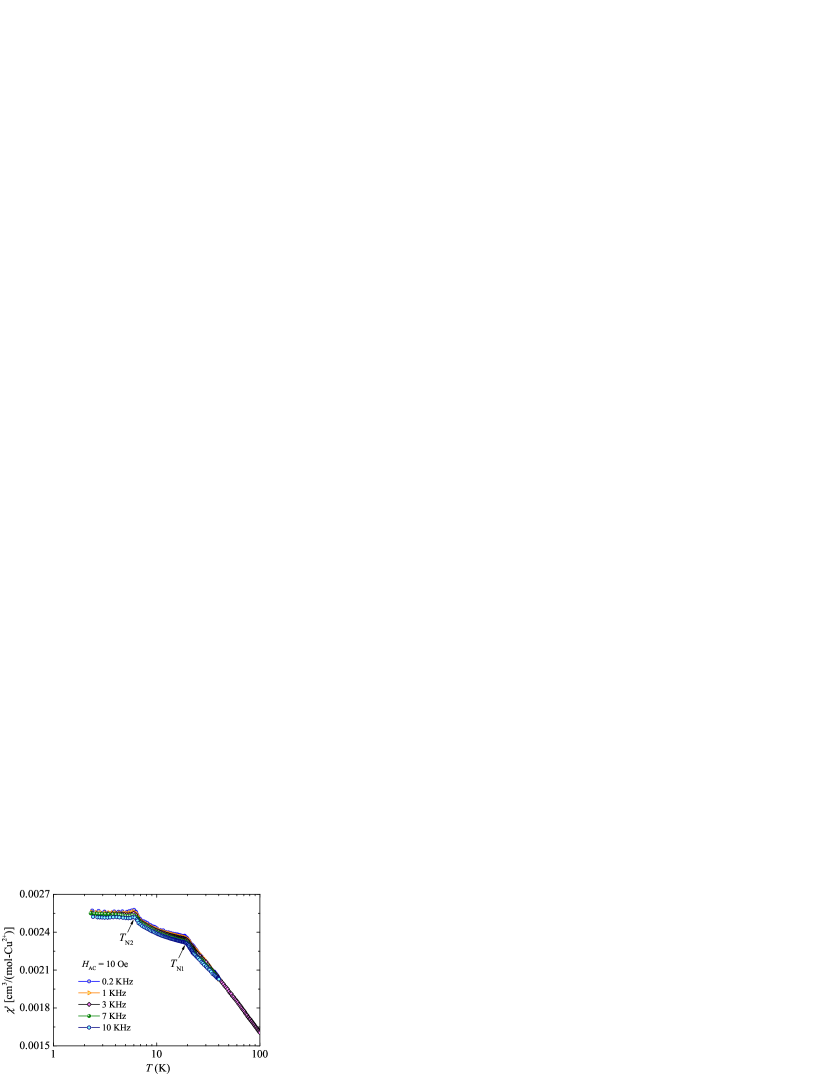
Figure 5 presents the temperature dependent ac susceptibility measured in different frequencies and at a fixed ac field of Oe. In contrast to dc , the real part of the ac susceptibility shows two anomalies at K and K, reflecting two magnetic transitions. The peak at K is found to be weakly frequency dependent, which shifts towards higher temperatures with increasing frequency. This is a possible indication of canted antiferromagnetism or a spin-glass (SG) transition. On the other hand, the peak at K is found to be frequency independent, suggesting the onset of a robust AFM LRO.
III.3 Heat capacity
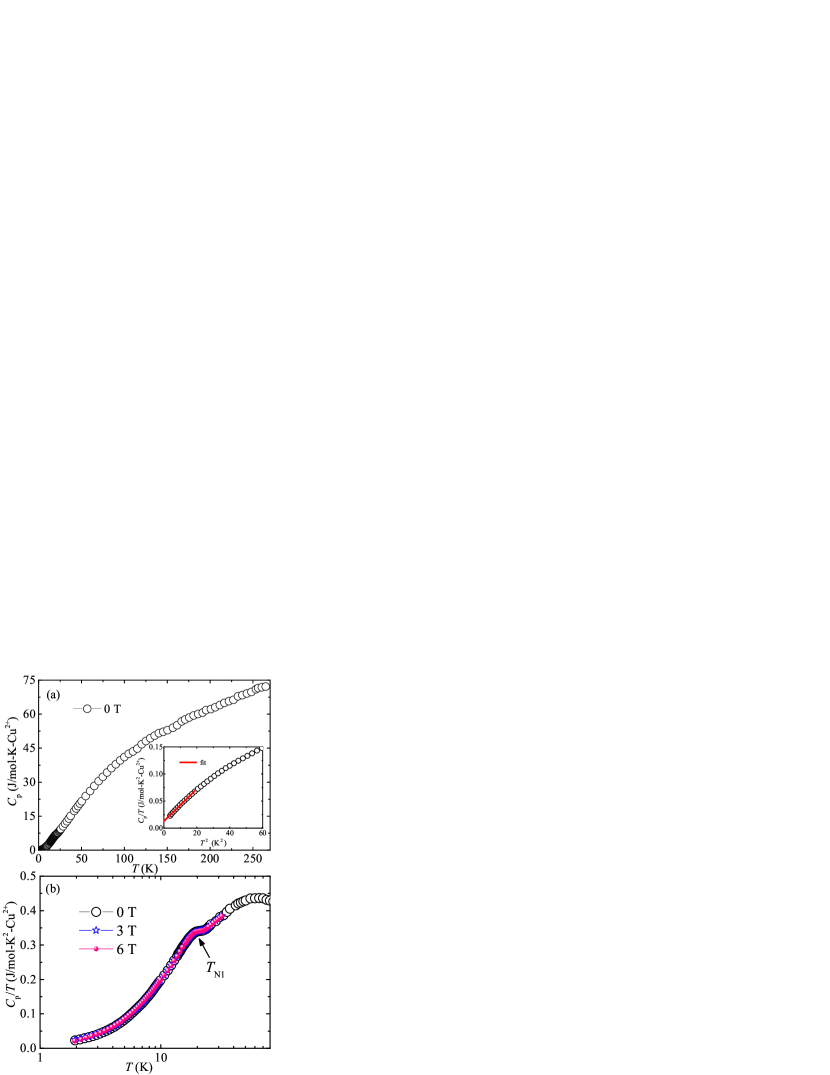
Temperature dependent heat capacity measured in zero-field is presented in Fig. 6(a). At high temperatures, is dominated by the phonon excitations while at low temperatures, it is dominated by the magnetic contribution. As the temperature is lowered, shows a weak cusp at K [see Fig. 6(b)]. The position of this cusp is unaffected by the external magnetic field up to 6 T. However, no obvious feature is evident at K, likely due to a weak entropy change across . Below 4 K, the spin-wave dispersion gives rise to a behavior, as expected in a 3D AFM ordered state [39]. The plot of vs in the inset of Fig. 6(a) highlights the linear behavior below 4 K. Moreover, in case of a SG transition, at low temperatures deviates from the behavior and is usually described by [40]. Thus, only the dependence of also rules out a SG transition at and establishes the canted-AFM nature of the transition. Due to the unavailability of a suitable non-magnetic analog, we are unable to separate the magnetic part of the heat capacity from the total .
III.4 31P NMR
NMR is an immensely powerful local tool to study the static and dynamic properties of a spin system. The crystal structure of RCCPO has a unique 31P site. Two adjacent capped-kagome layers in the -plane are connected through the PO4 tetrahedra. Since 31P is coupled with the Cu2+ ions, through 31P NMR, one can probe the static and dynamic properties of Cu2+ spins.
III.4.1 31P NMR spectra
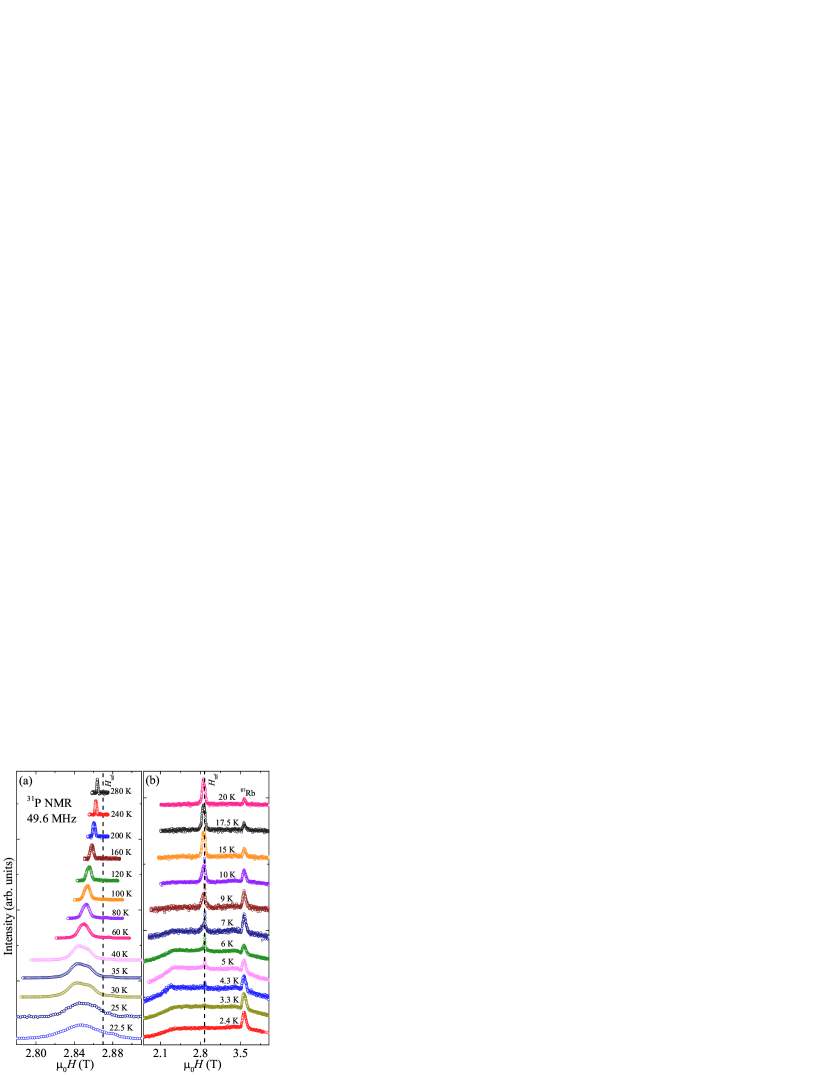
The field-sweep 31P NMR spectra measured at different temperatures (2.4 K K) in a radio frequency of 49.6 MHz are shown in Fig. 7. Each NMR spectrum is normalized by its maximum amplitude and offset vertically by adding a constant. The spectral line consists of a single spectral line, typical for nuclei [41]. The spectral line is symmetric at high temperatures and becomes asymmetric as we go down in temperature. Since our measurements are done on a randomly oriented polycrystalline sample, the asymmetric shape of the spectra can be attributed to a powder pattern due to an asymmetric hyperfine coupling constant and/or an anisotropic susceptibility [42]. With decreasing temperature, the line broadens and the peak position shifts with temperature.
The NMR shift is the direct measure of intrinsic spin susceptibility and is free from extrinsic contributions. Therefore, one can write in terms of as
| (4) |
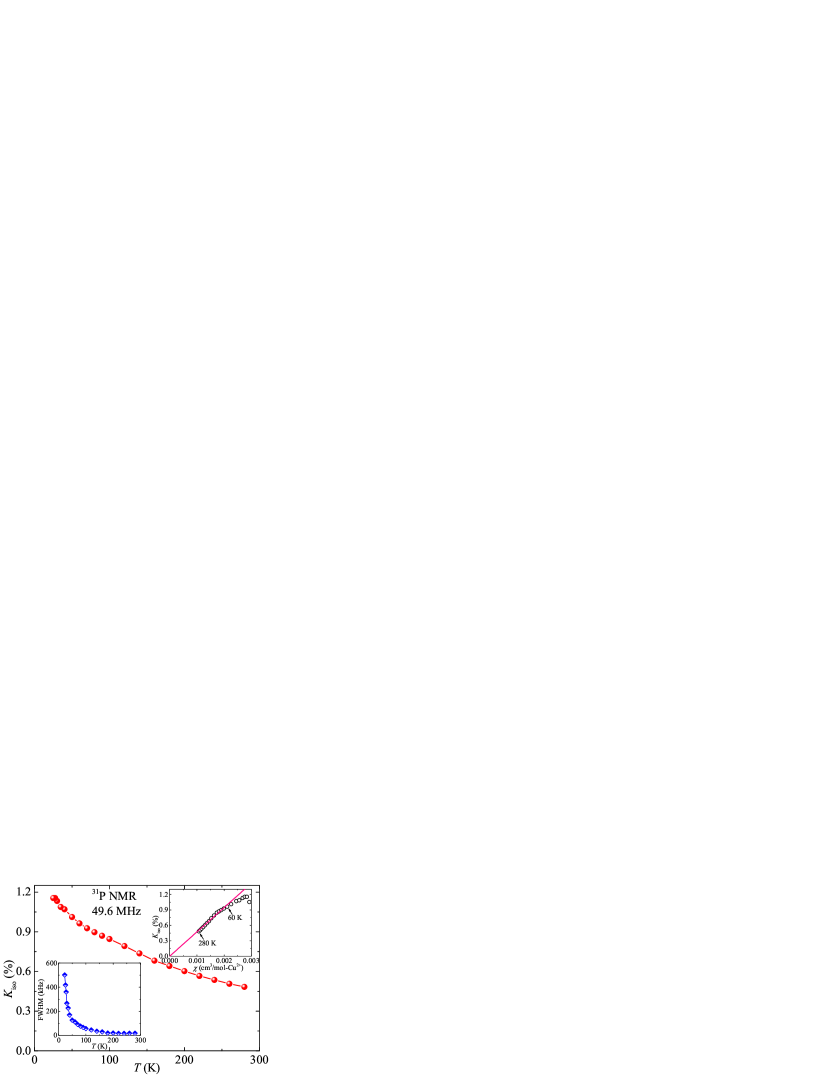
where, is the temperature-independent chemical shift and is the hyperfine coupling constant between the 31P nuclei and Cu2+ electronic spins. The isotropic NMR shift obtained by fitting the NMR spectra is plotted as a function of in Fig. 8. The upper inset of Fig. 8 shows the vs plot with as an implicit parameter. A straight line fit over a temperature range 60 K 280 K yields the isotropic part of the hyperfine coupling T/. The small deviation from linearity below 60 K can be attributed to a small amount of paramagnetic impurities to which is insensitive. The full width at half maximum (FWHM) obtained from the spectral fit is plotted against in the lower inset of Fig. 8. It increases with lowering temperature and then shoots up below about 30 K, which suggests the growth of the internal field as we approach the magnetic ordering at .
Figure 7(b) presents 31P NMR spectra below . Below about 22 K, the NMR line broadens drastically, implying that 31P senses the internal field in the ordered state. The spectrum seems to form a triangular line shape, typically expected for a powder sample in an incommensurate spin-density-wave (SDW) state [43, 44, 45, 46]. Below the second transition K, a huge internal field pops up leading to a drastic line broadening, and the line attains a nearly rectangular shape superimposed with a sharp line at the center of gravity T, which is the zero-shift resonance position of 31P nuclei. With decreasing temperature, this line broadening increases and the intensity of the central narrow line decreases. This rectangular line shape is reminiscent of a commensurate AFM ordering [45, 46, 47, 48]. An additional signal appears at low temperatures which overlaps with the right shoulder of the rectangular pattern. This peak position is almost temperature independent and corresponds to the signal of 87Rb present in the sample.
III.4.2 Spin-lattice relaxation rate
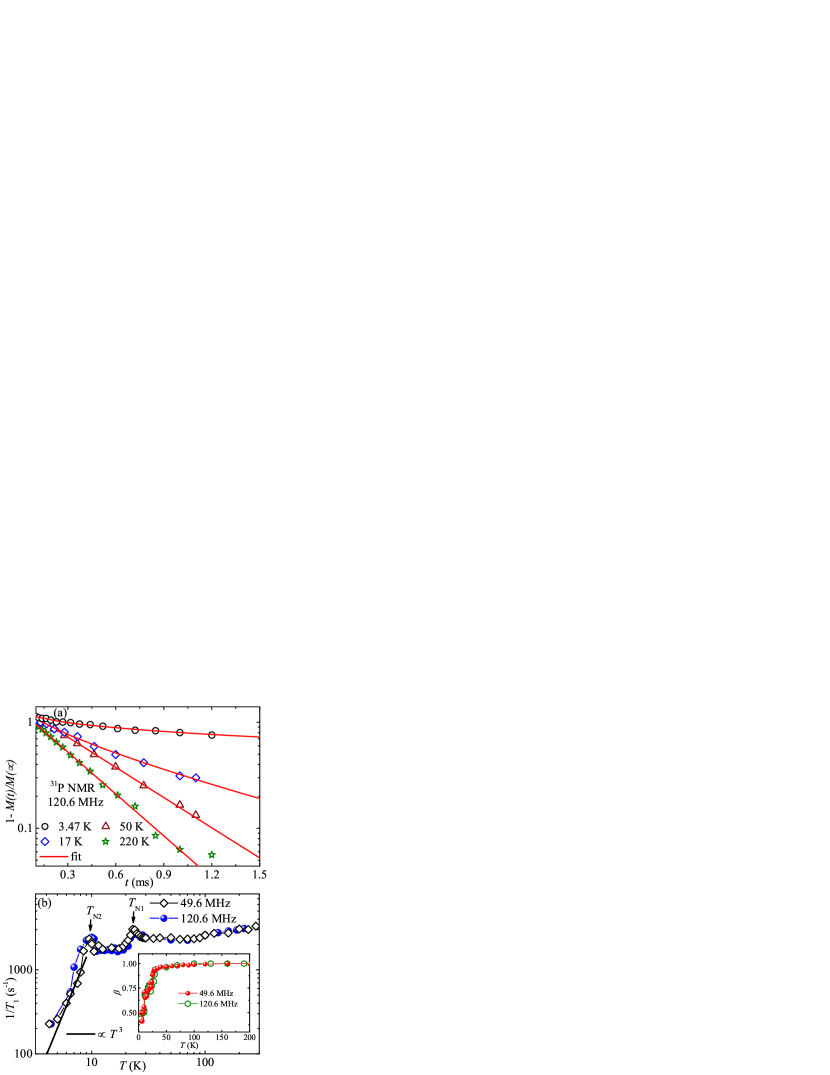
To understand the local spin-spin correlation, the 31P spin-lattice relaxation rate was measured as a function of temperature down to 2.4 K at the central peak position and at two different frequencies, 49.6 MHz and 120.6 MHz. For an nucleus, the recovery of the longitudinal magnetization is expected to follow a single exponential behavior. Indeed, our recovery curves were fitted well by the stretched exponential function
| (5) |
where, is the nuclear magnetization at a time after the saturation pulse, is the equilibrium nuclear magnetization, and is the stretch exponent. Recovery curves for 120.6 MHz in four different temperatures along with the fits are shown in Fig. 9(a).
The temperature dependence of extracted following the above fitting procedure is presented in Fig. 9(b) for both the frequencies. The exponent as a function of for both the frequencies is also plotted in the inset of Fig. 9(b). At high temperatures ( K), the value of is found to be close to 1 and is almost temperature independent, suggesting a uniform relaxation process in this temperature range. However, a drastic drop in the value below about 25 K indicates the distribution of relaxation time in the ordered state which is possibly due to some kind of disorder at the magnetic sites [49]. Similarly, in the high temperature regime ( K) is almost temperature independent due to localized moments in the paramagnetic state [50]. At low-temperatures, exhibits two sharp peaks at around K and K, indicating the slowing down of fluctuating moments as we approach the magnetic transitions. These findings corroborate the double transitions observed from the susceptibility measurements. Note that the transition anomalies in appear at slightly higher temperatures compared to that observed in susceptibility data, which is due to different thermocouples with different calibrations used in the NMR and PPMS cryostats. Below , drops swiftly toward zero because of the release of critical fluctuations and the scattering of magnons by the nuclear spins [51, 52, 53]. For , follows either a behavior or a behavior due to a two-magnon Raman process or a three-magnon process, respectively, where is the energy gap in the spin-wave excitation spectrum [51]. On the other hand, for , it follows an activated behavior . As shown in Fig. 9(b), below follows a nearly behaviour, ascertaining that the relaxation is mainly governed by a two magnon process similar to that reported for other frustrated magnets [53].
From the constant value of at high-temperatures, one can estimate the leading exchange coupling between Cu2+ ions, using the hyperfine coupling between P and Cu atoms. At high temperatures, can be expressed as [50, 53]
| (6) |
where is the Heisenberg exchange frequency, is the number of nearest-neighbor spins of each Cu2+ ion, and is the number of nearest-neighbor Cu2+ spins attached to a given P site. In RCCPO, each Cu2+ ion in the kagome plane has six nearest-neighbors while each capped Cu2+ ion can see only three neighboring ions. Therefore, on an average each Cu2+ spin sees 4.5 neighboring spins. Similarly, each P site is strongly connected to five nearest-neighbour Cu2+ spins. Thus, using the parameters T/, sec-1 Oe-1, , , , , and the relaxation rate at 160 K sec-1, the magnitude of the leading antiferromagnetic exchange coupling is calculated to be K.
III.4.3 Spin-spin relaxation rate
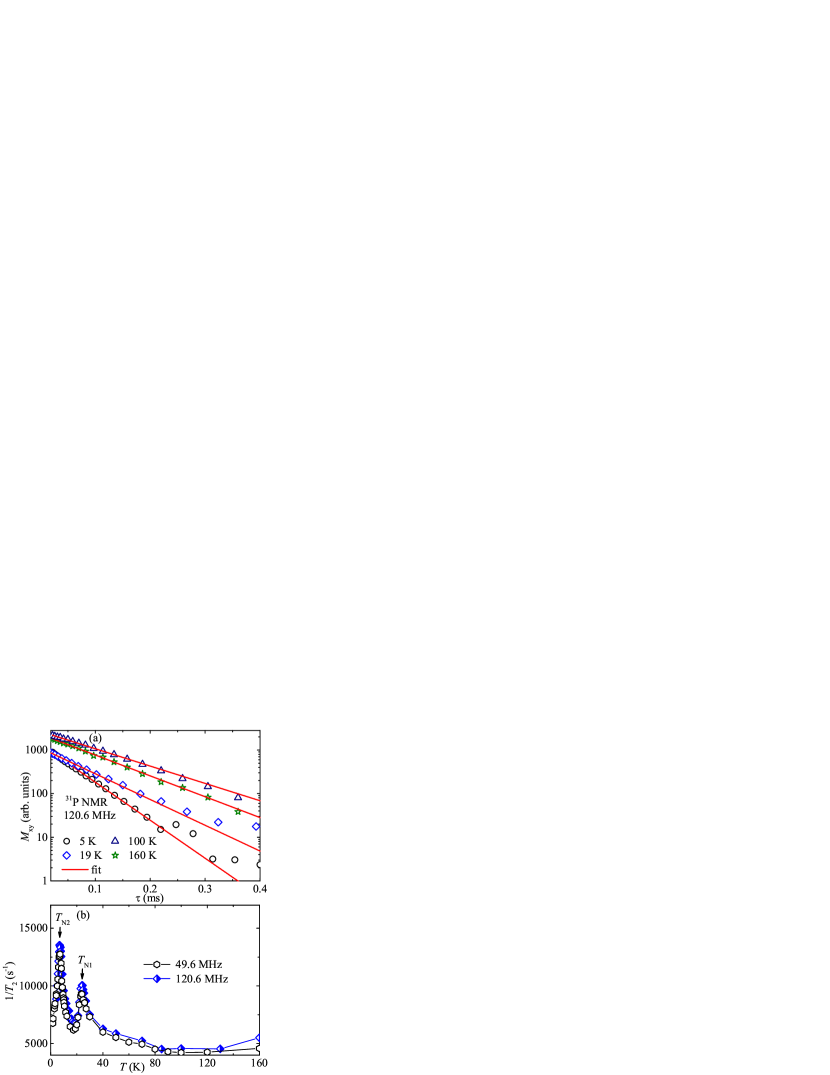
In order to measure the spin-spin relaxation rate , the decay of the transverse magnetization () was monitored after a - - pulse sequence as a function of the pulse separation time . The recovery curves are then fitted by the following equation
| (7) |
Recovery curves at a few selected temperatures along with the fits are depicted in Fig. 10(a). The extracted is plotted as a function of temperature in Fig. 10(b). Similar to , also exhibits two sharp peaks, further establishing double transitions at K and K.
IV Discussion and Summary
This averievite family of compounds is an interesting class of compounds where the replacement of any ion in the structure affects the geometry of the OCu4 tetrahedron and alters the magnetic properties significantly. For instance, in the phosphates (CsCl,CsBr,CsI)Cu5P2O10, the value of which represents the overall energy scale of the exchange couplings as well as the value of increase systematically as the halide ion is changed from Cl to I in the order of increasing ionic radius [27]. The obtained values of and for RCCPO are comparable to that of the analog compound CCCVO, resulting in an almost identical frustration parameter ( for RCCPO, for CCCVO). A recent theoretical work has shown that upon the replacement of V5+ by P5+ in CCCVO where the ionic radius of P5+ is two times smaller than that of V5+, the coupling within the kagome layer remains almost the same whereas the coupling between a kagome layer and capped Cu atom becomes five times larger, increasing the degree of frustration within the OCu4 tetrahedra [24]. In this analogy, RCCPO should have a larger value than CCCVO because of the replacement of V5+ by P5+. Here, another difference is that RCCPO contains Rb+ that has a smaller ionic radius than Cs+ in CCCVO, which possibly plays a crucial role due to which the overall energy scale of the exchange couplings is comparable.
In contrast to a single magnetic transition in all phosphate compounds [(CsCl,CsBr,CsI)Cu5P2O10], there appears two magnetic transitions ( K and K) in RCCPO at low temperatures which makes this compound an exception in this series. It is to be noted that, despite having the same crystal structure (monoclinic), their space group symmetry is found to be different ( for RCCPO and for the other phosphates). The OCu4 tetrahedra in RCCPO are highly distorted compared to the other phosphates. In RCCPO, each tetrahedron consists of three in-equivalent Cu sites in contrast to two Cu sites in other phosphates. A diligent scrutiny of the crystal structure [see Figs. 1(c) - (e)] reveals that Cu-Cu bond distances and bond angles in the triangular base of the tetrahedron are inequivalent for RCCPO in contrast to the equilateral triangular base in other phosphates. Similarly, the Cu-Cu bond distances and bond angles of the apical (or capped) Cu with respect to the Cu atoms at the base are all in-equivalent for RCCPO in contrast to other phosphates. Moreover, the six Cu-Cu bond distances in the hexagonal ring [Fig. 1(c)] are also found to be unequal and vary from 3.065 to 3.225 Åfor RCCPO while this hexagon is isotropic with the same bond distance for all other phosphates. Thus, the strong distortion in the crystal structure could be the reason for having different ground state properties in RCCPO.
Double magnetic transitions are predicted to occur in anisotropic triangular lattice antiferromagnets (TLAFs) when the magnetic anisotropy is of easy-axis type [54, 55, 56, 45]. On lowering the temperature, the collinear up-up-down state appears before the state and the temperature range of the intermediate phase ( reflects the relative strength of the easy-axis anisotropy with respect to the isotropic intralayer coupling. Experimentally, double transitions are reported in several TLAFs [57, 58, 59, 60, 58, 60]. Double magnetic transitions in zero-field are also observed in staircase-kagome magnets (Mn,Ni,Co)3V2O8 and PbCu3TeO7 [14, 15, 61, 62]. In (Mn,Ni,Co)3V2O8, both the phases are reported to be incommensurate in nature, originating from two decoupled sub-lattices in the kagome staircase structure [63]. However, in RCCPO, the two transitions are different. Our 31P NMR spectral measurements elucidate probably an incommensurate-type phase below and a commensurate phase below . Since the capped-kagome structure is a corner sharing of triangular motifs, the two successive transitions observed can be possibly attributed to anisotropy in the compound. However, a more precise knowledge about the nature and origin of the transitions can only be obtained from neutron scatting experiments and complementary theoretical calculations.
In summary, we present the structural and magnetic properties of a geometrically frustrated quantum magnet (RbCl)Cu5P2O10. Below K, the monoclinic structure portrays a capped kagome lattice of Cu2+ ions. Sizable magnetic frustration is gauged from a large value of the frustration parameter. The dual magnetic transitions at low temperatures where a commensurate AFM ordering is preceded by an incommensurate ordering in a capped kagome lattice is unusual and can be possibly ascribed to strong distortion and/or magnetic anisotropy in the spin-lattice. Nevertheless, these ambiguous features call for further experimental investigations on this compound.
Acknowledgements.
We would like to acknowledge SERB, India for financial support bearing sanction Grant No. CRG/2022/000997. Work at the Ames National Laboratory was supported by the U.S. Department of Energy, Office of Science, Basic Energy Sciences, Materials Sciences and Engineering Division. The Ames National Laboratory is operated for the U.S. Department of Energy by Iowa State University under Contract No. DEAC02-07CH11358.References
- Ramirez [1994] A. P. Ramirez, Strongly geometrically frustrated magnets, Annu. Rev. Mater. Sci. 24, 453 (1994).
- [2] H. T. Diep, Frustrated Spin Systems (World scientific)(2013).
- Balents [2010] L. Balents, Spin liquids in frustrated magnets, Nature 464, 199 (2010).
- Yan et al. [2011] S. Yan, D. A. Huse, and S. R. White, Spin-Liquid Ground State of the spin- Kagome Heisenberg Antiferromagnet, Science 332, 1173 (2011).
- Han et al. [2012] T. H. Han, J. S. Helton, S. Chu, D. G. Nocera, J. A. Rodriguez-Rivera, C. Broholm, and Y. S. Lee, Fractionalized excitations in the spin-liquid state of a kagome-lattice antiferromagnet, Nature 492, 406 (2012).
- Khuntia et al. [2020] P. Khuntia, M. Velazquez, Q. Barthélemy, F. Bert, E. Kermarrec, A. Legros, B. Bernu, L. Messio, A. Zorko, and P. Mendels, Gapless ground state in the archetypal quantum kagome antiferromagnet ZnCu3(OH)6Cl2, Nat. Phys. 16, 469 (2020).
- Fu et al. [2015] M. Fu, T. Ima, T. H. Han, and Y. S. Lee, Evidence for a gapped spin-liquid ground state in a kagome Heisenberg antiferromagnet, Science 350, 655 (2015).
- Bieri et al. [2015] S. Bieri, L. Messio, B. Bernu, and C. Lhuillier, Gapless chiral spin liquid in a kagome Heisenberg model, Phys. Rev. B 92, 060407(R) (2015).
- Picot et al. [2016] T. Picot, M. Ziegler, R. Orús, and D. Poilblanc, Spin- kagome quantum antiferromagnets in a field with tensor networks, Phys. Rev. B 93, 060407 (2016).
- Suttner et al. [2014] R. Suttner, C. Platt, J. Reuther, and R. Thomale, Renormalization group analysis of competing quantum phases in the - Heisenberg model on the kagome lattice, Phys. Rev. B 89, 020408 (2014).
- Hering et al. [2022] M. Hering, F. Ferrari, A. Razpopov, I. I. Mazin, R. Valenti, H. O. Jeschke, and J. Reuther, Phase diagram of a distorted kagome antiferromagnet and application to Y-kapellasite, Npj Comput. Mater 8, 10 (2022).
- Fujihala et al. [2020] M. Fujihala, K. Morita, R. Mole, S. Mitsuda, T. Tohyama, S. Yano, et al., Gapless spin liquid in a square-kagome lattice antiferromagnet, Nat. Commun. 11, 3429 (2020).
- Tang et al. [2017] Y. Y. Tang, C. Peng, W. B. Guo, J. F. Wang, G. Su, and Z. Z. He, Octa-kagome lattice compounds showing quantum critical behaviours: Spin gap ground state versus antiferromagnetic ordering, J. Am. Chem. Soc. 139, 14057 (2017).
- Morosan et al. [2007] E. Morosan, J. Fleitman, T. Klimczuk, and R. J. Cava, Rich magnetic phase diagram of the kagome-staircase compound Mn3V2O8, Phys. Rev. B 76, 144403 (2007).
- Yoo et al. [2018] K. Yoo, B. Koteswararao, J. Kang, A. Shahee, et al., Magnetic field-induced ferroelectricity in spin- kagome staircase compound PbCu3TeO7, npj Quantum Mater. 3, 2397 (2018).
- Rousochatzakis et al. [2008] I. Rousochatzakis, A. M. Lauchli, and F. Mila, Highly frustrated magnetic clusters: The kagome on a sphere, Phys. Rev. B 77, 094420 (2008).
- Jeschke et al. [2019] H. O. Jeschke, H. Nakano, and T. Sakai, From kagome strip to kagome lattice: Realizations of frustrated spin- antiferromagnets in Ti(III) fluorides, Phys. Rev. B 99, 140410 (2019).
- Morita et al. [2021] K. Morita, S. Sota, and T. Tohyama, Resonating dimer-monomer liquid state in a magnetization plateau of a spin- kagome-strip Heisenberg chain, Commun. Phys. 4, 2399 (2021).
- Dun et al. [2016] Z. L. Dun, J. Trinh, K. Li, M. Lee, K. W. Chen, R. Baumbach, Y. F. Hu, et al., Magnetic Ground States of the Rare-Earth Tripod Kagome Lattice (), Phys. Rev. Lett. 116, 157201 (2016).
- Dun et al. [2020] Z. Dun, X. Bai, J. A. M. Paddison, E. Hollingworth, N. P. Butch, C. D. Cruz, M. B. Stone, et al., Quantum Versus Classical Spin Fragmentation in Dipolar Kagome Ice , Phys. Rev. X 10, 031069 (2020).
- Okamoto et al. [2007] Y. Okamoto, M. Nohara, H. Aruga-Katori, and H. Takagi, Spin-Liquid State in the spin- Hyperkagome Antiferromagnet , Phys. Rev. Lett. 99, 137207 (2007).
- Lawler et al. [2008] M. J. Lawler, H. Y. Kee, Y. B. Kim, and A. Vishwanath, Topological Spin Liquid on the Hyperkagome Lattice of , Phys. Rev. Lett. 100, 227201 (2008).
- Botana et al. [2018] A. S. Botana, H. Zheng, S. H. Lapidus, J. F. Mitchell, and M. R. Norman, Averievite: A copper oxide kagome antiferromagnet, Phys. Rev. B 98, 054421 (2018).
- Dey and Botana [2020] D. Dey and A. S. Botana, Role of chemical pressure on the electronic and magnetic properties of the spin- kagome mineral averievite, Phys. Rev. B 102, 125106 (2020).
- [25] M. Georgopoulou, D. Boldrin, B. Fak, P. Manuel, A. Gibbs, J. Ollivier, E. Suard, and A. S. Wills, Magnetic ground states and excitations in Zn-doped averieite - a family of oxide-based spin- kagome antiferromagnets, arXiv:2306.14739v1 .
- Biesner et al. [2022] T. Biesner, S. Roh, A. Pustogow, H. Zheng, J. F. Mitchell, and M. Dressel, Magnetic terahertz resonances above the néel temperature in the frustrated kagome antiferromagnet averievite, Phys. Rev. B 105, L060410 (2022).
- Winiarski et al. [2019] M. J. Winiarski, T. T. Tran, J. R. Chamorro, and T. M. McQueen, (Cs)Cu5O2(PO4)2 ( = Cl, Br, I): A Family of Cu2+ spin- Compounds with Capped-Kagomé Networks Composed of OCu4 Units, Inorg. Chem. 58, 4328 (2019).
- Zhang et al. [2020] W. Zhang, Z. He, Y. Xie, M. Cui, S. Zhang, S. Chen, Z. Zhao, M. Zhang, and X. Huang, Molybdate–tellurite compounds with capped-kagome spin–lattices, Inorg. Chem. 59, 2299 (2020).
- Kornyakov et al. [2021] I. V. Kornyakov, V. A. Vladimirova, O. I. Siidra, and S. V. Krivovichev, Expanding the Averievite Family, ()Cu5O2(5+O4)2 (5+=P,V; =K,Rb,Cs,Cu; =Cl,Br): Synthesis and Single-Crystal X-ray Diffraction Study, Molecules 26, 1833 (2021).
- Carvajal [1993] J. R. Carvajal, Recent advances in magnetic structure determination by neutron powder diffraction, Physica B: Condens. Matter 192, 55 (1993).
- Bader et al. [2022] V. P. Bader, J. Langmann, P. Gegenwart, and A. A. Tsirlin, Deformation of the triangular spin- lattice in , Phys. Rev. B 106, 054415 (2022).
- Tsirlin et al. [2011] A. A. Tsirlin, R. Nath, A. M. Abakumov, Y. Furukawa, D. C. Johnston, M. Hemmida, H.-A. Krug von Nidda, A. Loidl, C. Geibel, and H. Rosner, Phase separation and frustrated square lattice magnetism of Na1.5VOPO4F0.5, Phys. Rev. B 84, 014429 (2011).
- Guchhait et al. [2022] S. Guchhait, D. V. Ambika, Q.-P. Ding, M. Uhlarz, Y. Furukawa, A. A. Tsirlin, and R. Nath, Deformed spin- square lattice in antiferromagnetic , Phys. Rev. B 106, 024426 (2022).
- Kittel [2004] C. Kittel, Introduction to Solid State Physics (Wiley, 2004).
- Nath et al. [2015] R. Nath, M. Padmanabhan, S. Baby, A. Thirumurugan, D. Ehlers, M. Hemmida, H.-A. Krug von Nidda, and A. A. Tsirlin, Quasi-two-dimensional magnetism of , Phys. Rev. B 91, 054409 (2015).
- Selwood [1956] P. W. Selwood, Magnetochemistry (Interscience, New York, 1956).
- Bain and Berry [2008] G. A. Bain and J. F. Berry, Diamagnetic corrections and pascal’s constants, J. Chem. Educ. 85, 532 (2008).
- Guchhait et al. [2021] S. Guchhait, Q. P. Ding, M. Sahoo, A. Giri, S. Maji, Y. Furukawa, and R. Nath, Quasi-one-dimensional uniform spin- Heisenberg antiferromagnet KNaCuP2O7 probed by and NMR, Phys. Rev. B 103, 224415 (2021).
- Islam et al. [2018] S. S. Islam, K. M. Ranjith, M. Baenitz, Y. Skourski, A. A. Tsirlin, and R. Nath, Frustration of square cupola in Sr(TiO)Cu4(PO4)4, Phys. Rev. B 97, 174432 (2018).
- Islam et al. [2020] S. S. Islam, V. Singh, K. Somesh, P. K. Mukharjee, A. Jain, S. M. Yusuf, and R. Nath, Unconventional superparamagnetic behavior in the modified cubic spinel compound , Phys. Rev. B 102, 134433 (2020).
- Mukharjee et al. [2019] P. K. Mukharjee, K. M. Ranjith, B. Koo, J. Sichelschmidt, M. Baenitz, Y. Skourski, Y. Inagaki, Y. Furukawa, A. A. Tsirlin, and R. Nath, Bose-Einstein condensation of triplons close to the quantum critical point in the quasi-one-dimensional spin- antiferromagnet , Phys. Rev. B 100, 144433 (2019).
- Yogi et al. [2015] A. Yogi, N. Ahmed, R. Nath, A. A. Tsirlin, S. Kundu, A. V. Mahajan, J. Sichelschmidt, B. Roy, and Y. Furukawa, Antiferromagnetism of and the dilution with , Phys. Rev. B 91, 024413 (2015).
- Kontani et al. [1975] M. Kontani, T. Hioki, and Y. Masuda, Hyperfine fields in an incommensurate antiferromagnetic Cr-Mo alloy system, J. Phys. Soc. Jpn. 39, 672 (1975).
- Sakurai et al. [2002] H. Sakurai, N. Tsuboi, M. Kato, K. Yoshimura, K. Kosuge, A. Mitsuda, H. Mitamura, and T. Goto, Antiferromagnetic order in the two-dimensional spin system Cu3B2O6, Phys. Rev. B 66, 024428 (2002).
- Ranjith et al. [2016] K. M. Ranjith, R. Nath, M. Majumder, D. Kasinathan, M. Skoulatos, L. Keller, Y. Skourski, M. Baenitz, and A. A. Tsirlin, Commensurate and incommensurate magnetic order in spin-1 chains stacked on the triangular lattice in , Phys. Rev. B 94, 014415 (2016).
- Ranjith et al. [2015] K. M. Ranjith, M. Majumder, M. Baenitz, A. A. Tsirlin, and R. Nath, Frustrated three-dimensional antiferromagnet : NMR and the effect of nonmagnetic dilution, Phys. Rev. B 92, 024422 (2015).
- Yamada and Sakata [1986] Y. Yamada and A. Sakata, An analysis method of antiferromagnetic powder patterns in spin-echo NMR under external fields, J. Phys. Soc. Jpn. 55, 1751 (1986).
- Kikuchi et al. [2000] J. Kikuchi, K. Ishiguchi, K. Motoya, M. Itoh, K. Inari, N. Eguchi, and J. Akimitsu, Nmr and neutron scattering studies of quasi one-dimensional magnet CuV2O6, J. Phys. Soc. Jpn. 69, 2660 (2000).
- Johnston et al. [2005] D. C. Johnston, S.-H. Baek, X. Zong, F. Borsa, J. Schmalian, and S. Kondo, Dynamics of Magnetic Defects in Heavy Fermion from Stretched Exponential NMR Relaxation, Phys. Rev. Lett. 95, 176408 (2005).
- Moriya [1956] T. Moriya, Nuclear magnetic relaxation in antiferromagnetics, Prog. Theor. Phys. 16, 23 (1956).
- Beeman and Pincus [1968] D. Beeman and P. Pincus, Nuclear spin-lattice relaxation in magnetic insulators, Phys. Rev. 166, 359 (1968).
- Belesi et al. [2006] M. Belesi, F. Borsa, and A. K. Powell, Evidence for spin-wave excitations in the long-range magnetically ordered state of a molecular crystal from proton NMR, Phys. Rev. B 74, 184408 (2006).
- Nath et al. [2009] R. Nath, Y. Furukawa, F. Borsa, E. E. Kaul, M. Baenitz, C. Geibel, and D. C. Johnston, Single-crystal NMR studies of the frustrated square-lattice compound , Phys. Rev. B 80, 214430 (2009).
- Matsubara [1982] F. Matsubara, Magnetic Ordering in a Hexagonal Antiferromagnet, J. Phys. Soc. Jpn. 51, 2424 (1982).
- Miyashita and Kawamura [1985] S. Miyashita and H. Kawamura, Phase Transitions of Anisotropic Heisenberg Antiferromagnets on the Triangular Lattice, J. Phys. Soc. Jpn. 54, 3385 (1985).
- Quirion et al. [2015] G. Quirion, M. Lapointe-Major, M. Poirier, J. A. Quilliam, Z. L. Dun, and H. D. Zhou, Magnetic phase diagram of as determined by ultrasound velocity measurements, Phys. Rev. B 92, 014414 (2015).
- Lee et al. [2014] M. Lee, J. Hwang, E. S. Choi, J. Ma, C. R. Dela Cruz, M. Zhu, X. Ke, Z. L. Dun, and H. D. Zhou, Series of phase transitions and multiferroicity in the quasi-two-dimensional spin- triangular-lattice antiferromagnet , Phys. Rev. B 89, 104420 (2014).
- Zhou et al. [2012] H. D. Zhou, C. Xu, A. M. Hallas, H. J. Silverstein, C. R. Wiebe, I. Umegaki, J. Q. Yan, T. P. Murphy, J.-H. Park, Y. Qiu, J. R. D. Copley, J. S. Gardner, and Y. Takano, Successive Phase Transitions and Extended Spin-Excitation Continuum in the spin- Triangular-Lattice Antiferromagnet , Phys. Rev. Lett. 109, 267206 (2012).
- Ranjith et al. [2017] K. M. Ranjith, K. Brinda, U. Arjun, N. G. Hegde, and R. Nath, Double phase transition in the triangular antiferromagnet , J. Phys.: Condens. Matter 29, 115804 (2017).
- Yokota et al. [2014] K. Yokota, N. Kurita, and H. Tanaka, Magnetic phase diagram of the spin- triangular-lattice Heisenberg antiferromagnet , Phys. Rev. B 90, 014403 (2014).
- Rai et al. [2006] R. C. Rai, J. Cao, S. Brown, J. L. Musfeldt, D. Kasinathan, D. J. Singh, G. Lawes, N. Rogado, R. J. Cava, and X. Wei, Optical properties and magnetic-field-induced phase transitions in the ferroelectric state of : Experiments and first-principles calculations, Phys. Rev. B 74, 235101 (2006).
- Wilson et al. [2007] N. R. Wilson, O. A. Petrenko, and L. C. Chapon, Magnetic phases in the Kagomé staircase compound studied using powder neutron diffraction, Phys. Rev. B 75, 094432 (2007).
- Dong et al. [2022] C. Dong, J. F. Wang, Z. Z. He, Y. T. Chang, M. Y. Shi, Y. R. Song, S. M. Jin, Y. Q. Du, Z. Y. Wu, X. T. Han, K. Kindo, and M. Yang, Reentrant ferroelectric phase induced by a tilting high magnetic field in , Phys. Rev. B 105, 024427 (2022).