The Interaction between AGN and Starburst Activity in the Circumnuclear Region of NGC 7469 as Viewed with JWST
Abstract
We combine mid-infrared diagnostics obtained from integral-field unit observations taken with MIRI/MRS on JWST with cold molecular gas information derived from ALMA observations of CO(1–0) emission to investigate the star formation rate and efficiency within the central region of the Seyfert 1 galaxy NGC 7469 on pc scales. The active nucleus leaves a notable imprint on its immediate surroundings by elevating the temperature of the warm molecular gas, driving an ionized gas outflow on sub-kpc scales, and selectively destroying small dust grains. These effects, nevertheless, have relatively little impact on the cold circumnuclear medium or its ability to form stars. Most of the star formation in NGC 7469 is confined to a clumpy starburst ring, but the star formation efficiency remains quite elevated even for the nuclear region that is most affected by the active nucleus.
1 Introduction
Grasping the nature of star formation within different environments is fundamental for understanding galaxy formation and evolution. Deciphering star formation activity in galaxies of diverse types and in different stages of their evolution involves consideration of multiple facets of their lifecycle. Of particular recent interest is the potential role played by active galactic nuclei (AGNs) in impacting the star formation properties of galaxies. Widely regarded to coevolve with their galaxies (Kormendy & Ho, 2013), supermassive black holes can influence their hosts and large-scale surroundings in a variety of ways (e.g., Fabian 2012; Heckman & Best 2014; Padovani et al. 2017). Supermassive black holes, while they accrete vigorously and manifest themselves as luminous AGNs and quasars (Rees, 1984; Shen & Ho, 2014), release sufficient radiative energy to expel the surrounding gas through “quasar-mode” feedback (e.g., Di Matteo et al. 2005; Hopkins et al. 2008). At the opposite extreme, highly sub-Eddington AGNs such as low-ionization nuclear emission-line regions (Heckman, 1980; Ho, 2008), which have extremely weak luminosity and very low radiative efficiency (Ho et al., 2003; Ho, 2009), may interact with their environment mainly via “kinetic-mode” feedback(e.g., McNamara & Nulsen 2007; Weinberger et al. 2017; Davé et al. 2019), given the propensity for these systems to exhibit increasingly prominent signatures of jet-like emission (e.g., Ho 2002; Terashima & Wilson 2003; Sikora et al. 2007). Although AGN feedback has been incorporated into many state-of-the-art cosmological simulations of galaxy evolution (e.g., Schaye et al. 2015; Pillepich et al. 2018; Davé et al. 2020), debate persists as to whether this mechanism effectively regulates the gas content (e.g., Shangguan et al. 2018; Shangguan & Ho 2019; Molina et al. 2022; Zhuang & Ho 2020; Ward et al. 2022) and star formation activity (e.g., Xie et al. 2021) in galaxies. And if so, which mode operates? AGN feedback can be negative, by expelling gas from galaxies and curtailing their ability or efficiency to form stars (e.g., Schawinski et al. 2007; Page et al. 2012; Cheung et al. 2016; Harrison 2017), or positive, by facilitating star formation through gas compression by outflows (e.g., Zubovas et al. 2013; Maiolino et al. 2017; Gallagher et al. 2019; Zhuang et al. 2021).
(Ultra)luminous infrared galaxies [(U)LIRGs; Sanders & Mirabel 1996] provide an ideal laboratory to test the AGN feedback paradigm. They also serve as excellent local analogs of high-redshift () submillimeter galaxies (e.g., Rujopakarn et al. 2011; Bellocchi et al. 2022). The aftermath of gas-rich, major mergers, (U)LIRGs derive their power mostly from starburst activity, with an admixture of contribution from a dust-enshrouded AGN (e.g., Genzel et al. 1998; Shangguan et al. 2019). In the merger-driven evolutionary scenario of galaxies (e.g., Hopkins et al. 2006, 2008), gas funneled to the center of the merger remnant fuels a central starburst and obscured black hole growth, until energy feedback clears enough gas and dust to reveal an optically visible quasar (Sanders et al., 1988a, b), and ultimately a quiescent elliptical galaxy (Kormendy & Sanders, 1992; Di Matteo et al., 2005). In view of the complex internal substructure and severe extinction of (U)LIRGs, infrared (IR) observations, especially when spatially resolved, afford the best opportunity to diagnose the physical nature of these complicated environments. As reviewed by Armus et al. (2020), previous studies of IR-luminous galaxies, both near and far, have relied heavily on the Spitzer Space Telescope (Werner et al., 2004). With over one order of magnitude improvement in sensitivity and spatial and spectral resolution compared to Spitzer, the James Webb Space Telescope (JWST; Rigby et al. 2023) presents an unprecedented opportunity to promote our understanding of the evolutionary processes of galaxies. The Medium Resolution Spectrograph (MRS; Wells et al. 2015) on the Mid-Infrared Instrument (MIRI; Rieke et al. 2015) is especially promising, given its sensitivity of mJy, full-width at half maximum (FWHM) angular resolution , and spectral resolution over the wavelength range (Glasse et al. 2015; Labiano et al. 2021).
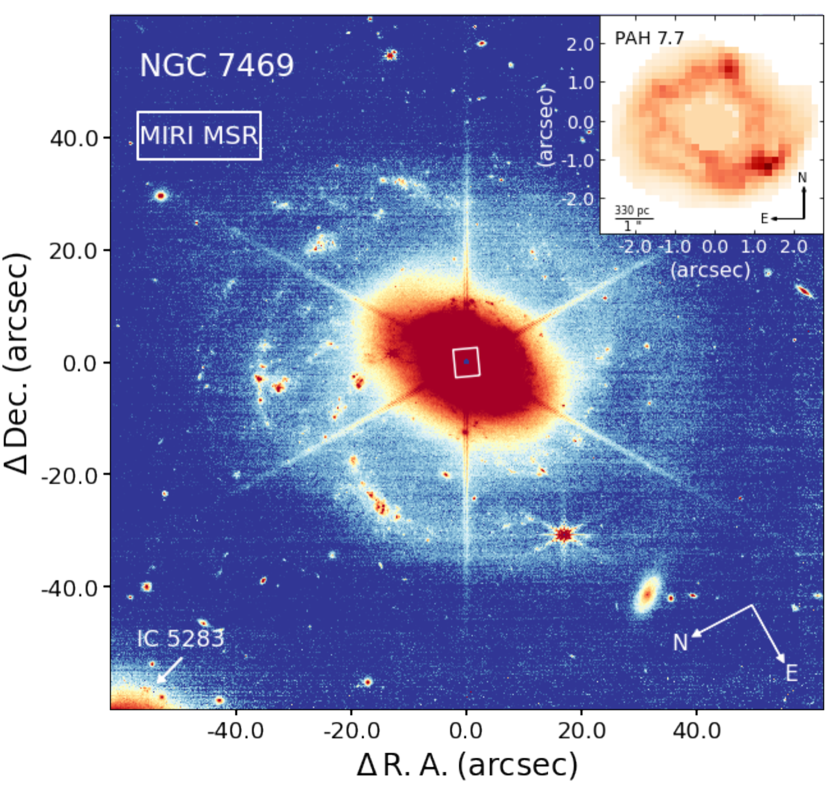
At a luminosity distance111We adopt a redshift of 0.01627 (Springob et al., 2005) and a concordance cosmology with km s-1 Mpc-1, , and (Hinshaw et al., 2013). of 70.6 Mpc, the SBa spiral galaxy NGC 7469, one of the six sources originally observed by Seyfert (1943), hosts a type 1 (broad-line) AGN with a black hole mass of estimated from reverberation mapping of the H line (Peterson et al., 2014; Lu et al., 2021) and an X-ray (2–10 keV) luminosity of (Ricci et al., 2017). Included in the Great Observatories All-Sky LIRG Survey (GOALS), NGC 7469 has an IR luminosity of (Armus et al., 2009) powered by both its AGN (Inami et al. 2013; Stierwalt et al. 2014) and substantial additional star formation activity (; Pérez-Torres et al. 2009; Pereira-Santaella et al. 2011; Mehdipour et al. 2018), which is concentrated in a nuclear region with radius pc (Davies et al., 2007) and a circumnuclear starburst ring of radius pc (Wilson et al. 1991; Miles et al. 1994; Díaz-Santos et al. 2007; Song et al. 2021). VLBI observations at 18 cm resolve the nuclear radio emission into several compact sources aligned on an east-west direction of linear extent pc (Lonsdale et al., 2003), which seem to emanate from a disk-like dust structure resolved at 12.5 (Soifer et al., 2003). After properly excluding the host galaxy contribution to the optical light, NGC 7469 qualifies as a radio-loud AGN (Ho & Peng, 2001) by the criterion of Kellermann et al. (1989). At infrared and millimeter wavelengths, complex ridges connect the nucleus and the circumnuclear ring (Genzel et al., 1995; Davies et al., 2004; Izumi et al., 2020), including a possible nuclear bar-like structure (Mazzarella et al., 1994). Optical integral-field spectroscopy also show ionized outflows on kpc scales, possibly driven by the coupled effects of star formation and AGN feedback (Müller-Sánchez et al., 2011; Robleto-Orús et al., 2021; Xu & Wang, 2022).
The primary goal of this study is to ascertain whether and the manner in which AGN feedback influences the circumnuclear star formation of this well-studied, nearby LIRG, in light of the powerful type 1 AGN it hosts. We take advantage of a recently available set of JWST observations taken with MIRI/MRS to investigate the central region of NGC 7469 on a physical scale of pc. The new observations significantly extend previous mid-IR studies based on ground-based facilities (e.g., Alonso-Herrero et al. 2014; Esquej et al. 2014; Jensen et al. 2017).
2 Observations and Data Analysis
NGC 7469 was included in the GOALS-JWST (ID 1328; co-PIs: L. Armus and A. Evans) Early Release Science program (Lai et al., 2022; U et al., 2022; Armus et al., 2023). The MIRI/MRS observations were carried out using a set of four integral-field units (channels 1 to 4) that span with three grating settings (short, medium, and long sub-bands). The science exposure time was 444 s, using 40 groups per integration for each sub-band. A four-point dither pattern covers the extended star-forming ring (Figure 1), and additional dedicated background observations were obtained with the same observational configurations. The MAST Portal222https://mast.stsci.edu/portal/Mashup/Clients/Mast/Portal.html provides four-channel 3D data cubes produced by the standard three-stage JWST pipeline, which consists of the Detector1, Spec2, and Spec3 processes. The Detector1 process applies detector-level corrections with the raw, non-destructive read ramps as input and the uncalibrated slope images (rate files) as output. The Spec2 step then processes the rate files for other 2D detector-level calibrations, such as WCS assignment, flat-field correction, fringe removal, and wavelength and flux calibration. Finally, Spec3 processes the resulting calibrated slope images to combined 3D spectral data after background subtraction and cube creation. However, residual fringes remain after standard fringe removal (Argyriou et al., 2020): these can strongly contaminate the spectral features, especially in the nuclear region. To correct the residual fringing, we begin with the MRS level 2 calibrated data (calibrated slope images), perform master background subtraction following the standard Spec3 pipeline (Bushouse et al. 2022), and lastly apply an extra step333https://jwst-pipeline.readthedocs.io/en/latest/jwst/residual_fringe/main.html not implemented in the standard JWST pipeline to correct the low-frequency fringe residuals. The final four-channel 3D data cubes used in this paper are based on the 2D spectral images with the fringe residuals corrected.
Zhang et al. (2021, 2022) developed an optimal strategy to extract spatially resolved diagnostic features from mapping-mode observations taken with the Infrared Spectrograph (IRS; Houck et al. 2004) on Spitzer. We adopt the same methodology to analyze the JWST data, showcasing the extraordinary capability of MIRI/MRS observations in studying the interaction between AGN and star formation activity in relatively nearby, well-resolved galaxy environments.
To extract spatially resolved diagnostics on a common physical scale, a key initial step in to ensure that all the slices within the MIRI/MRS data cubes have the same angular resolution. To this end, we begin by convolving all the slices within the first three (1, 2, and 3) channels of the 3D data cubes into a common angular resolution of , which is the largest FWHM of the slices within the three channels (Appendix A). We focus on the first three channels (), which have the highest angular resolution while at the same time cover all the necessary emission features used in this study. Based on the measured FWHMs, we use the Gaussian2D function in astropy.modeling.models (Astropy Collaboration et al. 2013) to mimic the point-spread function (PSF) of each slice, and we apply the create_matching_kernel function in photutils (Bradley et al. 2019) to construct the convolution kernels. The convolution was performed using the convolve_fft function in astropy.convolution.
After convolution, we reproject all the data cubes into the same coordinate frame with a pixel size of 035, half of the angular resolution. This allows us to extract 120 spatially resolved spectra from the central region of NGC 7469, in bins of pixels (). Note that each bin share a region with its most adjacent bins, and the pixel values of the colored maps as shown later are obtained by averaging the measurements of the spatially resolved bins that cover the corresponding pixel unless specifically noted. Additionally, to mitigate against possible systematics in the convolution process due to our simplified treatment of the PSF, the extracted spectra of the first two channels, which have higher initial resolutions and hence would suffer more from this potential source of systematics, are stitched to the extracted spectra of channel 3. Specifically, each channel 2 spectrum is first stitched to the corresponding channel 3 spectrum based on the overlapping portion of the two, and then the same procedure is repeated for each channel 1 spectrum with respect to the stitched channel 2 spectrum. The mean and standard deviation of the scaling factor is for channel 1 and for channel 2, which is taken into consideration in the final uncertainty of the flux measurements.
The MIRI/MRS spectra contain abundant ionic fine-structure lines and molecular hydrogen rotational lines, whose line widths are well resolved under the spectral resolution of these observations. The relative strengths and broadening of these mid-IR lines provide valuable diagnostics of the physical conditions of the gas. This paper focuses on the six hydrogen lines [Pf and H2(0-0) (1) to H2(0-0) (5)] and four ionic lines ([Fe II] 5.340 , [Ne II] 12.814 , [Ne III] 15.555 , and [Ne V] 14.322 ) shown in Figure 2a and summarized in Tables 1–3. Most of the lines can be well fit with a single Gaussian function plus a local, linear continuum, except for the high-ionization lines of [Ne III] and [Ne V], which require two Gaussians. We use the IR extinction curve of Smith et al. (2007), as explained below, for extinction correction of the final flux measurement of all the emission lines.
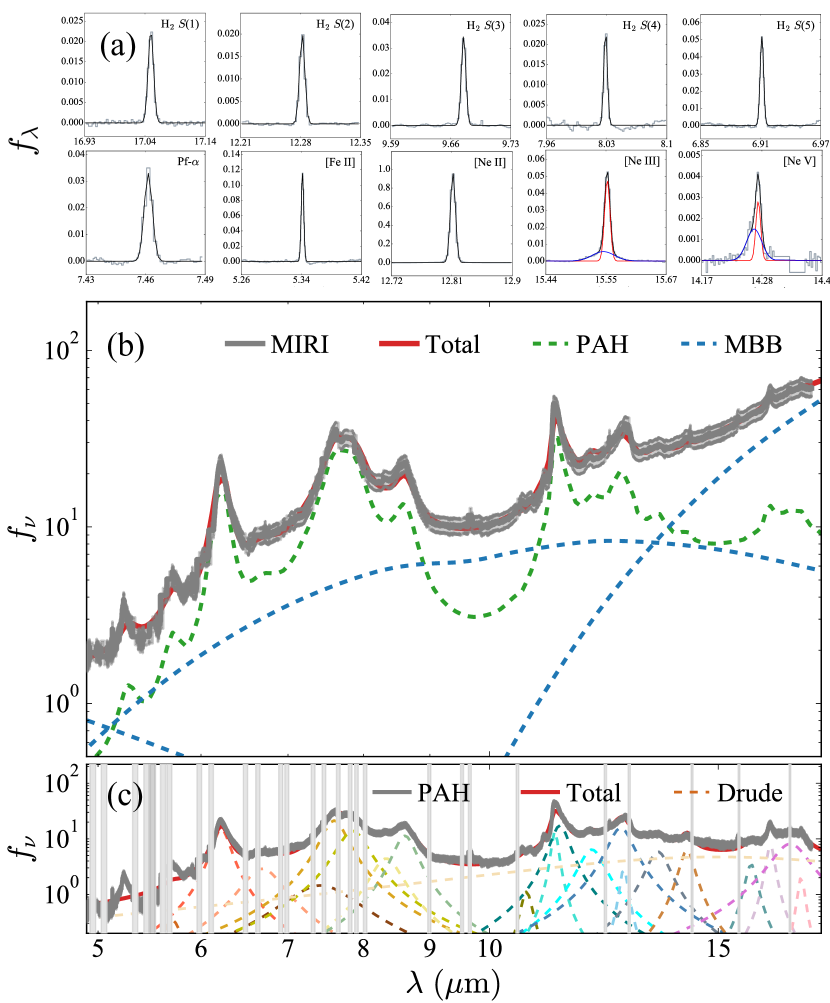
Apart from the above mid-IR emission lines, the broad features from polycyclic aromatic hydrocarbons (PAHs; see reviews by Tielens 2008 and Li 2020) provide valuable diagnostics of galaxy properties, such as SFR (Shipley et al. 2016; Maragkoudakis et al. 2018; Xie & Ho 2019; Whitcomb et al. 2023; Zhang & Ho 2023b), molecular gas content (Cortzen et al. 2019; Gao et al. 2019; Chown et al. 2021; Leroy et al. 2023; Zhang & Ho 2023a), and AGN activity (Smith et al. 2007; O’Dowd et al. 2009; Diamond-Stanic & Rieke 2010; Sales et al. 2010; Zhang et al. 2022). We measure the strengths of the PAH features using the template-fitting method of Xie et al. (2018), which was originally devised to treat Spitzer IRS spectra and then further extended by Zhang et al. (2021, 2022) to enable spatially resolved analysis of mapping-mode IRS observations. The template-fitting technique can be applied to MIRI/MRS spectra, as illustrated in Figure 2b. After masking out the prominent narrow emission lines, the spectrum is fit with a multi-component model consisting of a theoretical PAH template and three modified blackbodies of different temperatures to represent the continuum. All components are subject to attenuation by foreground dust extinction using the IR extinction curve proposed by Smith et al. (2007, their Equation 4), which is described by a power law plus silicate features peaking at 9.7 and 18 . The extinction curve is scaled by , the total extinction at 9.7 (see Table 4). An additional stellar component for the starlight continuum can also be included in the fit if the near-IR region is well constrained (e.g., Zhang & Ho 2023b), but we omit it here because the contribution of evolved stars to the mid-IR is expected to be small for (U)LIRGs (Paspaliaris et al., 2021). We measure the integrated PAH luminosity, , as the integral of the best-fit PAH template over the region . The strengths of the most prominent individual PAH features (at 6.2 , 7.7 , and 11.3 ; Table 4) are measured from the continuum-subtracted (Figure 2c), residual PAH spectrum using a series of Drude profiles (Draine & Li, 2007). The fits are carried out with the Bayesian Markov Chain Monte Carlo procedure emcee (see Shangguan et al. 2018 for details), with the median and standard deviation of the posterior distribution of each best-fit parameter taken as the final estimate and its corresponding measurement uncertainty.
3 Spatially Resolved Analysis
3.1 Star Formation Activity
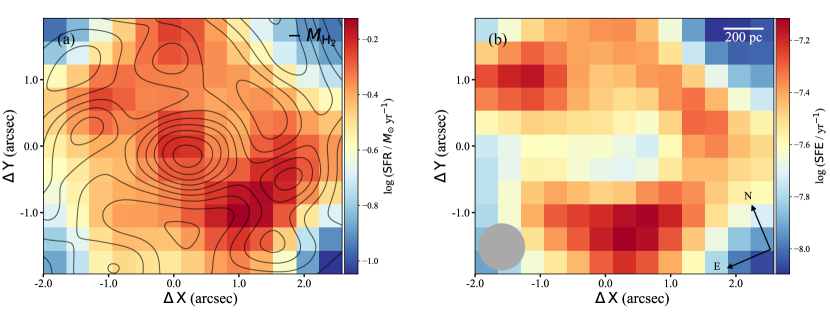
Figure 3 summarizes the star formation properties of the circumnuclear region of NGC 7469. We calculate the SFR using the mid-IR fine-structure lines of neon following the prescription of Zhuang et al. (2019), who modified the empirical SFR estimator of Ho & Keto (2007) for star-forming environments by explicitly accounting for the contribution of the AGN to the low-ionization lines. Their photoionization models demonstrate that for a wide range of empirically motivated ionizing spectral energy distributions, the narrow-line region, under conditions of high ionization parameter similar to those of Seyfert galaxies (e.g., Ho et al. 1993), produces a restricted range of [Ne II][Ne III]/[Ne V] ratio. Under these circumstances, the observed strength of [Ne V], if detected as listed in Table 1, can be used to remove the contribution of the AGN to [Ne II][Ne III], and the SFR can be estimated given a neon abundance.
Assuming that the central region of NGC 7469 has solar abundances (e.g., Alonso-Herrero et al. 2006; Cazzoli et al. 2020), over the central region mapped by MRS we obtain an integrated , where the error bars account for a realistic estimate of the systematic uncertainty of the neon-based method ( dex; Zhuang et al. 2019). It is difficult to directly compare our measurement with those of previous studies because of differences in apertures and areas mapped. Nevertheless, our measurement is qualitatively consistent with the estimated for the circumnuclear ring () from radio continuum emission (Song et al., 2021) and measured over 11 132 pc-radius circular apertures using the hydrogen recombination line Pf 7.46 (Lai et al., 2022). The distribution of SFR shows a central peak, which accounts for only of the total SFR captured in the mapped region, and an inhomogeneous ring-like structure with several hotspots that are concentrated largely toward the northeast and southwest directions (Figure 3a), reminiscent of the morphology seen in the radio (6 cm; Wilson et al. 1991) and mid-IR (11.7 ; Miles et al. 1994) bands. A map of Pf (not shown here), which reflects, at least in part, the distribution of star formation, exhibits a similar structure.
We overlay on the SFR map the distribution of cold molecular hydrogen gas mass derived from the CO(1–0) observations of ALMA Project 2017.1.00078.S (PI: T. Izumi; Izumi et al. 2020). After extracting the moment 0, 1, and 2 maps from the data cube retrieved from the ALMA archive444https://almascience.nao.ac.jp using the Common Astronomy Software Applications (CASA Team et al., 2022), which have an initial resolution of , we convolve moment 0 (CO intensity) map to the same angular resolution as the processed MIRI data cubes (). Following Izumi et al. (2020), we adopt a canonical CO-to-H2 conversion factor of to calculate ; this value should be multiplied by a factor of 1.36 to include helium to obtain the total molecular gas (Bolatto et al., 2013), but throughout we adopt the convention of only considering molecular hydrogen. Over the mapped region we obtain an integrated . The distribution of H2 gas roughly traces the SFR map. Nevertheless, perhaps not unexpected on these physical scales (e.g., Feldmann et al. 2011; Kruijssen & Longmore 2014; Pessa et al. 2021), the molecular gas clumps along the circumnuclear ring are not spatially coincident with the star-forming hotspots. Intriguingly, molecular gas is piled up toward the nuclear region (within the central ), in contrast to the distribution of SFR, which is most prominent in the hotspots on the ring.
The mismatch between the gas and young stars is best seen in the distribution of the star formation efficiency, , which presents a minimum at the position of the nucleus, as well as in a gap at in the eastern portion of the ring (Figure 3b), while the sites of most efficient conversion of gas to stars occur in two concentrations on the circumnuclear ring. The two sites of efficient star formation approximately coincide with the ends of the two spiraling gas arms visible in CO (Izumi et al., 2020). As observed in other galaxies with prominent bar structures (e.g., Kenney et al. 1992; Hsieh et al. 2011), the bar potential of NGC 7469 likely facilitates the inner transport of gas, which accumulates in a circumnuclear ring with notable pile-ups in two opposite locations on the ring. The entire circumnuclear region of NGC 7469 is currently forming stars robustly, with an efficiency that qualifies it as a starburst. The average gas depletion time along the ring is , with values as low as in the hotspots. Even the nucleus and the eastern gap region have gas depletion times of , which are still significantly shorter than that of star-forming main sequence galaxies (; Bigiel et al. 2011).
3.2 Stability of the Molecular Gas
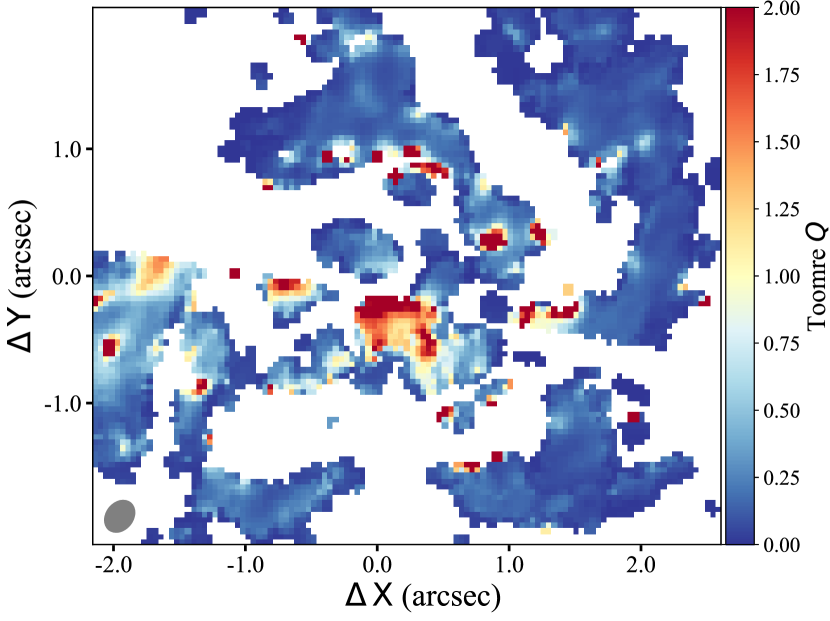
To evaluate the stability of the gas, we evaluate Toomre’s (1964) parameter based on the original CO maps prior to convolution (beam size ; pixel scale ), with the gravitational constant, the mass surface density of H2, the gas velocity dispersion derived from the CO(1–0) emission line, and the epicyclic frequency , with (Leroy et al. 2008). For simplicity, we assume a flat rotation curve (). The gas velocity at radius , , is calculated from the line-of-sight velocity of the CO(1–0) line according to , assuming expansion velocity . The azimuthal angle . Pixels with are masked to avoid unphysical values of the approximated , and we set the inclination angle and the position angle (Nguyen et al., 2021). We do not consider the beam-smearing effect on the velocity dispersion field in light of the small beam size and pixel scale of the CO maps. Beam-smearing effects are usually considered for data cubes of worse resolution (e.g., kpc; Di Teodoro & Fraternali 2015; Leung et al. 2018; Levy et al. 2018). Figure 4 illustrates that, except for a few pixels to the southeast of the nucleus, which roughly correspond to the nuclear minimum SFE region at , has values less than 1 throughout most of the central region of NGC 7469, in agreement with its starburst nature.
3.3 Evidence of Gas Heating by the AGN
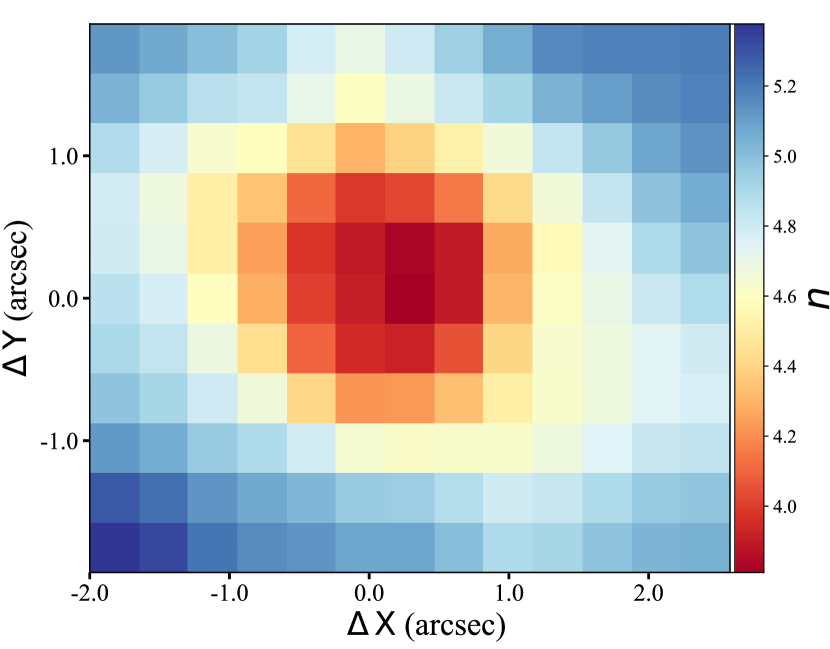
The relative intensities of the rotational lines of H2 in the electronic ground state provide a powerful diagnostic of the excitation temperature of the warm molecular medium (Rosenthal et al., 2000; Rigopoulou et al., 2002; Roussel et al., 2007). Assuming a continuous power-law distribution of temperature and optically thin conditions, the flux of the H2 lines at rotational energy level is related to the column density , with the degeneracy value, the energy of level , the Boltzman’s constant, and the partition function at temperature (Togi & Smith, 2016; Appleton et al., 2017). The power-law index parameterizes the distribution of gas temperature from to , such that smaller values of value correspond to larger hot gas fraction. Following Togi & Smith (2016), we set K and fit for , which is found to range from to 300 K. The distribution of obtained for the central region of NGC 7469 (Figure 5) agrees well within the values of derived by Pereira-Santaella et al. (2014) for six local IR-bright Seyfert galaxies, and it falls within the range of derived for ULIRGs (Zakamska, 2010). Meanwhile, the values of in NGC 7469 are on average smaller—indicating higher hot gas fraction—than the mean of measured by Togi & Smith (2016) for nearby star-forming galaxies and low-luminosity AGNs. Most notably, values of in the circumnuclear region of NGC 7469 gradually but systematically drops toward the nucleus, indicating a central rise in molecular gas temperature. By contrast, the circumnuclear ring is characterized by uniformly lower temperatures. These results suggest that the active nucleus drives some mechanism of gas heating in the central region, which may be the culprit for the depressed SFE in the center.
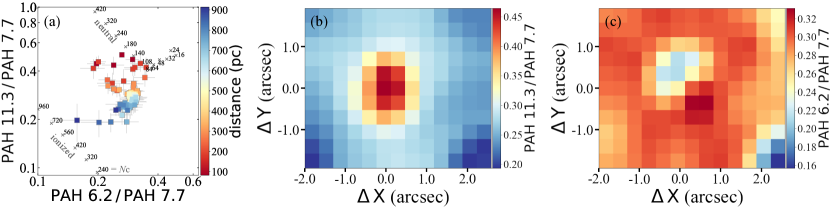
To further buttress our contention that AGN activity alters the conditions of the gas in the immediate vicinity of the nucleus, we turn to the detailed spectrum of the PAH features, which in AGNs exhibits on average smaller PAH 6.2 /7.7 and larger PAH 11.3 /7.7 band ratios compared to star-forming regions as a consequence of radiative processes and shocks (Zhang et al., 2022). As shown in Figure 6 (panels a and b), the resolved bins closest to the nucleus all exhibit PAH 11.3 /7.7 band ratios larger than 0.3, which are distinctly offset from the locus of points at larger radii. García-Bernete et al. (2022), using JWST/MRS to study PAH emission in Seyfert galaxies, including NGC 7469, obtained similar results. Such high values of PAH 11.3 /7.7 are typical of AGNs (Zhang et al., 2022). The wide range of PAH 6.2 /7.7 band ratios reflects the coupled effects of AGN and starburst activity, with the nuclear bins characterized by smaller values typical of AGNs (panel c).
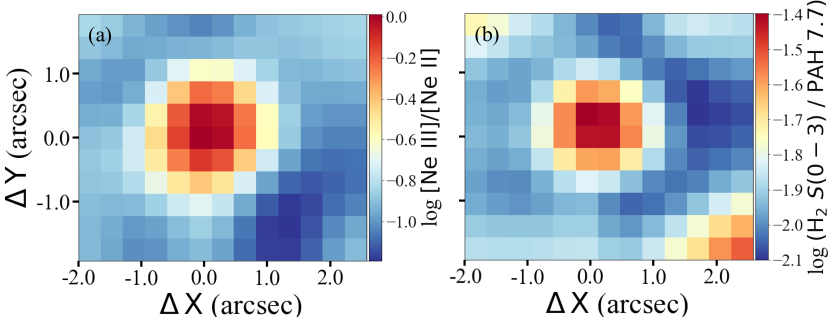
Apart from having distinctive PAH band ratios, the nuclear bins have elevated [Ne III]/[Ne II] (Figure 7a), an indicator of the hardness of the radiation field (Thornley et al., 2000) and H/PAH 7.7 (Figure 7b), which is sensitive to shocks (Roussel et al., 2007). is the summation of to , which is converted from the summation of to by dividing by a factor of 0.9, following Lai et al. (2022) based on the results of Habart et al. (2011). We note, however, that although the nucleus in general has elevated compared to the circumnuclear ring, nevertheless most of the values do not exceed the theoretical threshold that can be generated by photo-dissociation regions [; Guillard et al. 2012; Stierwalt et al. 2014]. Hence, despite the evidence for outflows, as discussed below, the mid-IR line ratios themselves do not point to a dominant role played by shocks in gas heating in the nuclear region.
For completeness, we note that three bins located outside the circumnuclear ring at stand out for having exceptionally low values of PAH 11.3 /7.7 and PAH 6.2 /7.7 and yet high . Such line ratios are indicative of mechanical processes like shocks, but their connection to the AGN is unclear.
3.4 Evidence of an Ionized Gas Outflow from the AGN
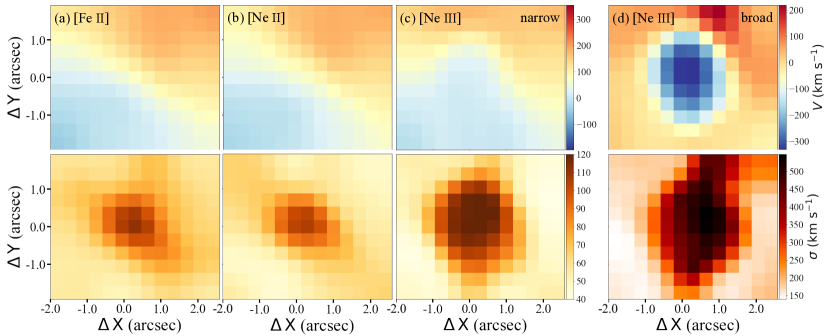
In addition to the heating effect deduced from the analysis of the rotational H2 spectrum (Section 3.3), AGN activity can also impact the host galaxy by expelling gas through a wind or outflow. To check whether the central starburst activity of NGC 7469 is influenced by mechanical processes, we examine the velocity field of the central region of the galaxy using the strongest of the well-isolated ionic emission lines (Figure 8). The two low-ionization lines of [Fe II] and [Ne II] have rather regular kinematics, showing a velocity field dominated by large-scale rotation with a projected amplitude of approximately (panels a and b). The velocity dispersions, after correcting for instrumental broadening according to the line-spread function of Labiano et al. (2021), are centrally peaked and slightly extended along the minor axis of the galaxy (at position angle ). The region with spatially extended velocity dispersion roughly corresponds to the nuclear bar-like structure of NGC 7469, which is visible on a similar physical scale in near-IR and CO emission (Mazzarella et al., 1994; Izumi et al., 2020).
By contrast, the higher ionization line of [Ne III] behaves markedly differently. As previously noted (Figure 2), [Ne III] can be decomposed into a narrow and a broad component. While the velocity field for the narrow component of [Ne III] generally follows that of the low-ionization lines, the velocities near the nuclear region are severely distorted, and the velocity dispersions reach values as large as over an extended region of along (panel c). Most intriguingly, over roughly the same spatial extend of , we detect in the broad component of [Ne III] prominent blueshifts of up to (panel d), adjacent to which toward the northwest is a minor component redshifted by . The redshifted component might be the backside of a bipolar outflow, which has lower intensity because of dust extinction. Very large velocity dispersions, in excess of , appear throughout the central region, but with a preference along . These characteristics of the [Ne III] line strongly suggest a sub-kpc ionic gas outflow.
4 Summary
Using integral-field unit observations taken by MIRI/MRS on JWST, we study the interaction between AGN and starburst activity within the central region of the Seyfert 1 galaxy NGC 7469 on a scale of pc. The distribution of SFR derived from the mid-IR fine-structure lines of [Ne II] and [Ne III] delineate two zones of star formation activity, one centered on the nucleus and the other confined to a circumnuclear ring. We take advantage of ALMA CO(1–0) observations to obtain the distribution of cold molecular hydrogen gas, which, when combined with the SFR, translates into a map of the SFE. The MIRI/MRS bandpass covers powerful diagnostics from the rotational H2 lines and PAH features, and the spectral resolution yields new insights from the kinematics of the ionic lines of low and high ionization.
The main results can be summarized as follows:
-
1.
The central region of NGC 7469 experiences intense starburst activity, which is confined largely to a clumpy circumnuclear ring but also manifests itself, albeit to a lower degree, toward the nucleus.
-
2.
The active nucleus drives an ionized gas outflow on sub-kpc scales, detectable in the broad component of the [Ne III] line as emission with blueshifts of up to and redshifts of , as well as velocity dispersions that reach .
-
3.
The active nucleus significantly influences the properties of the molecular gas in its immediate surroundings, by sharply raising the gas temperature as inferred from the rotational H2 lines and by selectively destroying small dust grains as evidenced by the PAH band ratios. While shocks may be present, radiative heating appears to dominate.
Despite the observable manifestations of NGC 7469’s highly accreting supermassive black hole, AGN feedback overall has a negligible impact on the cold circumnuclear medium or its ability to form stars. A formal analysis of the stability of the molecular gas demonstrates that Toomre’s parameter is largely less than 1 throughout the circumnuclear region. The circumnuclear ring of the galaxy remains a healthy starburst, and even the very nuclear region itself forms stars with substantial efficiency. These conclusions echo similar findings reported in other studies of nearby AGNs (e.g., Xie et al. 2021; Zhuang et al. 2021; Molina et al. 2022, 2023; Zhuang & Ho 2022).
| Region | Coordinate | log | log | log | log | log | log | log |
|---|---|---|---|---|---|---|---|---|
| (pixel) | () | () | () | () | () | () | () | |
| (1) | (2) | (3) | (4) | (5) | (6) | (7) | (8) | (9) |
| NGC7469_bin_1 | (0.5, 0.5) | 14.836 0.045 | 14.355 0.039 | 13.162 0.039 | 13.203 0.039 | 13.403 0.039 | 0.330 0.043 | 8.007 0.018 |
| NGC7469_bin_2 | (0.5, 0.5) | 14.697 0.033 | 14.354 0.031 | 13.148 0.031 | 13.133 0.031 | 13.354 0.032 | 0.359 0.034 | 7.939 0.021 |
| NGC7469_bin_3 | (0.5, 0.5) | 14.710 0.043 | 14.274 0.024 | 13.098 0.024 | 13.087 0.023 | 13.301 0.025 | 0.405 0.026 | 8.092 0.015 |
| NGC7469_bin_4 | (0.5, 0.5) | 14.588 0.022 | 14.268 0.006 | 13.074 0.006 | 13.014 0.006 | 13.260 0.009 | 0.450 0.007 | 8.022 0.017 |
| NGC7469_bin_5 | (1.5, 0.5) | 14.994 0.057 | 14.482 0.056 | 13.296 0.057 | 13.587 0.056 | 13.826 0.057 | 0.181 0.054 | 7.855 0.025 |
| NGC7469_bin_6 | (1.5, 0.5) | 14.958 0.050 | 14.486 0.049 | 13.274 0.049 | 13.532 0.049 | 13.775 0.050 | 0.207 0.047 | 7.815 0.028 |
| NGC7469_bin_7 | (0.5, 1.5) | 14.943 0.039 | 14.406 0.037 | 13.252 0.039 | 13.503 0.035 | 13.725 0.036 | 0.225 0.037 | 7.879 0.024 |
| NGC7469_bin_8 | (0.5, 1.5) | 14.843 0.045 | 14.433 0.043 | 13.231 0.043 | 13.324 0.043 | 13.591 0.043 | 0.275 0.043 | 7.737 0.033 |
| NGC7469_bin_9 | (0.5, 1.5) | 14.918 0.036 | 14.348 0.035 | 13.196 0.037 | 13.420 0.034 | 13.636 0.035 | 0.282 0.035 | 7.965 0.019 |
| NGC7469_bin_10 | (0.5, 1.5) | 14.789 0.032 | 14.379 0.028 | 13.194 0.029 | 13.231 0.028 | 13.517 0.028 | 0.326 0.028 | 7.813 0.028 |
Note. — Col. (1): The resolved pixel () bins, ordered according to their radial distance from the peak of the nuclear SFR (the origin of the coordinates in Figure 3: , ). Col. (2): Offset of the bin center relative to the origin of the coordinates, in units of the pixel scale of 035. Cols. (3)–(7): Extinction-corrected flux of the emission lines Pf, [Fe II] 5.340 , [Ne II] 12.814 , [Ne III] 15.555 , and [Ne V] 14.322 ; the uncertainty is the quadrature sum of the measurement uncertainty from MCMC fitting and the systematic uncertainty from the scaling of each spectrum. Col. (8): The SFR based on the three neon lines. Col. (9): The molecular hydrogen mass, derived from CO(1–0) emission assuming a CO-to-H2 conversion factor of . (This table is available in its entirety in machine-readable form.)
| Region | log | log | log | log | log | |
|---|---|---|---|---|---|---|
| () | () | () | () | () | ||
| (1) | (2) | (3) | (4) | (5) | (6) | (7) |
| NGC7469_bin_1 | 14.401 0.048 | 14.691 0.040 | 14.423 0.039 | 14.528 0.039 | 14.191 0.039 | 3.915 0.776 |
| NGC7469_bin_2 | 14.302 0.037 | 14.622 0.033 | 14.328 0.032 | 14.431 0.031 | 14.111 0.031 | 3.942 0.767 |
| NGC7469_bin_3 | 14.318 0.045 | 14.670 0.029 | 14.319 0.025 | 14.408 0.025 | 14.076 0.023 | 3.870 0.784 |
| NGC7469_bin_4 | 14.209 0.025 | 14.598 0.015 | 14.216 0.008 | 14.313 0.008 | 14.000 0.005 | 3.917 0.782 |
| NGC7469_bin_5 | 14.701 0.057 | 14.759 0.056 | 14.572 0.056 | 14.773 0.056 | 14.463 0.056 | 4.130 0.998 |
| NGC7469_bin_6 | 14.674 0.049 | 14.713 0.049 | 14.507 0.049 | 14.696 0.049 | 14.387 0.049 | 4.044 1.030 |
| NGC7469_bin_7 | 14.603 0.078 | 14.811 0.038 | 14.585 0.037 | 14.761 0.037 | 14.443 0.036 | 3.987 0.705 |
| NGC7469_bin_8 | 14.437 0.048 | 14.660 0.043 | 14.362 0.043 | 14.521 0.043 | 14.224 0.043 | 3.815 0.671 |
| NGC7469_bin_9 | 14.492 0.050 | 14.793 0.038 | 14.524 0.035 | 14.671 0.035 | 14.354 0.034 | 4.013 0.704 |
| NGC7469_bin_10 | 14.305 0.036 | 14.625 0.029 | 14.275 0.028 | 14.426 0.028 | 14.142 0.027 | 3.931 0.647 |
Note. — Col. (1): The resolved pixel () bins, ordered according to their radial distance from the peak of the nuclear SFR (the origin of coordinates in Figure 3: , ). Cols. (2)–(6): Extinction-corrected flux of the molecular hydrogen rotational lines of H2 to H2 ; the uncertainty is the quadrature sum of the measurement uncertainty from MCMC fitting and the systematic uncertainty from the scaling of each spectrum. Col. (7): The power-law index derived from the five H2 rotational lines, assuming that the H2 rotational level populations are distributed as continuous-temperature components with . (This table is available in its entirety in machine-readable form.)
| Region | ||||||||
|---|---|---|---|---|---|---|---|---|
| () | () | () | () | () | () | () | () | |
| (1) | (2) | (3) | (4) | (5) | (6) | (7) | (8) | (9) |
| NGC7469_bin_1 | 29 2 | 96 2 | 2 3 | 98 2 | 10 1 | 119 1 | 303 10 | 415 10 |
| NGC7469_bin_2 | 66 1 | 103 1 | 30 1 | 103 1 | 17 1 | 119 1 | 326 9 | 418 9 |
| NGC7469_bin_3 | 47 2 | 109 1 | 16 2 | 104 2 | 14 1 | 120 1 | 332 8 | 464 8 |
| NGC7469_bin_4 | 85 1 | 113 1 | 40 1 | 108 1 | 19 1 | 121 1 | 351 8 | 485 7 |
| NGC7469_bin_5 | 18 2 | 78 2 | 16 3 | 78 3 | 12 1 | 111 1 | 191 11 | 314 11 |
| NGC7469_bin_6 | 51 1 | 86 1 | 16 1 | 85 1 | 21 1 | 113 1 | 239 11 | 330 11 |
| NGC7469_bin_7 | 2 2 | 74 3 | 33 5 | 73 4 | 6 1 | 112 1 | 258 7 | 408 10 |
| NGC7469_bin_8 | 104 1 | 95 1 | 59 2 | 92 2 | 27 1 | 117 1 | 314 9 | 438 9 |
| NGC7469_bin_9 | 14 3 | 86 3 | 19 4 | 81 3 | 12 1 | 113 1 | 295 8 | 420 6 |
| NGC7469_bin_10 | 124 1 | 104 1 | 73 2 | 100 2 | 31 1 | 120 1 | 326 7 | 477 7 |
Note. — Col. (1): The resolved pixel () bins, ordered according to their radial distance from the peak of the nuclear SFR (the origin of coordinates in Figure 3: , ). Cols. (2)–(9): The velocity and velocity dispersion of [Fe II] 5.340 , [Ne II] 12.814 , and the narrow and broad components of [Ne III] 15.555 ; the uncertainty only accounts for the standard deviation from MCMC fitting. The velocity dispersions have been corrected for instrumental broadening. (This table is available in its entirety in machine-readable form.)
| Region | log | log | log | log | log |
|---|---|---|---|---|---|
| () | () | () | () | ||
| (1) | (2) | (3) | (4) | (5) | (6) |
| NGC7469_bin_1 | 11.620 0.041 | 12.745 0.039 | 12.125 0.039 | 12.486 0.039 | 1.236 0.098 |
| NGC7469_bin_2 | 11.651 0.036 | 12.872 0.031 | 12.165 0.032 | 12.517 0.032 | 6.552 2.324 |
| NGC7469_bin_3 | 11.574 0.029 | 12.635 0.024 | 12.110 0.024 | 12.435 0.024 | 0.752 0.032 |
| NGC7469_bin_4 | 11.615 0.022 | 12.757 0.008 | 12.178 0.010 | 12.475 0.010 | 5.584 2.594 |
| NGC7469_bin_5 | 11.642 0.056 | 12.737 0.056 | 12.167 0.056 | 12.627 0.056 | 0.647 0.022 |
| NGC7469_bin_6 | 11.651 0.049 | 12.786 0.049 | 12.158 0.049 | 12.632 0.049 | 6.606 2.566 |
| NGC7469_bin_7 | 11.597 0.036 | 12.637 0.035 | 12.123 0.036 | 12.499 0.035 | 0.790 0.031 |
| NGC7469_bin_8 | 11.664 0.045 | 12.884 0.043 | 12.161 0.043 | 12.543 0.043 | 6.771 2.265 |
| NGC7469_bin_9 | 11.560 0.035 | 12.574 0.034 | 12.088 0.034 | 12.438 0.034 | 0.513 0.021 |
| NGC7469_bin_10 | 11.670 0.031 | 12.895 0.028 | 12.198 0.028 | 12.538 0.028 | 1.026 0.074 |
Note. — Col. (1): The resolved pixel () bins, ordered according to their radial distance from the peak of the nuclear SFR (the origin of coordinates in Figure 3: , ). Cols. (2)–(5): Extinction-corrected flux of the integrated PAH emission from 5 to 20 , and the individual PAH features at 6.2 , 7.7 (7.414 , 7.598 , and 7.85 ), and 11.3 (11.23 and 11.33 ); the uncertainty is the quadrature sum of the measurement uncertainty from MCMC fitting and the systematic uncertainty from the scaling of each spectrum. Col. (6): Total extinction at 9.7 . (This table is available in its entirety in machine-readable form.)
Appendix A The PSF Models of the MIRI/MRS Observations
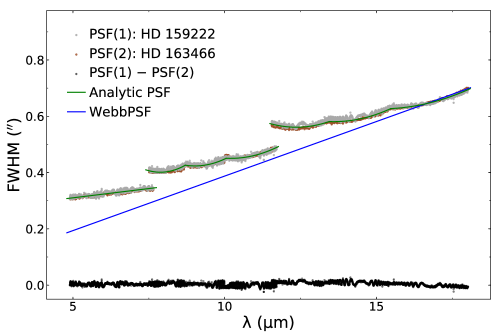
We retrieve MIRI/MRS observations of two stars (HD 159222 and HD 163466) to model the PSFs, which are needed for convolving the data cubes to the same angular resolution (Section 2). To obtain the FWHM of the PSF models as a function of slice number (wavelength), we fit each slice within the MIRI/MRS data cubes of the two stars with a two-dimensional Gaussian function. The two-dimensional Gaussian functions give only a first-order approximation of the PSFs of the MIRI/MRS data cubes; a more detailed investigation is warranted but beyond the scope of this Letter. Based on the two sets of PSF models (gray and brown dots in Figure A1), we provide an analytical function to describe the variation of FWHM with wavelength for each channel (green curves in Figure A1) by fitting the average FWHM of the two sets of PSF models with a linear or quadratic function. Table A1 summarizes the best-fit parameters of the fitted functions.
| Band | Wavelength Range () | |||||||
|---|---|---|---|---|---|---|---|---|
| Channels 1A–1C | ||||||||
| Channel 2A | ||||||||
| Channel 2B | ||||||||
| Channel 2C | ||||||||
| Channel 3A | ||||||||
| Channel 3B | ||||||||
| Channel 3C |
Note. — The coefficients for , with in units of arcseconds and in units of .
References
- Alonso-Herrero et al. (2014) Alonso-Herrero, A., Ramos Almeida, C., Esquej, P., et al. 2014, MNRAS, 443, 2766
- Alonso-Herrero et al. (2006) Alonso-Herrero, A., Rieke, G. H., Rieke, M. J., et al. 2006, ApJ, 650, 835
- Appleton et al. (2017) Appleton, P. N., Guillard, P., Togi, A., et al. 2017, ApJ, 836, 76
- Argyriou et al. (2020) Argyriou, I., Wells, M., Glasse, A., et al. 2020, A&A, 641, A150
- Armus et al. (2020) Armus, L., Charmandaris, V., & Soifer, B. T. 2020, Nature Astronomy, 4, 467
- Armus et al. (2023) Armus, L., Lai, T., U, V., et al. 2023, ApJ, 942, L37
- Armus et al. (2009) Armus, L., Mazzarella, J. M., Evans, A. S., et al. 2009, PASP, 121, 559
- Astropy Collaboration et al. (2013) Astropy Collaboration, Robitaille, T. P., Tollerud, E. J., et al. 2013, A&A, 558, A33
- Bellocchi et al. (2022) Bellocchi, E., Pereira-Santaella, M., Colina, L., et al. 2022, A&A, 664, A60
- Bigiel et al. (2011) Bigiel, F., Leroy, A. K., Walter, F., et al. 2011, ApJ, 730, L13
- Bolatto et al. (2013) Bolatto, A. D., Wolfire, M., & Leroy, A. K. 2013, ARA&A, 51, 207
- Bradley et al. (2019) Bradley, L., Sipocz, B., Robitaille, T., et al. 2019, astropy/photutils: v0.7.2 Zenodo, doi:10.5281/zenodo.3568287
- Bushouse et al. (2022) Bushouse, H., Eisenhamer, J., Dencheva, N., et al. 2022, spacetelescope/jwst: JWST v1.7.1, Zenodo, doi:10.5281/zenodo.7059013
- CASA Team et al. (2022) CASA Team, Bean, B., Bhatnagar, S., et al. 2022, PASP, 134, 114501
- Cazzoli et al. (2020) Cazzoli, S., Gil de Paz, A., Márquez, I., et al. 2020, MNRAS, 493, 3656
- Cheung et al. (2016) Cheung, E., Bundy, K., Cappellari, M., et al. 2016, Nature, 533, 504
- Chown et al. (2021) Chown, R., Li, C., Parker, L., et al. 2021, MNRAS, 500, 1261
- Cortzen et al. (2019) Cortzen, I., Garrett, J., Magdis, G., et al. 2019, MNRAS, 482, 1618
- Davé et al. (2019) Davé, R., Anglés-Alcázar, D., Narayanan, D., et al. 2019, MNRAS, 486, 2827
- Davé et al. (2020) Davé, R., Crain, R. A., Stevens, A. R. H., et al. 2020, MNRAS, 497, 146
- Davies et al. (2007) Davies, R. I., Müller Sánchez, F., Genzel, R., et al. 2007, ApJ, 671, 1388
- Davies et al. (2004) Davies, R. I., Tacconi, L. J., & Genzel, R. 2004, ApJ, 602, 148
- Diamond-Stanic & Rieke (2010) Diamond-Stanic, A. M., & Rieke, G. H. 2010, ApJ, 724, 140
- Díaz-Santos et al. (2007) Díaz-Santos, T., Alonso-Herrero, A., Colina, L., et al. 2007, ApJ, 661, 149
- Di Matteo et al. (2005) Di Matteo, T., Springel, V., & Hernquist, L. 2005, Nature, 433, 604
- Di Teodoro & Fraternali (2015) Di Teodoro, E. M., & Fraternali, F. 2015, MNRAS, 451, 3021
- Draine & Li (2007) Draine, B. T., & Li, A. 2007, ApJ, 657, 810
- Esquej et al. (2014) Esquej, P., Alonso-Herrero, A., González-Martín, O., et al. 2014, ApJ, 780, 86
- Fabian (2012) Fabian, A. C. 2012, ARA&A, 50, 455
- Feldmann et al. (2011) Feldmann, R., Gnedin, N. Y., & Kravtsov, A. V. 2011, ApJ, 732, 115
- Gallagher et al. (2019) Gallagher, R., Maiolino, R., Belfiore, F., et al. 2019, MNRAS, 485, 3409
- Gao et al. (2019) Gao, Y., Xiao, T., Li, C., et al. 2019, ApJ, 887, 172
- García-Bernete et al. (2022) García-Bernete, I., Rigopoulou, D., Alonso-Herrero, A., et al. 2022, A&A, 666, L5
- Genzel et al. (1998) Genzel, R., Lutz, D., Sturm, E., et al. 1998, ApJ, 498, 579
- Genzel et al. (1995) Genzel, R., Weitzel, L., Tacconi-Garman, L. E., et al. 1995, ApJ, 444, 129
- Glasse et al. (2015) Glasse, A., Rieke, G. H., Bauwens, E., et al. 2015, PASP, 127, 686
- Guillard et al. (2012) Guillard, P., Ogle, P. M., Emonts, B. H. C., et al. 2012, ApJ, 747, 95
- Habart et al. (2011) Habart, E., Abergel, A., Boulanger, F., et al. 2011, A&A, 527, A122
- Harrison (2017) Harrison, C. M. 2017, Nature Astronomy, 1, 0165
- Heckman (1980) Heckman, T. M. 1980, A&A, 87, 152
- Heckman & Best (2014) Heckman, T. M., & Best, P. N. 2014, ARA&A, 52, 589
- Hinshaw et al. (2013) Hinshaw, G., Larson, D., Komatsu, E., et al. 2013, ApJS, 208, 19
- Ho (2002) Ho, L. C. 2002, ApJ, 564, 120
- Ho (2008) Ho, L. C. 2008, ARA&A, 46, 475
- Ho (2009) Ho, L. C. 2009, ApJ, 699, 626
- Ho et al. (2003) Ho, L. C., Filippenko, A. V., & Sargent, W. L. W. 2003, ApJ, 583, 159
- Ho & Keto (2007) Ho, L. C., & Keto, E. 2007, ApJ, 658, 314
- Ho & Peng (2001) Ho, L. C., & Peng, C. Y. 2001, ApJ, 555, 650
- Ho et al. (1993) Ho, L. C., Shields, J. C., & Filippenko, A. V. 1993, ApJ, 410, 567
- Hopkins et al. (2006) Hopkins, P. F., Hernquist, L., Cox, T. J., et al. 2006, ApJS, 163, 1
- Hopkins et al. (2008) Hopkins, P. F., Hernquist, L., Cox, T. J., et al. 2008, ApJS, 175, 356
- Houck et al. (2004) Houck, J. R., Roellig, T. L., van Cleve, J., et al. 2004, ApJS, 154, 18
- Hsieh et al. (2011) Hsieh, P.-Y., Matsushita, S., Liu, Q., Ho, P. T. P., Oi, N., & Wu, Y.-L. 2011, ApJ, 736, 129
- Inami et al. (2013) Inami, H., Armus, L., Charmandaris, V., et al. 2013, ApJ, 777, 156
- Izumi et al. (2020) Izumi, T., Nguyen, D. D., Imanishi, M., et al. 2020, ApJ, 898, 75
- Jensen et al. (2017) Jensen, J. J., Hönig, S. F., Rakshit, S., et al. 2017, MNRAS, 470, 3071
- Kellermann et al. (1989) Kellermann, K. I., Sramek, R. A., Schmidt, M., Shaffer, D. B., & Green, R. F. 1989, AJ, 98, 1195
- Kenney et al. (1992) Kenney, J. D. P., Wilson, C. D., Scoville, N. Z., Devereux, N. A., & Young, J. S. 1992, ApJ, 395, L79
- Kormendy & Ho (2013) Kormendy, J., & Ho, L. C. 2013, ARA&A, 51, 511
- Kormendy & Sanders (1992) Kormendy, J., & Sanders, D. B. 1992, ApJ, 390, L53
- Kruijssen & Longmore (2014) Kruijssen, J. M. D., & Longmore, S. N. 2014, MNRAS, 439, 3239
- Labiano et al. (2021) Labiano, A., Argyriou, I., Álvarez-Márquez, J., et al. 2021, A&A, 656, A57
- Lai et al. (2022) Lai, T. S.-Y., Armus, L., U, V., et al. 2022, ApJ, 941, L36
- Leroy et al. (2023) Leroy, A. K., Sandstrom, K., Rosolowsky, E., et al. 2023, ApJ, 944, L9
- Leroy et al. (2008) Leroy, A. K., Walter, F., Brinks, E., et al. 2008, AJ, 136, 2782.
- Leung et al. (2018) Leung, G. Y. C., Leaman, R., van de Ven, G., et al. 2018, MNRAS, 477, 254
- Levy et al. (2018) Levy, R. C., Bolatto, A. D., Teuben, P., et al. 2018, ApJ, 860, 92
- Li (2020) Li, A. 2020, Nature Astronomy, 4, 339
- Lonsdale et al. (2003) Lonsdale, C. J., Lonsdale, C. J., Smith, H. E., et al. 2003, ApJ, 592, 804
- Lu et al. (2021) Lu, K.-X., Wang, J.-G., Zhang, Z.-X., et al. 2021, ApJ, 918, 50
- Maiolino et al. (2017) Maiolino, R., Russell, H. R., Fabian, A. C., et al. 2017, Nature, 544, 202
- Maragkoudakis et al. (2018) Maragkoudakis, A., Ivkovich, N., Peeters, E., et al. 2018, MNRAS, 481, 5370
- Mazzarella et al. (1994) Mazzarella, J. M., Voit, G. M., Soifer, B. T., et al. 1994, AJ, 107, 1274
- McNamara & Nulsen (2007) McNamara, B. R., & Nulsen, P. E. J. 2007, ARA&A, 45, 117
- Mehdipour et al. (2018) Mehdipour, M., Kaastra, J. S., Costantini, E., et al. 2018, A&A, 615, A72
- Miles et al. (1994) Miles, J. W., Houck, J. R., & Hayward, T. L. 1994, ApJ, 425, L37
- Molina et al. (2022) Molina, J., Ho, L. C., Wang, R., et al. 2022, ApJ, 935, 72
- Molina et al. (2023) Molina, J., Ho, L. C., Wang, R., et al. 2023, ApJ, 944, 30
- Müller-Sánchez et al. (2011) Müller-Sánchez, F., Prieto, M. A., Hicks, E. K. S., et al. 2011, ApJ, 739, 69
- Nguyen et al. (2021) Nguyen, D. D., Izumi, T., Thater, S., et al. 2021, MNRAS, 504, 4123
- O’Dowd et al. (2009) O’Dowd, M. J., Schiminovich, D., Johnson, B. D., et al. 2009, ApJ, 705, 885
- Padovani et al. (2017) Padovani, P., Alexander, D. M., Assef, R. J., et al. 2017, A&A Rev., 25, 2
- Page et al. (2012) Page, M. J., Symeonidis, M., Vieira, J. D., et al. 2012, Nature, 485, 213
- Paspaliaris et al. (2021) Paspaliaris, E.-D., Xilouris, E. M., Nersesian, A., et al. 2021, A&A, 649, A137
- Pereira-Santaella et al. (2011) Pereira-Santaella, M., Alonso-Herrero, A., Santos-Lleo, M., et al. 2011, A&A, 535, A93
- Pereira-Santaella et al. (2014) Pereira-Santaella, M., Spinoglio, L., van der Werf, P. P., et al. 2014, A&A, 566, A49
- Pérez-Torres et al. (2009) Pérez-Torres, M. A., Alberdi, A., Colina, L., et al. 2009, MNRAS, 399, 1641
- Pessa et al. (2021) Pessa, I., Schinnerer, E., Belfiore, F., et al. 2021, A&A, 650, A134
- Peterson et al. (2014) Peterson, B. M., Grier, C. J., Horne, K., et al. 2014, ApJ, 795, 149
- Pillepich et al. (2018) Pillepich, A., Springel, V., Nelson, D., et al. 2018, MNRAS, 473, 4077
- Rees (1984) Rees, M. J. 1984, ARA&A, 22, 471
- Ricci et al. (2017) Ricci, C., Trakhtenbrot, B., Koss, M. J., et al. 2017, ApJS, 233, 17
- Rieke et al. (2015) Rieke, G. H., Wright, G. S., Böker, T., et al. 2015, PASP, 127, 584
- Rigby et al. (2023) Rigby, J., Perrin, M., McElwain, M., et al. 2023, PASP, 135, 048002
- Rigopoulou et al. (2002) Rigopoulou, D., Kunze, D., Lutz, D., et al. 2002, A&A, 389, 374
- Robleto-Orús et al. (2021) Robleto-Orús, A. C., Torres-Papaqui, J. P., Longinotti, A. L., et al. 2021, ApJ, 906, L6
- Rosenthal et al. (2000) Rosenthal, D., Bertoldi, F., & Drapatz, S. 2000, A&A, 356, 705
- Roussel et al. (2007) Roussel, H., Helou, G., Hollenbach, D. J., et al. 2007, ApJ, 669, 959
- Rujopakarn et al. (2011) Rujopakarn, W., Rieke, G. H., Eisenstein, D. J., et al. 2011, ApJ, 726, 93
- Sales et al. (2010) Sales, D. A., Pastoriza, M. G., & Riffel, R. 2010, ApJ, 725, 605
- Sanders & Mirabel (1996) Sanders, D. B., & Mirabel, I. F. 1996, ARA&A, 34, 749
- Sanders et al. (1988a) Sanders, D. B., Soifer, B. T., Elias, J. H., et al. 1988a, ApJ, 325, 74
- Sanders et al. (1988b) Sanders, D. B., Soifer, B. T., Elias, J. H., et al. 1988b, ApJ, 328, L35
- Schawinski et al. (2007) Schawinski, K., Thomas, D., Sarzi, M., et al. 2007, MNRAS, 382, 1415
- Schaye et al. (2015) Schaye, J., Crain, R. A., Bower, R. G., et al. 2015, MNRAS, 446, 521
- Seyfert (1943) Seyfert, C. K. 1943, ApJ, 97, 28
- Shangguan & Ho (2019) Shangguan, J., & Ho, L. C. 2019, ApJ, 873, 90
- Shangguan et al. (2019) Shangguan, J., Ho, L. C., Li, R., et al. 2019, ApJ, 870, 104
- Shangguan et al. (2018) Shangguan, J., Ho, L. C., & Xie, Y. 2018, ApJ, 854, 158
- Shen & Ho (2014) Shen, Y., & Ho, L. C. 2014, Nature, 513, 210
- Shipley et al. (2016) Shipley, H. V., Papovich, C., Rieke, G. H., et al. 2016, ApJ, 818, 60
- Sikora et al. (2007) Sikora, M., Stawarz, L., & Lasota, J.-P. 2007, ApJ, 658, 815
- Smith et al. (2007) Smith, J. D. T., Draine, B. T., Dale, D. A., et al. 2007, ApJ, 656, 770
- Soifer et al. (2003) Soifer, B. T., Bock, J. J., Marsh, K., et al. 2003, AJ, 126, 143
- Song et al. (2021) Song, Y., Linden, S. T., Evans, A. S., et al. 2021, ApJ, 916, 73
- Springob et al. (2005) Springob, C. M., Haynes, M. P., Giovanelli, R., & Kent, B. R. 2005, ApJS, 160, 149
- Stierwalt et al. (2014) Stierwalt, S., Armus, L., Charmandaris, V., et al. 2014, ApJ, 790, 124
- Terashima & Wilson (2003) Terashima, Y., & Wilson, A. S. 2003, ApJ, 583, 145
- Thornley et al. (2000) Thornley, M. D., Förster Schreiber, N. M., Lutz, D., et al. 2000, ApJ, 539, 641
- Tielens (2008) Tielens, A. G. G. M. 2008, ARA&A, 46, 289
- Togi & Smith (2016) Togi, A., & Smith, J. D. T. 2016, ApJ, 830, 18
- Toomre (1964) Toomre, A. 1964, ApJ, 139, 1217
- U et al. (2022) U, V., Lai, T., Bianchin, M., et al. 2022, ApJ, 940, L5
- Ward et al. (2022) Ward, S. R., Harrison, C. M., Costa, T., & Mainieri, V. 2022, MNRAS, 514, 2936
- Weinberger et al. (2017) Weinberger, R., Springel, V., Hernquist, L., et al. 2017, MNRAS, 465, 3291
- Wells et al. (2015) Wells, M., Pel, J.-W., Glasse, A., et al. 2015, PASP, 127, 646
- Werner et al. (2004) Werner, M. W., Roellig, T. L., Low, F. J., et al. 2004, ApJS, 154, 1
- Whitcomb et al. (2023) Whitcomb, C. M., Sandstrom, K., Leroy, A., et al. 2023, ApJ, 948, 88
- Wilson et al. (1991) Wilson, A. S., Helfer, T. T., Haniff, C. A., et al. 1991, ApJ, 381, 79
- Xie & Ho (2019) Xie, Y., & Ho, L. C. 2019, ApJ, 884, 136
- Xie et al. (2018) Xie, Y., Ho, L. C., Li, A., & Shangguan, J. 2018, ApJ, 860, 154
- Xie et al. (2021) Xie, Y., Ho, L. C., Zhuang, M.-Y., & Shangguan, J. 2021, ApJ, 910, 124
- Xu & Wang (2022) Xu, X., & Wang, J. 2022, ApJ, 933, 110
- Zakamska (2010) Zakamska, N. L. 2010, Nature, 465, 60
- Zhang & Ho (2023a) Zhang, L., & Ho, L. C. 2023a ApJ, 943, 1
- Zhang & Ho (2023b) Zhang, L., & Ho, L. C. 2023b, ApJ, 943, 60
- Zhang et al. (2022) Zhang, L., Ho, L. C., & Li, A. 2022, ApJ, 939, 22
- Zhang et al. (2021) Zhang, L., Ho, L. C., & Xie, Y. 2021, AJ, 161, 29
- Zhuang & Ho (2020) Zhuang, M.-Y., & Ho, L. C. 2020, ApJ, 896, 108
- Zhuang & Ho (2022) Zhuang, M.-Y., & Ho, L. C. 2022, ApJ, 934, 130
- Zhuang et al. (2019) Zhuang, M.-Y., Ho, L. C., & Shangguan, J. 2019, ApJ, 873, 103
- Zhuang et al. (2021) Zhuang, M.-Y., Ho, L. C., & Shangguan, J. 2021, ApJ, 906, 38
- Zubovas et al. (2013) Zubovas, K., Nayakshin, S., King, A., et al. 2013, MNRAS, 433, 3079