Testing the dynamic origin of Quasi-periodic Oscillations in MAXI J1535571 and H 1743322
Abstract
We investigate spectro-temporal properties for two black hole X-ray binary sources, MAXI J1535571 and H 1743322, during their hard and hard-intermediate states. For MAXI J1535571, we analyze Swift/XRT, NuSTAR and NICER observations, specifically focusing on the occurrence of type-C Quasi-periodic Oscillations (QPOs). Regarding H 1743322, we analyze multi-epoch observations of NICER and AstroSat, identifying a type-C QPO with centroid frequency ranging from 0.1–0.6 Hz. In both sources, we fit the spectra with a relativistic truncated disk and a power law component. In MAXI J1535571, we also observe an additional relativistically smeared iron line. Through temporal and spectral analysis, we estimate the QPO centroid frequency and spectral parameters, such as the accretion rate and inner disc radii. We test the origin of type-C QPOs as relativistic precession frequency, and dynamic frequency (i.e. the inverse of the sound crossing time ). The dependence of QPO frequency on both the accretion rate and inner disc radii favours the QPO origin as dynamic frequency. We discuss the implications of these results.
keywords:
accretion, accretion discs — black hole physics — X-rays: binaries — X-rays: individual: MAXI J1535571, H 1743-3221 Introduction
During an outburst, transient black hole X-ray binary (BHXB) sources make a transition to several canonical accretion states and, before returning to the quiescence state, trace a q-shape in the Hardness-Intensity Diagram (HID; Homan
et al., 2001; Fender
et al., 2004; Belloni et al., 2005). These canonical accretion states are low hard state (LHS), hard-intermediate state (HIMS), soft-intermediate state (SIMS), and high-soft state (HSS) (Belloni et al., 2005; Done
et al., 2007; Belloni et al., 2011, and references within). The typical spectra of BHXBs constitute of disc black body component, the power-law component, which arises as a result of the comptonization of thermal photons and the reflection component, which is due to down-scattering of comptonized photons to the disc (Remillard &
McClintock, 2006; Done
et al., 2007, and references within). In the LHS and HIMS, the spectra are dominated by emission from the power-law component, while in the SIMS and HSS, the thermal emission from the disc dominates (for review, see Remillard &
McClintock, 2006; Done
et al., 2007; Gilfanov, 2010).
Transient BHXB sources also exhibit X-ray variability known as Quasi-periodic Oscillations (QPOs) on the time scale of mHz to kHz (for review, see Ingram &
Motta, 2019). The low-frequency QPOs (LFQPOs) are the ones with QPO frequency ranging from 0.1-20.0 Hz (e.g., Motta
et al., 2015). Based on QPO’s Q-factor and the presence of other harmonic components, the LFQPOs in these systems have been further classified into three categories, i.e., type-A, B and C (Wijnands et al. 1999, Homan
et al. 2001, Remillard et al. 2002, Casella et al. 2004). The type-C QPO is the most commonly observed and appears in the hard or hard-intermediate state as narrow peaks in the Power Density Spectra (PDS; van der Klis &
Jansen, 1985) accompanied with harmonic and broad Lorentzian noise components. Though the presence of type-C QPO in the hard or hard-intermediate state of BHXB systems is a ubiquitous phenomenon, there is still no consensus regarding the origin of these QPOs (Ingram &
Motta, 2019).
One promising model that claims to explain the geometrical origin of LFQPOs in compact objects is the relativistic precession model (RPM Stella & Vietri 1998; Stella et al. 1999). In RPM, the QPO frequency is assumed to be nodal precession or Lense-Thirring precession frequency (; Lense & Thirring 1918). For a test particle of mass ‘M’, orbiting in the tilted geodesics of characteristic radii ‘r’, around a Kerr black hole of dimensionless spin parameter ‘a’, the orbital, and Lense-Thirring precession frequencies are given by;
| (1) |
| (2) |
where r is in units of gravitational radius, . The LFQPO frequency has been identified as the Lense-Thirring precession frequency for BHXB sources GRO J165540, XTE J1550-564, MAXI J1820+070, and XTE J1859+226 (Motta et al., 2014a, b; Bhargava et al., 2021; Motta
et al., 2022). Based on the detection of simultaneous LFQPO and HFQPOs, RPM allows for self-consistent measurements of the spin and mass of the black hole as well as estimating the radius at which the QPOs are produced (see Motta et al. 2014a, b; Motta
et al. 2022).
There is another class of models which assumes the dynamical mechanism as the origin of LFQPO instead of geometrical (Cabanac et al., 2010; O’Neill et al., 2011). For the inner region of the standard thin relativistic accretion disc (Shakura & Sunyaev, 1973; Novikov & Thorne, 1973), the dynamic frequency (), which is inverse of the sound crossing time, is given by Misra et al. (2020) as;
| (3) | |||||
Here , , , , are relativistic terms that depend on spin parameter ‘a’ and inner disk radii ‘r’. ‘N’ is the normalization factor (please see Misra
et al., 2020, for more details) and is the accretion rate in terms of grams . Misra
et al. (2020) and Liu et al. (2021) have identified the LFQPO frequency as the relativistic dynamic frequency of a truncated accretion disc, using AstroSat and Insight-HXMT observation of GRS 1915+105, respectively.
In this work, we investigate the origin of LFQPOs for two black hole transient sources, MAXI J1535571 and H 1743322 using two different LFQPO models; RPM, and dynamic origin. We briefly introduce the two BHXB sources in the following subsections.
1.1 MAXI J1535571
MAXI J1535571 (hereafter MAXI J1535) is a transient low-mass BHXB source (Scaringi
& ASTR211 Students, 2017; Dinçer, 2017; Russell et al., 2017; Negoro
et al., 2017b) that was detected on 2nd Sep 2017 with MAXI/GSC (Negoro
et al., 2017a) and SWIFT/BAT (Kennea et al. 2017, Markwardt et al. 2017). Like other BHXB sources, this system also shows X-ray variability (Gendreau
et al. 2017, Mereminskiy et al. 2018, Stiele &
Kong 2018, Huang et al. 2018, Bhargava et al. 2019,Negoro
et al. 2017b, Zhang et al. 2022, and Rawat et al. 2023) and is found to trace a hysteresis loop in the HID (Tao et al., 2018). The source is located at a distance of 4–6 kpcs (Chauhan
et al., 2019; Sridhar et al., 2019) with a jet inclination angle (Russell
et al., 2019). X-ray spectral studies suggest that the system harbours a near-maximally spinning black hole (Gendreau
et al. 2017, Xu et al. 2018, Miller
et al. 2018).
In its 2017 outburst starting from September 9-21, MAXI J1535 was found to be in hard and hard-intermediate state (HIMS), and a type-C QPO was reported in the frequency range 0.2-9.0 Hz (Gendreau et al. 2017, Mereminskiy et al. 2018, Stiele & Kong 2018, Huang et al. 2018, Bhargava et al. 2019, Rawat et al. 2023). In the duration of HIMS, the photon index has been reported to be 2 with a low disk temperature of 0.3 keV (Tao et al., 2018; Sridhar et al., 2019). The source transitioned to a soft state and then to a soft-intermediate state with a weak type-A/B LFQPO (Stiele & Kong 2018, Stevens et al. 2018, Huang et al. 2018). During soft state, disk emission dominated the spectrum with disk temperature reaching 0.7 keV and inner radius extending up to ISCO (Tao et al., 2018). From September to October, the source transitions to the hard intermediate state with type-C QPO frequency ranging from 4.0-7.0 Hz (please see Figure 1 of Rawat et al. 2023).
1.2 H 1743-322
H 1743322 (hereafter H1743) is an X-ray transient black hole binary source discovered and localized by Kaluzienski &
Holt (1977) and Doxsey
et al. (1977). In 2003, the source was observed in its brightest and longest outburst and was extensively studied in multi-wavelengths (Parmar et al., 2003; Kalemci et al., 2006; Capitanio et al., 2009; Coriat
et al., 2011). H1743 was observed in several accretions states (Parmar et al., 2003) and showed all the three types of LFQPOs, i.e., type-A, B, and C (Markwardt &
Swank, 2003; Tomsick &
Kalemci, 2003; Homan et al., 2005; Harikrishna &
Sriram, 2022) during its 2003 outburst. After its 2003 complete outburst, the source has shown only two episodes of complete outburst in 2009 (Coriat
et al., 2011) and 2016 (Chand et al., 2020) and several faint or failed outbursts, also termed as hard-only outbursts in 2004, 2005, 2008, 2010 (see Figure 1 and 2 of Coriat
et al. 2011), 2012 (Shidatsu
et al., 2014), 2014 (Stiele &
Yu, 2016), 2017 (Jin et al., 2017), and 2018 (Williams
et al., 2020; Wang et al., 2022).
During the 2003 outburst of H1743, two-sided X-ray/radio jets were ejected from the source and, using symmetric kinematic models, Steiner
et al. (2012) reported a distance of 8.5 kpcs and jet inclination angle of . This reported value for the distance is consistent with the previously reported higher limit by Corbel et al. (2005). Assuming the mass distribution given by Özel et al. (2010) for transient low mass X-ray binaries, Steiner
et al. (2012) have constrained the spin of the black hole as -0.33 a 0.70 with a 90 confidence interval. With RXTE observations, the scaling technique between the spectral index and QPO frequency Shaposhnikov
& Titarchuk (2009) has estimated the dynamical mass of the black hole to be 11 . In the hard state, the spectra of the source showed the presence of two distinct components, a multi-colour disc black body and hard power-law tail with photon index 2.2 (Grebenev et al., 2003).
Using NICER observations, a variable type-C QPO for MAXI J1535571 (QPO1.8-9.0 Hz; Rawat et al. 2023) and H 1743322 (QPO0.1-0.6 Hz; Stiele &
Kong 2021; Wang et al. 2022) has been reported. We are analyzing the same set of NICER observations of MAXI J1535 as analyzed by Rawat et al. (2023) for the study of the comptonizing medium through type-C QPOs with a complementary quasi-simultaneous Swift/XRT and NuSTAR observation. Miller
et al. (2018) have analysed the NICER observation (observation ID 1050360106) of the intermediate state and found clear hallmarks of relativistic disk reflection and emission components of the accretion disk and hard X-ray corona.
Additionally, the H1743 NICER observations used in this work have been analysed by Stiele &
Kong (2021) and Wang et al. (2022) to study the spectral evolution of the source. However, this is the first time a spectro-temporal analysis of these two sources will be exploited to test the nature of type-C QPOs.
The excellent time resolution of NICER in the 0.2-10.0 keV energy band provides a unique opportunity to test the QPO models. As the 0.3-80.0 keV broad energy range and the good timing resolution of the LAXPC instrument onboard AstroSat is best suited for the spectro-temporal study of the source, we have incorporated two AstroSat H1743 observations for which type-C QPOs (QPO frequency0.4-0.6 Hz) have been reported (Chand et al. 2021 and Husain et al. 2023 under review). Also, with low energy coverage of SXT instrument, a better estimate of inner disc properties is possible as shown by Misra
et al. (2020) (see right panel of their Figure 4).
With timing analysis, we will first estimate the QPO centroid frequency. Next, we will fit the spectra with a relativistic truncated disc model and a relativistically smeared iron line model to estimate the inner disc radii and accretion rate. Finally, we will fit the RPM model (Equation 2) on the QPO frequency vs inner disc radii plot and dynamic frequency model (Equation 3) on the QPO frequency/accretion rate vs inner disc radii plot. In Section 2, we describe the observations and data analysis techniques, and in Section 3 we present the results of our analysis and fit the observational data points with Equations 2 and 3. Finally, we discuss our findings in Section 4 and compare our results with microquasar source GRS 1915+105. In Section 5, we conclude our findings.
| Instrument | ObsID | Tstart | Tstop | exposure |
| (M.J.D) | (M.J.D) | (secs) | ||
| Swift/XRT | 00010264005 | 58008.26 | 58008.29 | 2258 |
| NuSTAR | 80302309002 | 58008.55 | 58008.56 | 881 |
| NICER | 1050360104 | 58008.46 | 58008.53 | 5310 |
| 1050360105 | 58008.99 | 58009.13 | 1509 | |
| 1050360105 | 58009.16 | 58009.19 | 1554 | |
| 1050360105 | 58009.23 | 58009.30 | 791 | |
| 1050360105 | 58009.81 | 58009.94 | 2315 | |
| 1050360106 | 58010.00 | 58010.52 | 4838 | |
| 1050360107 | 58011.87 | 58011.94 | 1392 | |
| 1050360108 | 58012.19 | 58012.26 | 1219 | |
| 1050360108 | 58012.32 | 58012.58 | 1292 | |
| 1050360109 | 58013.22 | 58013.22 | 463 | |
| 1050360109 | 58013.28 | 58013.41 | 815 | |
| 1050360109 | 58013.48 | 58013.74 | 983 | |
| 1050360109 | 58013.99 | 58014.00 | 873 | |
| 1050360110 | 58014.05 | 58014.06 | 872 | |
| 1050360110 | 58014.82 | 58014.83 | 886 | |
| 1050360111 | 58015.28 | 58015.67 | 111 | |
| 1050360112 | 58016.24 | 58016.96 | 577 | |
| 1050360113 | 58017.01 | 58017.86 | 1254 | |
| 1130360103 | 58026.73 | 58026.81 | 87 | |
| 1130360104 | 58027.76 | 58027.78 | 1487 | |
| 1130360105 | 58028.72 | 58028.87 | 109 | |
| 1130360106 | 58029.75 | 58029.84 | 33 | |
| 1130360107 | 58030.71 | 58030.87 | 24 | |
| 1130360108 | 58031.36 | 58031.89 | 92 | |
| 1130360113 | 58036.50 | 58036.69 | 471 | |
| 1130360114 | 58037.03 | 58037.68 | 1272 |
| Instrument | ObsID | Tstart | Tstop | exposure |
| (M.J.D) | (M.J.D) | (secs) | ||
| AstroSat | T01_045T01_9000000364 | 57456.41 | 57456.80 | 6246 |
| G07_039T01_9000001444 | 57973.32 | 57973.77 | 14490 | |
| NICER | 1100300102 | 58367.01 | 58367.86 | 7781 |
| 1100300104 | 58369.14 | 58369.92 | 1605 | |
| 1100300107 | 58372.75 | 58372.77 | 956 | |
| 1100300108 | 58373.06 | 58373.78 | 1548 | |
| 1100300115 | 58385.23 | 58385.82 | 2211 |
2 Observation and Data Reduction
In this work, we have used NICER extensive observations of MAXI J1535 and H1743. We have also analyzed a nearly simultaneous Swift/XRT and NuSTAR observation for MAXI J1535. The observation details for both sources are given in Table 1 and 2.
2.1 Swift/XRT
Swift/XRT has observed the MAXI J1535 in the window mode on 2017-09-12 06:16:57 with observation ID 00010264005 (details are given in Table 1). Swift/XRT (Burrows et al., 2005) is an X-ray Imaging Telescope which operates in a narrow energy band of 0.2–10 keV with an effective area of 125 at 1.5 keV. It has a timing resolution of 2 ms. We have used Build Swift-XRT products111https://www.swift.ac.uk/user_objects/ to generate the spectra, ancillary response (arf) and response (rmf; see Evans et al. 2009). By applying a threshold of >250 c/s (Mineo et al., 2007), window mode effectively reduces pile-up for bright sources. To further correct for the effect, only grade 0 events were extracted for the source spectra.
2.2 NuSTAR
We have used the Nuclear Spectroscopic Telescope Array (NuSTAR) 2017-09-12 13:01:09 observation of MAXI J1535 with observation ID 80302309002 (details are given in Table 1). NuSTAR is a high-energy X-ray mission that works in the 3.0-79.0 keV band. It consists of two focal plane module detectors, FPMA, and FPMB. In this work, we have used both module A and B to extract the level 2 products using nupipeline from the level 1 fits file using the saacalc=2, saamode = OPTIMIZED and tentacle =
no, flags. We have used ds9 to produce a source region file taking a circular source of region 3′. For background spectra, we have taken a circular region of 3′in the same frame away from the source. We then extract the spectra, arf and rmf using nuproducts within NuSTARDAS.
2.3 NICER
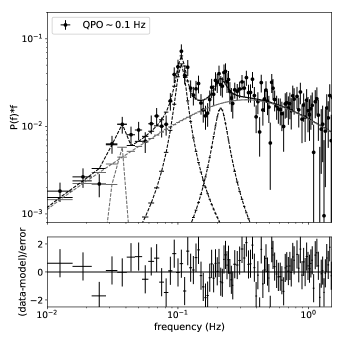
In this work, we have used observations of MAXI J1535 and H1743 obtained in September-October 2017 and September 2018, respectively, with the Neutron Star Interior Composition Explorer (NICER Gendreau et al., 2012). The details of the observations ID’s are given in Table 1 and 2. NICER’s XTI (X-ray Timing Instrument Gendreau et al., 2016) covers the 0.2-12.0 keV band and has an effective area of 2000 cm2 at 1.5 keV. The energy and time resolution are 85 eV at 1 keV and 4 secs, respectively. We have used the nicerl2222https://heasarc.gsfc.nasa.gov/docs/nicer/analysis_threads/nicerl2/ task to process each observation, which applies the standard calibration process and screening. We have produced the spectra and background files using the NICER background estimator tool 3C 50_RGv5333https://heasarc.gsfc.nasa.gov/docs/nicer/tools/nicer_bkg_est_tools.html. We have used Heasoft version 6.30 and CALDB version 20210707 to create the rmf and arf files. For MAXI J1535, the details of the spectra and Poisson noise subtracted PDS extraction are briefly given in Rawat et al. (2023). For H1743, we have fitted the PDS with 4 Lorentzians: one centered at 0 Hz, one for sub-harmonic component, one at QPO frequency and the last at a harmonic frequency of QPO. The fitted PDS for H1743 with reduced is shown in Figure 1.
| Instrument | QPO frequency | Inner Radius | Fraction Scatter | Flux in Line Emission | Lum | (dof) | |||
|---|---|---|---|---|---|---|---|---|---|
| (Hz) | cm-2 | ( gm s-1) | (Rg) | ( photons cm-2 s-1) | ergs cm-2 | ||||
| Swift+NuSTAR | 0.97 | 516.5 (470) | |||||||
| NICER | |||||||||
Notes: aQPO frequency value taken from Table 1 of Mereminskiy et al. (2018) for Swift/XRT observation ID 00010264005.

| Instrument | QPO frequency | Accretion Rate | Inner Radius | Fraction Scatter | Lum | (dof) | ||
|---|---|---|---|---|---|---|---|---|
| (Hz) | cm-2 | ( gm s-1) | (Rg) | ( ergs cm-2) | ||||
| AstroSat | ||||||||
| NICER | – | |||||||
| – | ||||||||
| – | ||||||||
| – | ||||||||
| – |
2.4 AstroSat
We have used AstroSat observations of the transient system H1743 as it went into an outburst on two separate events on 2016-03-09 and 2017-08-08 with observation IDs T01045T019000000364 and G07039T019000001444, respectively. AstroSat is India’s first multi-wavelength satellite with five detectors working in X-rays, UV and visible range. AstroSat observations used in this work were conducted by the Soft X-ray Telescope (SXT; Singh et al. 2017) and the Large Area X-ray Proportional Counter (LAXPC; Yadav et al. 2016; Antia et al. 2017), which works in the energy band of 0.3-8.0 keV and 3-80 keV, respectively. The reduction of Level-1 LAXPC data was performed with the LAXPC software package available on AstroSat Science Support Cell (ASSC) website444http://astrosat-ssc.iucaa.in/laxpcData.
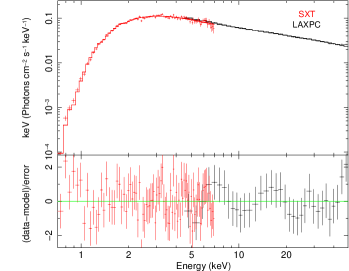
The PDS in the 3.0-15 keV range is extracted using powspec tool of the XRONOS software package using the LAXPC data (for details, please see Husain et al. 2023 under review). For SXT, the spectrum is extracted from the Level-2 processed event file with the XSELECT (V2.4m) package of HEASOFT considering an encircled region of 15 arcmins on imaging tool ds9. We have used recent ARF, RMF and background files provided by the SXT Team555https://www.tifr.res.in/~astrosat_sxt/dataanalysis.html. The effective area file is corrected for the source region and vignetting effect using ‘SXTARFmodule’ tool. Further, the spectrum is combined with the corrected ARF, response and background files. More details on data reduction can be found in Husain et al. 2023 (under review).
2.5 Spectral Analysis
2.5.1 MAXI J1535
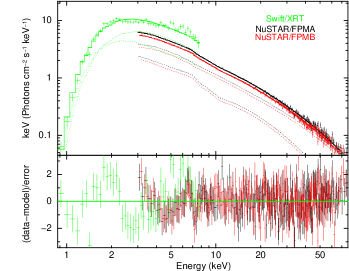
Swift/XRT and NuSTAR spectra of MAXI J1535 show a contribution from a multi-temperature disc and power law emission components. We fit the multi-temperature disc with kerrd model (Ebisawa et al., 2003), which considers an optically thick accretion disc around a Kerr black hole. The power-law emission is taken care of by thcomp (Zdziarski et al., 2020), which is a convolution model that comptonizes the seed photons coming from the disc. We observe a relativistically smeared iron line at 6.7 keV, which we fit with relxillCp model. Tbabs takes care of the interstellar absorption. The time-averaged spectrum of MAXI J1535 is fitted with Tbabs(thcomp*kerrd+relxillCp) model as shown in left Figure 2.
While fitting the spectra, we add 1 systematic and a constant, fixing the constant to ‘1’ for NuSTAR and free for Swift/XRT.
The reported distance of the source with radio and X-ray observations is in the range of 4-6 kpc (Chauhan
et al., 2019; Sridhar et al., 2019). So, we have fixed the distance parameter of kerrd to 5.0 kpc. For black hole binary sources emitting at 10 Eddington rate, Shimura &
Takahara (1995) reported
spectral hardening factor, / of 1.7. We have fixed the / of kerrd to 1.7. Till now, there is no optical mass measurement available for the black hole, and X-ray spectral studies report its conflicting estimates (Shang et al., 2019; Sreehari et al., 2019; Sridhar et al., 2019). So, we have extracted the spectra considering a black hole of 10 solar masses. The spin parameter of RelxillCp is fixed at the near-maximal value of 0.994 (Miller
et al., 2018).
The inclination angle of kerrd and relxillCp is fixed to 45°(Russell
et al., 2019) while the mass accretion rate and inner disc radii are allowed to be free parameters. The time-averaged spectra fitted values for these two parameters with error bars are provided in Table 3. For consistency, the inner disc radius of kerrd is tied to that of relxillCp. The outer disc radius and normalisation factor are fixed at 105 Rg and 1, respectively. To ensure that the relxillCp model exclusively outputs the reflection component, we have fixed the to -1. We have tied the power-law index, , thcomp to power law index, of RelxillCp. The best-fit parameter values for power law index value
is given in Table 3. The best-fit gives = and logxi= and constant for Swift/XRT 1.53. The reduced of the spectral fit and the best-fit parameters with a 1-sigma error are given in
Table 3.
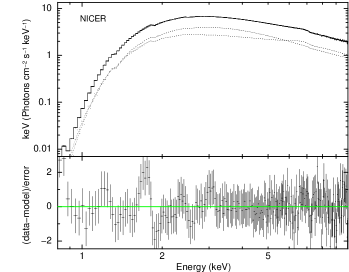
We then fit the NICER (0.8–10.0 keV) spectra with Tbabs(thcomp*kerrd+relxillCp) model as shown in the right panel of Figure 2. We have also added 1 systematic error, as suggested by the NICER team. We could not constrain the high-energy cutoff (which is parameterised by the electron temperature, ) of thcomp using NICER data; therefore, we freeze it to the time-averaged spectral fitted value we got from Swift and NuSTAR spectra (34.5 keV). The logxi values are also fixed to the best-fit spectral value (3.6) from the NuSTAR, and Swift/XRT spectral fitting. For the spectral fits, the reduced varies in the range 0.6–1.4. The best-fit parameters with the goodness of the fit for each segment are shown in Table 3.
2.5.2 H1743
We have fitted the simultaneous SXT and LAXPC broadband spectra of H1743 with constant*Tbabs(thcomp*kerrd) model in the 0.7–80.0 keV energy band as shown in the left panel of Figure 3. For both epochs of AstroSat observation, no significant reflection component is observed in the spectra. While fitting the spectra, we have added 3 systematic (Antia et al., 2021) and fixed the constant factor to 1 for LAXPC and kept if free for SXT. The constant factor for SXT ranges from 0.9–1.1 for the two epochs. We have added a gain for SXT and have fixed the slope to 1. We fit the spectra for two epochs keeping the gain offset free, and finally fix it to the averaged value of the two observations, i.e., 0.002. nH of Tbabs is kept as a free parameter, and for both epochs, the best fit gives nH of 2.2 (please see Table 4). We have kept the low energy power-law index, and cov_frac of thcomp as free parameters. The high-energy cutoff of thcomp is fixed to 30 keV following Wang et al. (2022).
We have fixed the inclination angle and distance parameter of kerrd to 75°and 8.5 kpc (Steiner
et al., 2012), respectively. As the dynamical mass measurement using optical observations is not reported for this source, we have fixed the mass of kerrd to 10 .
The spectral hardening factor of kerrd is again fixed to 1.7.
The mass accretion rate and inner disc radii of kerrd are free parameters. The outer disc radius and normalisation factor are fixed at 105 Rg and 1, respectively. The best-fit parameters for time-averaged spectra with their 1 errors are given in Table 4.
We have fitted the NICER spectra of H1743 in the keV energy band with Tbabs(simpl*kerrd) model as shown in the right panel of Figure 3. We have fixed nH to the time-averaged value of the best fit we got from AstroSat observation. We have kept inner disc radii, accretion rate, , and fraction scatter as a free parameter, and their time-averaged best spectral fit values with of the fits are given in Table 4. The best fit gives a reduced varying in the range of 0.9-1.1.
Note: We use the same colour scheme for observational data points in the next plots.
3 Results
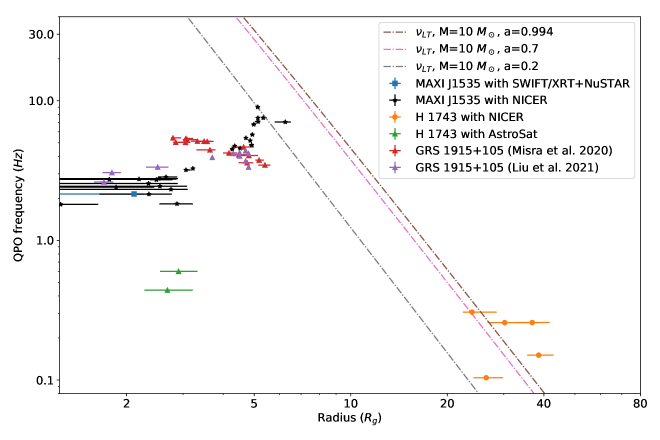
We have extracted the accretion rate and inner disc radii values from the spectral fit and the QPO centroid frequency value from the PDS fit. To study the geometrical dependence of QPO frequency, we plot the QPO frequency as a function of inner disc radii as shown in Figure 4. The black-coloured asterisk and blue-coloured square show NICER and Swift/XRT+NuSTAR observation of MAXI J1535. The orange circular points and green triangle represent the NICER and AstroSat observation of H1743. For comparison, we over-plot the GRS 1915+105 AstroSat (Misra
et al., 2020) and HXMT (Liu et al., 2021) observations (shown in red and purple coloured triangles in Figure 4). Using Equation 2, we have plotted curves for the nodal precession frequency as a function of inner disc radii for three different dimensionless spin parameter values, i.e., 0.994, 0.7, and 0.2. The nodal precession frequency curves are shown in brown, light pink and grey dash-dot lines for a 10 black hole. GRS 1915+105 and MAXI J1535 are known to harbour a high-spin black hole; however, our results show that
the data points for GRS 1915+105 and MAXI J1535 don’t coincide with the nodal precession frequency curve for a high-spin black hole. While in the case of H1743, the data points are scattered. The 2018’s failed (or hard-only) state of H1743 (shown in orange triangles) aligns with the nodal precession frequency curve. In contrast, the data points from 2016’s and 2017’s observations fall much left to the nodal precession frequency in Figure 4.
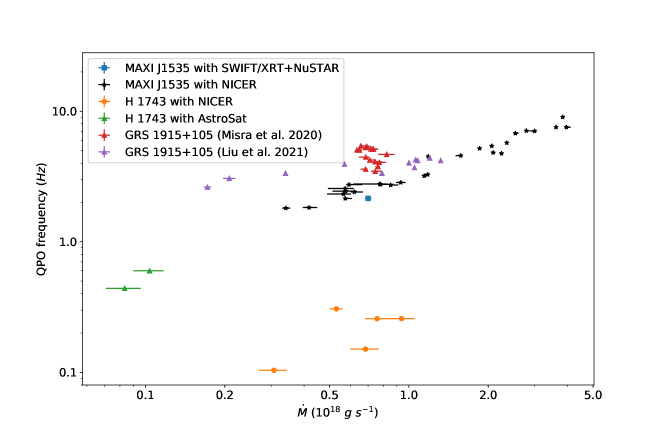
Next, we plot the QPO frequency as a function of the accretion rate, as shown in the upper panel of Figure 5.
We used the same colour scheme and point type for data points as in Figure 4. A broad correlation between QPO frequency and the accretion rate is observed for GRS 1915+105 and MAXI J1535. While again, for H1743, the data points are scattered. For MAXI J1535 and H 1743, the accretion rate varies in the range 0.04–0.28 and 0.007–0.062 , respectively, assuming the radiative efficiency of 10% for a 10 solar mass black hole.
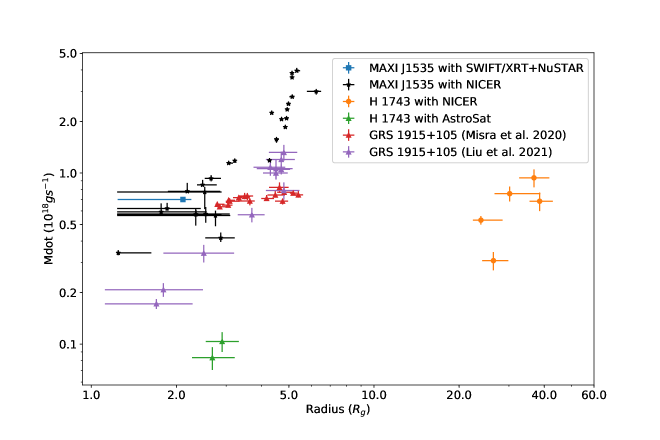
Next, we checked the dependence of disc parameters, i.e., accretion rate and inner disc radii, with each other as shown in the lower panel of Figure 5. There is a hint of a correlation between the
accretion rate and the inner disc radii for GRS 1915+105, MAXI J1535, and H1743.
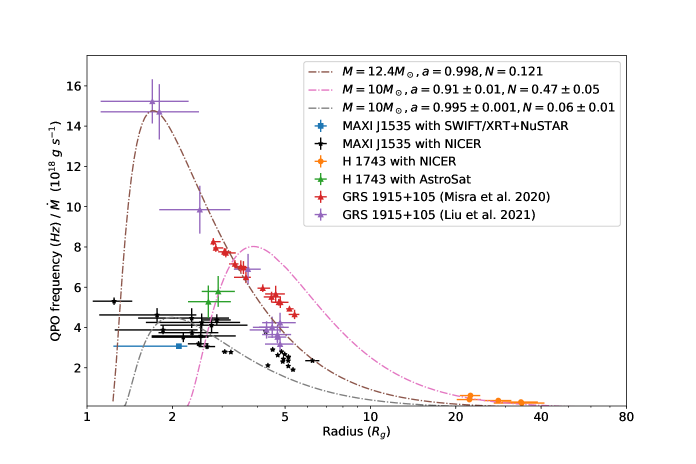
To test the dynamic origin of the QPO, we plot the QPO frequency/ as a function of inner disc radii for GRS 1915+105, MAXI J1535, and H1743 as shown in Figure 6. The dashed-dotted lines represent the theoretical curve for the dynamic frequency/, plotted as a function of inner disc radii as given by Equation 3.
The brown-coloured dash-dotted lines show the best-fit curve for GRS 1915+105 (taken form Misra
et al. 2020 and Liu et al. 2021). We have kept ‘a’ and ‘r’ as free parameters in Equation 3 and used the mass of the black hole as 12.4 for GRS 1915+105. The pink and grey coloured dashed-dotted lines show the best-fit dynamic frequency curve for H1743 and MAXI J1535, respectively. The black hole mass of H1743 and MAXI J1535 is 10.0 . For MAXI J1535, the data points are scattered, and the best fit gives dimensionless spin parameters, and .
For H1743, the orange-coloured data points are NICER observations, and the green-coloured data points are AstroSat observations. In the hard-only state (orange-coloured data points), the inner disc is truncated at 22-34 Rg, so the NICER data points are located at the lower end tail of the QPO frequency/ curve. However, in the hard-intermediate state, as observed with AstroSat (red-coloured data points), the inner disc is truncated at 3 Rg. The best fit gives and .
It should be noted that during the fitting process of the spectra, we kept the spectral hardening factor fixed at 1.7 for both sources.
However, the spectral hardening factor could vary, leading to changes in the inner disk radii. To explore this possibility, we performed an analysis by extracting the inner disk radii with the spectral hardening factor fixed to two extreme values at 1.5 and 2.0. In the QPO frequency/accretion rate versus the inner disk radii plot, we observe a shift in the data points. Despite this shift in the data points, equation 3 still fits the data, yielding a spin parameter value nearly similar to that obtained by fixing the hardening factor to 1.7. Therefore, we conclude that the variation in the spectral hardening factor may not significantly impact our results.
4 Discussion and Summary
We have analysed the Sept-Oct 2017 observation of MAXI J1535 using NICER and Swift/XRT+NuSTAR instruments. We have also performed a spectral-temporal analysis for the H1743 using multi-epoch observations of its failed (2016, 2018) and complete outburst (2017) using AstroSat and NICER. A variable type-C QPO in the 1.8-9.0 Hz frequency range was previously reported for the NICER observation by Rawat et al. (2023); we have analysed the same observation set in which type-C QPO was present. Similarly, for H1743, a type-C QPO with QPO frequency 0.1-0.6 Hz was observed by Wang et al. (2022) and Stiele & Kong (2021) for the NICER observation set we have used in this work. We have fitted the spectra of MAXI J1535 with a relativistic truncated disk model, a power-law component and a relativistically smeared iron lime emission component.
4.1 Geometrical origin of QPO frequency
In the relativistic precession model (RPM), the LFQPO frequency is associated with the nodal precession frequency given by Equation 2. Our results show that the curve for the Lense-thirring frequency doesn’t match the observational data points for MAXI J1535, GRS 1915+105 and H1743. As shown in Figure 4, the theoretical curve predicts a decrease in inner disc radii with an increase in the QPO frequency. However, for MAXI J1535, a positive correlation between the QPO frequency and inner disc radii are found in this work. For, H1743, the data points are scattered.
Notice that the source is in a hard-intermediate state in its 2016 and 2017 outburst (Chand et al., 2020). While the 2018 outburst was a failed outburst as reported by Wang et al. (2022) and the source was in a hard state with a low accretion rate and truncated inner disc up to 22-34 (details are given in Table 4).
The differences in the slope of the Lense-thirring frequency and the observed data points for MAXI J1535 and H1743 argues against the geometric origin of the QPO. Also, in the RPM model, the QPO frequency should be solely a function of inner disc radii and ‘a’. Instead, in this work, we have observed a correlation between the accretion rate and the QPO frequency. We discuss the implications of these results in the next subsection.
4.2 QPO as a natural frequency in a disc-corona system
For MAXI J1535, we have observed a strong correlation between the QPO frequency and the accretion rate (as shown in Figure 5). The over-plotted data points for GRS 1915+105 from Misra et al. (2020) and Liu et al. (2021) also show a hint of correlation. Suppose the type-C LFQPOs originate from the radiative coupling between the hot comptonizing corona and the cold accretion disc (Mastichiadis et al., 2022). In that case, the QPO centroid frequency should be proportional to (see Equation 15 of Mastichiadis et al. 2022), and the corona should extend upto several hundreds of (600 Rg). For H1743, in the QPO frequency vs accretion rate plot, there is a change in slope between the AstroSat observations (green data points) and NICER observations (orange data points in Figure 5). For the AstroSat observations, the source was in the hard-intermediate state. While for NICER observation, the source was in the hard-only state. Assuming the origin of QPO as natural frequency, this slope difference could be attributed to the two different coronal sizes. In all the cases, the coronal size is significantly large, extending a significant covering factor over the accretion disk. The large coronal sizes could result from the simple assumption of homogeneous spherical corona taken by Mastichiadis et al. (2022).
We have also reported a positive correlation between the accretion rate and inner disc radii for MAXI J1535 and H1743. Using AstroSat observation of MAXI J1535, Garg
et al. (2022) have reported a correlation between the accretion rate and inner disc radii. This correlation was previously reported for the heartbeat state of GRS 1915+105 by Neilsen
et al. (2012); Rawat
et al. (2022).
The spectral parameters, i.e., accretion rate and inner disc radii, should be noted, depending on the compact object’s mass. For MAXI J1535 and H1743, a dynamical mass measurement using optical observations is unavailable. So, the slope of the QPO frequency vs accretion rate plot for both sources also depends on the mass of the black hole, which is uncertain in this case. In the QPO models like RPM, where a geometric origin of QPO is proposed, the QPO frequency should depend only on the truncated disc radii. The dependence of QPO frequency on inner disc radii and accretion rate provides strong evidence of the dynamic nature of the QPO.
4.3 Dynamic origin of QPO frequency
The theoretical curve for dynamic frequency overall fits observational data points for MAXI J1535 for a dimensionless spin parameter of 0.994, previously reported by Miller
et al. (2018). Unlike GRS 1915+105, where the data points match well with the theoretical curve of dynamic frequency (see Misra
et al. 2020), for MAXI J1535, the data points are scattered. The scatter of data points for the MAXI J1535 could be attributed to the limited energy range of the instrument plus the uncertainties in the calibration in the lower energy regime. As shown in the right panel of Figure 4 in Misra
et al. (2020), the low energy coverage of the SXT instrument plays a significant role in estimating inner disc properties like inner disc radii.
For H1743, in the hard-intermediate state, the disc is truncated to 3 Rg, and the location of data points suggests a higher spin value of the black hole than the previously reported values (Steiner
et al., 2012). Notice that the value of spin reported by Steiner
et al. (2012) highly depends on the black hole’s mass, which is uncertain in this case. Plus, Steiner
et al. (2012) has analysed RXTE observation of H1743, where a low energy coverage was missing, which plays an important role in estimating spin and inner disc parameters.
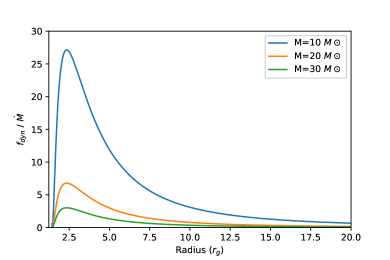
Notice that the spin parameter values reported using this method depend on parameters like the black hole’s mass, inclination angle, distance to the source, uncertainties in ARFs and the colour factor. The dynamic frequency curve itself depends on the mass of the black hole. We show the dependence of black hole mass on the dynamic frequency curve for three black hole masses 10, 20, and 30 in Appendix Figure A.7, freezing the black hole spin to a=0.99 and N=0.12. This method requires low energy coverage for the spectral parameters estimation and the presence of significant QPOs. Plus, For H 1743322, we have tested the model in a narrow frequency range of QPO from 0.1–0.6 Hz. Our suggestion is to conduct further testing on the dynamic origin of QPOs in H 1743322 and other black hole binary systems by performing simultaneous observations using different instruments, such as AstroSat/LAXPC and NICER. In addition, utilizing NuSTAR’s high energy coverage will aid in resolving the spectral parameters.
Acknowledgements
This work used data from the UK Swift Science Data Centre at the University of Leicester. This research has made use of the NuSTAR data analysis software (NuSTARDAS) jointly developed by the ASI science centre (ASDC, Italy) and the California Institute of Technology (Caltech, USA). The High Energy Astrophysics Science Archive Research Centre (HEASARC) and the Indian Space Science Data Centre (ISSDC) have provided the data for this research. DR acknowledges Yash Bhargava and Akash Garg for enlightening discussions.
Data Availability
The NICER/XTI, Swift/XRT, and NuSTAR observations used in this work are available at HEASARC website. The AstroSat data sets were derived from sources in the public domain: AstroSat Archive. The software and tools used to process the data are available at LAXPC Software, SXT Software.
References
- Antia et al. (2017) Antia H. M., et al., 2017, ApJS, 231, 10
- Antia et al. (2021) Antia H., et al., 2021, Journal of Astrophysics and Astronomy, 42, 32
- Belloni et al. (2005) Belloni T., Homan J., Casella P., van der Klis M., Nespoli E., Lewin W. H. G., Miller J. M., Méndez M., 2005, A&A, 440, 207
- Belloni et al. (2011) Belloni T. M., Motta S. E., Muñoz-Darias T., 2011, Bulletin of the Astronomical Society of India, 39, 409
- Bhargava et al. (2019) Bhargava Y., Belloni T., Bhattacharya D., Misra R., 2019, MNRAS, 488, 720
- Bhargava et al. (2021) Bhargava Y., Belloni T., Bhattacharya D., Motta S., Ponti. G., 2021, MNRAS, 508, 3104
- Burrows et al. (2005) Burrows D. N., et al., 2005, Space Sci. Rev., 120, 165
- Cabanac et al. (2010) Cabanac C., Henri G., Petrucci P. O., Malzac J., Ferreira J., Belloni T. M., 2010, MNRAS, 404, 738
- Capitanio et al. (2009) Capitanio F., Belloni T., Del Santo M., Ubertini P., 2009, MNRAS, 398, 1194
- Casella et al. (2004) Casella P., Belloni T., Homan J., Stella L., 2004, A&A, 426, 587
- Chand et al. (2020) Chand S., Agrawal V. K., Dewangan G. C., Tripathi P., Thakur P., 2020, ApJ, 893, 142
- Chand et al. (2021) Chand S., Agrawal V. K., Dewangan G. C., Tripathi P., Thakur P., 2021, Journal of Astrophysics and Astronomy, 42, 38
- Chauhan et al. (2019) Chauhan J., et al., 2019, MNRAS, 488, L129
- Corbel et al. (2005) Corbel S., Kaaret P., Fender R. P., Tzioumis A. K., Tomsick J. A., Orosz J. A., 2005, ApJ, 632, 504
- Coriat et al. (2011) Coriat M., et al., 2011, MNRAS, 414, 677
- Dinçer (2017) Dinçer T., 2017, The Astronomer’s Telegram, 10716, 1
- Done et al. (2007) Done C., Gierliński M., Kubota A., 2007, A&A Rev., 15, 1
- Doxsey et al. (1977) Doxsey R., et al., 1977, IAU Circ., 3113, 2
- Ebisawa et al. (2003) Ebisawa K., Życki P., Kubota A., Mizuno T., Watarai K.-y., 2003, ApJ, 597, 780
- Evans et al. (2009) Evans P. A., et al., 2009, MNRAS, 397, 1177
- Fender et al. (2004) Fender R. P., Belloni T. M., Gallo E., 2004, MNRAS, 355, 1105
- Garg et al. (2022) Garg A., Misra R., Sen S., 2022, MNRAS, 514, 3285
- Gendreau et al. (2012) Gendreau K. C., Arzoumanian Z., Okajima T., 2012, in Takahashi T., Murray S. S., den Herder J.-W. A., eds, Society of Photo-Optical Instrumentation Engineers (SPIE) Conference Series Vol. 8443, Space Telescopes and Instrumentation 2012: Ultraviolet to Gamma Ray. p. 844313, doi:10.1117/12.926396
- Gendreau et al. (2016) Gendreau K. C., et al., 2016, in den Herder J.-W. A., Takahashi T., Bautz M., eds, Society of Photo-Optical Instrumentation Engineers (SPIE) Conference Series Vol. 9905, Space Telescopes and Instrumentation 2016: Ultraviolet to Gamma Ray. p. 99051H, doi:10.1117/12.2231304
- Gendreau et al. (2017) Gendreau K., et al., 2017, The Astronomer’s Telegram, 10768, 1
- Gilfanov (2010) Gilfanov M., 2010, X-Ray Emission from Black-Hole Binaries. Springer, p. 17, doi:10.1007/978-3-540-76937-8_2
- Grebenev et al. (2003) Grebenev S. A., Lutovinov A. A., Sunyaev R. A., 2003, The Astronomer’s Telegram, 189, 1
- Harikrishna & Sriram (2022) Harikrishna S., Sriram K., 2022, MNRAS, 516, 5148
- Homan et al. (2001) Homan J., Wijnands R., van der Klis M., Belloni T., van Paradijs J., Klein-Wolt M., Fender R., Méndez M., 2001, ApJS, 132, 377
- Homan et al. (2005) Homan J., Miller J. M., Wijnands R., van der Klis M., Belloni T., Steeghs D., Lewin W. H. G., 2005, ApJ, 623, 383
- Huang et al. (2018) Huang Y., et al., 2018, ApJ, 866, 122
- Ingram & Motta (2019) Ingram A. R., Motta S. E., 2019, New A Rev., 85, 101524
- Jin et al. (2017) Jin C., Ponti G., Belloni T., De Marco B., Rau A., Fender R., Munoz-Darias T., Coriat M., 2017, The Astronomer’s Telegram, 10751, 1
- Kalemci et al. (2006) Kalemci E., Tomsick J. A., Rothschild R. E., Pottschmidt K., Corbel S., Kaaret P., 2006, ApJ, 639, 340
- Kaluzienski & Holt (1977) Kaluzienski L. J., Holt S. S., 1977, IAU Circ., 3099, 3
- Kennea et al. (2017) Kennea J. A., Evans P. A., Beardmore A. P., Krimm H. A., Romano P., Yamaoka K., Serino M., Negoro H., 2017, The Astronomer’s Telegram, 10700, 1
- Lense & Thirring (1918) Lense J., Thirring H., 1918, Physikalische Zeitschrift, 19, 156
- Liu et al. (2021) Liu H., Ji L., Bambi C., Jain P., Misra R., Rawat D., Yadav J. S., Zhang Y., 2021, ApJ, 909, 63
- Markwardt & Swank (2003) Markwardt C. B., Swank J. H., 2003, The Astronomer’s Telegram, 133, 1
- Markwardt et al. (2017) Markwardt C. B., Burrows D. N., Cummings J. R., Kennea J. A., Marshall F. E., Page K. L., Palmer D. M., Siegel M. H., 2017, GRB Coordinates Network, 21788, 1
- Mastichiadis et al. (2022) Mastichiadis A., Petropoulou M., Kylafis N. D., 2022, A&A, 662, A118
- Mereminskiy et al. (2018) Mereminskiy I. A., Grebenev S. A., Prosvetov A. V., Semena A. N., 2018, Astronomy Letters, 44, 378
- Miller et al. (2018) Miller J. M., et al., 2018, ApJ, 860, L28
- Mineo et al. (2007) Mineo T., et al., 2007, arXiv preprint astro-ph/0701815
- Misra et al. (2020) Misra R., Rawat D., Yadav J. S., Jain P., 2020, ApJ, 889, L36
- Motta et al. (2014a) Motta S. E., Belloni T. M., Stella L., Muñoz-Darias T., Fender R., 2014a, MNRAS, 437, 2554
- Motta et al. (2014b) Motta S. E., Munoz-Darias T., Sanna A., Fender R., Belloni T., Stella L., 2014b, MNRAS, 439, L65
- Motta et al. (2015) Motta S. E., Casella P., Henze M., Muñoz-Darias T., Sanna A., Fender R., Belloni T., 2015, MNRAS, 447, 2059
- Motta et al. (2022) Motta S. E., Belloni T., Stella L., Pappas G., Casares J., Muñoz-Darias A. T., Torres M. A. P., Yanes-Rizo I. V., 2022, MNRAS,
- Negoro et al. (2017a) Negoro H., et al., 2017a, The Astronomer’s Telegram, 10699, 1
- Negoro et al. (2017b) Negoro H., et al., 2017b, The Astronomer’s Telegram, 10708, 1
- Neilsen et al. (2012) Neilsen J., Remillard R. A., Lee J. C., 2012, ApJ, 750, 71
- Novikov & Thorne (1973) Novikov I. D., Thorne K. S., 1973, in Black Holes (Les Astres Occlus). pp 343–450
- O’Neill et al. (2011) O’Neill S. M., Reynolds C. S., Miller M. C., Sorathia K. A., 2011, ApJ, 736, 107
- Özel et al. (2010) Özel F., Psaltis D., Narayan R., McClintock J. E., 2010, ApJ, 725, 1918
- Parmar et al. (2003) Parmar A. N., Kuulkers E., Oosterbroek T., Barr P., Much R., Orr A., Williams O. R., Winkler C., 2003, A&A, 411, L421
- Rawat et al. (2022) Rawat D., Misra R., Jain P., Yadav J. S., 2022, MNRAS, 511, 1841
- Rawat et al. (2023) Rawat D., et al., 2023, MNRAS, 520, 113
- Remillard & McClintock (2006) Remillard R. A., McClintock J. E., 2006, ARA&A, 44, 49
- Remillard et al. (2002) Remillard R. A., Sobczak G. J., Muno M. P., McClintock J. E., 2002, ApJ, 564, 962
- Russell et al. (2017) Russell T. D., Miller-Jones J. C. A., Sivakoff G. R., Tetarenko A. J., Jacpot Xrb Collaboration 2017, The Astronomer’s Telegram, 10711, 1
- Russell et al. (2019) Russell T. D., et al., 2019, ApJ, 883, 198
- Scaringi & ASTR211 Students (2017) Scaringi S., ASTR211 Students 2017, The Astronomer’s Telegram, 10702, 1
- Shakura & Sunyaev (1973) Shakura N. I., Sunyaev R. A., 1973, A&A, 24, 337
- Shang et al. (2019) Shang J. R., Debnath D., Chatterjee D., Jana A., Chakrabarti S. K., Chang H. K., Yap Y. X., Chiu C. L., 2019, ApJ, 875, 4
- Shaposhnikov & Titarchuk (2009) Shaposhnikov N., Titarchuk L., 2009, ApJ, 699, 453
- Shidatsu et al. (2014) Shidatsu M., et al., 2014, ApJ, 789, 100
- Shimura & Takahara (1995) Shimura T., Takahara F., 1995, ApJ, 445, 780
- Singh et al. (2017) Singh K. P., et al., 2017, Journal of Astrophysics and Astronomy, 38, 29
- Sreehari et al. (2019) Sreehari H., Ravishankar B. T., Iyer N., Agrawal V. K., Katoch T. B., Mandal S., Nandi A., 2019, MNRAS, 487, 928
- Sridhar et al. (2019) Sridhar N., Bhattacharyya S., Chandra S., Antia H. M., 2019, MNRAS, 487, 4221
- Steiner et al. (2012) Steiner J. F., McClintock J. E., Reid M. J., 2012, ApJ, 745, L7
- Stella & Vietri (1998) Stella L., Vietri M., 1998, ApJ, 492, L59
- Stella et al. (1999) Stella L., Vietri M., Morsink S. M., 1999, ApJ, 524, L63
- Stevens et al. (2018) Stevens A. L., et al., 2018, ApJ, 865, L15
- Stiele & Kong (2018) Stiele H., Kong A. K. H., 2018, ApJ, 868, 71
- Stiele & Kong (2021) Stiele H., Kong A. K. H., 2021, ApJ, 914, 93
- Stiele & Yu (2016) Stiele H., Yu W., 2016, MNRAS, 460, 1946
- Tao et al. (2018) Tao L., et al., 2018, MNRAS, 480, 4443
- Tomsick & Kalemci (2003) Tomsick J. A., Kalemci E., 2003, The Astronomer’s Telegram, 198, 1
- Wang et al. (2022) Wang P. J., et al., 2022, MNRAS, 512, 4541
- Wijnands et al. (1999) Wijnands R., Homan J., van der Klis M., 1999, ApJ, 526, L33
- Williams et al. (2020) Williams D. R. A., et al., 2020, MNRAS, 491, L29
- Xu et al. (2018) Xu Y., et al., 2018, ApJ, 852, L34
- Yadav et al. (2016) Yadav J. S., et al., 2016, in Space Telescopes and Instrumentation 2016: Ultraviolet to Gamma Ray. p. 99051D, doi:10.1117/12.2231857
- Zdziarski et al. (2020) Zdziarski A. A., Szanecki M., Poutanen J., Gierliński M., Biernacki P., 2020, MNRAS, 492, 5234
- Zhang et al. (2022) Zhang Y., et al., 2022, MNRAS, 512, 2686
- van der Klis & Jansen (1985) van der Klis M., Jansen F. A., 1985, Nature, 313, 768
Appendix A
In this Appendix, we show the dynamic frequency vs inner disk radii plot for three black hole masses, 10 , 20 , and 30 (Figure A.7).